Abstract
We study the Rabi flopping of the population between the ground and excited 2p states of the hydrogen atom, induced by intense short laser pulses of different shapes and of carrier frequency a.u. which resonantly couples the two states, and manifestations of this dynamics in the energy spectra of photoelectrons produced in the subsequent ionization of the atom from the excited state. It is found that, for Gaussian, half-Gaussian and rectangular pulses, characterized by the same pulse area, the final populations take the same values and the spectra consist of similar patterns having the same number of peaks and approximately the same separation between the prominent edge (Autler–Townes) peaks. The additional analysis in terms of dressed states showed that the mechanism of formation of multiple-peak structures during the photoionization process is the same regardless of the pulse shape. These facts disprove the hypothesis proposed in earlier studies with Gaussian pulse, that the multiple-peak pattern appears due to dynamic interference of the photoelectrons emitted with a time delay at the rising and falling sides of the pulse, since the hypothesis is not applicable to either a half-Gaussian pulse that has no rising part or a rectangular pulse whose intensity is constant.
1. Introduction
If an atom, initially being in its ground state, interacts with an alternating field that resonantly couples this state to an excited state, the population will be periodically transferred from one state to another. This effect was first described theoretically by Rabi, who applied it for fermions in rotating magnetic fields [1]. In general, the flopping of the population can be explained by the fact that the eigenstates of the Hamiltonian describing the bare atom are no longer stationary states if the atom interacts with the field. Another consequence of this fact is the splitting of the coupled atomic states into doublets of “dressed states”, whose quasi-energies are separated by the value corresponding to the frequency of Rabi flopping (see, e.g., Ref. [2]). This splitting can be observed in the photoabsorption and photoionization spectra of atoms and molecules. Before the availability of coherent light sources, it was first detected using radiation from the radio frequency domain. In the original observation by Autler and Townes [3], a radio frequency source tuned to the separation between two doublet microwave absorption lines of the OCS molecule was used.
Despite theoretical predictions to observe Rabi dynamics at short wavelengths [4,5] and the availability of intense XUV light sources for more than a decade, direct observation of Rabi dynamics at such short wavelengths has been reported only recently [6]. In the actual experiment, applying intense XUV laser pulses from a free-electron laser with high temporal and spatial coherence, one-photon Rabi oscillations are induced between the ground state and an excited state in helium atoms (pump). Then, a second (probe) photon from the same pulse ionizes the atom from the excited state (resonant two-photon ionization) or, at higher intensities, two photons can do it from the ground state (nonresonant two-photon ionization). In both cases, the emitted photoelectrons coherently probe the underlying dynamics and the measured signal reveals an Autler–Townes (AT) doublet.
In the above experiment, the AT doublets were built at the resonant two-photon ionization for 1.5 completed Rabi cycles. However, theoretical analysis of the resonant multiphoton ionization for more than two completed Rabi cycles during the pulse predicts the appearance of a multiple-peak pattern in the photoelectron energy spectrum (PES) [7,8,9,10]. The number of peaks appearing in the pattern is essentially determined by the pulse area [7]. The area theorem (see Ref. [11] and references therein) actually, relates this quantity to the number of Rabi cycles during the pulse, but numerical calculations have shown that this number, the number of peaks in the radial density of photoelectrons and the number of peaks in the pattern coincide [9]. The coincidence between the first two numbers is easily explained by the propagation of the emitted bunches of photoelectrons, which are separated in time and, thus, separated in space, too. On the other hand, the explanation for the multiple-peak pattern in the spectrum is still under consideration. There is a general agreement that this pattern is a result of the superposition of the contributions of photoelectrons ejected via two dressed states during the pulse action. The situation is simplest in the case of photoionization by a rectangular pulse, where the two contributions have the forms of cardinal sine (sinc) functions of energy, shifted by the value of the corresponding Rabi frequency, and the multiple-peak pattern is a result of their overlap [7] (see also Section 3.3). Conversely, in the case of smooth pulses such as the Gaussian, it is not clear exactly what is happening. The analysis performed within the stationary phase approximation suggested that dynamic interference of the photoelectrons emitted with the same energy, but with a time delay at the rising and falling sides of the pulse, essentially determines the multiple-peak structure (modulations) in the PES [8,12,13]. However, this assumption has been questioned by analyzing the conditions for dynamic interference [14,15], where it was found that they are not always fulfilled, particularly in the case of photoionization from the hydrogen ground state.
To shed more light on the above issue, in this paper we investigate manifestations of Rabi dynamics in the photoelectron energy spectra calculated for resonant two-photon ionization of the hydrogen atom by intense short laser pulses of three different forms—Gaussian, half-Gaussian and rectangular ones. By choosing the carrier frequency of 0.375 a.u. that resonantly couples the hydrogen ground (1s) and excited 2p states, the pulse induces one-photon Rabi oscillations between these states, and a second photon from the same pulse subsequently ionizes the atom from the 2p state. The problem was previously studied by other authors, who also used different forms of the laser pulse (see Refs. [4,5,7,8,9]), but conditions for the dynamic interference were not considered. The paper is organized in the following way. In the next section, we briefly describe the computational method for calculating the populations of atomic states and the photoelectron energy spectra, based on the three-level model, and present results for resonant two-photon ionization of hydrogen by intense short laser pulses. In Section 3 we analyze the Rabi dynamics and the AT patterns in the spectra in terms of dressed states. A summary and conclusions are given in Section 4.
2. Calculation of Populations of Atomic States and Photoelectron Energy Spectra
The populations of atomic states during the interaction of the atom with the laser pulse, including their final values when the pulse has expired, and the photoelectron energy spectra were obtained by solving the time-dependent Schrödinger equation (in atomic units)
Here is the non-stationary atomic state at time t, is the Hamiltonian of the field-free (bare) atom, is the electric field component of the laser pulse and z is the projection of the electron–nucleus distance in the field direction. The term describes the atom-field interaction in the dipole approximation using the length gauge. We consider a linearly polarized laser pulse, whose electric field component reads
where is the peak value of the field strength, is the laser carrier frequency, and the function determines the shape of the pulse envelope.
Below, we solve Equation (1), assuming that the atom is initially in its ground state, i.e., , where is a time before the beginning of the interaction. Since the atom interacting with the field (2) has axial symmetry, the z-projection of the electron angular momentum is a constant of motion and the magnetic quantum number m is a good quantum number for any field strength. Thus, the state is at any time t characterized by the value , which characterizes the ground state of the bare atom. Unless otherwise stated, atomic units (a.u.) are used throughout the paper.
2.1. The Three-Level Model
In the case of photoionization which goes via resonant or near-resonant excitation of an intermediate state, which here is 2p, the other excited states are nonessential and at weak fields the process can be adequately described within the three-level model. A computational method for solving Equation (1) within this model is presented in our recent paper [16], and in more detail in Ref. [8]. Here, we give only the basic expressions and the final set of relevant equations.
The atomic state at time t within the three-level model reads
where , and are the time-dependent amplitudes for the population of the ground state , intermediate state and continuum states (), respectively. The variables and l label the kinetic energy and orbital momentum of produced photoelectrons. The states and have been multiplied with the phase factors and in order to simplify the set of equations for the amplitudes.
If we set the ground state energy to zero, by inserting Equation (3) in the Schrödinger Equation (1) and applying the rotating wave approximation [2] and the local approximation [8,17], we obtain the set of equations for the amplitudes
where is the frequency of Rabi flopping between the populations of states 1s and 2p at the peak value of laser intensity, is the ionization rate of the intermediate (near-)resonant state 2p and is the scaled amplitude for the population of continuum states. Here, and are the dipole transition matrix elements for the excitation of the 2p state and for its subsequent ionization, respectively, and . For a given carrier frequency of the laser pulse , the expected energy of photoelectrons is , where eV is the ionization potential of the hydrogen atom. Note that, by taking , the energies of the 2p and final continuum states are eV and , respectively. Finally, let us state that the formal solution of the third of Equation (4) is
The quantities and can be interpreted, respectively, as the populations of atomic states and after the interaction of the atom with the laser field until time t. Thus, the populations of these states, after time when we assume that the laser pulse has expired, are and . Analogously, the quantities and represent the probability densities of finding the atomic electron in the continuum state (here ) after the interaction of the atom with the laser field until time t and after the pulse has expired, respectively. Since the photoelectron yield at a given energy is proportional to the total probability density of finding the electron in continuum states corresponding to this energy, the PES is adequately represented by the distribution
The values of the dipole matrix elements for transitions from the 1s to the 2p state and from the 2p state to continuum states are determined applying expressions given in Appendix A in Ref. [16]. The matrix element for the transition is a.u., while the values of are shown in Figure 2 in the same reference. The resonant excitation of the 2p state and the subsequent ionization occurs if the laser carrier frequency is , which coincides with the transition frequency between the 1s and 2p states (in the weak field limit). The photon energy corresponding to this frequency is 10.204 eV, and the expected kinetic energy of the ejected electrons is eV. In this case, one has a.u. [16]. We will see later that the approximate results obtained using the three-level model, in which the exact values for are replaced by the value of , as used in previous studies [8], are sufficient for a qualitative analysis of spectra.
2.2. Results
The populations of atomic states and the photoelectron energy spectra of the hydrogen atom exposed to the laser pulse of carrier frequency a.u. have been calculated using the described method for three pulse shapes: (a) the Gaussian shape
with fs, (b) the half-Gaussian shape
with fs, and (c) the rectangular shape
with fs. The parameters , and are chosen so that for a given value of all three pulses have the same value of the pulse area [7]
which here is . For times when the pulses (7)–(9) expire, we take , and , respectively. Let us state at this point that, referring to the area theorem [7,11], the number of Rabi cycles completed during the pulse is .
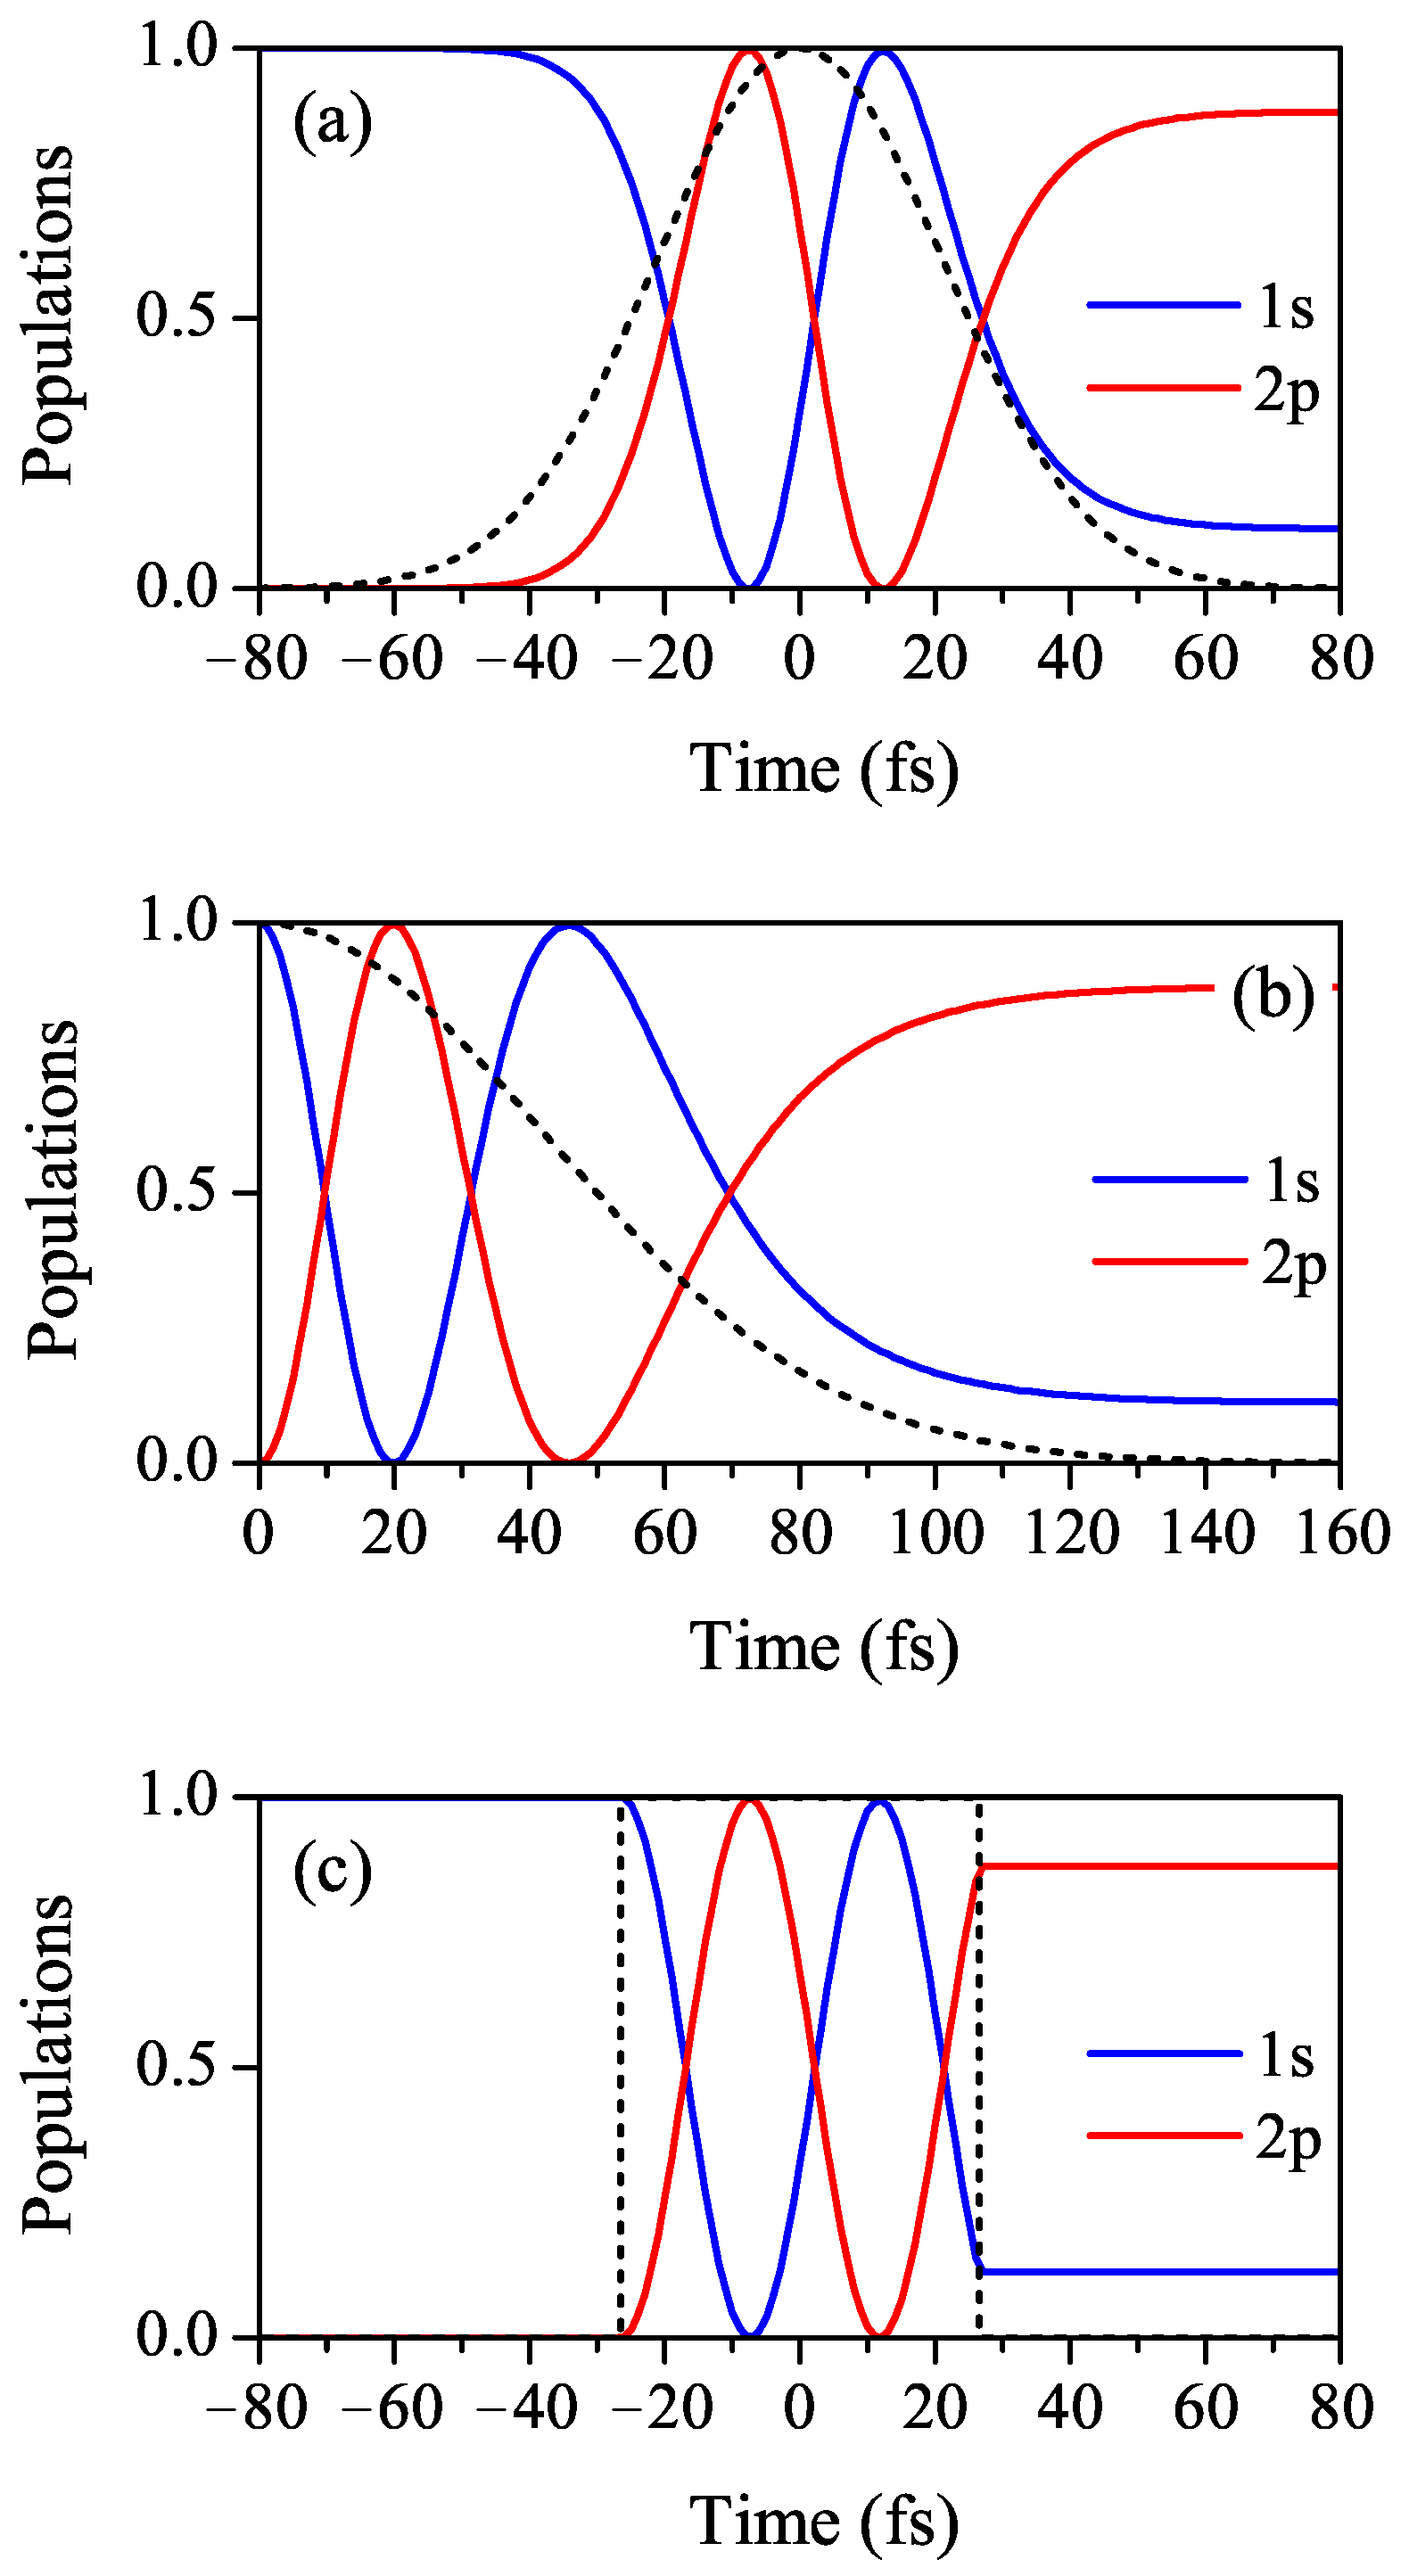
Figure 1 shows the evolution of the populations of states 1s and 2p, calculated for pulses of the above three shapes and peak intensity TW/cm (, ) for which the pulse area is and . One can see that, although the evolution is different, in accordance with the area theorem [11] the final populations for all three pulses (after they have expired) take the same values.
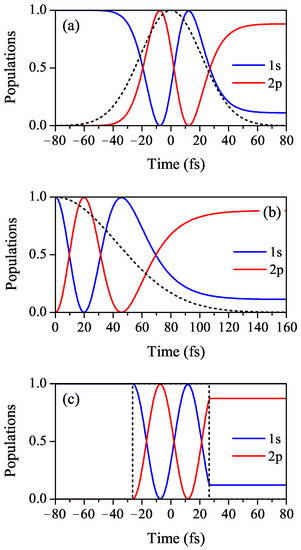
Figure 1.
(Color online) The evolution of populations of the ground state (1s) and the excited 2p state during the process of resonant two-photon ionization of hydrogen by: (a) Gaussian laser pulse (7) with fs, (b) half-Gaussian pulse (8) with fs and (c) rectangular pulse (9) with fs, all of carrier frequency , which is resonant for transition 1s → 2p and peak intensity of 1 TW/cm. The dashed lines represent the envelopes of the laser pulses. The parameters , and are chosen so that all three pulses have the same value of the pulse area , for which the populations perform approximately 1.4 Rabi cycles.
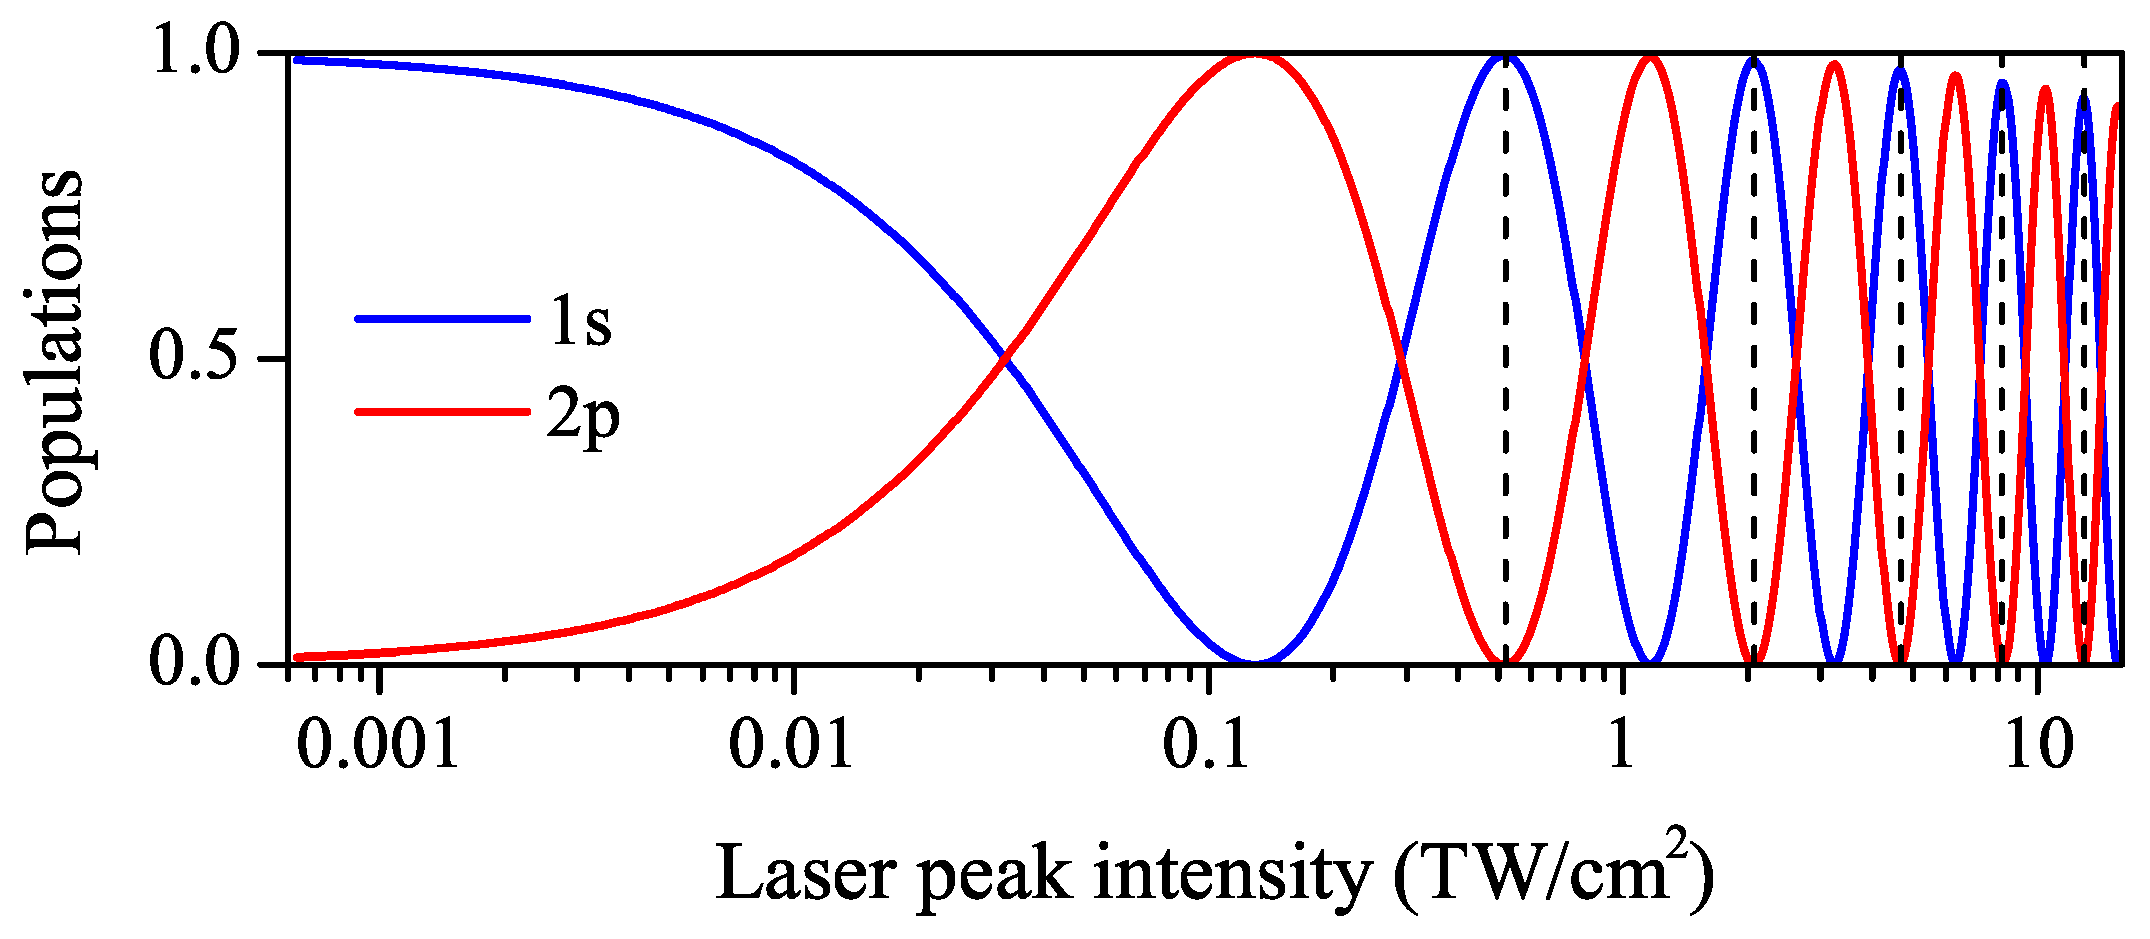
Figure 2 shows the final populations of the states 1s and 2p as functions of in the domain of – W/cm. Again, in agreement with the area theorem, for each peak intensity the final populations of atomic states for the considered three pulses have the same values. Due to this fact, the blue and red lines in Figure 2 represent the populations of the ground and excited states, respectively, obtained for all three pulse shapes. The vertical dashed lines indicate the peak intensities at which an integer number of Rabi cycles during the pulse is completed: TW/cm for , respectively.
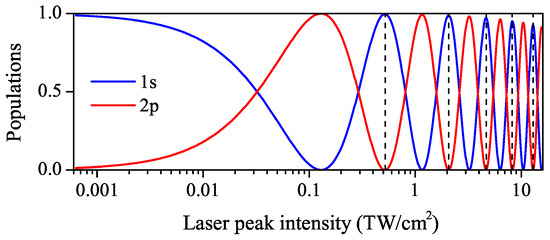
Figure 2.
(Color online) Final populations of the ground state (1s) and the excited 2p state of hydrogen at the end of the process of its resonant two-photon ionization, as functions of the laser peak intensity. The results obtained using the Gaussian, half-Gaussian and rectangular pulses (Equations (7)–(9)) of carrier frequency with fs, fs and fs practically coincide and they are represented by common lines. The vertical dashed lines indicate the peak intensities at which an integer number of Rabi cycles during the pulse is completed.
Figure 3 shows the photoelectron energy spectra determined by solving the set of Equation (4) and applying Equation (6) with exact values (solid red lines) and with (dashed lines) for: (a) Gaussian pulse (7), (b) half-Gaussian pulse (8) and (c) rectangular pulse (9), with the peak intensities , . Note that the spectra obtained using the approximate value are symmetric, but this is not the case when the exact values for are used. The observed asymmetry, which is more pronounced at higher laser field intensities, has recently been studied in several publications [9,16,18]. For each value of , the PES consist of a pattern exhibiting the AT splitting. The separation between the most prominent edge peaks (AT doublet) increases with the square root of , i.e., linearly with the peak value of electric field strength. In addition, for the laser peak intensities when more than two Rabi cycles during the pulse are completed, our results confirm the previously reported appearance of a multiple-peak pattern in the calculated PES [7,8,9,10].

Figure 3.
(Color online) Photoelectron energy spectra calculated using the three-level model (Equations (4)–(6)) with exact values of (solid orange lines) and with the approximation (dashed lines) for: (a) Gaussian pulse (7), (b) half-Gaussian pulse (8) and (c) rectangular pulse (9), all of carrier frequency and the peak intensities marked in Figure 2 by vertical dashed lines. Black dots mark the real parts of , whose separation (≈) estimates the splitting of the resonant peak.
Demekhin and Cederbaum [8] analyzed the multiple-peak patterns in the PES obtained for the photoionization with the Gaussian pulse. They attributed the appearance of modulations inside the AT doublets to the dynamic interference of two photoelectron waves with the same kinetic energy emitted at two different times during the pulse—at the time when the pulse is growing and at the time when it decreases. Our calculations, however, show that similar modulations also exist in the case of photoionization with the half-Gaussian pulse, that has no growing part, as well as at the photoionization with the rectangular pulse, whose intensity is constant. Thus, we conclude that the dynamic interference cannot be the principal reason for the modulations in the calculated spectra. This conclusion is supported by the analysis of the conditions for dynamic interference [14,15], where it was found that they are not fulfilled in the case of resonant photoionization via the 2p state (see Figure 3c in Ref. [14]).
3. Analysis of the AT Patterns in Terms of Dressed States
3.1. Dynamics of the Ground and Intermediate States
As the amplitude does not appear in the first two of Equation (4), the dynamics of the 1s and 2p states within the three-level model is formally decoupled from the dynamics of continuum states. The equations for these two states can be written in the matrix form
This matrix equation represents the time-dependent Schrödinger equation that describes the resonantly coupled dynamics of the 1s and 2p states in the basis of the same states in the interaction picture [19]. Using Dirac’s formalism, this equation reads
where is the bound part of the state (3) in the interaction picture and is the interaction Hamiltonian, whose representations in the actual basis are
Since the interaction picture hides the time dependence related to the unperturbed Hamiltonian , the amplitudes , and the Hamiltonian are slowly varying quantities. By diagonalizing this Hamiltonian, one obtains two slowly varying complex eigenenergies (quasi-energies)
which correspond to dressed states
The approximate expressions are applicable if , which is fulfilled if the pulses are not of excessive intensity. Using inverse relations , , the state can be written in the form
where
Note that, due to the presence of an imaginary part in , the dressed states are decaying, i.e., they are two decoupled resonances. The real parts of the quasi-energies move adiabatically apart as the pulse arrives, and towards each other as the pulse expires. More precisely, according to Equation (15), their distance evolves as .
3.2. Dynamics of Continuum States
By inserting Equation (17) into Equation (12) and applying the eigenvalue problem , one obtains equation , which can be solved analytically. Employing the initial conditions , we find
where .
From Equation (18), it follows that , which by substitution in Equation (5) gives
Finally, using Equation (6), we obtain
where are the phases of two oscillatory functions in the integrand. This formula gives exactly the same results as Equations (4)–(6), some of them shown in Figure 3, but it provides a deeper insight into the multiple peak structure of the PES.
The AT splitting of the resonant peak in the PES can be roughly estimated from the maximum distance between quasi-energies (15)
where are the positions of the AT doublet peaks in the PES and is the maximum value of the envelope (usually ).
Figure 4 shows the time evolution of the photoelectron energy distribution, represented by using Equation (20), during the photoionization process of the hydrogen atom by: (a) Gaussian pulse (7), (b) half-Gaussian pulse (8) and (c) rectangular pulse (9), all of them having the carrier frequency of and the peak intensity of 12.917 TW/cm, which leads to five Rabi cycles completed at the end of the pulse (). In all three cases, the number of Rabi cycles performed up to a given instant of time coincides with the number of peaks in the energy distribution at that instant. Thus, the mechanism of formation of a structure with multiple peaks is the same regardless of the shape of the pulse and, therefore, it cannot be dynamic interference of two photoelectron waves emitted during the rising and falling part of the pulse. The appearance of a multiple-peak pattern in the case of rectangular pulse, where an analytical solution is possible, is analyzed in the next subsection.

Figure 4.
(Color online) Time evolution of the photoelectron energy distribution (in arbitrary units) during the photoionization process of the hydrogen atom by: (a) Gaussian pulse (7), (b) half-Gaussian pulse (8) and (c) rectangular pulse (9) of carrier frequency and peak intensity of 12.917 TW/cm at which the atom completes five Rabi cycles during the pulse.
3.3. Analytical Solution for Rectangular Pulse
The limits of the integral in Equation (21) for the rectangular pulse (9) are reduced to interval , in which and , so that this integral can be solved analytically. Furthermore, since the ionization rate for the laser peak intensities considered here (up to 13 TW/cm) is small ( a.u.), it can be neglected and the expression for energy distribution of photoelectrons to a good approximation becomes
where . The positions of the two main peaks of this distribution are very close to the positions of the main peaks of partial distributions
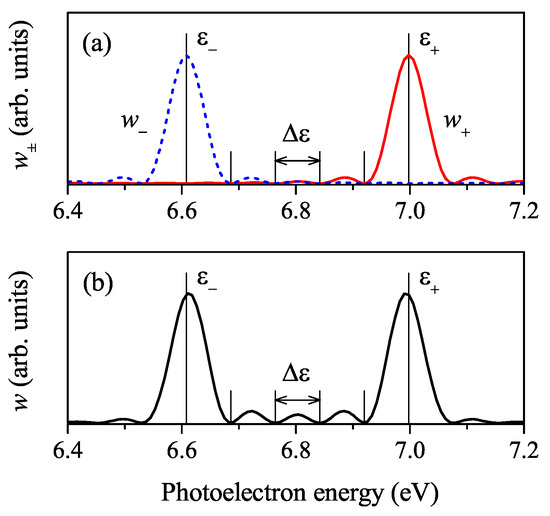
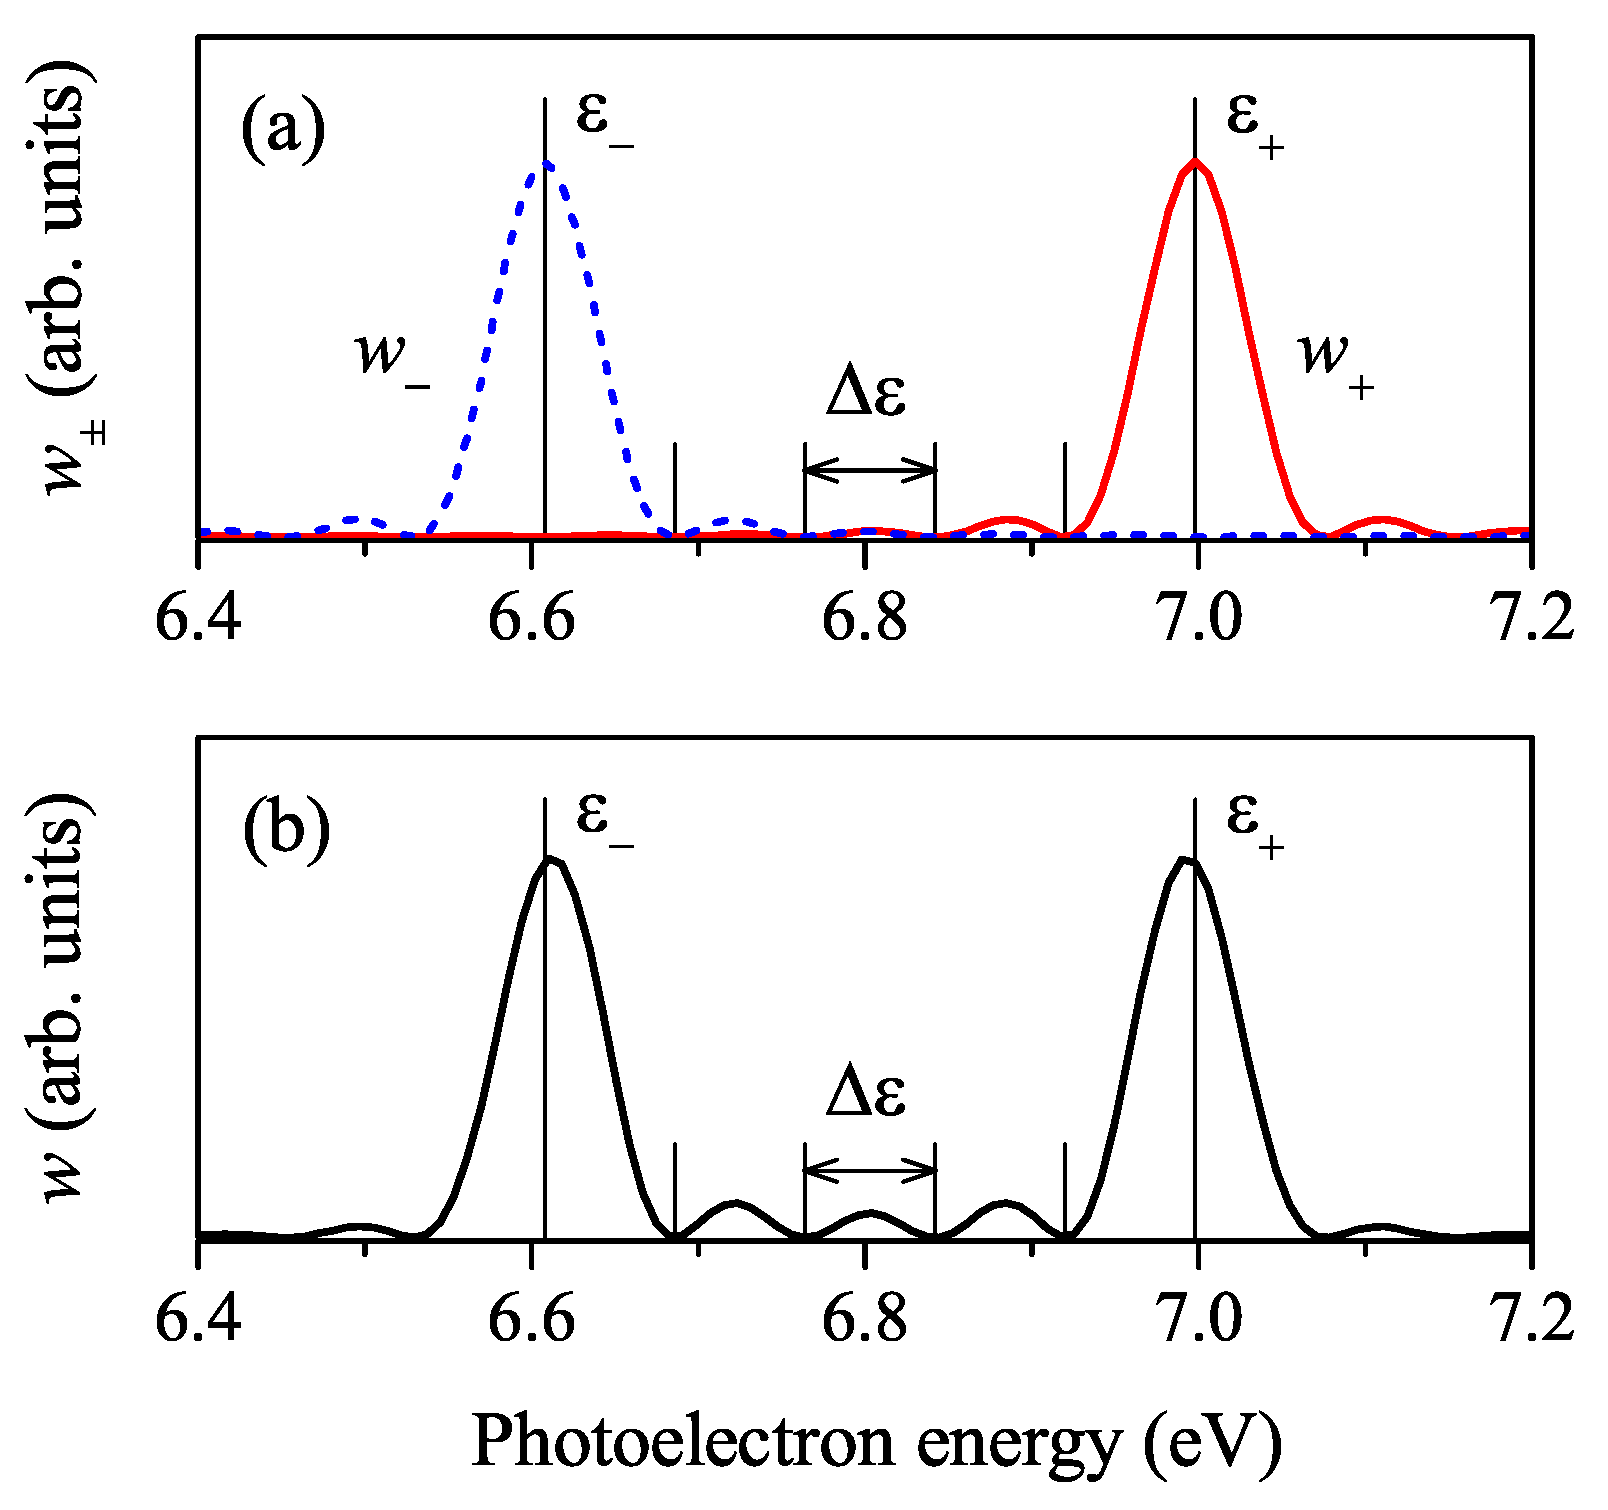
whose values are . Since the zeros of functions are , where k are integers, and in agreement with the area theorem , where N is the number of Rabi cycles during the pulse, the separation of two adjacent zeros is . Thus, in the interval , whose length here is , there are exactly zeros and N peaks (see Figure 5 for ). The latter explains the coincidence between the number of Rabi cycles during the pulse and the number of peaks in the AT pattern in PES. Obviously, local peaks in distribution (23) also exist in partial distributions (24), i.e., they are not a product of dynamic interference.
4. Summary and Conclusions
In this paper, we studied the Rabi flopping of the population between the ground (1s) and excited 2p states of the hydrogen atom, induced by intense short laser pulses of different shapes and of carrier frequency a.u., which resonantly couples these states, and manifestations of these dynamics in the energy spectra of photoelectrons produced in the subsequent ionization of the atom from its periodically populated/depopulated 2p state. Manifestations of the Rabi dynamics in the spectra are the AT splitting and multiple-peak structure of the AT pattern. The populations of states and spectra were calculated for three different pulse shapes—Gaussian, half-Gaussian and rectangular ones, whose pulse durations were tuned so that, for a given laser peak intensity, their pulse areas have the same value. It was found that, for these pulses, in accordance with the area theorem, the final populations (once the pulses have expired) are the same, and the spectra have similar forms in that they consist of AT patterns with the same number of peaks and with approximately the same separation between the prominent edge (AT) peaks. These facts essentially disprove the assumption that the multiple-peak pattern appears due to dynamic interference of the photoelectrons emitted with the same energy, but with a time delay at the rising and falling sides of the pulse [8,12,13], for the simple reason that a half-Gaussian pulse has no rising part, while the intensity of a rectangular pulse is constant. This conclusion is in agreement with the analysis of the conditions for dynamic interference [14,15], where it was found that they are not fulfilled in the case of resonant photoionization via the 2p state.
The additional analysis in terms of dressed states provided deeper insight into the structure of obtained spectra. This approach implies that the ionization occurs via dressed states, which directly explains the appearance of AT doublets in the PES. Here, the formula for the energy distribution of photoelectrons has the form of the time integral of the sum of two terms with different phase factors corresponding to two dressed states. In the case of rectangular pulse, this integral is analytically solvable and is reduced to the sum of two contributions that have the forms of sinc functions of energy, shifted by the value of the corresponding Rabi frequency. Then, the multiple-peak pattern is simply the result of their overlapping, which explains the matching of the number of completed Rabi oscillations with the number of peaks in the AT pattern. Analysis of the time evolution of the photoelectron energy distribution during the photoionization process showed that the mechanism of formation of multiple-peak structures is the same regardless of the pulse shape and is, therefore, not related to dynamic interference.
Author Contributions
Conceptualization, N.S.S.; methodology, N.S.S.; software, N.S.S. and A.B.; formal analysis, N.S.S., D.B.P. and A.B.; investigation, N.S.S. and D.B.P.; writing—original draft preparation, N.S.S.; writing—review and editing, N.S.S., D.B.P. and A.B. All authors have read and agreed to the published version of the manuscript.
Funding
This research received no external funding.
Data Availability Statement
All the data reported in this work are available from the correspondence author on reasonable request.
Acknowledgments
This work was supported by the COST Action No. CM18222 (AttoChem).
Conflicts of Interest
The authors declare no conflict of interest.
Abbreviations
The following abbreviations are used in this manuscript:
| XUV | extreme ultraviolet |
| AT | Autler–Townes |
| PES | photoelectron energy spectrum |
References
- Rabi, I.I. Space Quantization in a Gyrating Magnetic Field. Phys. Rev. 1937, 51, 652. [Google Scholar] [CrossRef]
- Steck, D.A. Quantum and Atom Optics. Revision 0.13.4. Available online: Http://steck.us/teaching (accessed on 24 September 2020).
- Autler, S.H.; Townes, C.H. Stark Effect in Rapidly Varying Fields. Phys. Rev. 1955, 100, 703. [Google Scholar] [CrossRef]
- LaGattuta, K.J. Above-threshold ionization of atomic hydrogen via resonant intermediate states. Phys. Rev. A 1993, 47, 1560–1563. [Google Scholar] [CrossRef] [PubMed]
- Girju, M.G.; Hristov, K.; Kidun, O.; Bauer, D. Nonperturbative resonant strong field ionization of atomic hydrogen. J. Phys. B 2007, 40, 4165. [Google Scholar] [CrossRef]
- Nandi, S.; Olofsson, E.; Bertolino, M.; Carlström, S.; Zapata, F.; Busto, D.; Callegari, C.; Di Fraia, M.; Eng-Johnsson, P.; Feifel, R.; et al. Observation of Rabi dynamics with a short-wavelength free-electron laser. Nature 2022, 608, 488. [Google Scholar] [CrossRef] [PubMed]
- Rogus, D.; Lewenstein, M. Resonant ionisation by smooth laser pulses. J. Phys. B 1986, 19, 3051–3059. [Google Scholar] [CrossRef]
- Demekhin, P.V.; Cederbaum, P.V. Coherent intense resonant laser pulses lead to interference in the time domain seen in the spectrum of the emitted particles. Phys. Rev. A 2012, 86, 063412. [Google Scholar] [CrossRef]
- Müller, A.D.; Kutscher, E.; Artemyev, A.N.; Cederbaum, L.S.; Demekhin, P.V. Dynamic interference in the resonance-enhanced multiphoton ionization of hydrogen atoms by short and intense laser pulses. Chem. Phys. 2018, 509, 145. [Google Scholar] [CrossRef]
- Tóth, A.; Csehi, A. Probing strong-field two-photon transitions through dynamic interference. J. Phys. B At. Mol. Opt. Phys. 2021, 54, 035005. [Google Scholar] [CrossRef]
- Fischer, K.A.; Hanschke, L.; Kremser, M.; Finley, J.J.; Müller, K.; Vučković, J. Pulsed Rabi oscillations in quantum two-level systems: Beyond the area theorem. Quantum Sci. Technol. 2018, 3, 014006. [Google Scholar] [CrossRef]
- Demekhin, P.V.; Cederbaum, L.S. Dynamic Interference of Photoelectrons Produced by High-Frequency Laser Pulses. Phys. Rev. Lett. 2012, 108, 253001. [Google Scholar] [CrossRef] [PubMed]
- Demekhin, P.V.; Cederbaum, L.S. ac Stark effect in the electronic continuum and its impact on the photoionization of atoms by coherent intense short high-frequency laser pulses. Phys. Rev. A 2013, 88, 043414. [Google Scholar] [CrossRef]
- Baghery, M.; Saalmann, U.; Rost, J.M. Essential Conditions for Dynamic Interference. Phys. Rev. Lett. 2017, 118, 143202. [Google Scholar] [CrossRef] [PubMed]
- Jiang, W.C.; Burgdörfer, J. Dynamic interference as signature of atomic stabilization. J. Opt. Express 2018, 26, 19921. [Google Scholar] [CrossRef] [PubMed]
- Bunjac, A.; Popović, D.B.; Simonović, N.S. Analysis of the asymmetry of Autler-Townes doublets in the energy spectra of photoelectrons produced at two-photon ionization of atoms by strong laser pulses. Eur. Phys. J. D 2022, 76, 249. [Google Scholar] [CrossRef]
- Demekhin, P.V.; Cederbaum, L.S. Strong interference effects in the resonant Auger decay of atoms induced by intense X-ray fields. Phys. Rev. A 2011, 83, 023422. [Google Scholar] [CrossRef]
- Zhang, X.; Zhou, Y.; Liao, Y.; Chen, Y.; Liang, J.; Ke, Q.; Li, M.; Csehi, A.; Lu, P. Effect of nonresonant states in near-resonant two-photon ionization of hydrogen. Phys. Rev. A 2022, 106, 063114. [Google Scholar] [CrossRef]
- Meystre, P.; Sargent, M., III. Elements of Quantum Optics, 4th ed.; Springer: Berlin, Germany, 2007. [Google Scholar]
Disclaimer/Publisher’s Note: The statements, opinions and data contained in all publications are solely those of the individual author(s) and contributor(s) and not of MDPI and/or the editor(s). MDPI and/or the editor(s) disclaim responsibility for any injury to people or property resulting from any ideas, methods, instructions or products referred to in the content. |
© 2023 by the authors. Licensee MDPI, Basel, Switzerland. This article is an open access article distributed under the terms and conditions of the Creative Commons Attribution (CC BY) license (https://creativecommons.org/licenses/by/4.0/).

