Article

Tuning the Nonlinear Optical Properties of Quantum Dot by Noise-Anharmonicity Interaction

1
Department of Chemistry, Abhedananda Mahavidyalaya, Sainthia, Birbhum 731234, West Bengal, India
2
Department of Chemistry, Physical Chemistry Section, Visva-Bharati University, Santiniketan, Birbhum 731235, West Bengal, India
3
Eklavya Model Residential School, Kanksa, West Burdwan 713148, West Bengal, India
*
Author to whom correspondence should be addressed.
Atoms 2022, 10(4), 122; https://doi.org/10.3390/atoms10040122
Submission received: 28 September 2022 / Revised: 17 October 2022 / Accepted: 19 October 2022 / Published: 25 October 2022
(This article belongs to the Special Issue Quantum Dynamics of Matter in Tailored Intense Fields)

Abstract

:
Current inspection rigorously explores the tuning of a few relevant nonlinear optical (NLO)properties of GaAs quantum dot (QD) under the stewardship of Gaussian noise-anharmonicity interplay. The NLO properties explored are total optical absorption coefficient (TOAC), total optical refractive index change (TORIC), nonlinear optical rectification (NOR), second harmonic generation (SHG), third harmonic generation (THG), DC-Kerr effect (DCKE), electro-absorption coefficient (EAC), group index (GI)and optical gain (OG). The route of application of noise (additive/multiplicative) to the QD, as well as the symmetry (odd/even) of the anharmonicity, influence the aforesaid NLO properties. These NLO properties exhibit steadfast growth, steadfast fall, maximization, minimization and saturation. The outcomes of the inspection appear to be quite pertinent in the context of the immense technological demand of QD, taking into account the combined impact of anharmonicity and noise.

1. Introduction

The smallest component of a large group of materials called low-dimensional semiconductor systems (LDSS) is Quantum dot (QD). QD has dimension in the nanometer region. Advanced and sophisticated fabrication technologies have made it possible to fabricate QDs of various shapes and size. The small size and extremely large confinement of QDs are responsible for their enhanced NLO properties in comparison with bulk substances. In addition to this, QDs also deem profound importance for exhibiting fascinating properties like tunability, broad color spectrum etc. On the whole, LDSS have found extensive applications in microelectronics and optoelectronics thereby inviting a plethora of research works on them [1,2] with special attention on their NLO properties [1,3,4,5,6,7].
The presence of anharmonic potential in QD modifies its effective confinement potential (ECP)to a great extent, which is revealed through noticeable alteration of its NLO properties. In consequence, the presence of anharmonic potential significantly affects the device performance and, thus, possesses profound technological importance. Thus, in the field of microelectronics and optoelectronics the importance of anharmonicity becomes unquestionable. In addition, the symmetry (odd/even) of the anharmonicity plays a crucial role in harnessing the NLO properties of LDSS. For QDs having circular or parabolic confinement and involving a lone carrier, the quadratic hyperpolarizability disappears owing to symmetry. However, if a parity breaking (symmetry destroying) anharmonicity exists inside the QD confinement potential one may expect generation of considerable non-zero quadratic hyperpolarizability. Furthermore, a gradual change in the magnitude of the anharmonicity can also influence the NLO properties. Heitman et al., as an experimental study, explored the influence of anharmonicity present in the QD confinement potential [8].
In the present work we strive to analyze the impact of the noise-anharmonicity inter-action over a few NLO responses of QD, which include the total optical absorption coefficient (TOAC), the total optical refractive index change (TORIC), the nonlinear optical rectification (NOR), the second harmonic generation (SHG), the third harmonic generation (THG), the DC-Kerr effect (DCKE), the electro-absorption coefficient (EAC), the group index (GI) and the optical gain (OG).
Present enquiry invokes Gaussian white noise (GWN) that has been applied to the system via two distinct paths (modes) called additive and multiplicative. These two paths give rise to diverse extents of system-noise interactions and seem to affect the NLO properties in diverse manners from that under the noise-free ambience. The work considers a 2-d QD (GaAs) containing one electron, which is compelled by a lateral parabolic confinement potential to move only on the x–y plane. The system is also exposed to a perpendicular magnetic field (B). Furthermore, the QD confinement potential has been considered to contain anharmonicity of different symmetries (odd and even). In one of our recent studies we have observed the role of noise-anharmonicity interplay on a few physical properties of QD excluding the NLO properties [9]. In another study we have explored the role of similar interplay on some NLO properties, which are different from those examined in the present work [10]. The present study primarily focuses on how the interplay between anharmonicity and noise can produce diverse features in the profiles of above NLO properties. The study unveils how the NLO properties of QD can be finetuned by the subtle and delicate interaction between noise (including its mode of entry to the system) and anharmonicity (involving its parity). The findings of the investigation may have crucial bearings so far as the applicabilities of QD systems are concerned from a technological perspective.

2. Method

The Hamiltonian of the system includes the spatially δ-correlated GWN (additive/multiplicative), anharmonic potential (odd/even) and electric field of amplitude F applied in x and y-directions and is given by:
H 0 = H 0 + V a n h + e F x + y + ξ x , y
H 0   , under effective mass approximation, stands for the Hamiltonian without anharmonicity and contains the lateral parabolic confinement V x , y = 1 2 m * ω 0 2 x 2 + y 2 . ω0 and m* denote the harmonic confinement frequency and the effective mass of the electron, respectively. H 0   reads:
H 0 = 1 2 m * i ћ + e c A 2 + 1 2 m * ω 0 2 x 2 + y 2
The contribution of the orthogonal magnetic field (B) appears through the relation ωc = e B m * c where ωc is the cyclotron frequency. Present calculation uses Landau gauge [A = (By, 0, 0)], where A is the vector potential.
An alternative expression of H 0 reads:
H 0 = ћ 2 2 m * 2 x 2 + 2 y 2 + 1 2 m * ω 0 2 x 2 + 1 2 m * Ω 2 y 2 i ћ ω c y x
We define Ω 2 = ω 0 2 + ω c 2 and Ω represents the total confinement frequency in the y-direction. The symmetry of the anharmonic potential Vanh may be either even or odd and written as:
V a n h = k 1 x + y
for odd symmetry and:
V a n h = k 2 x 4 + y 4
for even symmetry. k1 and k2 are the anharmonicity constants.
ξ x , y of Equation (1) represents the contribution of noise comprising of physical attributes like zero-average and spatial δ-correlation. Mathematically, above physical attributes can be formulated by a function g x , y whence:
g x , y = 0
and
g x , y g x , y = 2 ζ δ x , y x , y
respectively, ζ being the noise strength. The function g x , y maintaining a Gaussian profile has been generated by means of Box-Muller algorithm. For additive white noise (ADWN) and multiplicative white noise (MLWN) ξ x , y is given as:
ξ x , y = λ 1 g x , y
and
ξ x , y = λ 2 g x , y x + y
respectively λ 1 and λ 2 are two arbitrary parameters.
We invoke linear variation strategy in order to solve the time-independent Schrödinger equation relevant to H0. The required trial function ψ k x , y was generated by direct multiplication of the harmonic oscillator eigenstates viz. ϕ n p x and ϕ m q y i.e.,
ψ k x , y = n m C n m , k ϕ n p x ϕ m q y
where Cnm,k are the coeffcients of linear combination and p = m * ω 0 ћ and q = m * Ω ћ . The trial function, thus constructed, leads to the determination of the matrix elements. Afterwards, the Hamiltonian matrix for H0 (see Equation (1)) has been formed and then diagonalized to obtain the energy levels and the normalized eigenstates.

3. Results and Discussion

Current work uses, in general, m* = 0.067m0, where m0 is the mass of free electron, ε = 12.4, nr = 3.2, ε0 = 8.8542 × 10⁻¹² Fm−1, τ = 0.14 ps, σs = 5.0 × 1024 m−3, B = 5.0 T, ћω0 = 100.0 meV and ζ = 1.0 × 10⁻⁴. These values appear reasonable for GaAs QD. All the NLO properties have been calculated by following the combination of usual density matrix approach and the iterative process. In subsequent discussions we use two more abbreviations for the brevity of the manuscript viz. odd parity anharmonicity (OPA) and even parity anharmonicity (EPA).

3.1. Total Optical Absorption Coeffcient (TOAC)

A literature survey reveals a significant number of important studies on TOAC of LDSS [11,12,13,14,15,16,17,18,19,20,21]. The linear [ α 1 ν ] and the third-order nonlinear [ α 3 ν , I ] absorption coefficients, according to two-state system approximation, is given by:
α 1 ν = ν μ ɛ R · σ s M i j 2 ћ Γ i j ћ ν Δ E i j 2 + ћ Γ i j 2
and
α 3 ν , I = ν μ ɛ R I 2 ɛ 0 n r c · σ s M i j 2 ћ Γ i j ћ ν Δ E i j 2 + ћ Γ i j 2 2 × 4 M i j 2 M j j M i i 2 3 Δ E i j 2 4 Δ E i j ћ ν + ћ 2 ν 2 Γ i j 2 Δ E i j 2 + ћ Γ i j 2
I, μ, εR, σs, ε0 and nr are the intensity of the electromagnetic field, magnetic permeability of the system (=1/ε0c2, where c is the speed of light in vacuum), real part of permittivity, carrier density, vacuum permittivity and the static component of refractive index, respectively. Γij is the phenomenological relaxation rate arising out of electron-phonon, electron-electron and other collision phenomena. The diagonal matrix element i.e., Γjj yields the relaxation rate of state j and Γjj = 1/τjj, where τjj is the relaxation time of j -th state. The diagonal matrix element i.e., Γij(= 1/τij,i ≠ j) gives the relaxation rate of i -th and j -th states with relaxation time τij. TOAC [ α ν , I ] now reads:
α ν , I = α 1 ν + α 3 ν , I
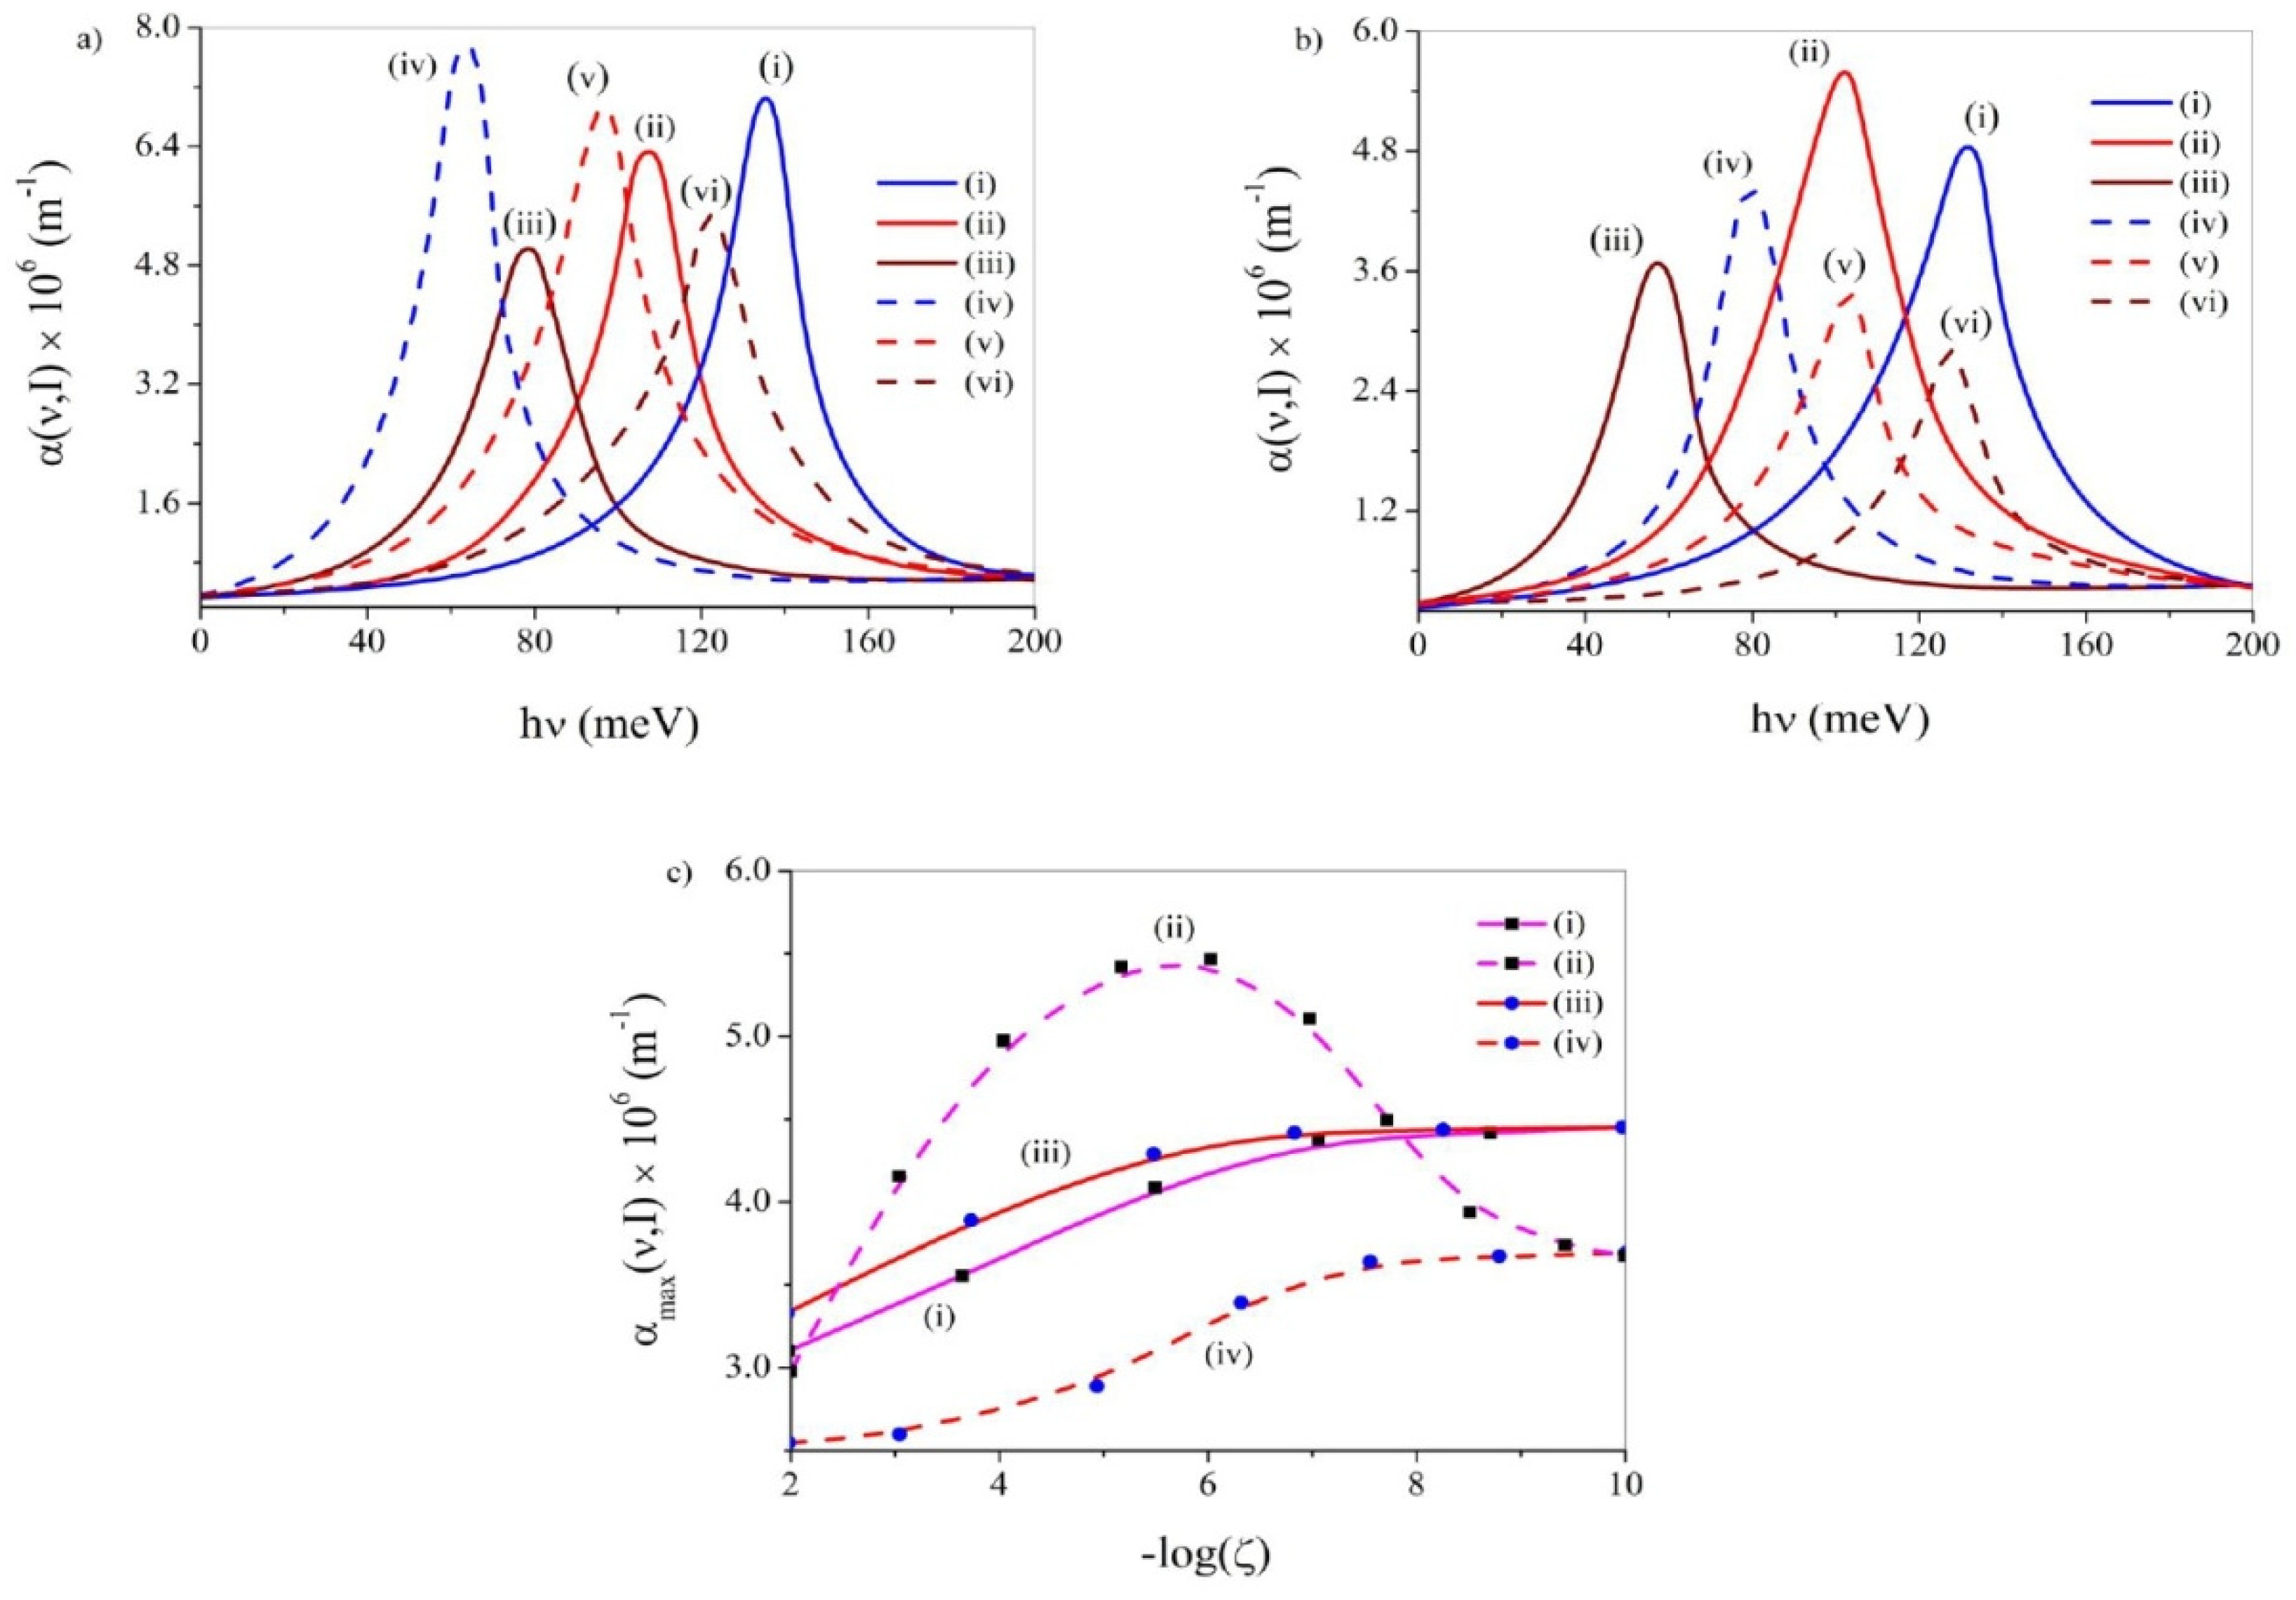
Figure 1a–c depicts the TOAC diagrams following the change of incident optical frequency (υ) for both OPA and EPA without noise and with ADWN and MLWN, respectively, for three different values of anharmonicity constant (k) viz. 10−8, 10−5 and 10−2. With odd anharmonicity and under noise-free state the TOAC peaks display blue-shift and decrease in the peak height with the enhancement of k. Under EPA, the blue-shift is again observed along with an increase in the peak height as k enhances. Therefore, in the absence of noise, both for OPA and EPA, the energy separation increases as k increases. However, the overlap between the concerned eigenstates decreases (increases) with an increase in k with odd (even) anharmonic potential.
With ADWN, both with OPA and EPA, the TOAC peaks display blue-shift and decline in the peak height as k enhances. Hence, with ADWN, as k varies, the features of TOAC do not depend on the symmetry of the anharmonicity. Moreover, an enhancement of k gets invariably accompanied by an enhancement of the energy separation and a steady loss of overlap between the relevant eigenstates.
In the presence of MLWN, both with OPA and EPA, the TOAC peaks exhibit blue-shift as k increases. However, whereas the peak height undergoes steady fall as k enhances with OPA, with EPA, the peak height exhibits minimization at k ~ 10−5. Thus, in this case, both with OPA and EPA, we find enhancement of energy interval as k enhances. However, whereas the overlap between the eigenstates declines steadily with an increase in k with OPA, in the presence of EPA, the said overlap minimizes at k ~ 10−5.
Figure 1d delineates the diagrams of peak values of TOAC as k varies in the presence and absence of noise, both with OPA and EPA. These diagrams conform to the above findings. Under odd anharmonic potential the TOAC plots exhibit regular rise as k falls under all conditions. However, with EPA, the said plots reveal monotonic fall as k decreases in absence of noise, regular rise with fall of k under applied ADWN and modest minimization at k ~ 10−4.8 with MLWN, respectively.
Figure 2a,b describes the TOAC diagrams against the variation of the impinging optical frequency (υ), in the presence of ADWN and MLWN for OPA and EPA, respectively, for three different noise strengths (ζ) viz. 10−2, 10−6 and 10−10. In these diagrams a fixed value of k has been considered (k = 10−8). Under OPA and with applied ADWN (MLWN) the TOAC peaks reveal red-shift (blue-shift) along with fall in the peak height with an increase in ζ. Such a pattern points to a fall (rise) in the energy gap under applied ADWN (MLWN) and a steady fall in the overlap between the eigenstates as noise strength is increased.
In the presence of EPA and under applied ADWN the TOAC peaks delineate red- shift as ζ enhances and the peak height maximizes at ζ ~ 10−6. It, therefore, comes out that an enhancement of ζ causes a steady drop in the energy interval while the overlap between the wave functions maximizes around some typical noise strength of ζ ~ 10−6. Under applied MLWN the TOAC peaks depict blue-shift along with regular decline in the peak height as ζ enhances. The observations indicate that in this case an enhancement of ζ happens to regularly enhance the energy level separations and reduce the aforesaid overlap.
Figure 2c manifests the profiles of peak values of TOAC following a variation of ζ under applied ADWN and MLWN, both with OPA and EPA. The physical attributes of these profiles show compliance with the erstwhile findings. The diagrams exhibit that, except in the case of applied ADWN coupled with even anharmonic potential, in all other situations the TOAC profiles increase as the noise strength decreases and finally settles to the value under noise-free condition at extremely small values of ζ. Only under EPA and with applied ADWN the TOAC maximizes at ζ ~ 10−5.7.

3.2. Total Optical Refractive Index Change (TORIC)

We have come across a few pertinent studies on TORIC of LDSS [11,13,16,20]. The linear Δ n 1 ν n r and the third-order nonlinear Δ n 3 ν , I n r refractive index (RI) changes may be given by:
Δ n 1 ν n r = 1 2 n r 2 ɛ 0 · σ s M i j 2 Δ E i j ћ ν Δ E i j ћ ν 2 + ћ Γ i j 2
and
Δ n 3 ν , I n r = μ c I 4 ɛ 0 n r 3 · σ s M i j 2 Δ E i j ћ ν 2 + ћ Γ i j 2 2 × [ 4 Δ E i j ћ ν M i j 2 M j j M i i 2 Δ E i j 2 + ћ Γ i j 2 · Δ E i j ћ ν × Δ E i j Δ E i j ћ ν ћ Γ i j 2 ћ Γ i j 2 2 Δ E i j ћ ν ]
Consequently, TORIC Δ n ν , I n r can be written as:
Δ n ν , I n r = Δ n 1 ν n r + Δ n 3 ν n r
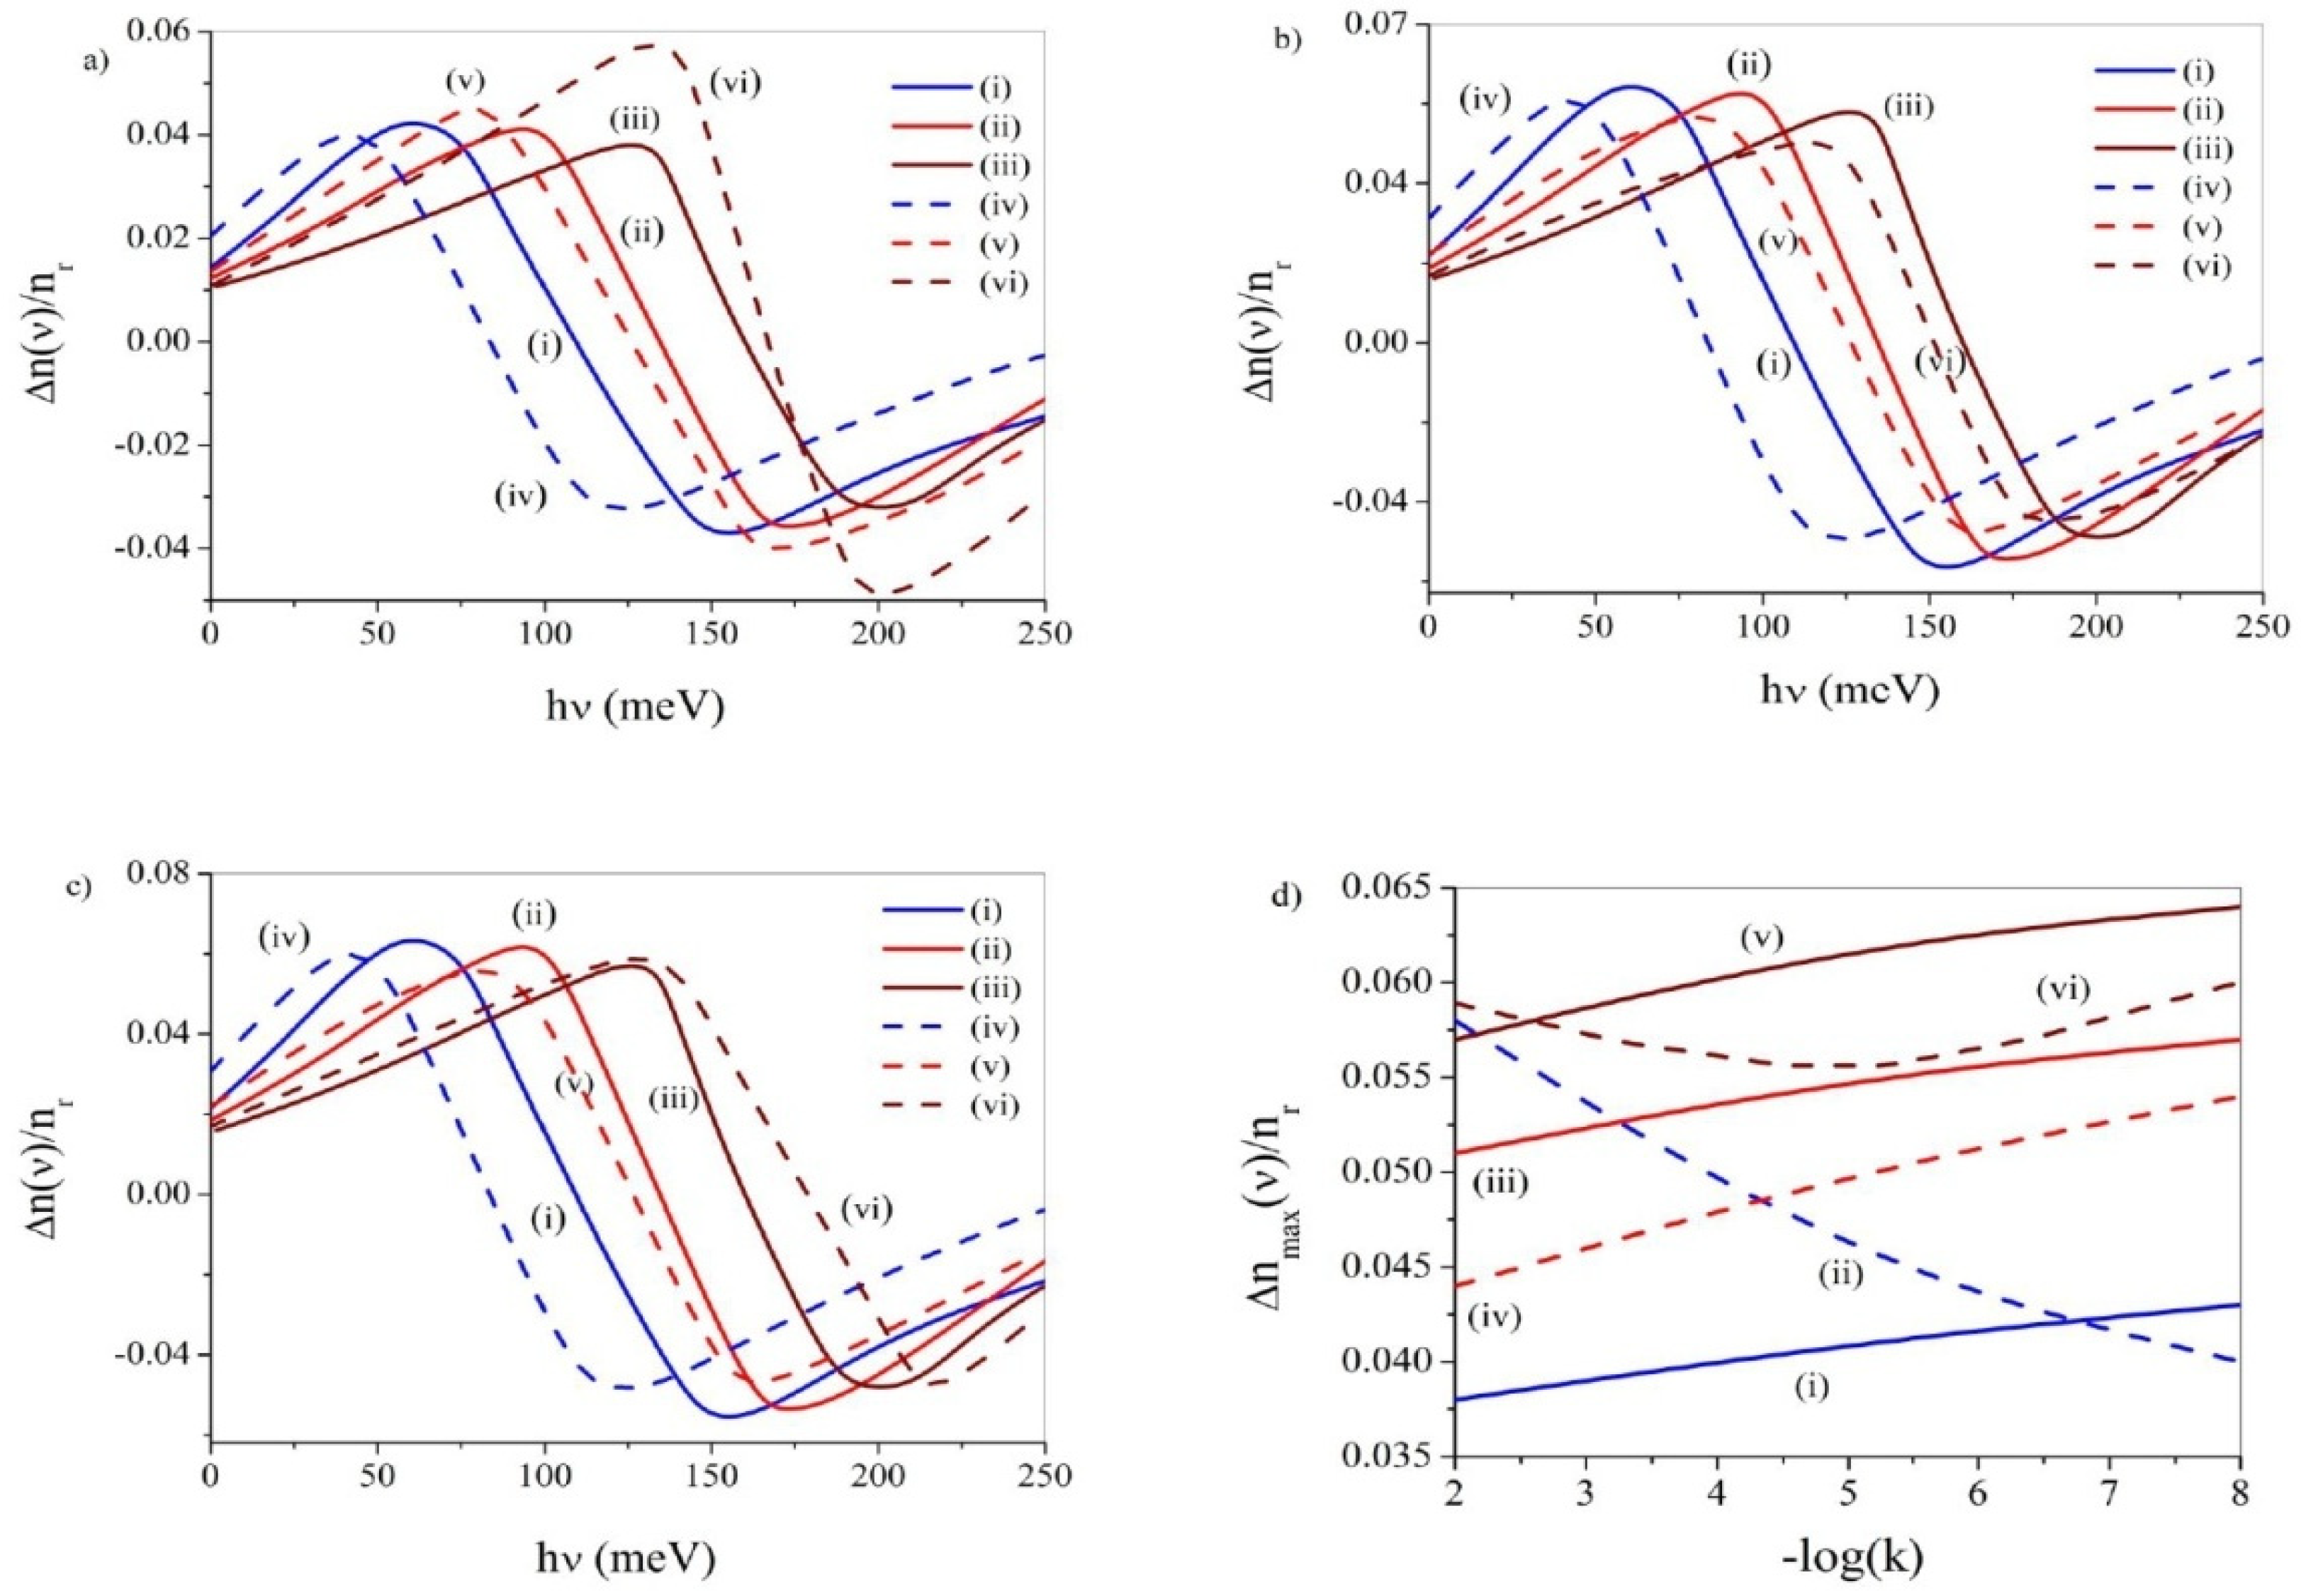
Figure 3a–c manifests the TORIC profiles with the variation of υ for both OPA and EPA without noise and with ADWN and MLWN, respectively, for three different values of (k) viz. 10−8, 10−5 and 10−2. With OPA (EPA) and without noise the TORIC peaks evince blue-shift and fall (rise) in the peak height as k enhances. Thus, under noise-free condition, both for OPA and EPA, the energy separation increases with an increase in k. However, the overlap between the concerned eigenstates decreases (increases) with an increase in k under odd (even) anharmonic potential.
In the presence of ADWN, both with OPA and EPA, the TORIC peaks manifest blue-shift and lull in the peak altitude as k enhances. Thus, with ADWN, the parity of the anharmonic potential does not influence the TORIC profiles as k changes. Moreover, an enhancement of k is invariably associated with an augmented energy range and a regular loss of overlap between the concerned eigenstates.
Under applied MLWN, both with OPA and EPA, the TORIC peaks depict blue-shift as k enhances. However, with OPA, the peak altitude undergoes steady drop as k enhances. On the other hand, with EPA, the peak altitude reveals minimization at k ~ 10−5. Thus, in this case, both with OPA and EPA the energy separation increases as k enhances. However, whereas the overlap between the eigenfunctions depletes steadily with an increase in k with OPA, under EPA, the said overlap minimizes at k ~ 10−5.
Figure 3d displays the profiles of peak values of TORIC with change in k in the presence and absence of noise, both with OPA and EPA. These diagrams support the observations discussed above. Under odd anharmonic potential the TORIC profiles discern regular rise with fall of k under all conditions. However, under EPA, the said plots divulge regular fall as k decreases in absence of noise, prominent growth with decrease in k under applied ADWN and moderate minimization at k ~ 10−5under applied MLWN, respectively.
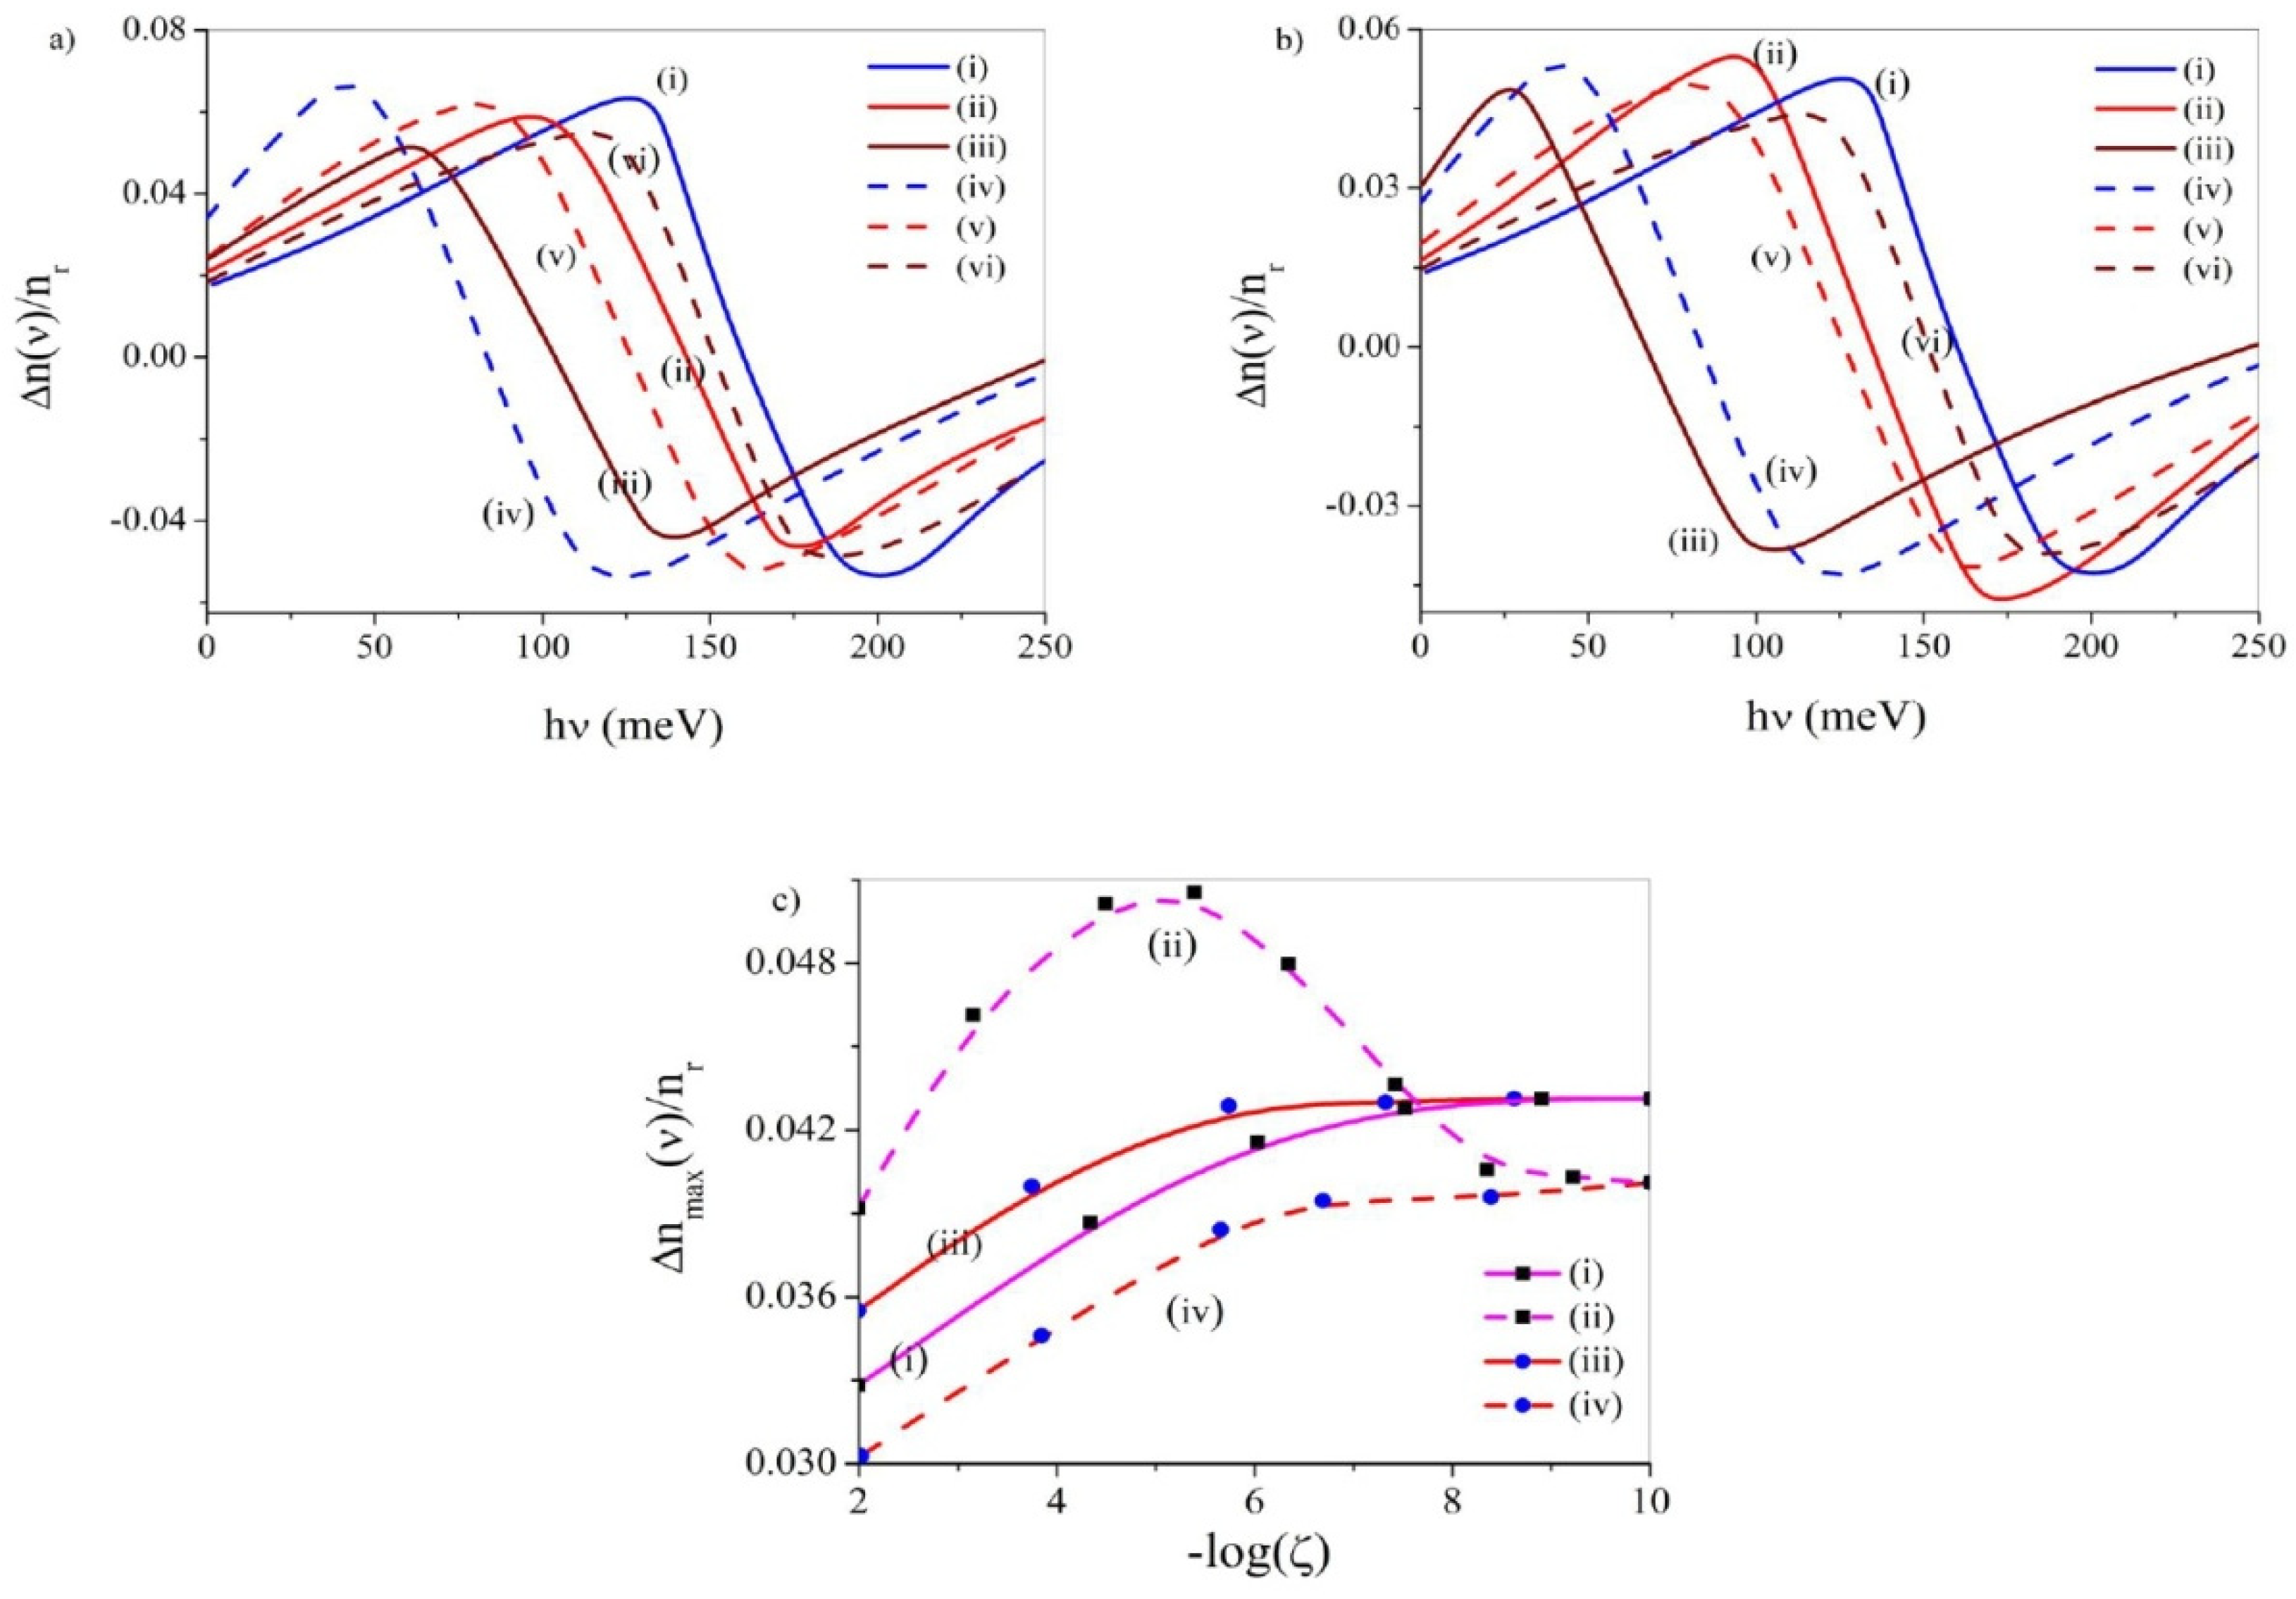
Figure 4a,b describes the TORIC diagrams with the change of (υ) both under applied ADWN and MLWN for OPA and EPA, respectively, for three different values of ζ viz. 10−2, 10−6 and 10−10, for fixed value of k = 10−8. With OPA and under applied ADWN (MLWN) the TORIC peaks display red-shift (blue-shift) coupled with fall in the peak altitude as ζ increases. The said pattern reflects depletion (increase) in the energy separation under applied ADWN (MLWN) and a steadfast decline in the overlap between the relevant state functions as noise strength is increased.
Under EPA and with applied ADWN the TORIC peaks delineate red-shift as ζ enhances and the peak altitude maximizes at ζ ~ 10−6. Thus, now, an enhancement of ζ causes a steady fall in the energy interval while the overlap between the wave functions maximizes around some typical noise strength of ζ ~ 10−6. Under applied MLWN the TORIC peaks depict blue-shift along with regular fall in the peak altitude as ζ increases. The observations indicate that for this particular case an augmentation of ζ happens to persistently augment the energy level separations and diminish the aforesaid overlap.
Figure 4c displays the diagrams of peak values of TORIC against ζ under applied ADWN and MLWN, both with OPA and EPA. The attributes of these diagrams run inharmony with the earlier observations. The diagrams manifest that, except the case of applied ADWN coupled with even anharmonicity, in all other situations the TORIC peak values enhance with decrease in the noise strength and finally settles to the noise-free value at very low values of ζ. Only under EPA and with applied ADWN the TORIC maximizes at ζ ~ 10−5.

3.3. Nonlinear Optical Rectification (NOR)

NOR is an important second-order nonlinear process which has been extensively explored for LDSS [22,23,24,25,26,27,28,29,30,31] and can be given by [22]:
χ 0 2 = 4 e 3 σ s ɛ 0 ћ 2 M i j 2 δ i j × Δ E i j 2 1 + Γ 2 Γ 1 + ν 2 + Γ 2 2 Γ 2 Γ 1 1 Δ E i j ν 2 + Γ 2 2 Δ E i j + ν 2 + Γ 2 2
where δ i j = M ii M jj , Γk = 1/Tk with k = (1, 2) are damping terms associated with the lifetime (longitudinal and transverse, respectively) of the electrons taking part in the transitions.
Figure 5a–c depicts the NOR diagrams against (υ) for both OPA and EPA without noise and with ADWN and MLWN, respectively, for three different values of k viz. 10−8, 10−5 and 10−2. In the presence of odd anharmonicity and under noise-free state the NOR peaks display blue-shift and enhancement of the peak height with an increase in k. Under EPA, the said blue-shift is re-observed along with non-uniform change of the peak height. The peak altitude maximizes at k ~ 10−5. Thus, without noise, both for EPA and OPA the energy separation enhances with enhancement of k. It, therefore, comes out that, under OPA, the asymmetric nature of the system undergoes steady increase as k enhances. On the other hand, under EPA, the asymmetry of the system maximizes at k ~ 10−5.
Under applied ADWN, both with OPA and EPA, the NOR peaks manifest blue-shift and drop in the peak altitude with an increase in k. Thus, under ADWN, the parity of the anharmonic potential remains quite indifferent in modulating NOR as k varies. Furthermore, an enhancement of k is accompanied by an amplification of energy separation and a regular decline in the asymmetry of the system.
Under applied MLWN, both with OPA and EPA, the NOR peaks discern blue-shift as k increases and maximization at k ~ 10−5. Thus, resembling the observations under ADWN, in this case also, the parity of the anharmonic potential appears trivial while k changes. Additionally, an enhancement of k gets associated with augmentation of energy level interval and the asymmetric nature of the system maximizes at k ~ 10−5.
Figure 5d represents the plots of geometric factor(GF) i.e., M 01 2 δ 01 as a function of k in the absence and presence of noise, both with odd and even anharmonicities. The GF actually gives an estimate of the extent of asymmetric character of the system and help us understand how the NOR peak values change with variation k. These diagrams conform to the findings mentioned above. Under OPA the GF depicts persistent diminish with fall of k without noise, persistent growth with fall of k with applied ADWN and a moderate maximization at k ~ 10−5 under applied MLWN, respectively. However, with even anharmonicity, the aforesaid plots reveal feeble maximization at k ~ 10−4.5 without noise, regular enhancement as k falls under applied ADWN and a noticeable maximization at k ~ 10−5.2 under applied MLWN, respectively.
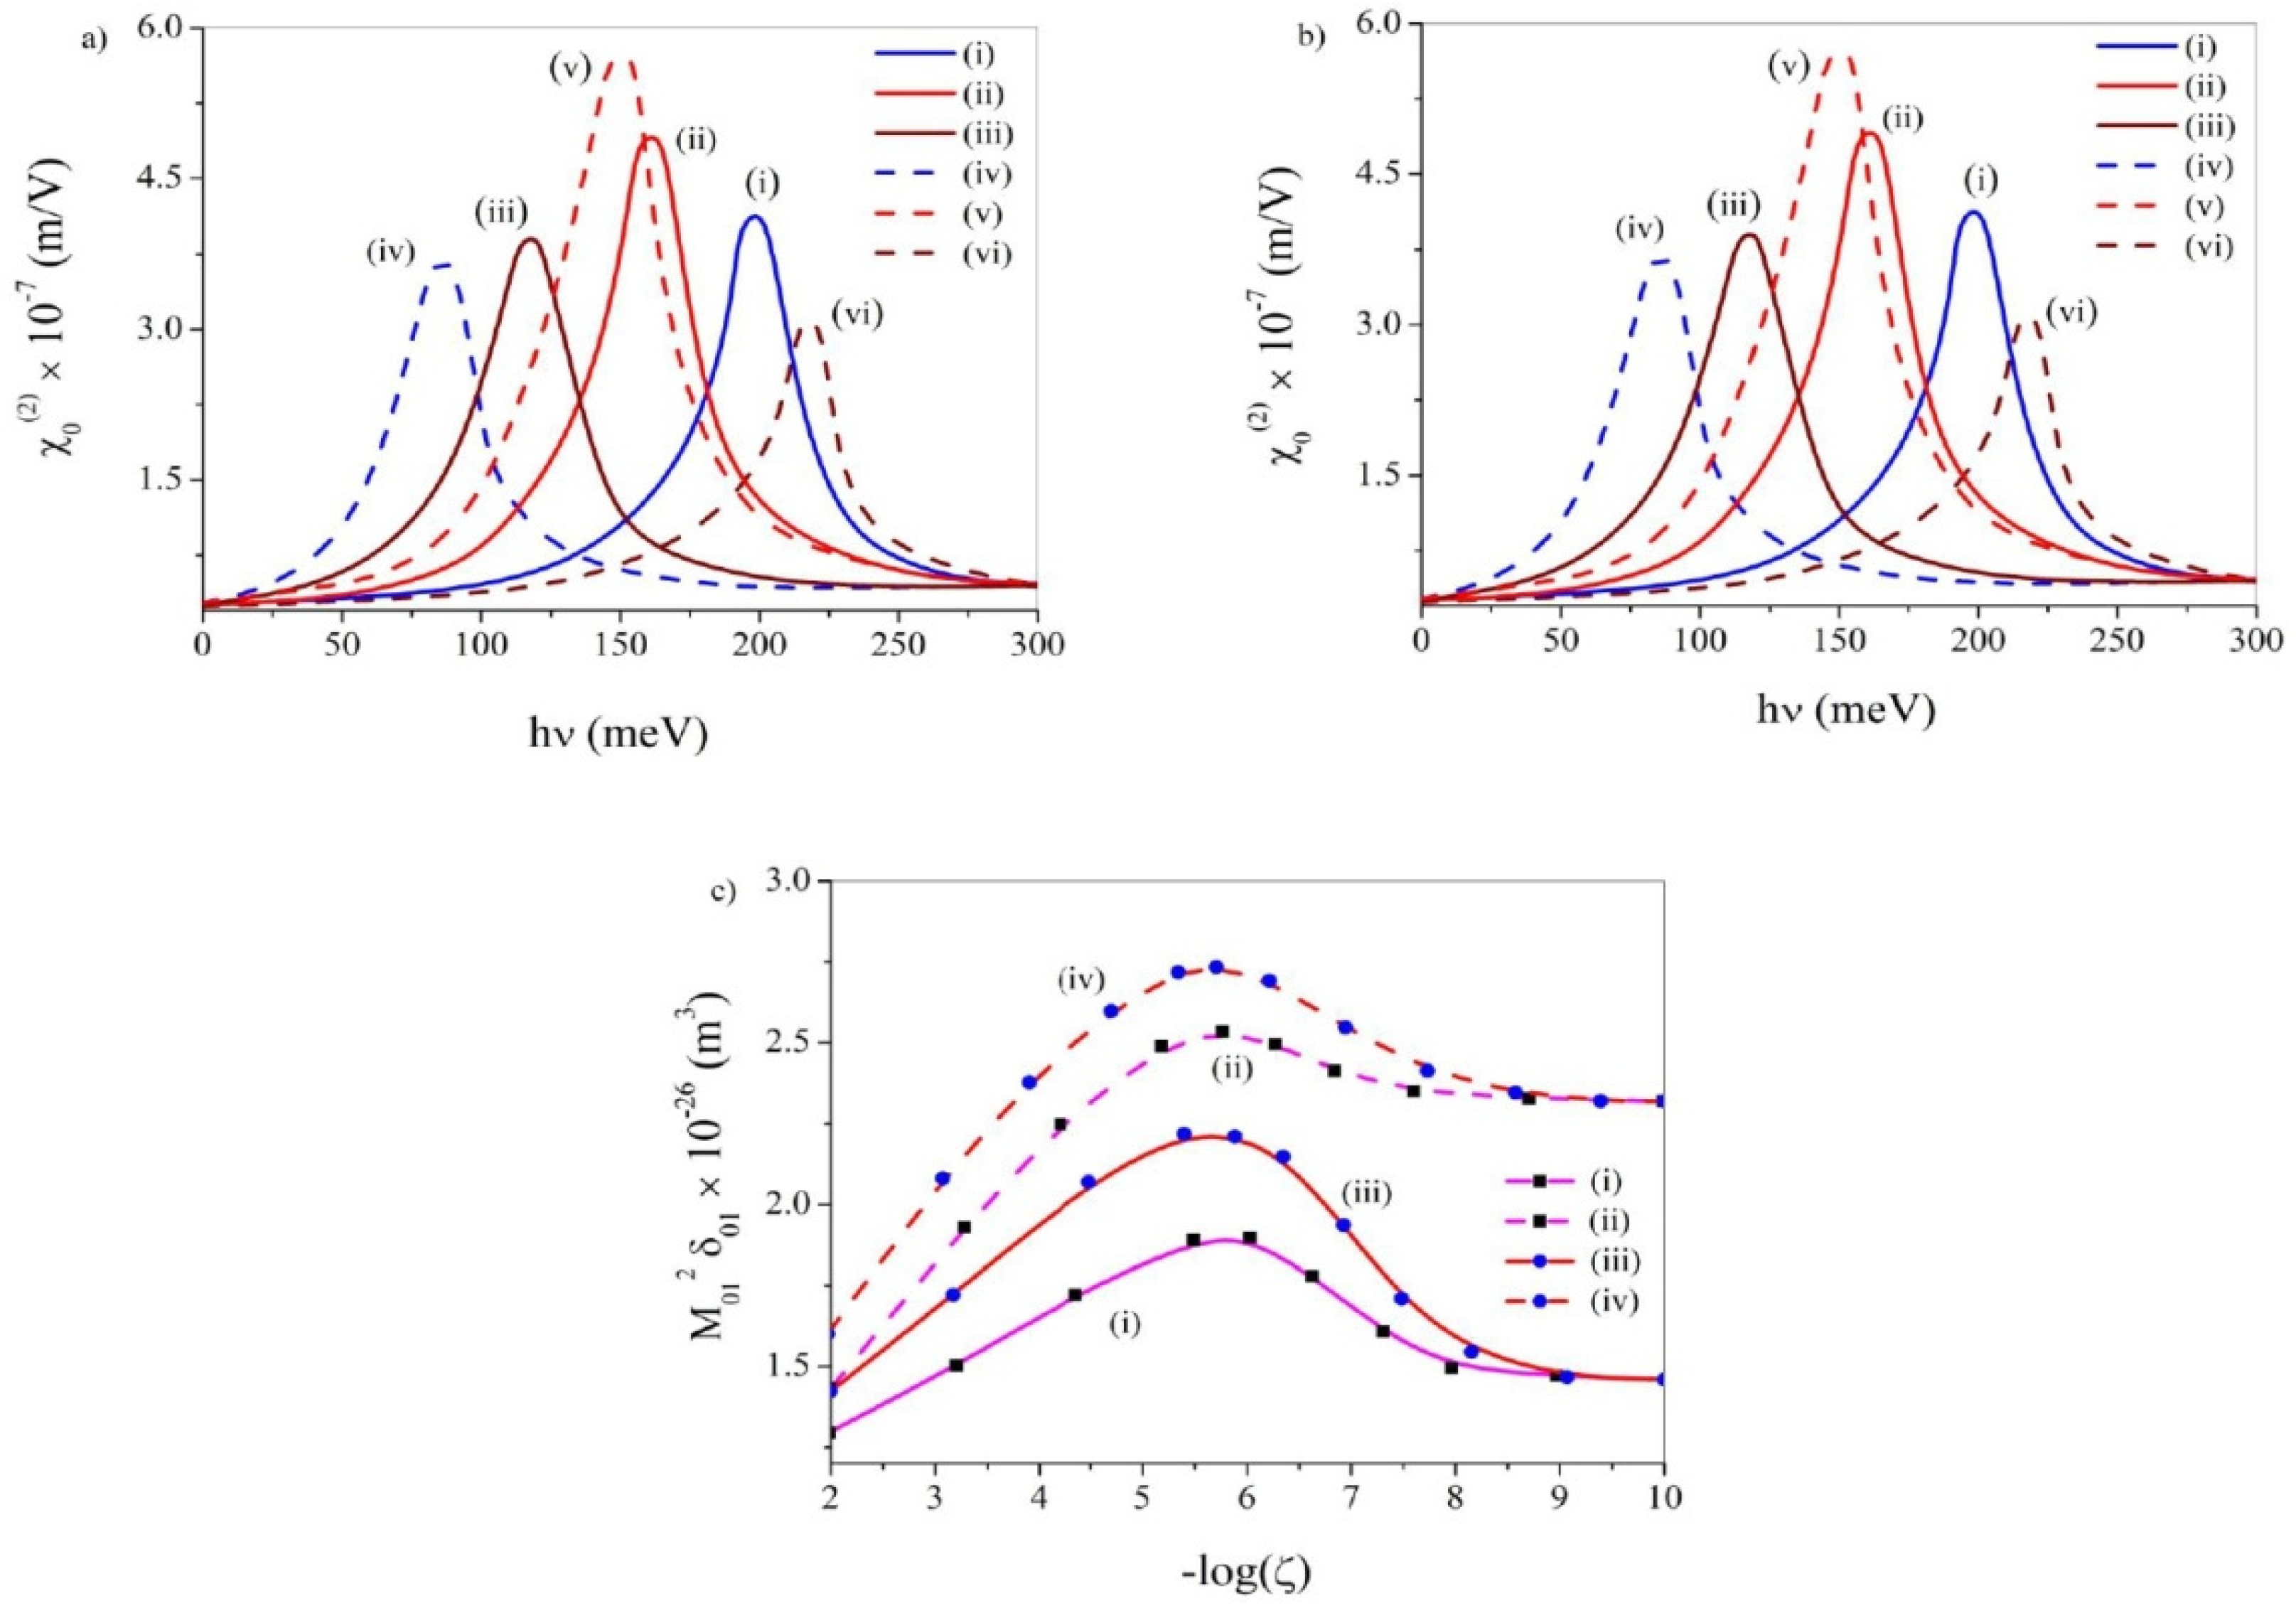
Figure 6a,b divulges the NOR diagrams against υ both under applied ADWN and MLWN for OPA and EPA, respectively, for three different values of ζ viz. 10−2, 10−6 and 10−10, keeping k fixed at k = 10−6. Under OPA and with applied ADWN the NOR peaks reveal red-shift as ζ enhances. Added to this, the NOR peak altitude becomes maximum at ζ ~ 10−6. The pattern reflects a fall in the energy separation as ζ increases. The asymmetric character of the system also becomes maximum at some intermediate ζ. Under applied MLWN the NOR peaks manifest steady blue-shift as ζ increases and the peak altitude reveals maximization at ζ ~ 10−6. The profiles, therefore, suggest a regular increase of energy separation as ζ increases and generation of extremely large asymmetric nature at ζ ~ 10−6.
Under EPA the physical traits of the NOR profiles show qualitative analogy with the similar profiles under OPA. Hence, these diagrams are not elaborated. Thus, the physical attributes of the NOR diagrams are not influenced by the symmetry of the anharmonicity as ζ varies.
Figure 6c depicts the GF profiles corresponding to NOR as ζ varies, under ADWN and MLWN, both with OPA and EPA. The characteristics of these diagrams run in accordance with the earlier observations. The diagrams reflect that, both under applied ADWN and MLWN and regardless of the symmetry of the anharmonic potential, the GF plots manifest maximization at ζ ~ 10−5.7 and settle to the value without noise when ζ becomes negligibly small.

3.4. Second Harmonic Generation (SHG)

SHG is a second-order NLO property of considerable importance. The extreme sensitivity of SHG to the symmetry of the systems enhanced its use for studying the second-order properties of surface and interfaces as a non-destructive and non-contact probe [22,23,32,33,34,35,36]. For a three-level quantum system the SHG susceptibility per unit volume under two photon resonance condition i . e . , ћ ν = ћ ν 10 = ћ ν 21 is given by [23]:
χ 2 ν 2 = e 3 σ s ɛ 0 ћ 2 M 01 · M 12 · M 20 ν ν 10 + i Γ 10 · 2 ν ν 20 + i Γ 20
where ν i j = E i E j / ћ is the transition frequency and Γ = Γ10 = Γ20 is the off-diagonal relaxation rate. It goes without saying that the peak value of SHG is proportional to the geometric factor (GF) M 01 · M 12 · M 20 of the system. Thus, attainment of large SHG requires small relaxation rate Γ and large GF.
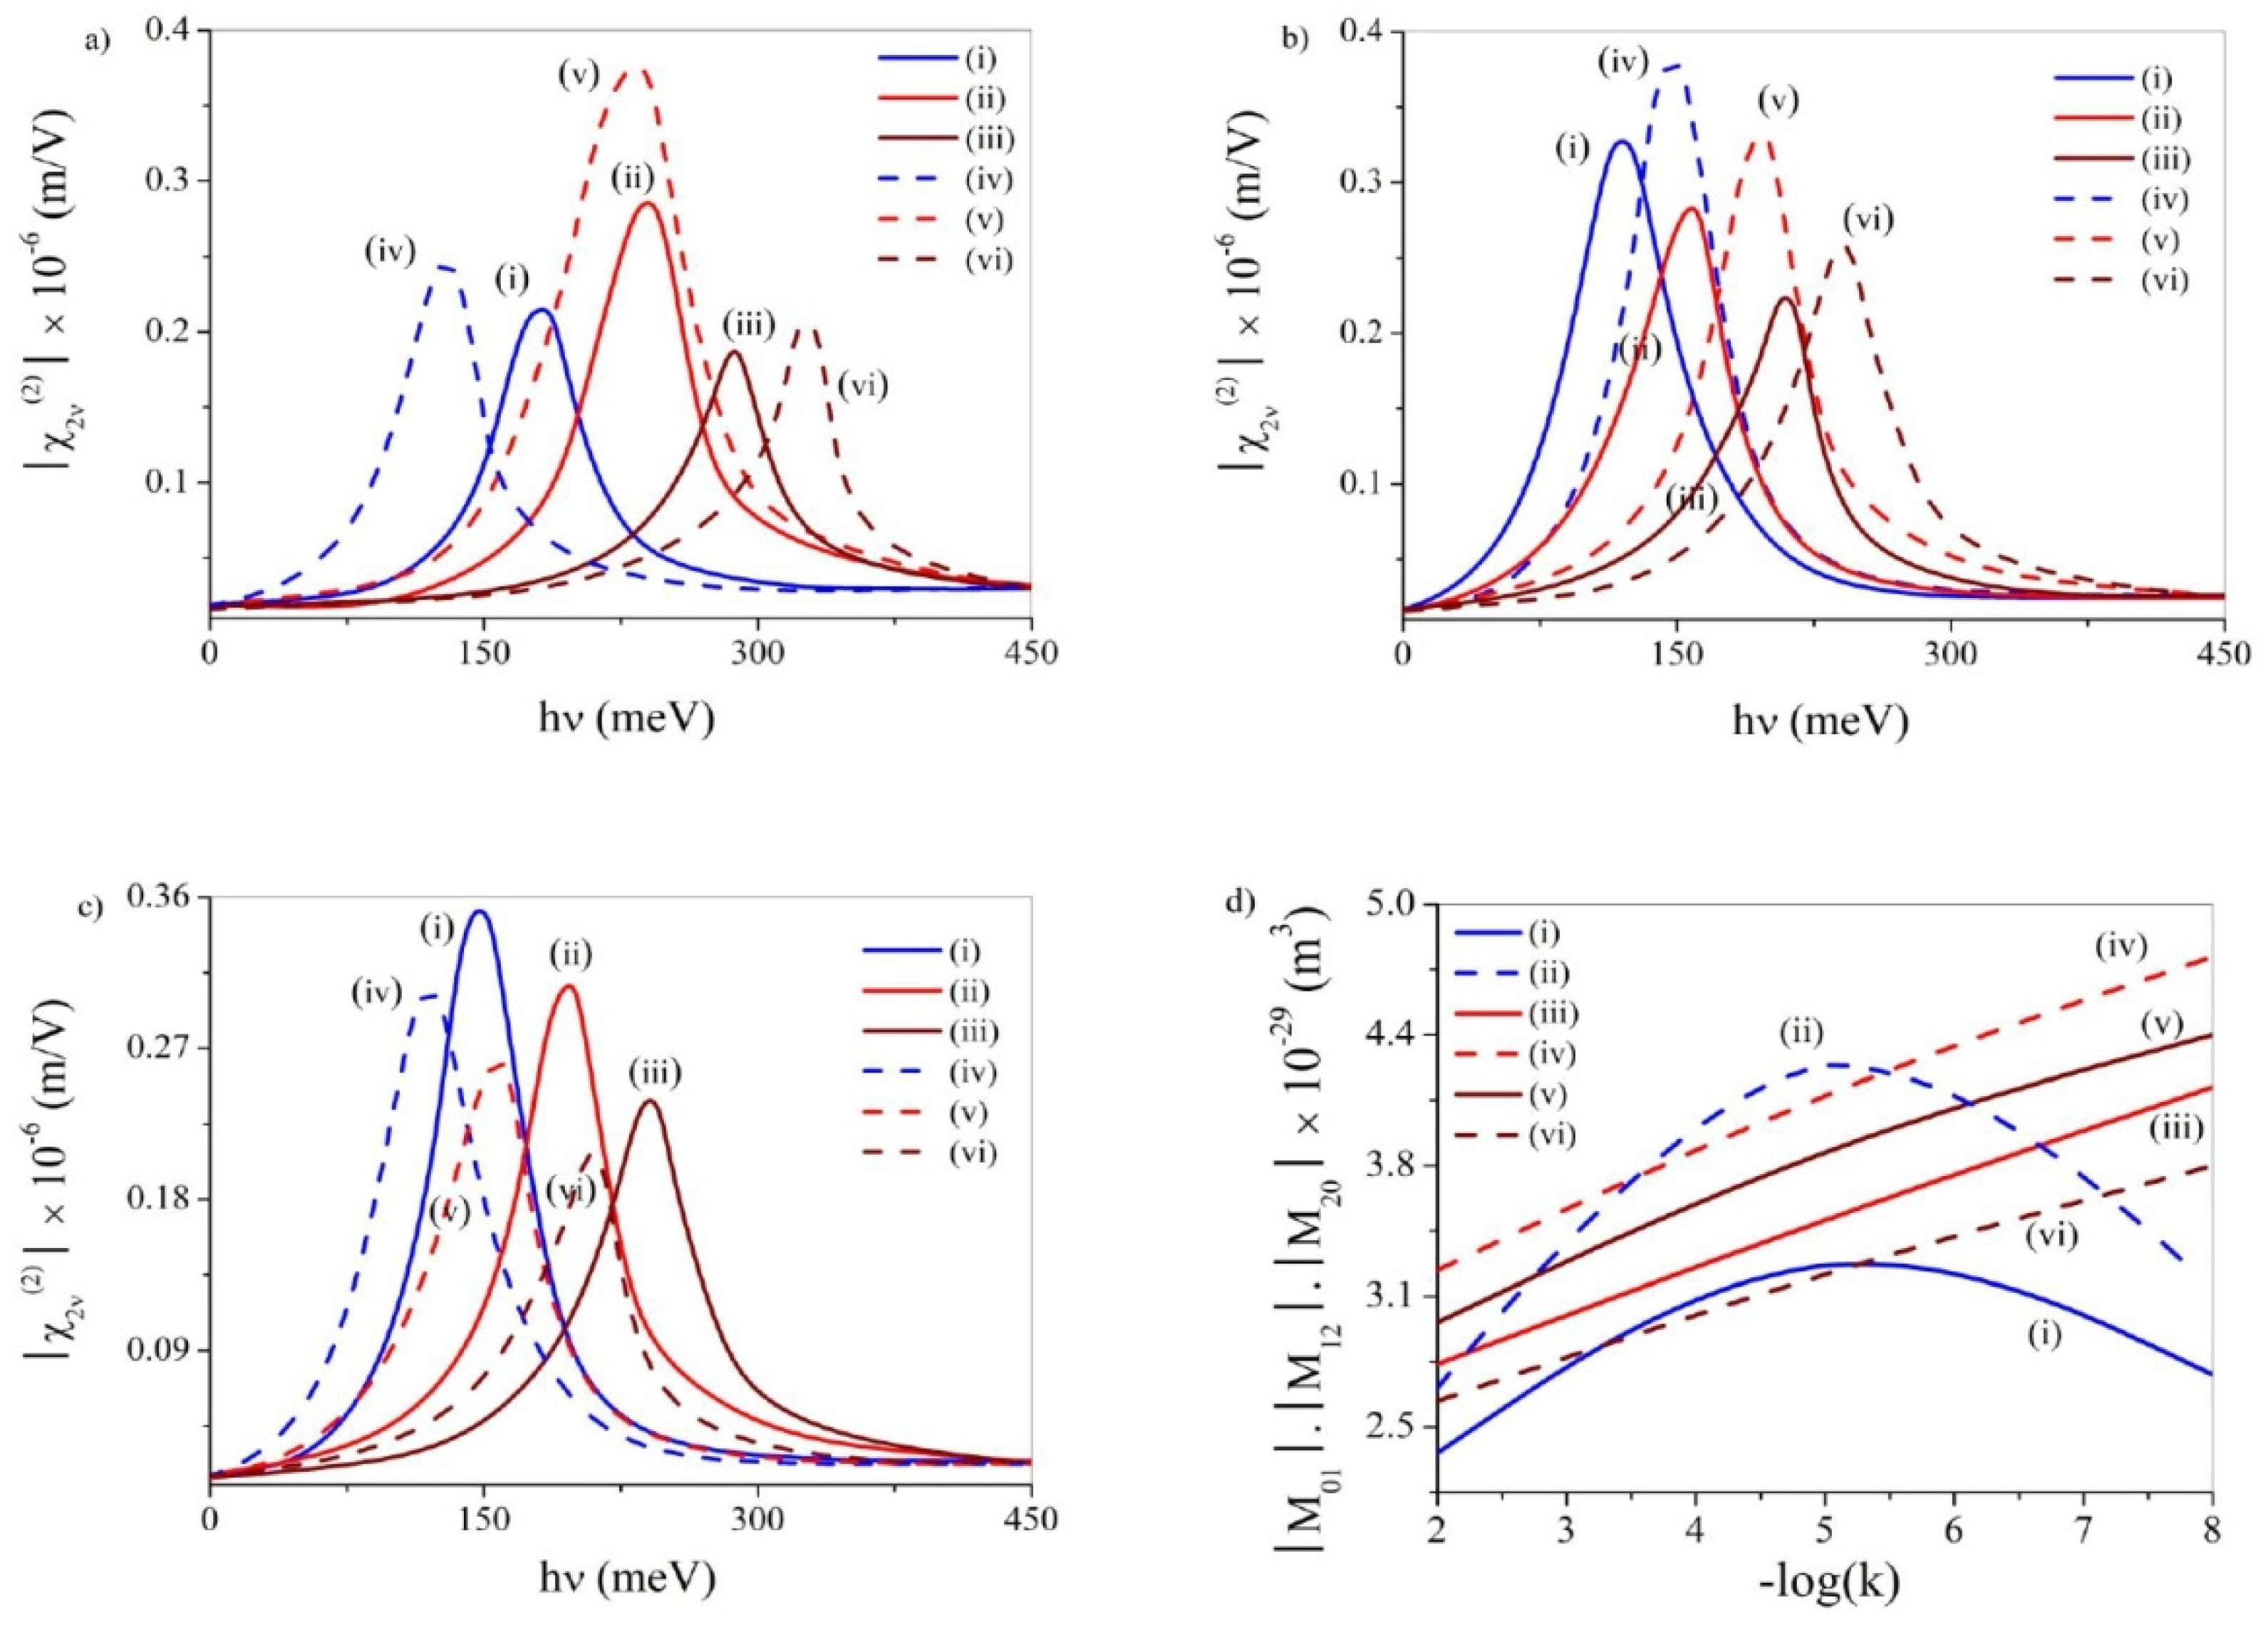
Figure 7a–c delineates the SHG plots with variation of the incident optical frequency (υ) for both OPA and EPA without noise and with ADWN and MLWN, respectively, for three different values of k viz. 10−8, 10−5 and 10−2. In the presence of both odd and even anharmonicity and without noise the SHG peaks depict blue-shift and the maximization of the peak altitude at k ~ 10−5. Thus, without noise, the parity of the anharmonicity refrains from affecting the qualitative traits of the SHG profiles over a range of k values.
Under applied ADWN, both with OPA and EPA, the SHG peaks discern blue-shift and drop in the peak altitude with enhancement of k. Thus, with ADWN, the parity of the anharmonicity appears ineffective in tuning SHG as k varies. Furthermore, an enhancement of k gets invariably accompanied by an enhancement of energy separation and a steady loss of asymmetry of the system.
Under applied MLWN, both with OPA and EPA, the SHG peaks manifest blue-shift and steady decline as k increases. Thus, analogous to ADWN, in this case too the parity of the anharmonicity seems to be non-responsive as k changes. It can, therefore, be inferred that, during variation of k and regardless of the presence of noise, the parity of anharmonicity denies to possess any meaningful role, in so far as qualitative features of the SHG profiles are concerned.
Figure 7d represents the plots of geometric factor (GF) i.e., M 01 · M 12 · M 20   as k varies in the presence and absence of noise, both with OPA and EPA. These diagrams comply with the observations outlined above. In the presence of both odd and even anharmonicities the GF depicts maximization at k ~ 10−5 without noise and regular growth with fall of k both under applied ADWN and MLWN.
Figure 8a,b shows the SHG diagrams with the change of υ both under applied ADWN and MLWN for OPA and EPA, respectively, for three different values of ζ viz. 10−2, 10−6 and 10−10, keeping k fixed at k = 10−3. With OPA and under applied ADWN (MLWN) the SHG peaks display red-shift (blue-shift) as ζ increases. Additionally, the SHG peak height shows maximization at ζ ~ 10−6 for both under applied ADWN and MLWN. Such a trend suggests a fall (rise) in the energy separation as ζ is increased under applied ADWN (MLWN). However, regardless of mode of application of noise, the asymmetric character of the system becomes maximum at an intermediate strength of ζ ~ 10−6.
Under EPA and with applied ADWN the SHG peaks divulge red-shift and monotonic increase of peak height as ζ increases. However, with applied MLWN the said peaks delineate blue-shift as ζ enhances and maximizes at ζ ~ 10−6.
Figure 8c delineates the plots of GF relevant to SHG against ζ under applied ADWN and MLWN, both with EPA and OPA. The attributes of these plots conform to the earlier outcomes. The diagrams depict that, barring the combination of ADWN and EPA, in all other situations the GF evinces maximization at ζ ~ 10−5.5. Only for the special combination mentioned above the GF displays steady decline with decrease in the noise strength.

3.5. Third Harmonic Generation (THG)

NLO materials with large third-order nonlinear susceptibilities have come out as essential ingredients for the manufacture of all-optical switching, modulating and computing devices. Important works on THG have been carried out by [22,37,38,39,40,41,42,43,44,45]. Under triple resonance conditions THG susceptibility per unit volume can be represented by [22,39]:
χ 3 ν 3 = e 4 σ s ɛ 0 ћ 3 M 01 · M 12 · M 23 · M 30 ν ν 10 + i Γ 10 · 2 ν ν 20 + i Γ 20 · 3 ν ν 30 + i Γ 30
where Γij (ij) = Γ2 = 1/T2 is the off-diagonal relaxation rate with transverse relaxation time T2. The geometric factor M 01 · M 12 · M 23 · M 30 gives the maximum THG susceptibility ( χ 3 ν , m a x 3 ) at resonance peaks [39].
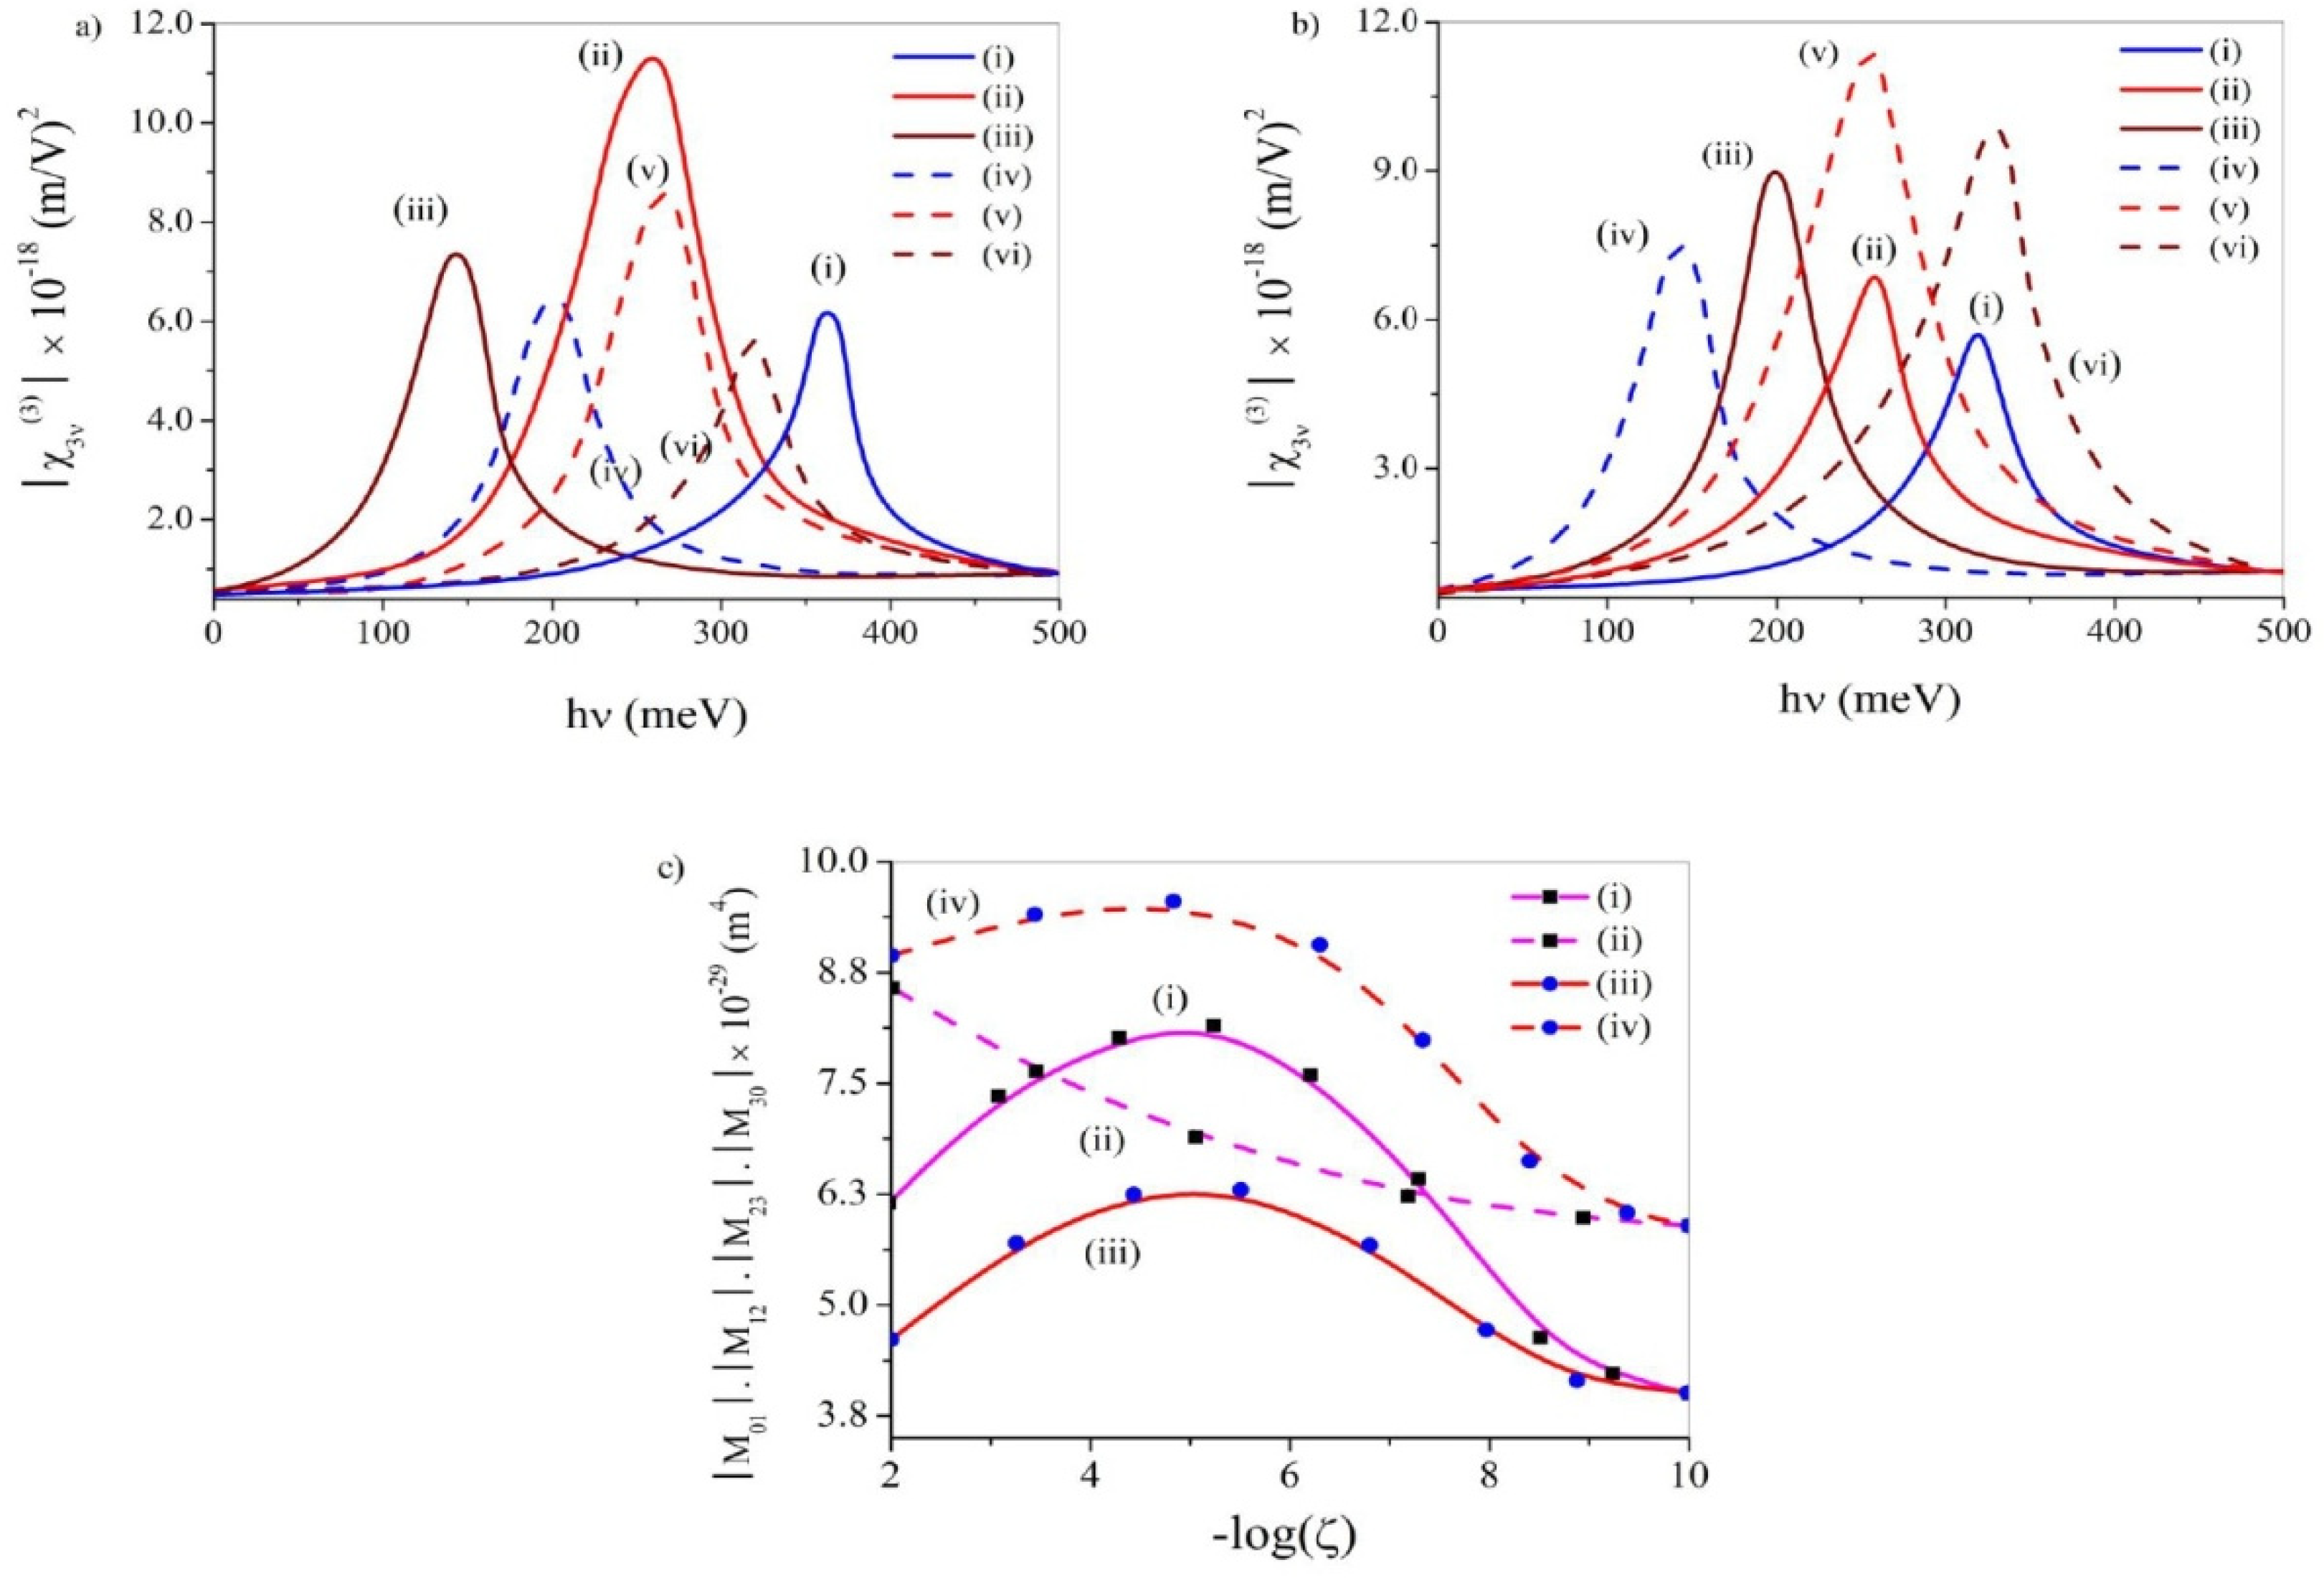
Figure 9a–c describes the THG profiles with the variation of υ for both OPA and EPA without noise and with ADWN and MLWN, respectively, for three different values of k viz. 10−8, 10−5 and 10−2. In the presence of OPA and under noise-free state the THG peaks evince blue-shift and growth in the peak altitude with enhancement of k. In the presence of EPA, the blue-shift is again observed but the peak altitude now becomes maximum at k ~ 10−5. Thus, in absence of noise, both for OPA and EPA the energy separation increases as k enhances. However, whereas with OPA the effective extent of overlap of the relevant eigenfunctions grows steadily as k increases, with EPA the said overlap maximizes at k ~ 10−5.
Under applied ADWN, with OPA the THG peaks display blue-shift with an increase in k and the maximization of the peak altitude at k ~ 10−5. And with EPA the said blue-shift occurs coupled with monotonic drop in the peak altitude as k enhances. Thus, in the presence of ADWN, both for OPA and EPA, the energy separation augments with enhancement of k. However, whereas with OPA the degree of overlap between the concerned eigenstates maximizes at k ~ 10−5, with EPA, the said overlap persistently falls as k enhances.
Under applied MLWN, both with OPA and EPA, the THG peaks exhibit blue-shift with an increase in k. However, the peak altitude steadily falls as k enhances with OPA and shows maximization at k ~ 10−5 with EPA, respectively. Thus, under MLWN, both for OPA and EPA the energy separation augments as k enhances. However, whereas with OPA the extent of overlap between the pertinent eigenfunctions regularly falls as k increases, with EPA the said overlap displays maximization at k ~ 10−5.
Figure 9d represents the plots of geometric factor (GF) i.e., M 01 · M 12 · M 23 · M 30 as k changes in the presence and absence of noise, both with OPA and EPA. These profiles justify the observations elaborated above. In the presence of OPA the GF depicts persistent decline with fall of k without noise, modest maximization at k ~ 10−5.2 under applied ADWN and regular rise with fall of k under applied MLWN, respectively. However, under EPA, the said plots divulge feeble maximization at k ~ 10−4.3 and k ~ 10−4 in noise-free state and under MLWN, respectively. Under similar condition and in the presence of ADWN the GF profile reveals a steady increase with a decrease in k.
Figure 10a,b displays THG diagrams against υ both under applied ADWN and MLWN for OPA and EPA, respectively, for three different values of ζ viz. 10−2, 10−6 and 10−10, keeping k fixed at k = 10−4. With OPA and under applied ADWN (MLWN) the THG peaks exhibit red-shift (blue-shift) as ζ increases. Moreover, both under applied ADWN and MLWN the THG peak altitude undergoes maximization at ζ ~ 10−6. Such a trend suggests a fall (rise) in the energy separation under applied ADWN (MLWN) as noise strength is increased. However, regardless of the pathway of application of noise, the overlap between the concerned eigenstates maximizes at ζ ~ 10−6.
With EPA the shift of THG peaks with ζ under applied ADWN and MLWN follows the same trend as found with OPA. However, whereas with ADWN the peak altitude increases persistently as ζ increases, with MLWN the peak altitude divulges maximization at ζ ~ 10−6. The observation reflects depletion (enhancement) in the energy interval under applied ADWN (MLWN) as noise strength is increased. Moreover, under applied ADWN, the degree of overlap between the concerned wave functions enhances regularly as noise strength enhances. However, under applied MLWN, the said overlap maximizes at ζ ~ 10−6.
Figure 10c describes the plots of GF corresponding to THG against ζ under applied ADWN and MLWN, both with OPA and EPA. The attributes of these diagrams go in harmony with the earlier outcomes. The diagrams unveil that, barring the combination of ADWN and EPA, in all other situations the GF evinces maximization at ζ ~ 10−5. Only for the typical combination mentioned above the GF displays steady decline with decrease in the noise strength.

3.6. Electro-Absorption Coeffcient (EAC)

EAC is a third-order NLO property which bears importance in the study of photoemission and detection applications of QDs [46,47,48,49,50,51]. By carrying out suitable structural modification of QD it becomes possible to tailor and even maximize the magnitude and resonance wavelength of EAC [46]. Employing compact density matrix approach in conjunction with second-order perturbation theory, the third-order nonlinear optical susceptibility corresponding to optical mixing between two incident light beams with frequencies υ1 and υ2 is given by [46]:
χ 3 2 ν 1 + ν 2 ; ν 1 , ν 1 , ν 2 = 2 i e 4 σ s M i j 4 ɛ 0 ћ 3 i ω i j 2 ν 1 + ν 2 + Γ · i ν 2 ν 1 + Γ × 1 i ω i j ν 1 + Γ + 1 i ν 2 ω i j + Γ
where e is the absolute value of electron charge, M i j = e ψ i | x ^ + y ^ | ψ j is the transition dipole moment matrix elements, ψi(ψj) are the eigenstates and ω i j = E i E j / ћ is the transition frequency. Γ = 1/T2 being the relaxation rate with relaxation time T2. Current study considers ν 1 = 0 and ν 2 = − ν for simplicity. χ(3) is a complex quantity and its imaginary part is known as the EAC and is given by [46]:
χ E A C 3 ν = I m χ 3 ν , 0 , 0 , ν
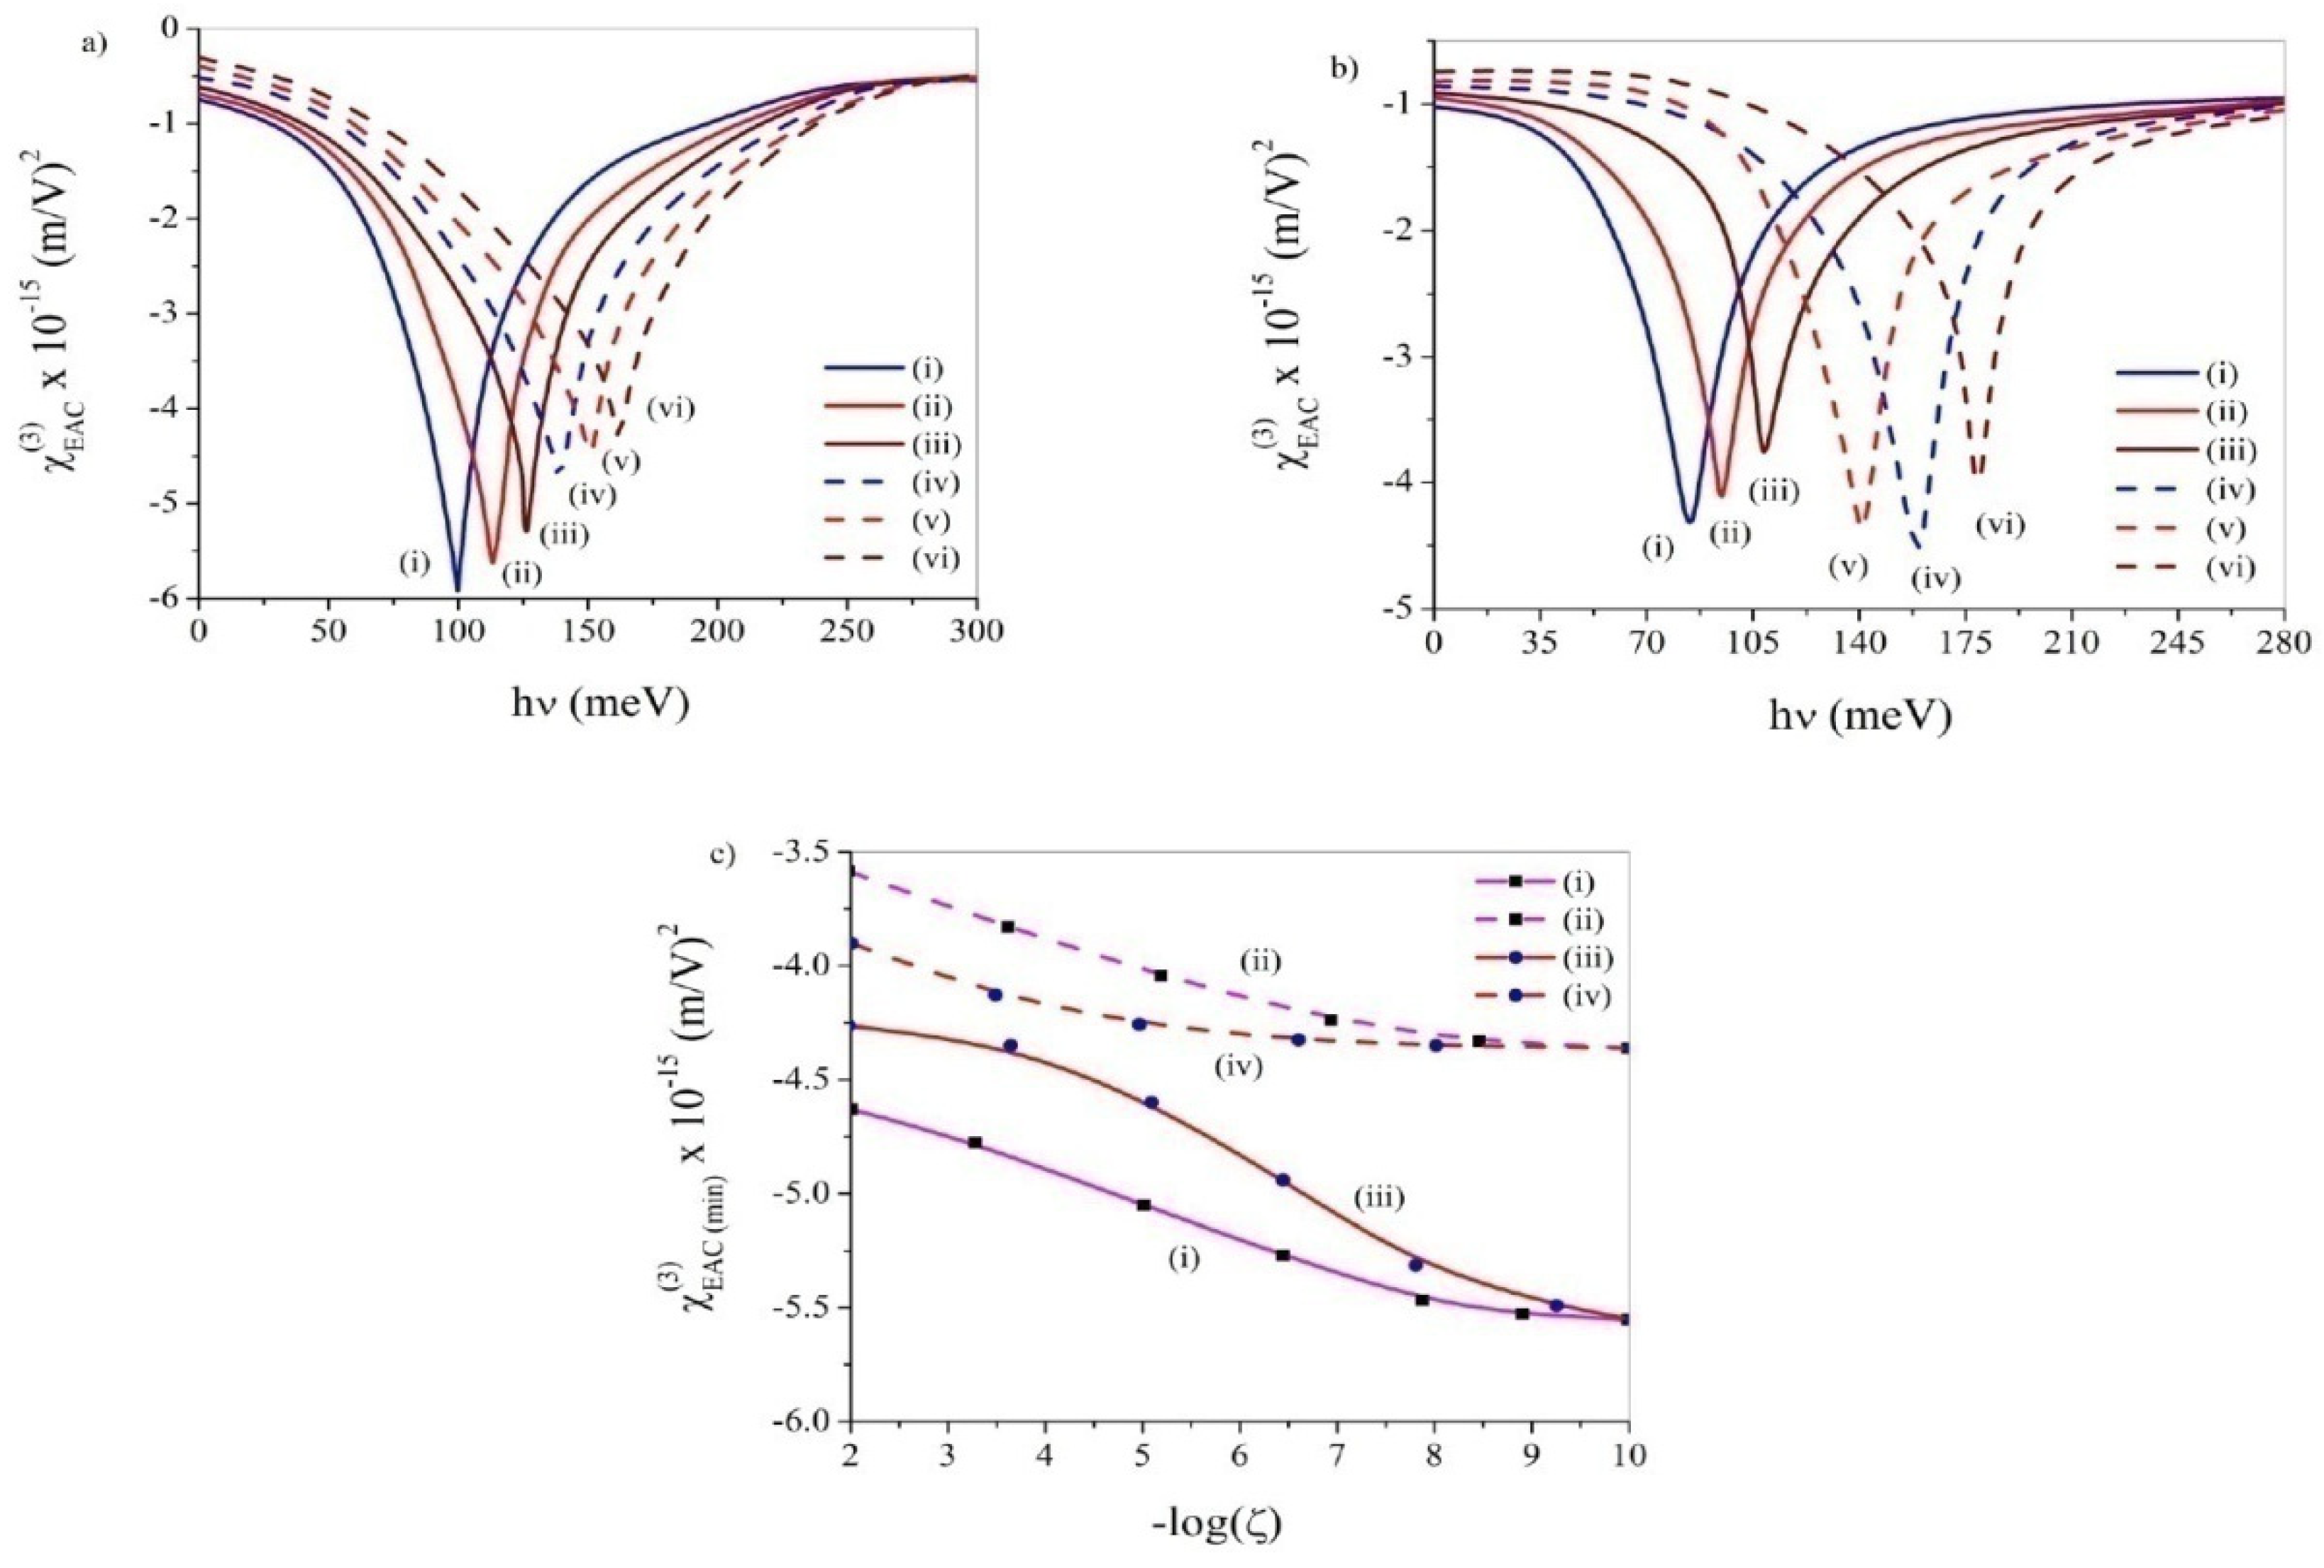
Figure 11a–c manifests the EAC diagrams against υ for both OPA and EPA without noise and with ADWN and MLWN, respectively, for three different values of k viz. 10−8, 10−5 and 10−2. In the presence of both OPA and EPA and without noise the EAC peaks reveal blue-shift and the steady drop of peak height (in absolute sense) as k increases.
Under applied ADWN, both with OPA and EPA the EAC peaks initially display red-shift with an increase in k up to k ~ 10−5 pursued by blue-shift as k is increased beyond. The peak height depicts steadfast fall (in absolute sense) as k increases.
Under applied MLWN and with odd anharmonicity the EAC peaks initially remain unshifted up to k ~ 10−5 pursued by blue-shift as k is increased further. On the other hand, with even anharmonicity, the EAC peaks initially display red-shift with an increase in k up to k ~ 10−5 pursued by blue-shift as k increases further. However, both with odd and even anharmonicities the EAC peak height monotonically falls (in absolute sense) with an increase in k.
Above rise (fall) in the EAC peak height under different conditions can be attributed to an increase (decrease) in the overlap integral between the relevant eigenstates, which is linked with the polarization of the wave functions [48]. On the other hand, the shift (blue/red) of EAC peaks results from change in the energy interval due to change in quantum confinement as k varies.
Figure 11d represents the plots of minimum peak values of EAC as a function of k in the absence and presence of noise, both with odd and even anharmonicities. These plots support the findings described above. The plots reveal a steady decline (in absolute sense) in the EAC peak height with an increase in k under all conditions.
Figure 12a,b displays the EAC profiles with the variation of υ both under applied ADWN and MLWN for OPA and EPA, respectively, for three different values of (ζ) viz. 10−2, 10−6 and 10−10 at a fixed value of k = 10−4With OPA and both under applied ADWN and MLWN the EAC peak height decreases (in absolute sense) with an increase in ζ associated with a blue-shift.
With even anharmonic potential and under applied ADWN the EAC peak displays blue-shift regular fall of the peak altitude (in absolute sense) as ζ enhances. Under applied MLWN the change of EAC peak height shows the same trend as mentioned above. However, the peak shift becomes non-uniform. The EAC peaks now initially exhibit red-shift up to ζ ~ 10−6 followed by blue-shift as ζ is increased beyond.
Figure 12c delineates the profiles of EAC minimum peak values against ζ under applied ADWN and MLWN, both with OPA and EPA. In these profiles the value of anharmonicity constant was fixed at k = 10−4. The plots evince persistent decline in the EAC peak value (in absolute sense) with an increase in the noise strength under all conditions.

3.7. DC-Kerr Effect (DCKE)

DCKE is an acclaimed phenomenon to probe photoemission and the detection applications of QDs [46,47,48,49,50,51,52,53,54]. The structural variation of QD often makes it feasible to harness and even maximize the magnitude and resonance wavelength of DCKE [46]. Amplified DCKE with diminished linear and nonlinear absorption possesses huge usage in several quantum devices as it makes NLO studies quite significant at reduced light power [52,53]. This, in turn, indicates that the linear susceptibility needs to be diminished as low as possible for all pump and signal fields to minimize the absorption [52]. The real part of χ(3)(see Equation (20)) is called the DCKE and is given by [46]:
χ D C K E 3 ν = R e χ 3 ν , 0 , 0 , ν
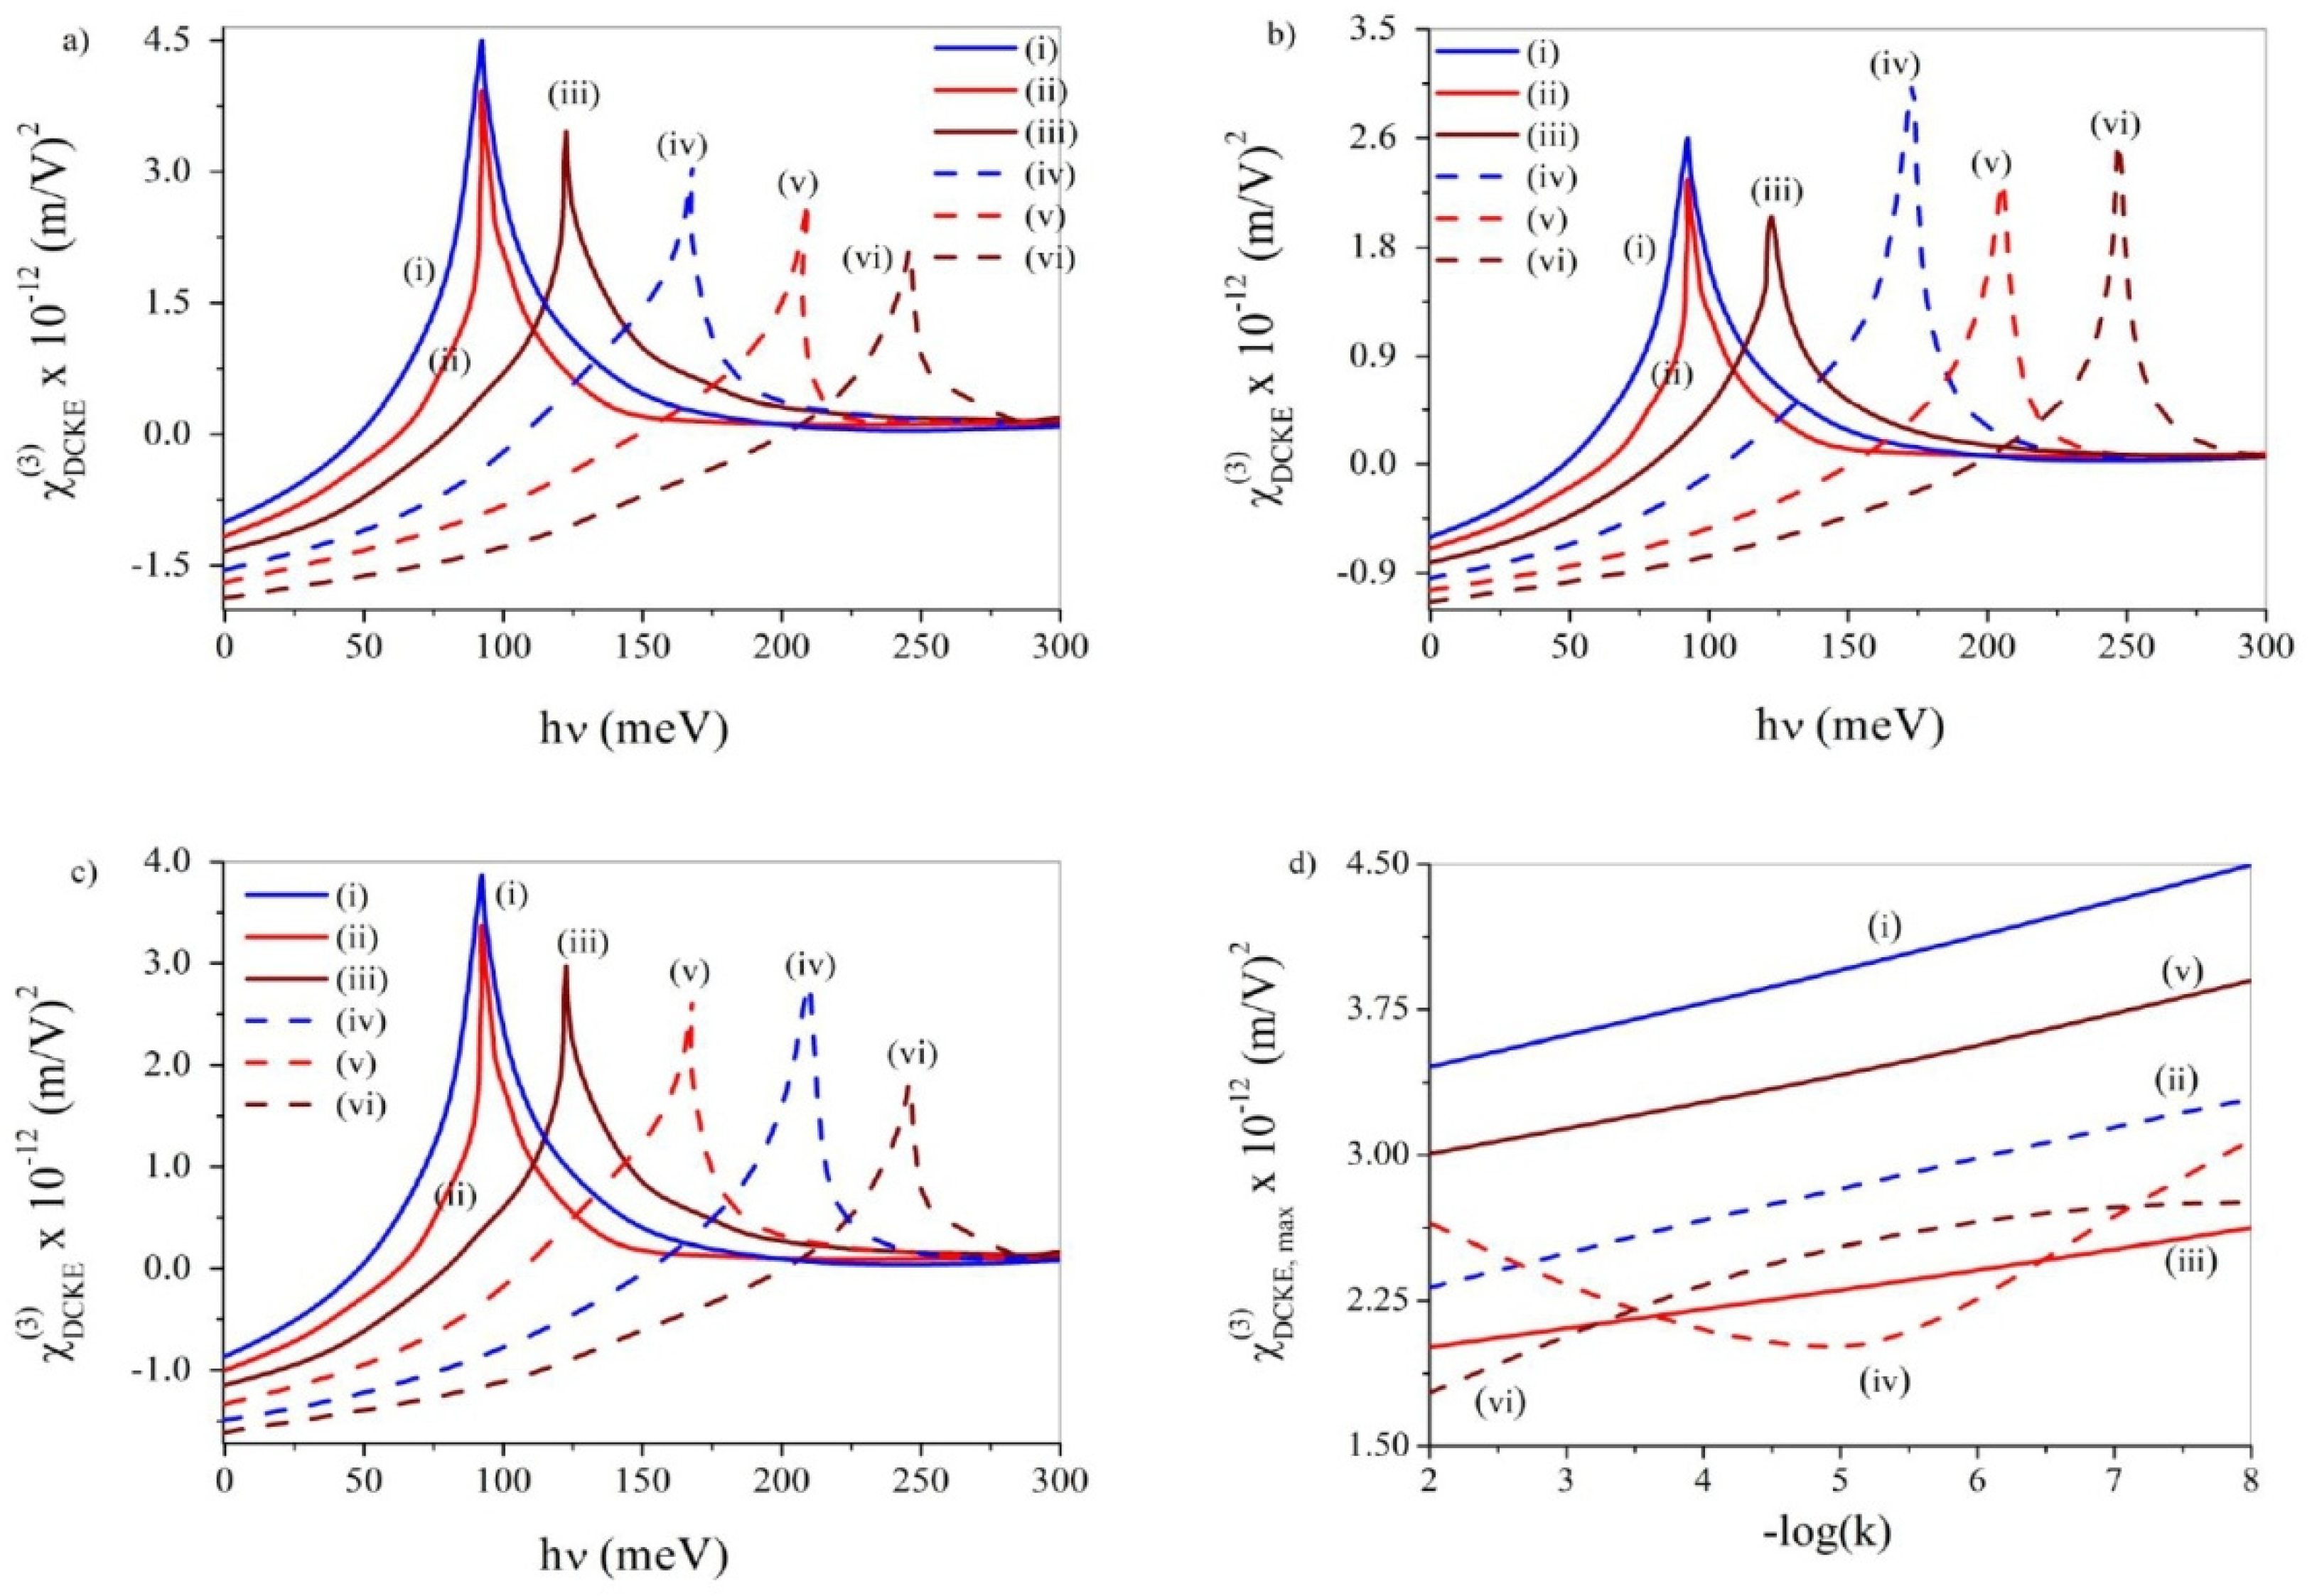
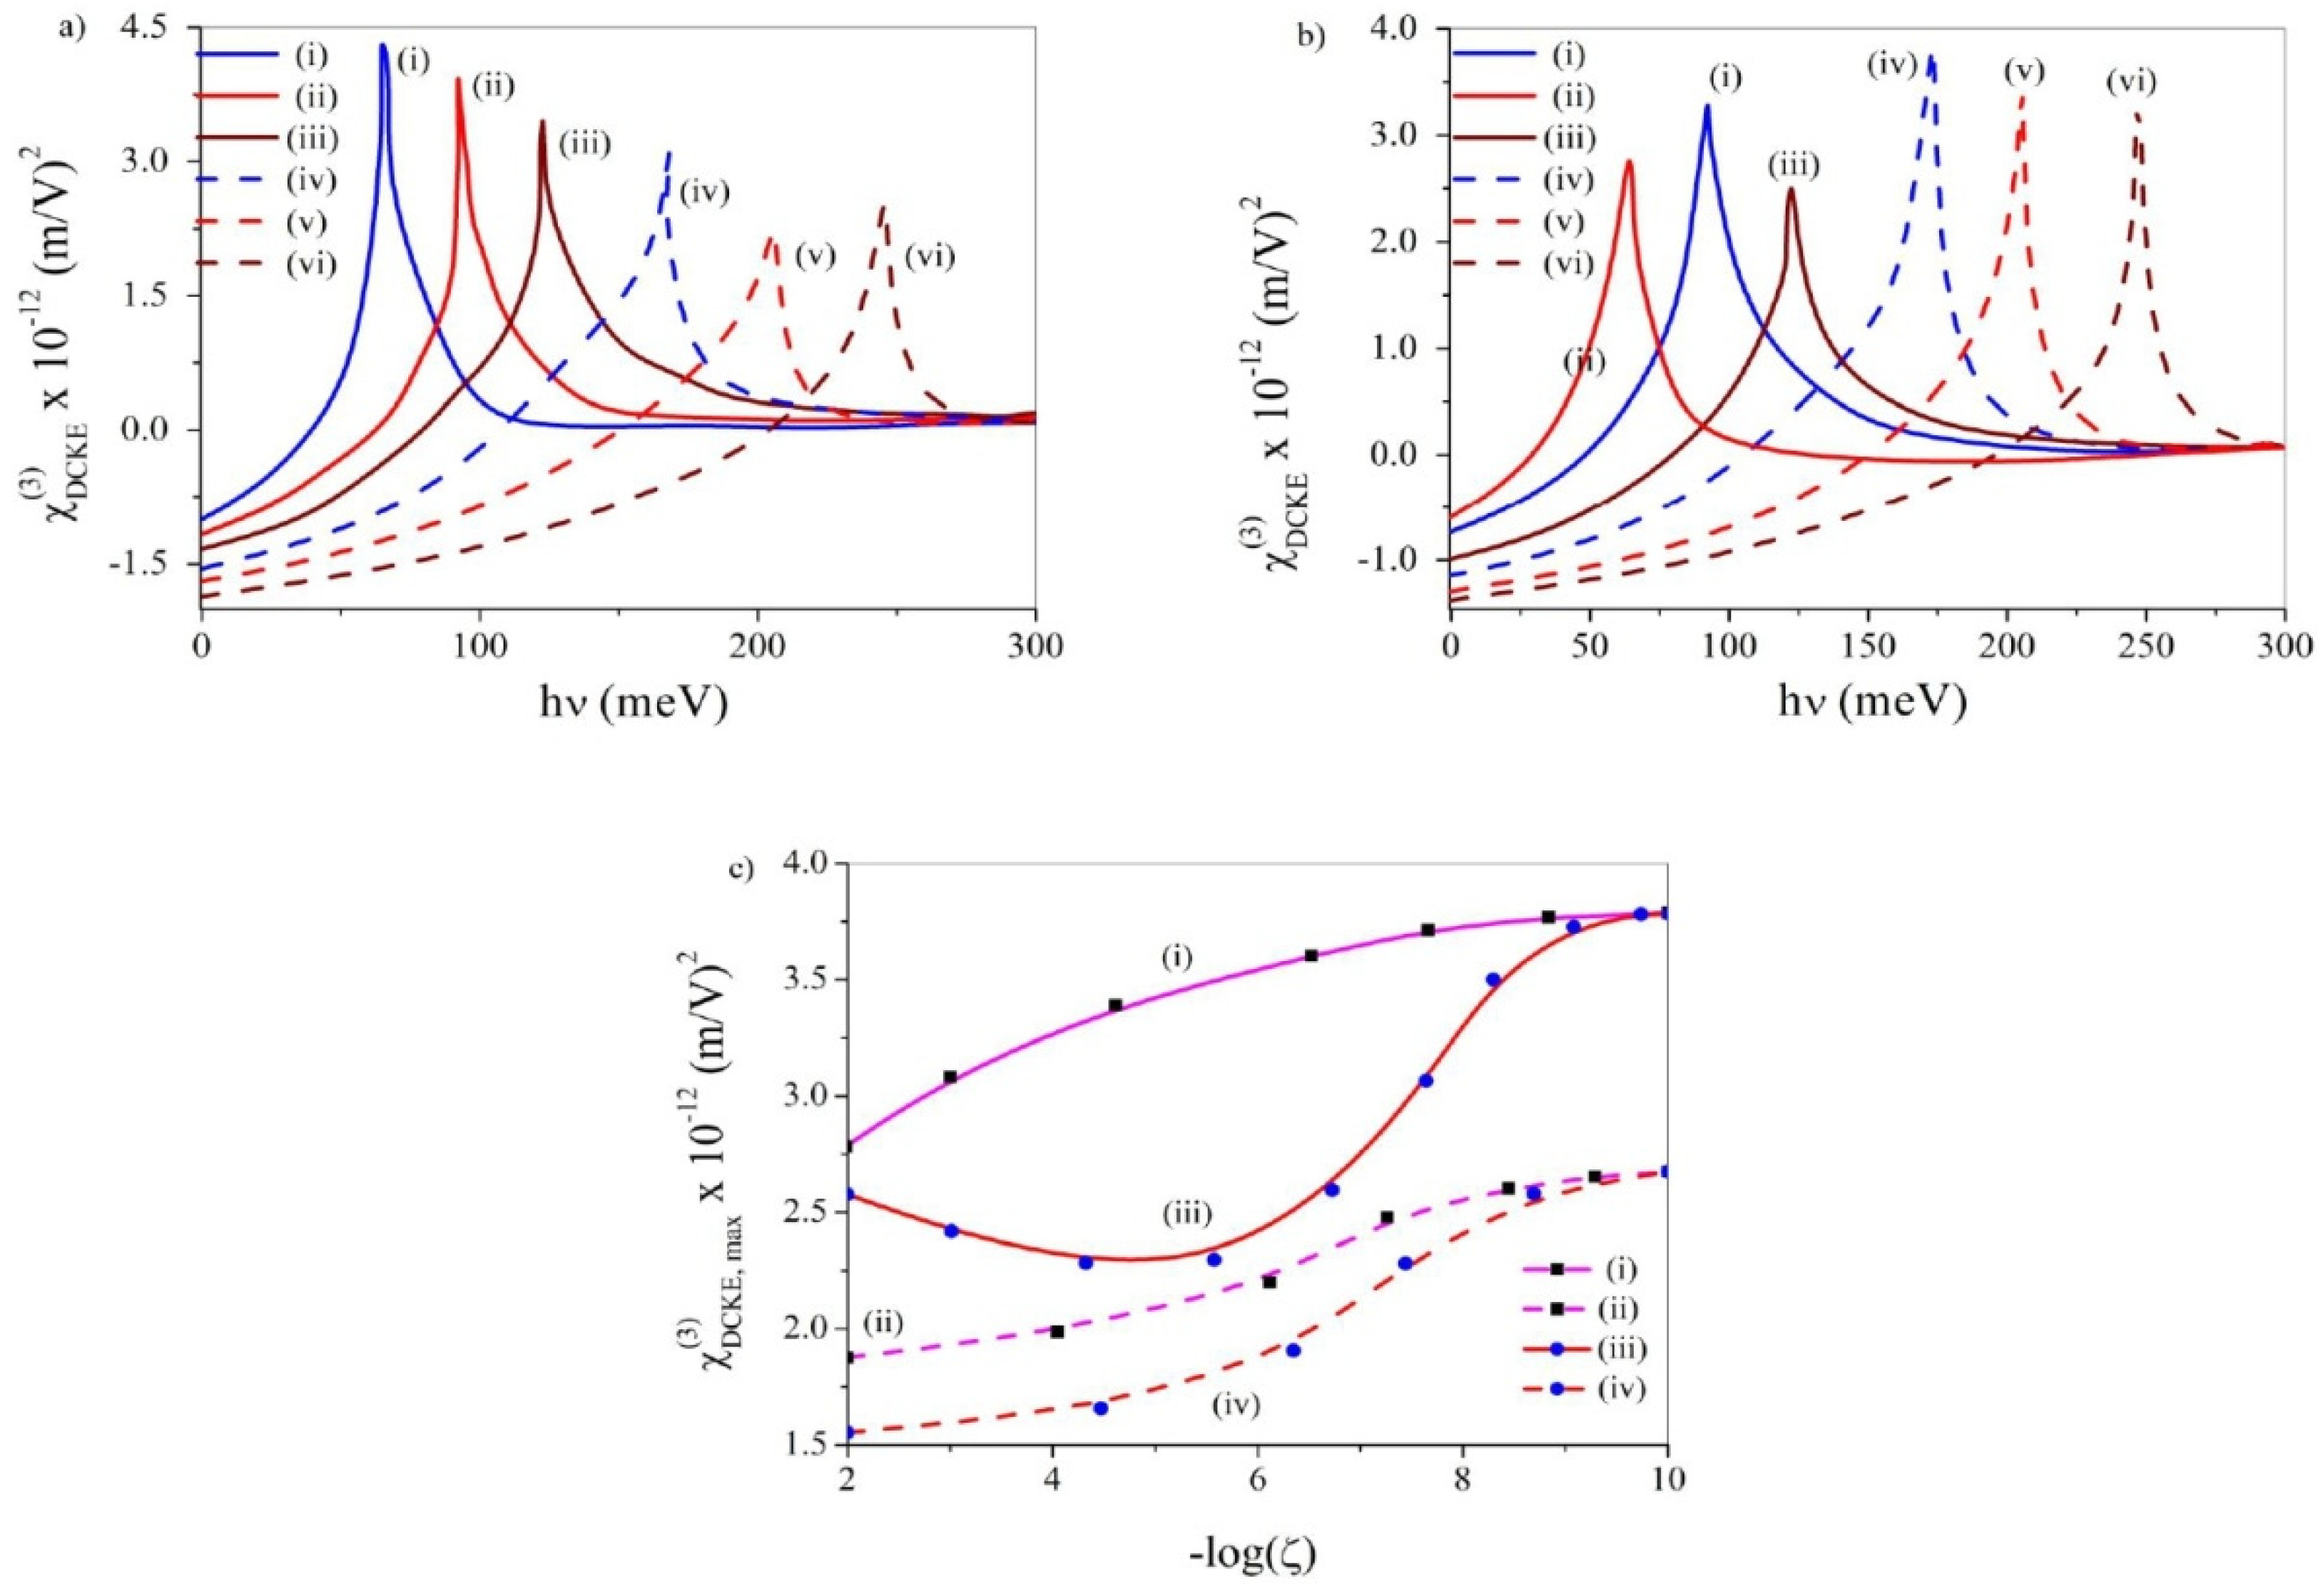
Figure 13a–c delineates the DCKE diagrams against the incoming radiation frequency (υ) for both OPA and EPA without noise and with ADWN and MLWN, respectively, for three different values of k viz. 10−8, 10−5 and 10−2. In the presence of both OPA and EPA and without noise, the DCKE peaks manifest blue-shift and the regular drop of peak height as k increases.
With ADWN and under odd anharmonic potential the DCKE peaks undergo blue-shift and monotonic drop of peak altitude as k enhances. However, with EPA, the blue-shift again occurs but the peak altitude becomes minimumk ~ 10−5.
Under applied MLWN and with OPA the DCKE peak again shows blue-shift and the regular drop of peak altitude as k enhances. However, with EPA the peak shift loses its regularity. Now, initially the DCKE peak reveals red-shift up to k ~ 10−5 and then blue-shift as k increases beyond. The peak altitude shows similar trend as with OPA.
Above rise (drop) in the DCKE peak height under different conditions arises owing to enhancement (depletion) in the overlap integral between the relevant eigenstates, which is connected with the polarization of the wave functions [48]. On the other hand, the shift (blue/red) of DCKE peaks results from change in the energy level separation due to change in quantum confinement as k changes.
Figure 13d depicts the plots of DCKE peak values with the alteration of k in the presence and absence of noise, both with OPA and EPA. These diagrams comply well with the outcomes discussed above. Except the combination of ADWN and EPA, in all other situations, the profiles exhibit regular drop with an increase in k. Only for the special combination mentioned above did we observe the distinct minimization of DCKE peak values at k ~ 10−5.
Figure 14a,b displays the EAC profiles with the variation of υ both under applied ADWN and MLWN for OPA and EPA, respectively, for three different values of ζ viz. 10−2, 10−6 and 10−10, at a fixed value of k = 10−4. With OPA and both under applied ADWN and MLWN, the DCKE peak reveals blue-shift. However, the DCKE peak height changes in different ways in the presence of ADWN and MLWN. Under ADWN the peak altitude falls regularly as ζ enhances whereas with MLWN the peak altitude minimizes at ζ ~ 10−6.
With EPA and under applied ADWN, the DCKE peaks depict initial red-shift up to ζ ~ 10−6 followed by a blue-shift as ζ increases further. However, under applied MLWN, the DCKE peaks depict uniform blue-shift as ζ increases. The peak altitude, on the other hand, undergoes steady decline with an increase in ζ both under applied ADWN and MLWN.
Figure 14c describes the profiles of DCKE peak values against ζ under applied ADWN and MLWN, both with OPA and EPA. In these profiles the value of k is kept fixed at k = 10−4. In compliance with the earlier observations the plot evinces perceptible minimization at ζ ~ 10−5, only with odd anharmonicity and under applied MLWN. For all other conditions the said plots reveal steady drop as noise strength increases.
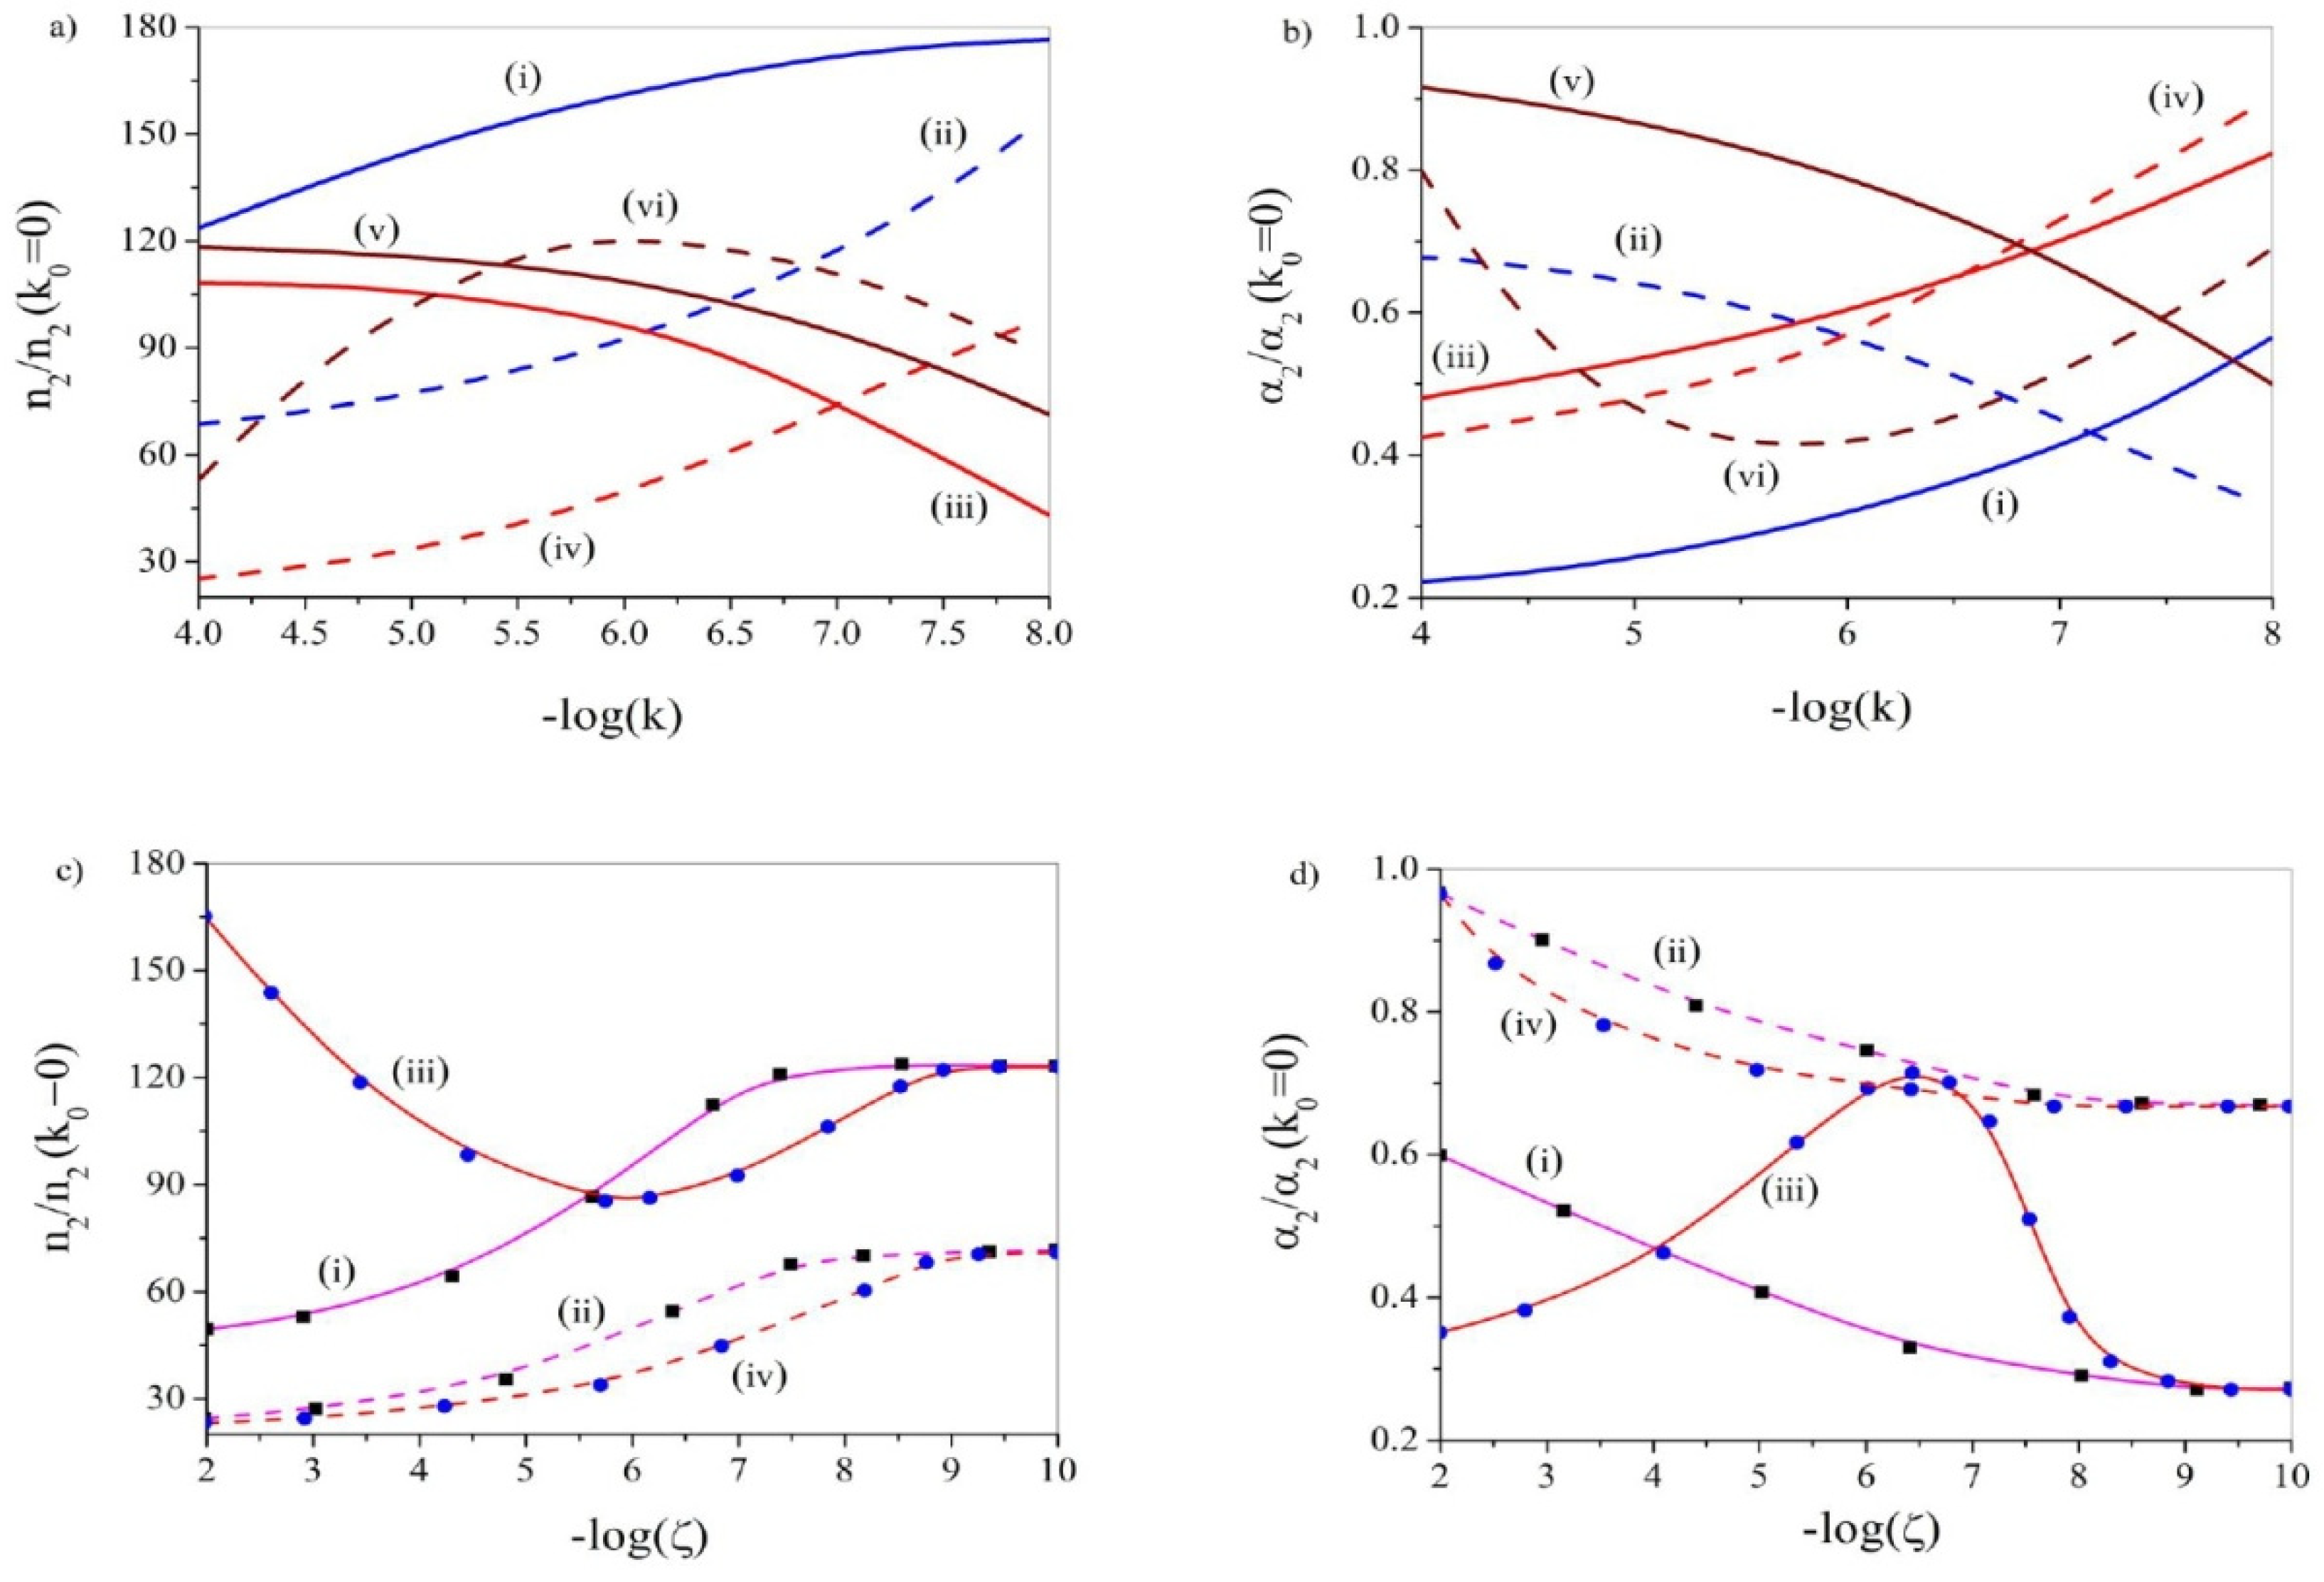
For Kerr-type nonlinearities the refractive index (RI) and absorption coefficient (AC) are given by n = n0 + n2I and α = α0 + α2I where n, n0, n2, α, α0, α2 and I are total RI, linear RI, nonlinear RI, total AC, linear AC, nonlinear AC and the intensity of electromagnetic wave, respectively. In practice, the expressions of n2 and α2 are substantially modified when we shift from non-absorbing to absorbing medium. This necessitates the estimation of corrections required to the values of n2 and α2 in absorbing materials in comparison with the non-absorbing medium. The above corrections are related to the ratios of linear AC and linear RI and that of imaginary and real parts of χ(3). Thus, in view of achieving recognizable refractive nonlinearities and nonlinear absorption effects, the above correction factors (CFs)emerge immensely important [55]. A variation of anharmonic potential of given symmetry under applied noise can be exploited to modulate above CFs quite effectively.
The ratio or CF relevant to nonlinear RI in absorbing and non-absorbing media reads [55]:
n 2 n 2 k 0 = 0 = 1 + k 0 2 n 0 2 1 1 + k 0 χ I 3 n 0 χ R 3
where K 0 = λ α 0 4 π , λ being the wavelength of incident radiation, χ I 3 and χ R 3 are the imaginary and real parts of χ(3), respectively. Similarly, the CF relevant to nonlinear AC in absorbing and non-absorbing media can be given by [55]:
α 2 α 2 k 0 = 0 = 1 + k 0 2 n 0 2 1 1 k 0 χ R 3 n 0 χ I 3
Figure 15a describes CF for RI with the change of k for both OPA and EPA without noise and with ADWN and MLWN. Both with odd and even anharmonicities and under noise-free condition the CF for RI steadily decreases with an increase in anharmonicity constant. Under applied ADWN, the CF for RI increases (decreases) in the presence of odd (even) anharmonicity with an increase in k. Under applied MLWN, the CF for RI reveals a steady enhancement with an increase in k with odd anharmonicity. Under the same condition the CF for RI depicts maximization at k ~ 10−6even when anharmonicity is present.
Figure 15b describes CF for AC as a function of k for both OPA and EPA without noise and with ADWN and MLWN. In the presence of odd (even) anharmonicity and under noise-free condition the CF for AC depict regular fall (rise) with an increase in k. Under applied ADWN, the CF for AC decreases monotonically with an increase in k both for odd and even anharmonicities. Under applied MLWN the CF for AC manifests steady growth with an increase in k with odd anharmonicity. Under the same condition the CF for AC exhibits minimization at k ~ 10−6even when anharmonicity is present.
Figure 15c manifests CF for RI as a function of ζ for both odd and even anharmonicities in the presence of ADWN and MLWN keeping k fixed at k = 10−4. Under applied ADWN, and both with odd and even anharmonicities, the CF for RI undergoes monotonic enhancement with a decrease in the noise strength and finally saturates at low noise strength domain. Under applied MLWN, on the other hand, the CF for RI displays minimization at ζ ~ 10−6 in the presence OPA. However, under EPA the CF for RI enhances with weakening of the noise strength and culminates in saturation in the low noise strength regime.
Figure 15d delineates CF for AC as a function of ζ for both odd and even anharmonicities in the presence of ADWN and MLWN keeping k fixed at k = 10−4. Under the influence of ADWN, and both with OPA and EPA, the CF for AC undergoes steadfast depletion with a drop in the noise strength and ultimately saturates at the low noise strength domain. Under applied MLWN, on the other hand, the CF for AC displays maximization at ζ ~ 10−6.5 in the presence OPA. However, in the presence of EPA, the CF for AC again declines with a reduction in the noise strength and shows saturation in the low noise strength domain.

3.8. Group Index (GI)

GI is a well-known NLO property of LDSS, which is closely linked with the production of slow and fast light [56,57,58]. GI is a measure of the factor by which the group velocity of light is smaller than the speed of light in vacuum and reads ng = c/vg. GI possesses tremendous importance in optical communication and information processing [59]. GI is defined as [59]:
n g = n + ν d n d ν
where υ is the frequency of the impinging radiation and n = n ν 1 + R e χ 1 + 1 2 R e χ is the refractive index of the optical material, where χ is the susceptibility to the third-order of electric field.
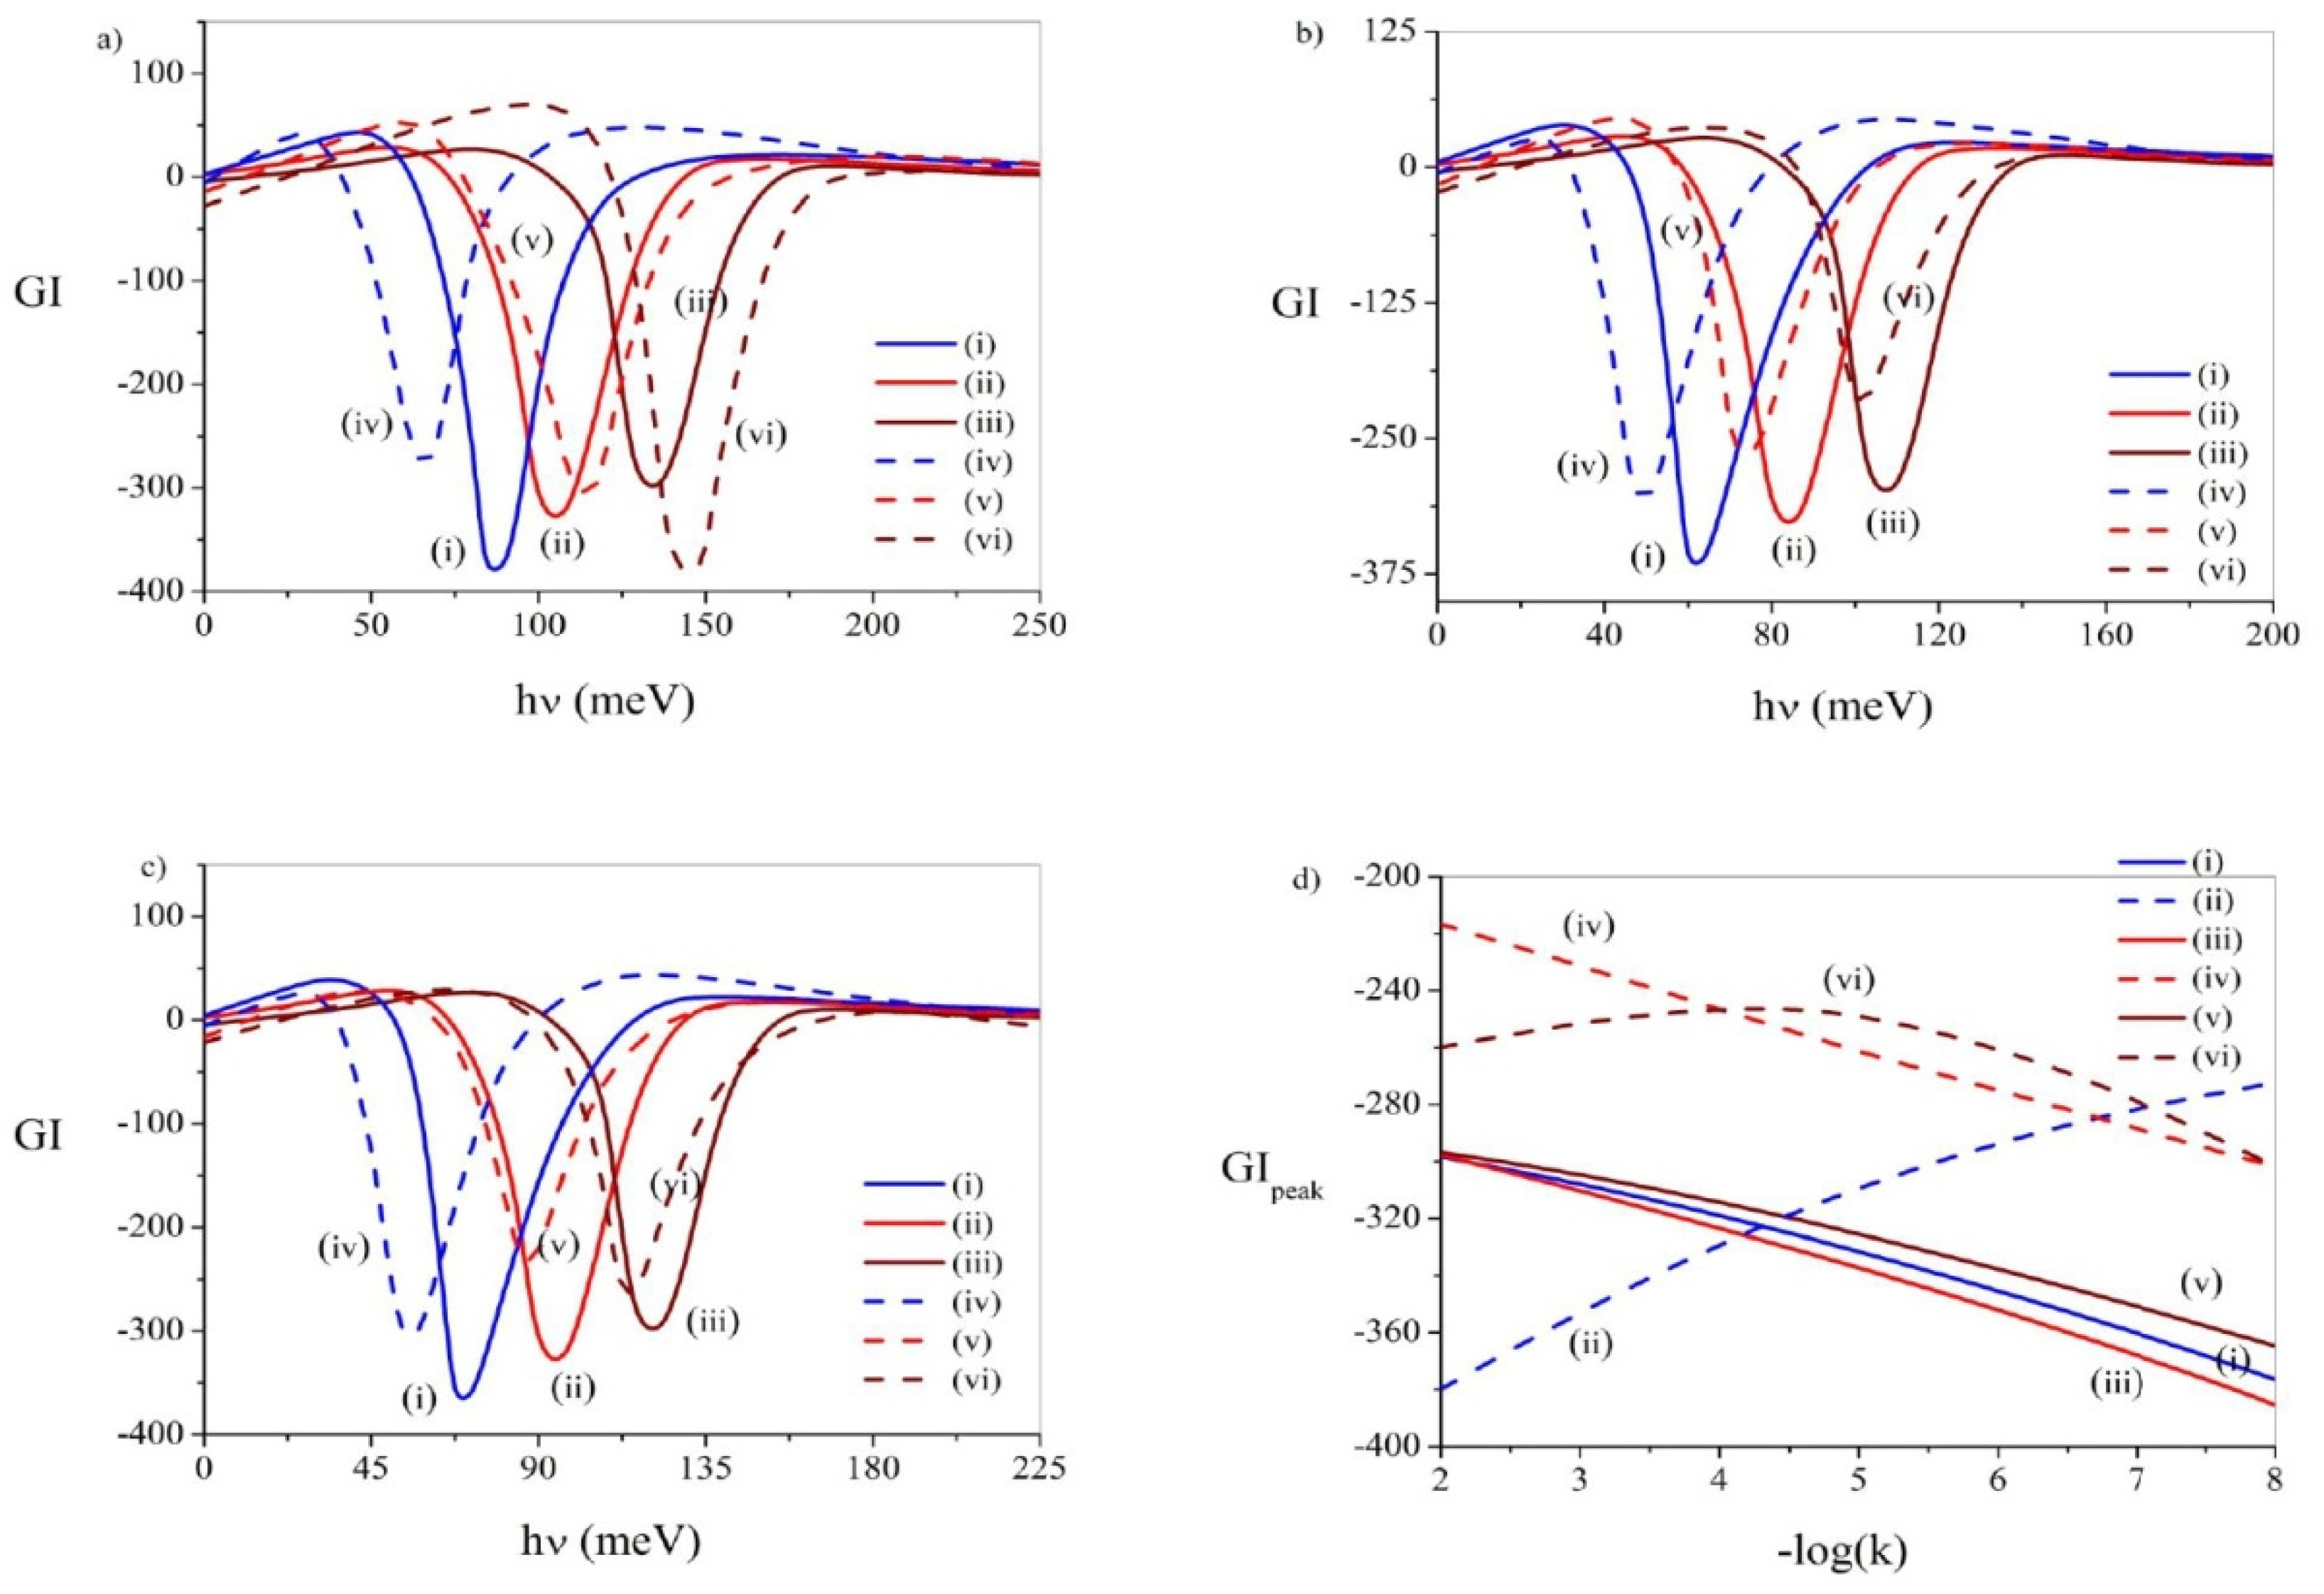
Figure 16a–c depicts the GI diagrams against υ for both OPA and EPA without noise and with ADWN and MLWN, respectively, for three different values of k viz. 10−8, 10−5 and 10−2. Under a noise-free state, both in the presence of odd and even anharmonicities, the GI peaks exhibit blue-shift. Moreover, in both the cases distinct GI minima are observed over the range of k values. However, the depth of the minima persistently falls (rises) as k increases with odd (even) anharmonicity.
Under applied ADWN, both with OPA and EPA, the GI peaks depict blue- shift with an increase in k accompanied by a persistent fall of the depth of the GI minima. Under applied MLWN, as before, both with OPA and EPA, the GI peaks evince blue-shift as k increases. However, the change in the depth of the GI minima with an increase in k becomes different with odd and even anharmonicities. Whereas with odd anharmonicity the depth of the GI minima decreases regularly as k enhances, in the presence of EPA the depth of the GI minima appears smallest at k ~ 10−5.
Figure 16d demonstrates the diagrams of GI peak values with the variation of k in the presence and absence of noise, both with OPA and EPA. These profiles further elucidate the findings described above. Under OPA and irrespective of applied noise, the depth of the GI minima reveals a persistent drop with an increase in k. However, with EPA, the aforesaid depth undergoes steady rise in the absence of noise (as k increases), steady fall under applied ADWN (as k increases) and minimization at k ~ 10−4.5 under applied MLWN.
In the above plots the blue-shift of GI peaks with an increase in k indicates parallel enhancement in the energy level separations. The GI minimum indicates the emergence of absorption maximum and the domain of anomalous dispersion over a considerable range of k, regardless of the presence of noise and parity of the anharmonicity. The observations come out to be similar in most of the situations when we come across a steady fall in the extent of anomalous dispersion with an increase in the value of anharmonicity constant. However, exceptions are found with even anharmonicity and under a noise-free situation when the anomalous dispersion undergoes a steady rise with an increase in k and with the combination of MLWN and even anharmonicity, when the anomalous dispersion minimizes at k ~ 10−5. Thus, the presence of even anharmonicity brings about more diversities in the features of anomalous dispersion. Furthermore, a suitable combination of applied noise and anharmonicity can modulate the region of anomalous dispersion.
Figure 17a,b display the GI diagrams against υ both under applied ADWN and MLWN for OPA and EPA, respectively, for three different values of ζ viz. 10−2, 10−6 and 10−10 ,keeping k fixed at 10−5. With OPA and both under applied ADWN and MLWN, the depth of the GI minima decreases monotonically as ζ increases. However, the GI peaks exhibit red-shift (blue-shift) in the presence of ADWN (MLWN) as ζ increases. Such behavior reflects a decrease (increase) in the energy interval under applied ADWN (MLWN) as noise strength is increased. Moreover, irrespective of the mode of application of noise, the extent of anomalous dispersion manifestly diminishes with an increase in the noise strength under odd anharmonicity.
Under EPA the shift (blue/red) of the GI peaks with noise strength under applied ADWN and MLWN follows the same trend as found with OPA. In the presence of applied ADWN, the depth of the GI minima becomes largest at ζ ~ 10−6 indicating the highest extent of anomalous dispersion around this noise strength. However, under applied MLWN the depth of the GI minima steadily falls with an increase in the noise strength, indicating an accompanying decline in the extent of anomalous dispersion in the presence of even anharmonicity.
Figure 17c exhibits the diagrams of GI peak values against ζ under applied ADWN and MLWN, both with OPA and EPA, keeping k fixed at k = 10−5. The profiles manifest that, barring the combination of ADWN and EPA, in all other conditions the depth of the GI minima continually declines with the enhancement of ζ. It is the particular combination referred to above for which the depth of the GI minima maximizes at ζ ~ 10−6. Thus, it becomes possible to regulate the region of anomalous dispersion by the suitable adjustment of the parity of the anharmonic potential, the noise mode and the value of the noise strength.

3.9. Optical Gain (OG)

OG is considered as an important NLO property for determining the optimum output by LDSS in view of laser operation. OG in QD lasers invites rigorous research works thanks to their typical features such as unique tunability, temperature stability and lower threshold currents. We can, therefore, come across extensive studies on OG of LDSS [60,61,62,63,64,65,66,67,68,69]. OG is given by [62]:
g E = π e 2 ћ σ v E M f i 2 ϵ n r c m 0 2 w E f c E f v E
where m0, e, w , σv, ε, nr and E are the free electron mass, electronic charge, well width, charge density, dielectric constant of medium, refractive index and the transition energy between VB and CB corresponding to photon energy, respectively. M f i = ψ f | r | ψ i is the transition matrix element with ψi and ψf as the initial and final wave functions for the optical transition between hole subbands and electron subbands. fc and fv are the Fermi-Dirac distribution function of electrons in CB and VB, respectively, given by [65]:
f c = 1 1 + exp   E n c E f c / k B T
and
f v = 1 1 + exp   E n v E f v / k B T
where Enc and Env are the quantized electron and hole energy levels, respectively, and Efc and Efv are the electron and hole quasi-Fermi level, respectively.
The gain radiative current density connected with the spontaneous emission rate reads [62]:
J E = e ω R s p E d E
where Rsp is the spontaneous emission rate given by [62]:
R s p E = e 2 n r E σ v E M f i 2 π ϵ ћ 2 c 3 m 0 2 ω f c E 1 f v E
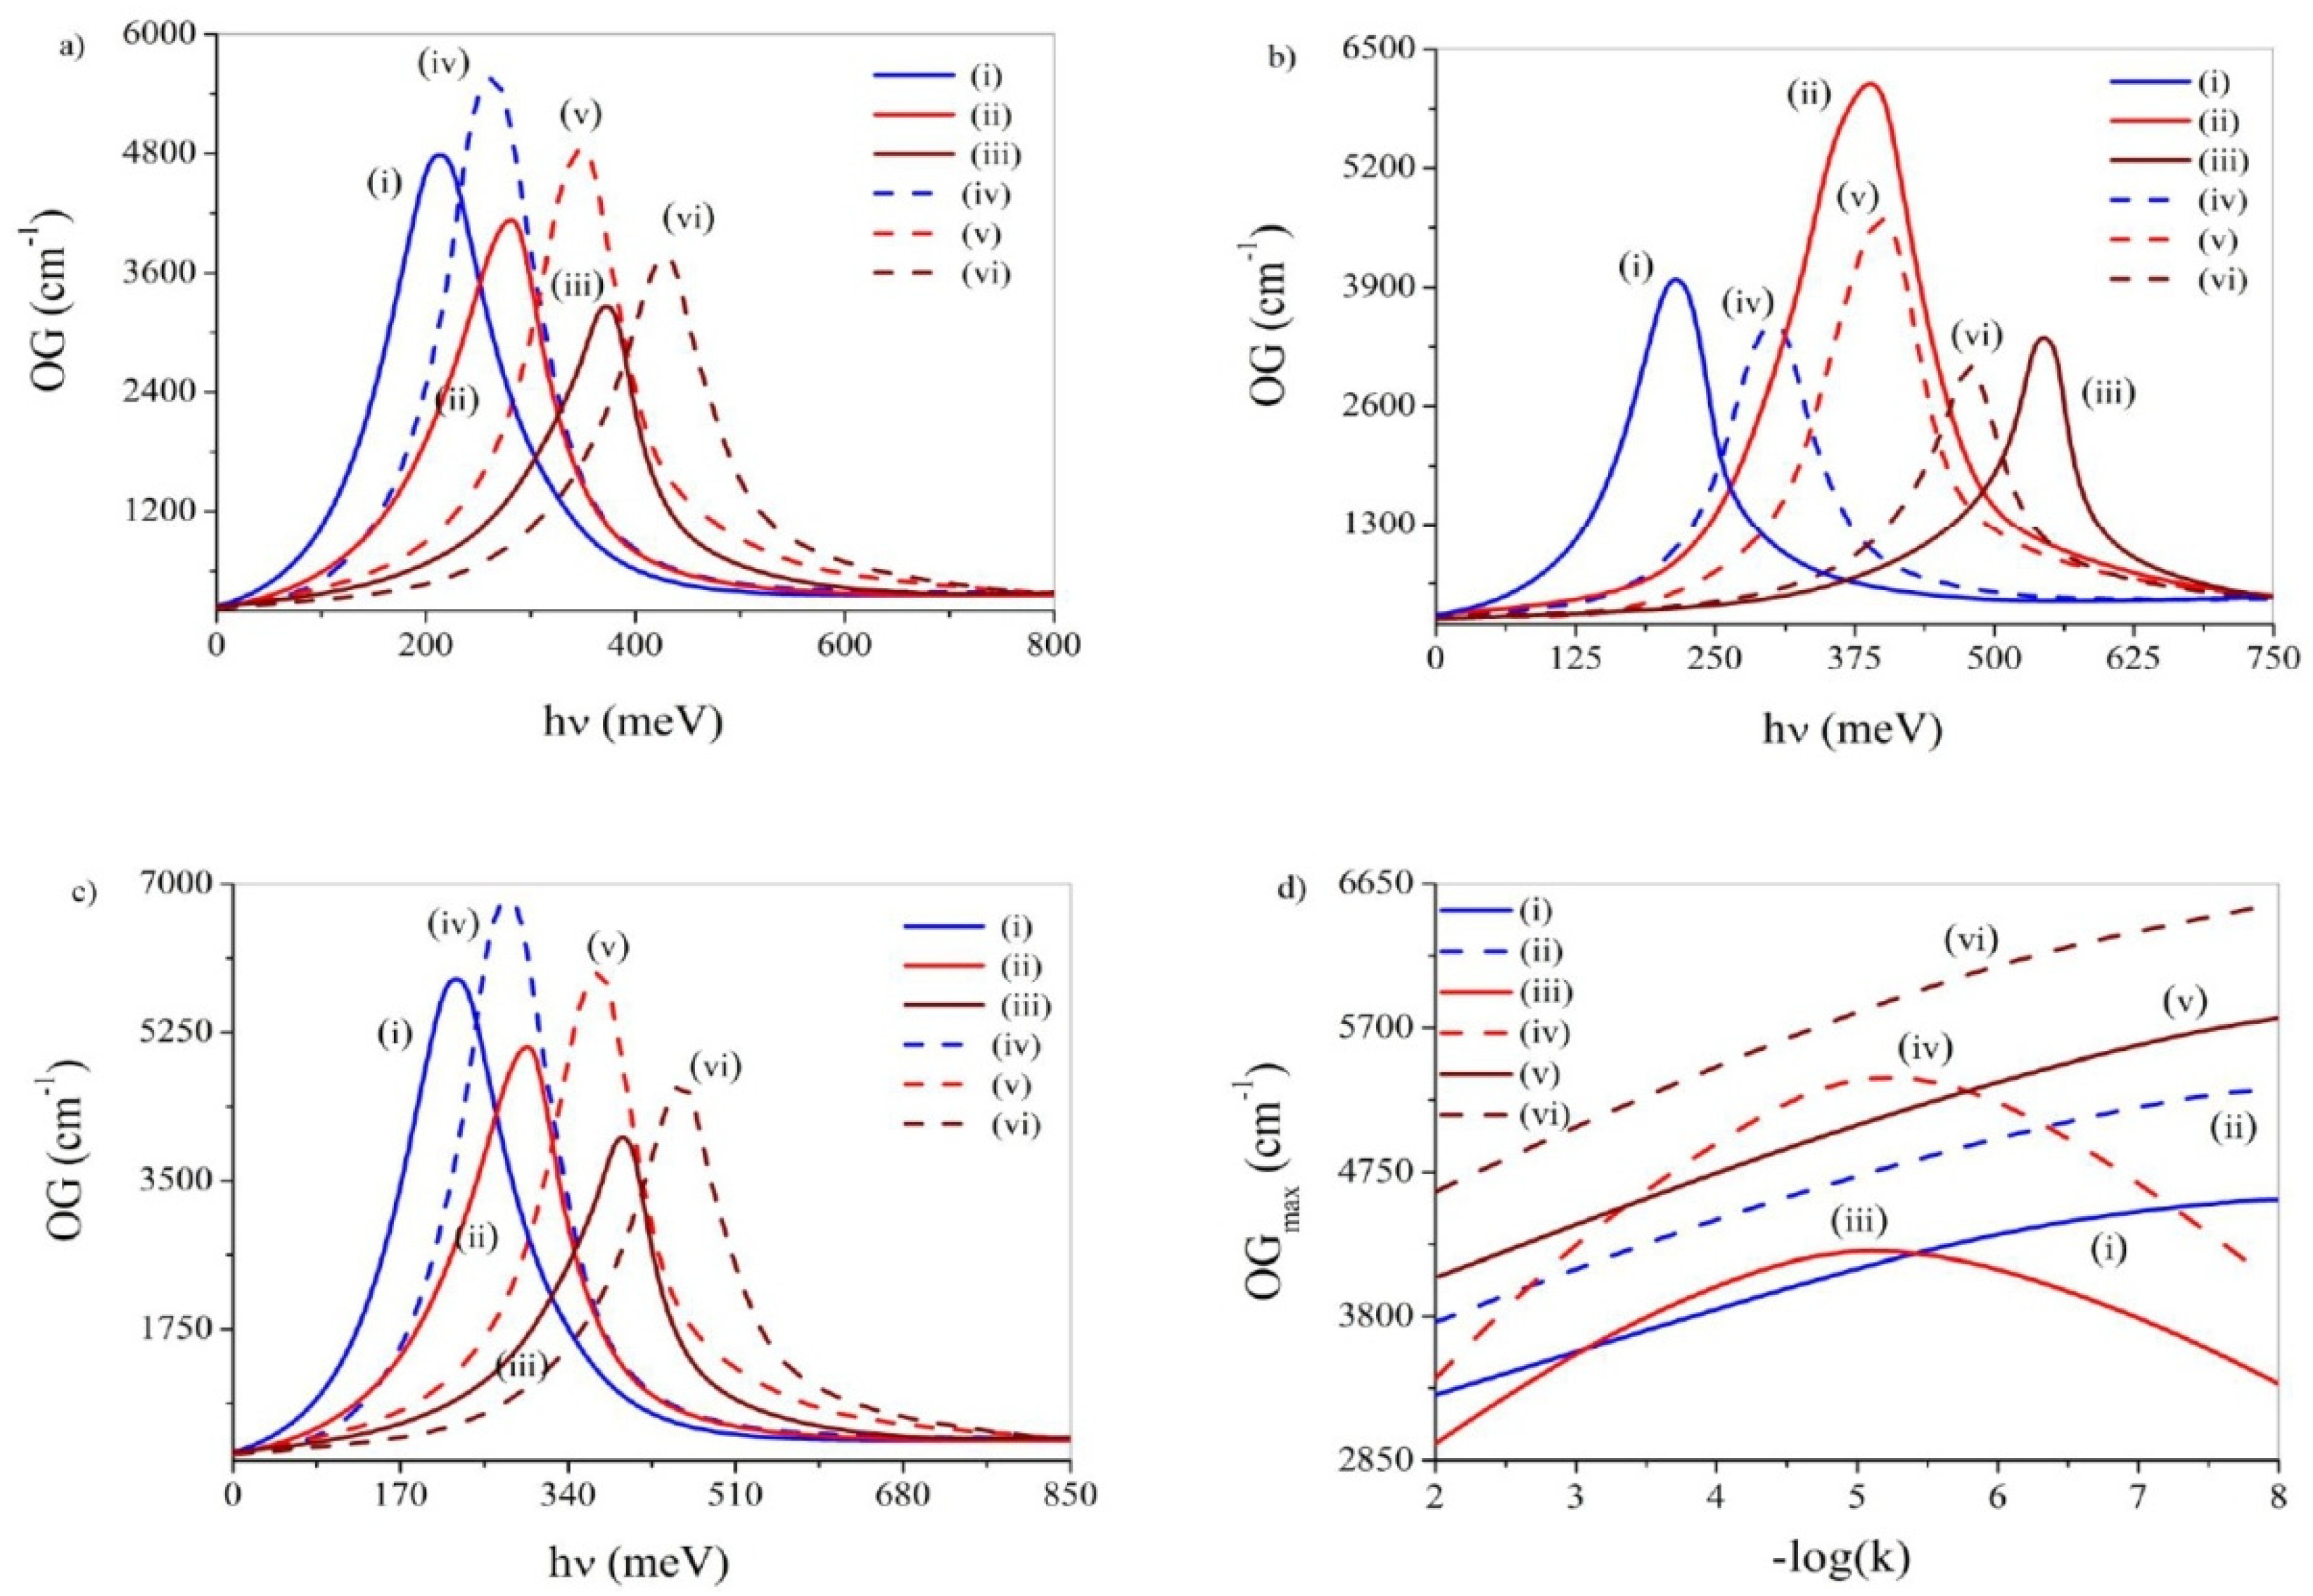
Figure 18a–c depicts the OG profiles against the incoming υ for both OPA and EPA without noise and with ADWN and MLWN, respectively, for three different values of k viz. 10−8, 10−5 and 10−2. Under a noise-free state, both in the presence of OPA and EPA, the OG peaks display blue-shift along with a regular drop in the OG peak altitude as k enhances.
Under applied ADWN, both with OPA and EPA, the OG peaks display blue-shiftas k increases and are accompanied by the emergence of maximization at k ~ 10−5. Under applied MLWN, both with OPA and EPA, the OG peaks delineate blue-shift with steady decline in the peak altitude with an increase in k. Thus, for a given environment (noise-free/under ADWN/under MLWN), the symmetry of the anharmonicity does not qualitatively alter the OG profiles.
Figure 18d shows the plots of OG peak values against k in the presence and absence of noise, both with OPA and EPA. These diagrams further support the findings outlined above. Without noise and under applied MLWN, the OG peak values delineate and steadily fall as k increases. However, under applied ADWN, the said peak values evince distinct maximization around k ~ 10−5. The above behavior holds good regardless of the symmetry of the anharmonic potential.
Figure 19a–c manifests the diagrams of gain radiative current density (J) vs. −log(k), OG peak vs. J and band gap vs. −log(k), respectively, with and without noise, both for odd and even anharmonicities. The current density depicts monotonic drop with the enhancement of k in a noise-free state and under applied MLWN. However, under applied ADWN, the current density depicts maximization around k ~ 10−5. The above behavior is observed both for odd and even anharmonic potentials (Figure 19a). Figure 19b shows that, regardless of the presence of noise and parity of the anharmonicity, the OG peak increases manifestly with J. In all the cases, the OG peaks settle to some steady values for large values of J (the saturation gain). Thus, here the noise mode and the symmetry of the anharmonicity do not qualitatively influence the observed outcome. Figure 19c depicts a prominent rise in band gap as with the enhancement of k without noise and under MLWN. However, under applied ADWN, the band gap undergoes minimizationaround k ~ 10−5. The above behavior emerges both for odd and even anharmonic potentials.
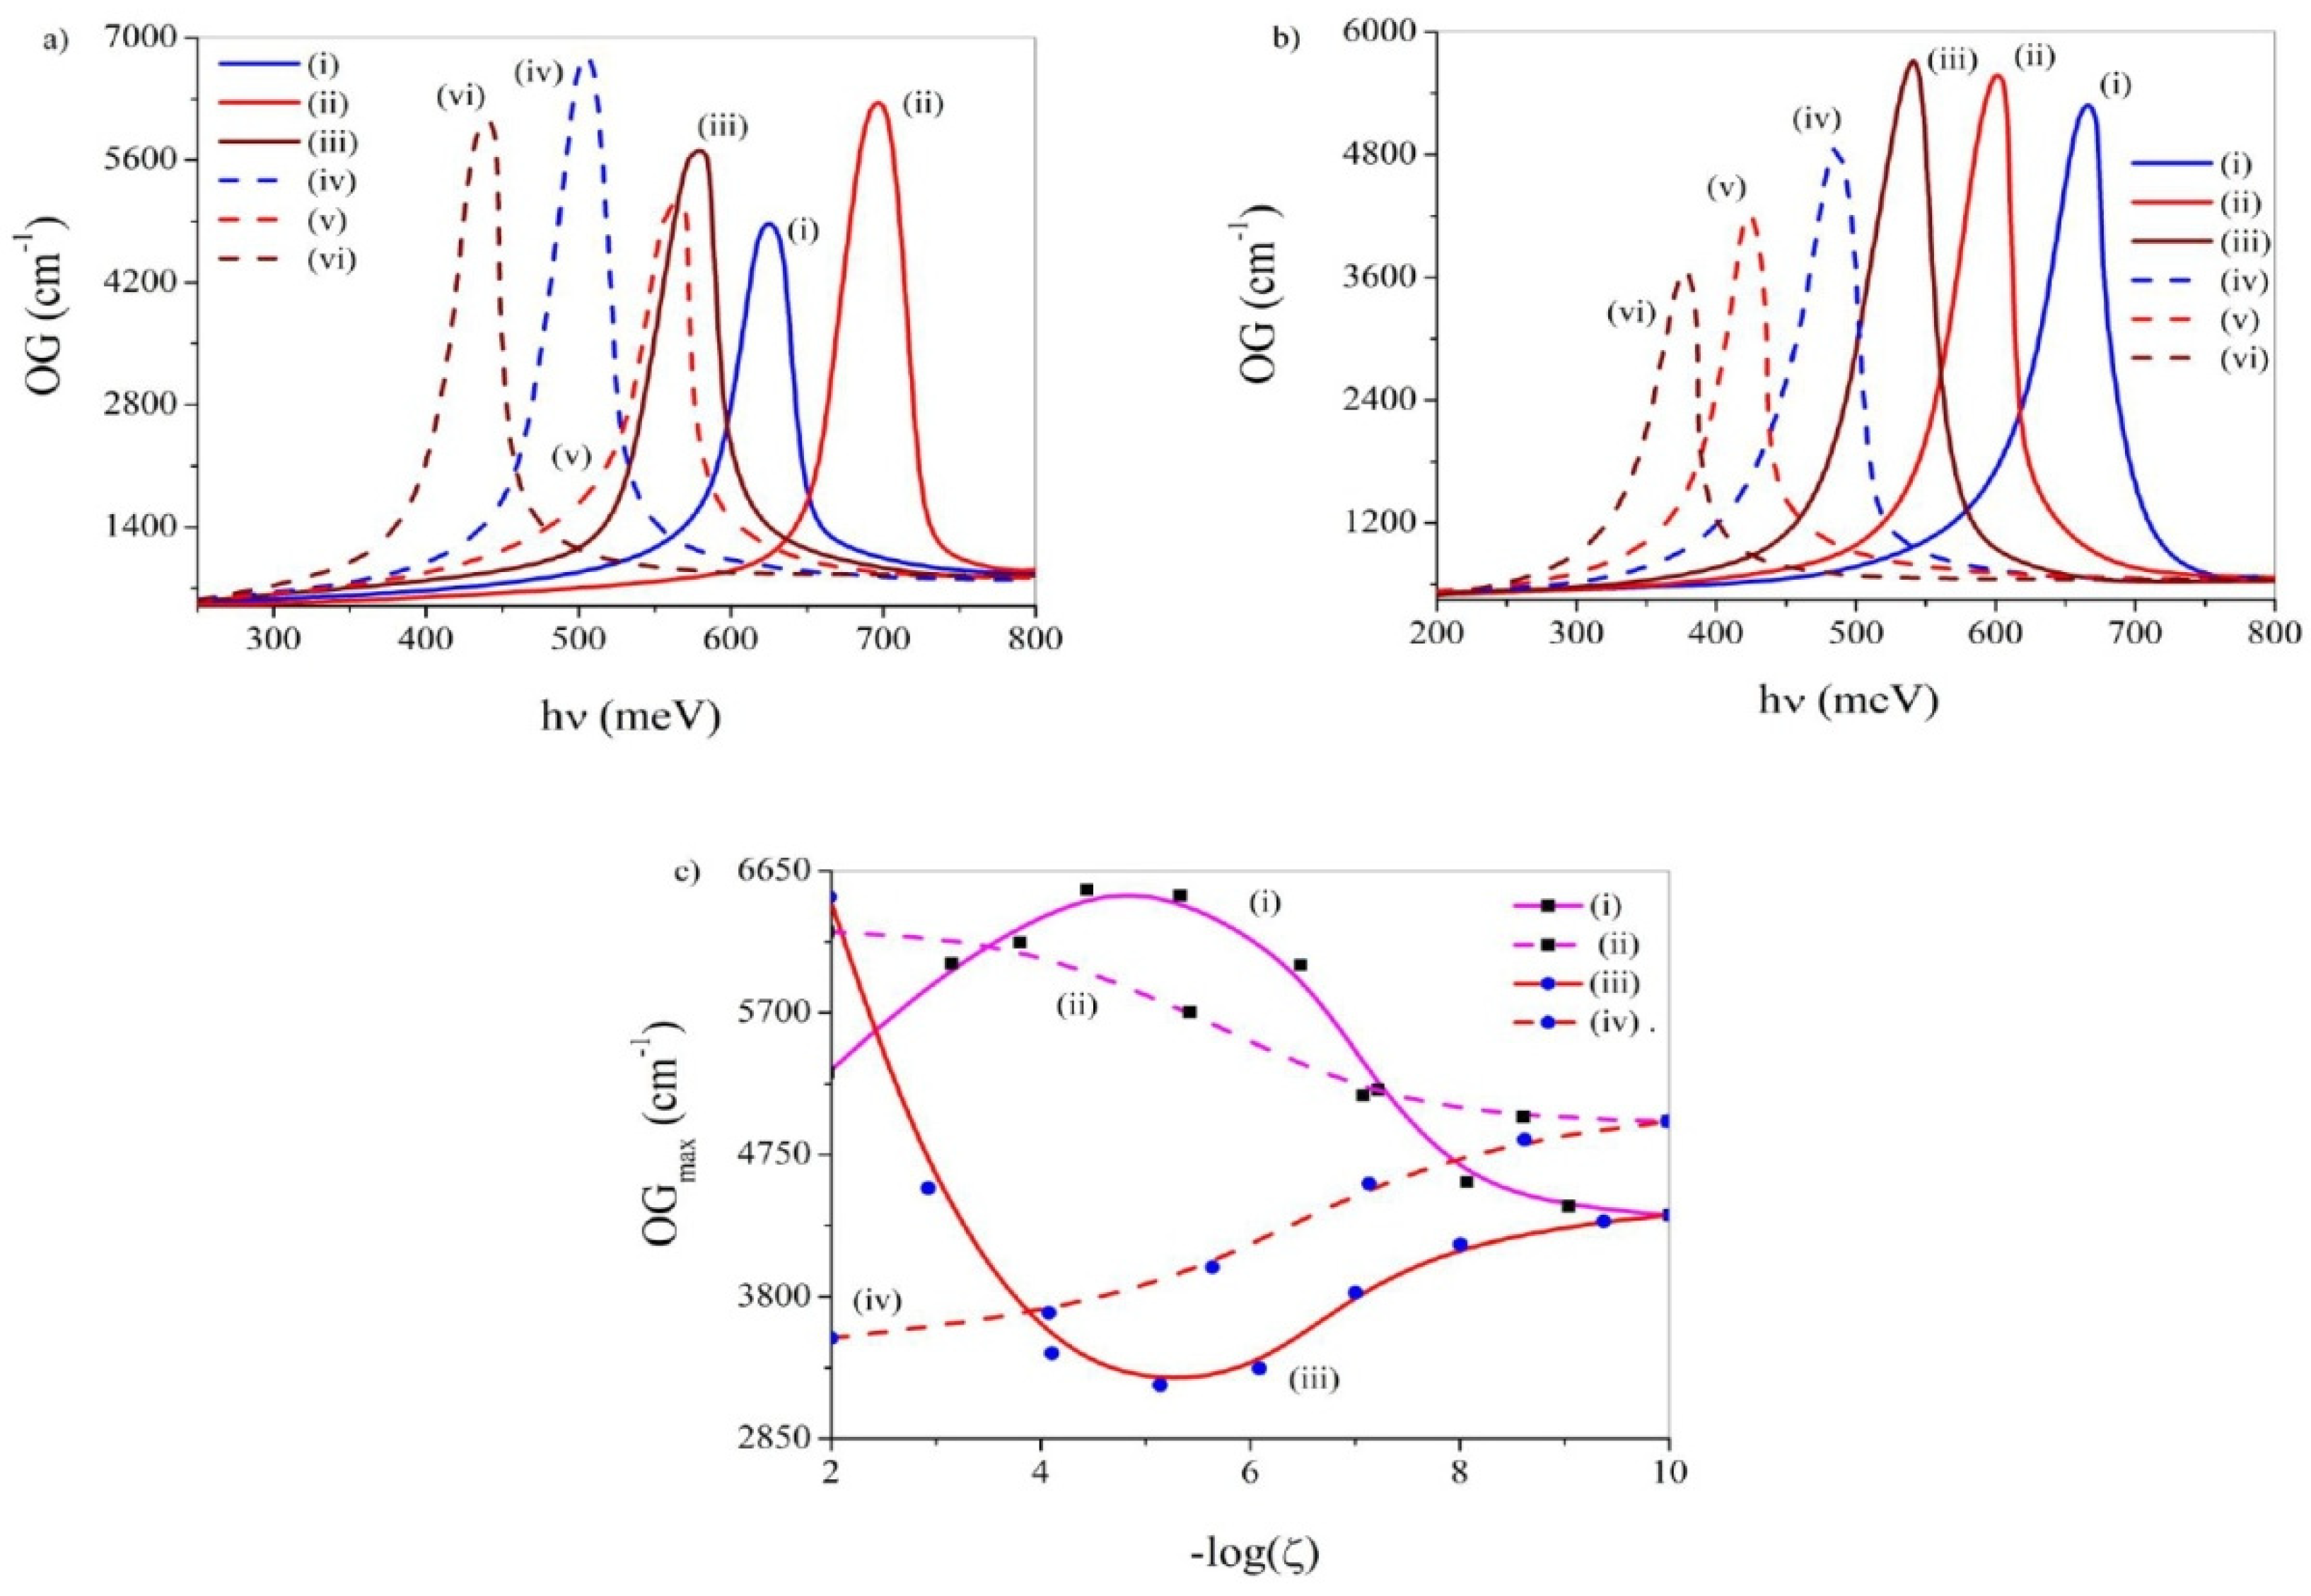
Figure 20a,b discerns the OG plots over a range of for three different values of the noise strength ζ (10−10, 10−6 and 10−2) for ADWN and MLWN, respectively, both with OPA and EPA. In all these diagrams k assumes the fixed value of 10−6. With OPA and both with ADWN and MLWN the OG peak at first undergoes blue-shift with an increase in ζ up to ζ ~ 10−6 followed by a red-shift as ζ is increased further. Furthermore, the OG peak height also shows maximization (minimization) at ζ ~ 10−6 under applied ADWN (MLWN).
Under EPA the OG peak undergoes red-shift as ζ increases both with ADWN and MLWN. However, the peak height manifests persistent rise (fall) with an increase in the noise strength under applied ADWN (MLWN).
Figure 20c depicts the plots of OG peak values against ζ under applied ADWN and MLWN, both with OPA and EPA for k = 10−6. In the presence of OPA the OG peaks display distinct maximization (minimization) at ζ ~ 10−5 under applied ADWN (MLWN). However, with EPA, the said peak values divulge steady rise (fall) as ζ enhances under applied ADWN (MLWN). In all situations, the OG peaks approach their respective noise-free values when the noise strength becomes extremely small.
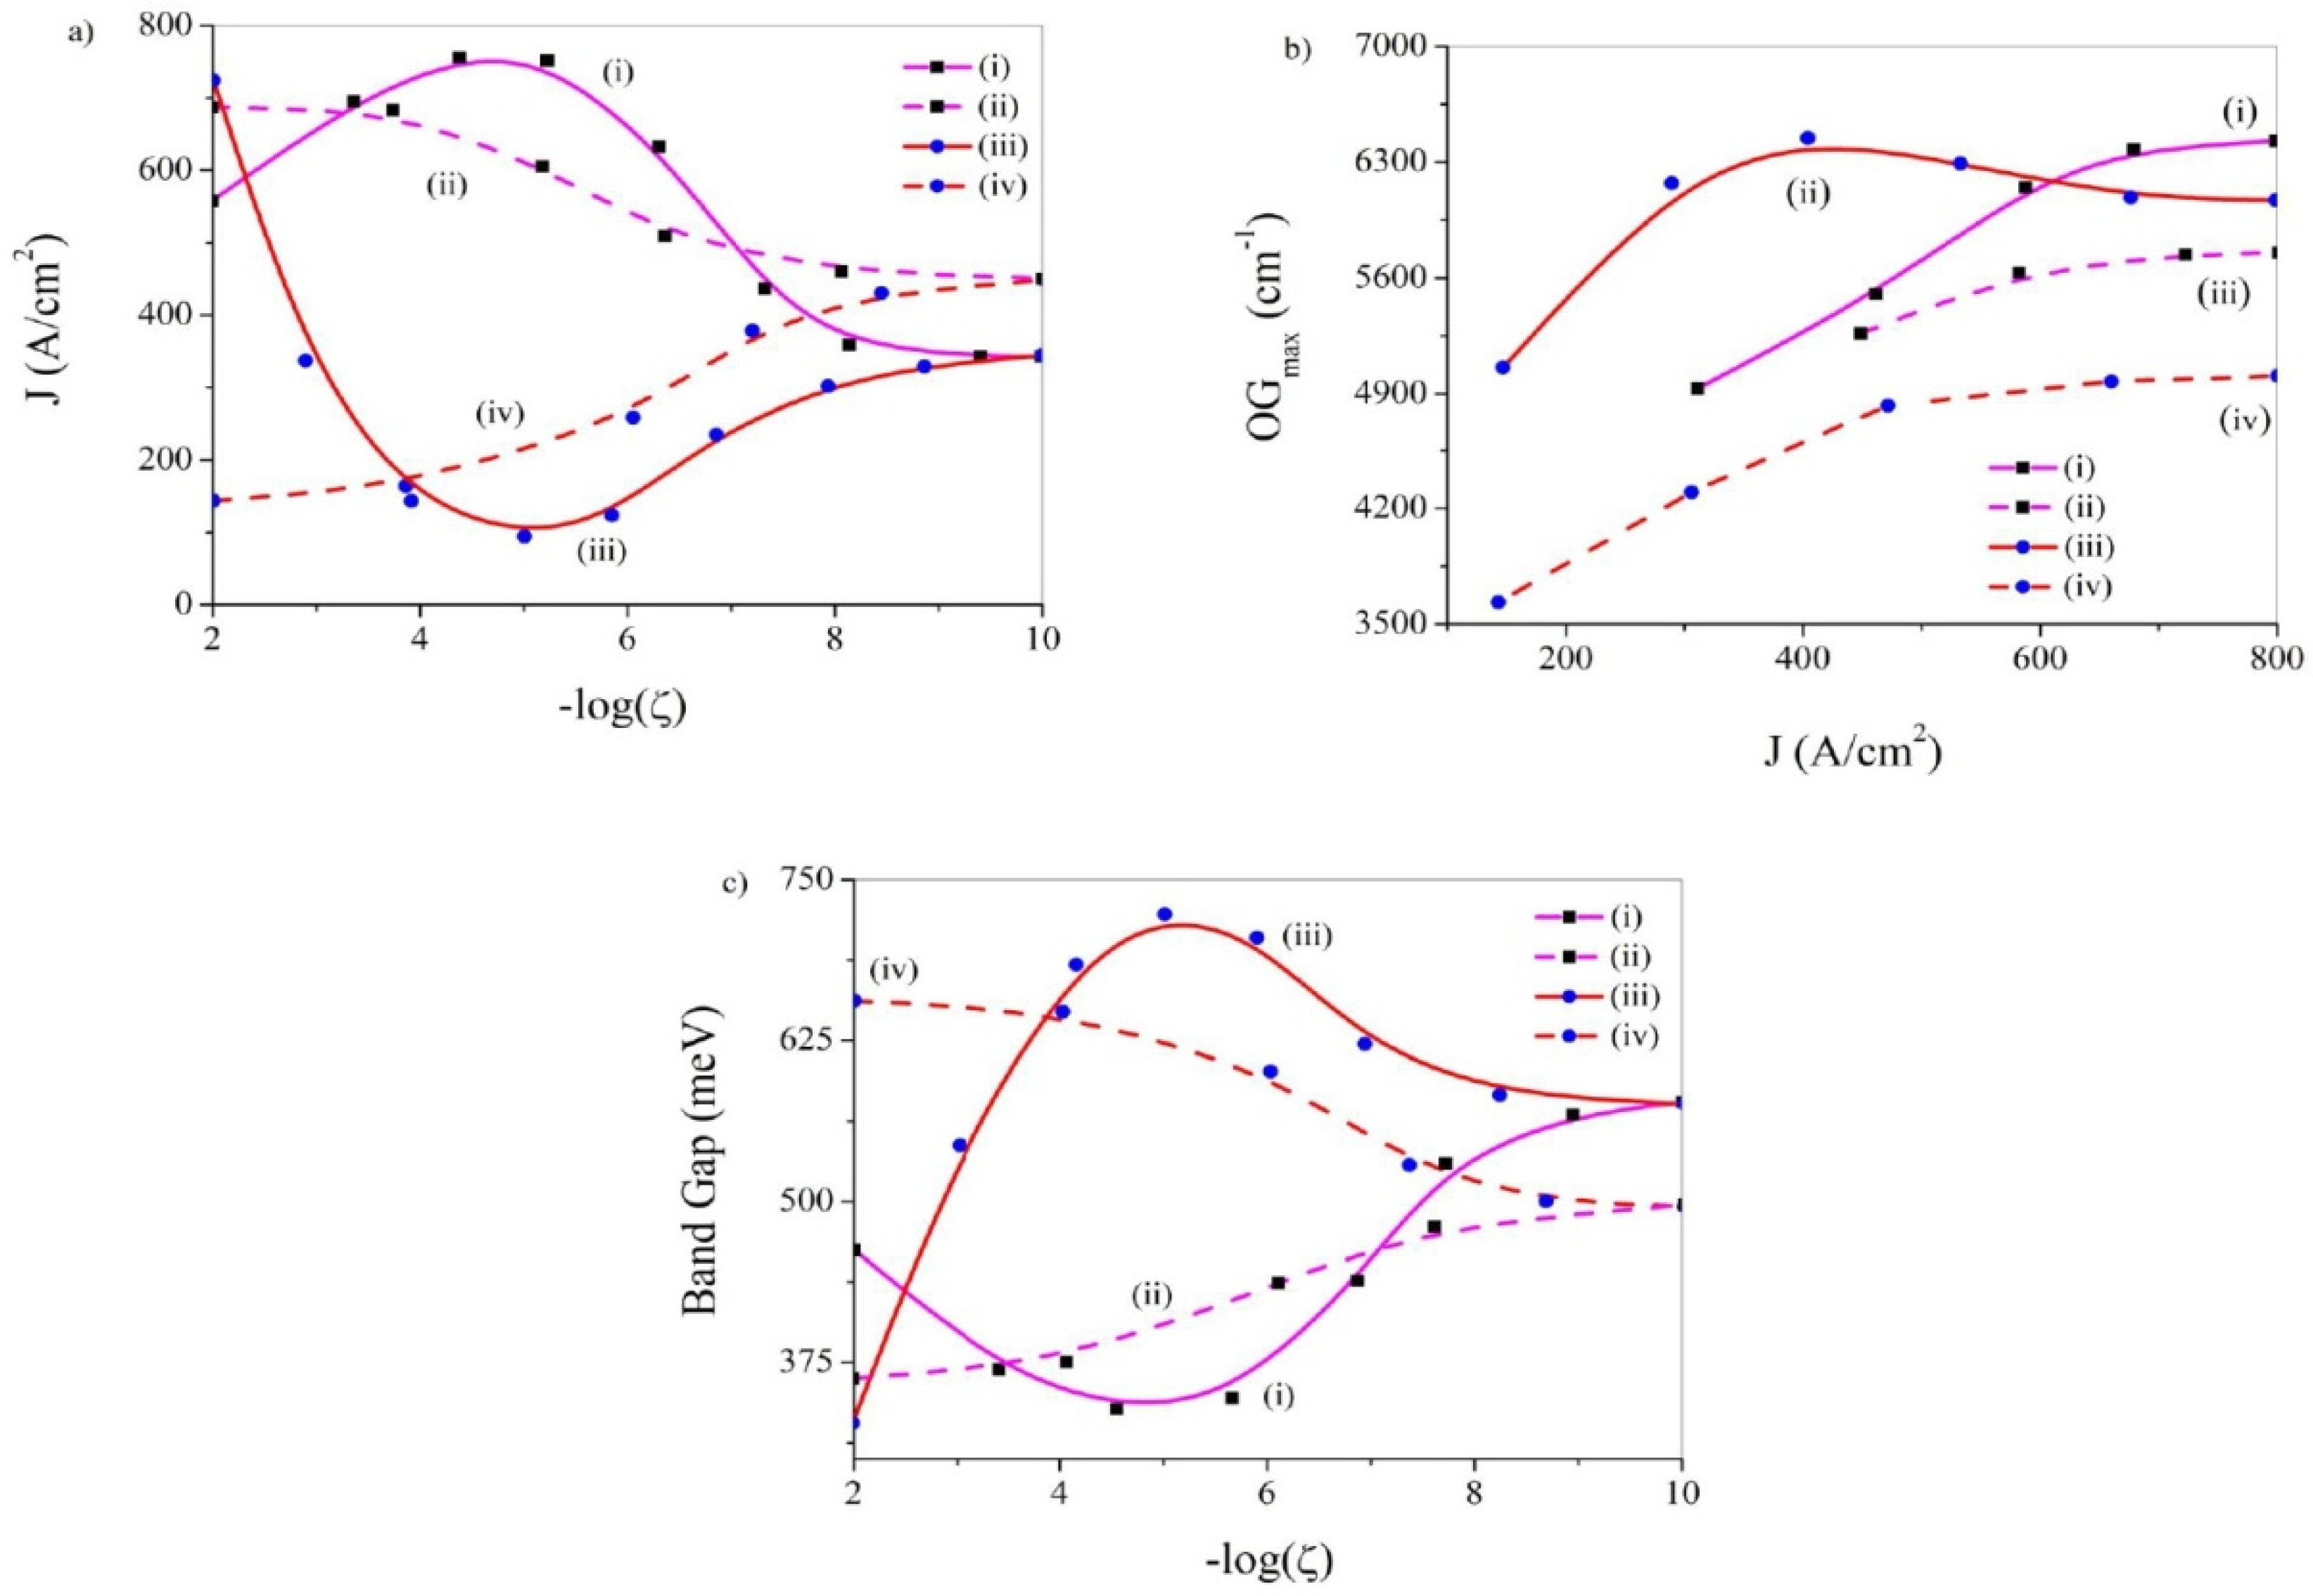
Figure 21a–c demonstrates the profiles of gain radiative current density (J) vs. −log(ζ), OG peak vs. J and band gap vs. −log(ζ), respectively, in the presence and absence of noise, both with odd and even anharmonicities for k = 10−6. In the presence of odd anharmonicity J displays distinct maximization (minimization) at ζ ~ 10−5 under applied ADWN (MLWN). However, with EPA, the J values exhibit steady rise (fall) with an increase in ζ under applied ADWN (MLWN). Under all conditions the J values proceed to their noise free values when the noise strength assumes extremely small values. Figure 21b depicts that, independent of the presence of noise and the parity of the anharmonic potential, the OG peak undergoes noticeable enhancement with J and saturate at large value of J (the saturation gain). Thus, here the noise mode and the symmetry of the anharmonicity do not cause any qualitative alteration of the observed outcomes. Figure 21c shows that in the presence of odd anharmonicity the band gap passes through distinct minimization (maximization) at ζ ~ 10−5 under applied ADWN (MLWN). However, with even anharmonicity the band gap exhibits steady decline (growth) with an increase in ζ under applied ADWN (MLWN). In all situations the band gaps approach their noise-free values at vanishingly low values of ζ.
The OG peak height generally depends on the magnitude of the transition matrix elements or spatial stretch of the wave function. The larger the stretch the more will be the overlap between the wave functions and greater will be OG. The variation of anharmonicity constant causes a change in the effective confinement potential (ECP) of the system. The alteration of ECP directly controls the overlap of wave functions and consequently the OG peak values [63]. Furthermore, during the variation of anharmonicity constant, the presence of noise, its pathway of incorporation and the symmetry of the anharmonicity affect the ECP and consequently the OG magnitude.
The shift of OG peak (blue/red) is guided by the band gap. An enhancement (depletion) in the band gap gives rise to blue (red) shift of the OG peaks [67]. The band gap is governed by the variation of atomic distances, energy levels and the Fermi states [61,63]. Moreover, a rise (fall) in the band gap generally results in decay (growth) of OG peak height. As a result, the profiles of OG peak often emerges to be quite a reverse to the band gap profiles. Thus, on the whole, it is the alteration of ECP that regulates the band gap and the overlap of wave functions. The above alteration comes out to be a delicate combination of the presence/absence of noise, the noise mode and the symmetry of the anharmonicity.
OG is directly proportional to (J) [69]. Thus, OG peak increases (decreases) parallel to increase (decrease) of J. This fact explains the close resemblance between the OG peak and J profiles. In addition to this, the OG peak vs. J profiles show the variation of OG peak with J. Furthermore, often these plots display saturation in OG peak at large values of J. The accomplishment of such saturation gain bears considerable technological importance, which needs an appropriate adjustment of the physical parameters (here the anharmonicity constant and the noise strength) and the range of the operating wavelength [62]. As mentioned before, the appearance of these features is also subtly linked with the roadway of inclusion of noise and the parity of the anharmonic potential.
Figure 22a–c depicts the profiles of differential gain (DG) against the carrier density (σv) both for odd and even anharmonicities without noise, and with ADWN and MLWN, respectively, for three different values of k viz. 10−8, 10−5 and 10−2. The DG is defined as the differential coefficient of OG with respect to σv. DG is an indicator of the efficacy of the laser to transform the current injected into the flow luminous and transmit OG through carrier injection. An enhanced DG suggests a large modulation speed and low spectral width of emission. DG is also an important tool to determine the modulation of band width of semiconductor laser. Under all conditions the DG profiles reveal maximization more or less around σv ~3.0 × 1018cm−3. Figure 22d shows the plots of DG peak values with the alteration of k in the presence and absence of noise, both with OPA and EPA. The profiles display maximization under applied ADWN (for both OPA and EPA at k ~ 10−5 and k ~ 10−6, respectively) and under applied MLWN with EPA (at k ~ 10−5.5). For all other situations the DG peak values delineate steady fall as anharmonicity constant enhances.

4. Conclusions

The tailoring of some pertinent NLO properties of GaAs QD are examined under the stewardship of Gaussian noise-anharmonicity interplay. The NLO properties considered are TOAC, TORIC, NOR, SHG, THG, EAC, DCKE, GI and OG. The delicate interaction between the pathway of entry of noise (additive/multiplicative) and the parity (odd/even) of the anharmonicity gives rise to diverse characteristics in the aforesaid NLO properties. These characteristics include steady growth, steady fall, maximization, minimization and saturation. On most occasions, with respect to the noise-free ambience, the application of MWN brings about a greater departure in the NLO properties than AWN. This happens owing to the greater perturbation of the system caused by MWN in comparison to its additive counterpart. A change in the parity of the anharmonic potential also modifies the ECP differently and hence the various NLO properties. The combined impact of the mode of introduction of noise, and the parity of the anharmonicity, is very much delicate and highly specific to the particular NLO property involved. Although there are some occasional resemblances, in practice, it is quite difficult to draw any generalized conclusion. It therefore appears judicious to study the combined influence of noise and anharmonicity keeping focus on a particular NLO property. The study deserves sincere relevance looking at the profound technological potential of QD, particularly when it contains anharmonicity and under the influence of noise.

Author Contributions

Conceptualization, D.R. and M.G.; methodology, D.R., S.M.A. and M.G.; software, D.R., S.M.A., S.D. and M.G.; validation, D.R., S.M.A., S.D. and M.G.; formal analysis, D.R., S.M.A., S.D. and M.G.; investigation, D.R., S.M.A., S.D. and M.G.; resources, D.R., S.M.A., S.D. and M.G; data curation, D.R., S.M.A., S.D. and M.G; writing—original draft preparation, D.R., S.M.A., S.D. and M.G; writing—review and editing, D.R., S.M.A., S.D. and M.G; visualization, D.R., S.M.A., S.D. and M.G; supervision, M.G; project administration, M.G.; funding acquisition, not applicable. All authors have read and agreed to the published version of the manuscript.

Funding

This research received no external funding.

Institutional Review Board Statement

Not applicable.

Informed Consent Statement

Not applicable.

Data Availability Statement

Not applicable.

Acknowledgments

The authors D.R., S.M.A., S.D. and M.G. thank DST-FIST (Govt. of India) and UGC-SAP(Govt. of India) for support.

Conflicts of Interest

The authors declare no conflict of interest.

References

  1. Khordad, R.; Bahramiyan, H. Impurity position effect on optical properties of various quantum Dots. Phys. E 2015, 66, 107–115. [Google Scholar] [CrossRef]
  2. Rezaei, G.; Vahdani, M.R.K.; Vaseghi, B. Nonlinear optical properties of a hydrogenic impurity in an ellipsoidal finite potential quantum dot. Curr. Appl. Phys. 2011, 11, 176–181. [Google Scholar] [CrossRef]
  3. Kasapoglu, E.; Duque, C.A.; Mora-Ramos, M.E.; Restrepo, R.L.; Ungan, F.; Yesilgul, U.; Sari, H.; Sökmen, I. Combined effects of intense laser field, electric and magnetic fields on the nonlinear optical properties of the step-like quantum well. Mater. Chem. Phys. 2015, 154, 170–175. [Google Scholar] [CrossRef]
  4. Hakimyfard, A.; Barseghyan, M.G.; Kirakosyan, A.A. Simultaneous effects of pressure and magnetic field on intersubband optical transitions in Pöschl-Teller quantum well. Phys. E 2009, 41, 1596–1599. [Google Scholar] [CrossRef]
  5. Khordad, R.; Bahramiyan, H. Optical properties of a GaAscone-like quantum dot: Second and third-harmonic generation. Opt. Spectrosc. 2014, 117, 447–452. [Google Scholar] [CrossRef]
  6. Sari, H.; Ungan, F.; Sakiroglu, S.; Yesilgul, U.; Sökmen, I. Impurity-related optical response in cylindrical quantum dots with a δ-doped axial potential under an intense laser field. J. Phys. Chem. Solids 2018, 120, 279–286. [Google Scholar] [CrossRef]
  7. Kria, M.; El-Yadri, M.; Aghoutane, N.; Pérez, L.M.; Laroze, D.; Feddi, E. Forecasting and analysis of nonlinear optical responses by tuning the thickness of a doped hollow cylindrical quantum dot. Chin. J. Phys. 2020, 66, 444–452. [Google Scholar] [CrossRef]
  8. Heitman, D.; Bollweg, K.; Gudmundsson, V.; Kurth, T.; Riege, S.P. Far-infrared spectroscopy of quantum wires and dots, breaking Kohn’s theorem. Phys. E 1997, 1, 204–210. [Google Scholar] [CrossRef]
  9. Arif, S.; Roy, D.; Ghosh, M. Influence of noise-anharmonicity interplay on a few physical properties of quantum dots. Phys. Status Solidi B 2022, 259, 2100497. [Google Scholar] [CrossRef]
  10. Roy, D.; Arif, S.; Ghosh, M. Modulation of electrical and optical properties of quantum dot by noise-anharmonicity interplay. Braz. J. Phys. 2022, 52, 178. [Google Scholar] [CrossRef]
  11. Karabulut, I.; Atav, Ü.; Şafak, H.; Tomak, M. Linear and nonlinear intersubband optical absorptions in an asymmetric rectangular quantum well. Eur. Phys. J. B 2007, 55, 283–288. [Google Scholar] [CrossRef]
  12. Ҫakir, B.; Yakar, Y.; Özmen, A.; Sezer, M.Ö.; Şahin, M. Linear and nonlinear optical absorption coeffcients and binding energy of a spherical quantum dot. Superlattices Microstruc. 2010, 47, 556–566. [Google Scholar]
  13. Rezaei, G.; Vaseghi, B.; Taghizadeh, F.; Vahdani, M.R.K.; Karimi, M.J. Intersubband optical absorption coeffcient changes and refractive index changes in a two-dimensional quantum pseudodot system. Superlattices Microstruc. 2010, 48, 450–457. [Google Scholar] [CrossRef]
  14. Yilmaz, S.; Şahin, M. Third-order nonlinear absorption spectra of an impurity in a spherical quantum dot with different confining potential. Phys. Status Solidi B 2010, 247, 371–374. [Google Scholar] [CrossRef]
  15. Yakar, Y.; Ҫakir, B. Calculation of linear and nonlinear optical absorption coeffcients of a spherical quantum dot with parabolic potential. Opt. Commun. 2010, 283, 1795–1800. [Google Scholar] [CrossRef]
  16. Ҫakir, B.; Yakar, Y.; Özmen, A. Refractive index changes and absorption coeffcients in a spherical quantum dot with parabolic potential. J. Lumin. 2012, 132, 2659–2664. [Google Scholar]
  17. Wei, R.; Xie, W. Optical absorption of a hydrogenic impurity in a disc-shaped quantum dot. Curr. Appl. Phys. 2010, 10, 757–760. [Google Scholar] [CrossRef]
  18. Baghramyan, H.M.; Barseghyan, M.G.; Kirakosyan, A.A.; Restrepo, R.L. Linear and nonlinear optical absorption coeffcients in GaAs/Ga1-xAlxAsconcentric double quantum rings: Effects of hydrostatic pressure and aluminium concentration. J. Lumin. 2013, 134, 594–599. [Google Scholar] [CrossRef] [Green Version]
  19. Ghazi, H.E.; Jorio, A.; Zorkani, I. Linear and nonlinear intra-conduction band optical absorption in (In,Ga)N/GaNspherical QD under hydrostatic pressure. Opt. Commun. 2014, 331, 73–76. [Google Scholar] [CrossRef]
  20. Lu, L.; Xie, W.; Hassanabadi, H. Linear and nonlinear optical absorption coeffcients and refractive index changes in a two-electron quantum dot. J. Appl. Phys. 2011, 109, 063108. [Google Scholar] [CrossRef]
  21. Baskoutas, S.; Garoufalis, C.S.; Terzis, A.F. Linear and nonlinear optical absorption coeffcients in inverse parabolic quantum wells under static external electric field. Eur. Phys. J. B 2011, 84, 241–247. [Google Scholar] [CrossRef]
  22. Şakiroğlu, S.; Ungan, F.; Yesilgul, U.; Mora-Ramos, M.E.; Duque, C.A.; Kasapoglu, E.; Sari, H.; Sökmen, I. Nonlinear optical rectification and the second and third harmonic generation in Pöschl-Teller quantum well under the intense laser field. Phys. Lett. A 2012, 376, 1875–1880. [Google Scholar] [CrossRef]
  23. Hassanabadi, H.; Liu, G.; Lu, L. Nonlinear optical rectification and the second-harmonic generation in semi-parabolic and semi-inverse quantum wells. Solid State Commun. 2012, 152, 1761–1766. [Google Scholar] [CrossRef]
  24. Baskoutas, S.; Paspalakis, E.; Terzis, A.F. Effects of excitons in nonlinear optical rectification in semiparabolic quantum dots. Phys. Rev. B 2006, 74, 153306. [Google Scholar] [CrossRef]
  25. Karabulut, İ.; Şafak, H.; Tomak, M. Nonlinear optical rectification in asymmetrical semiparabolic quantum wells. Solid State Commun. 2005, 135, 735–738. [Google Scholar] [CrossRef]
  26. Rezaei, G.; Vaseghi, B.; Khordad, R.; Kenary, H.A. Optical rectification coeffcient of a twodimensional quantum pseudodot system. Phys. E 2011, 43, 1853–1856. [Google Scholar] [CrossRef]
  27. Baskoutas, S.; Paspalakis, E.; Terzis, A.F. Electronic structure and nonlinear optical rectification in a quantum dot: Effects of impurities and external electric field. J. Phys. Condens. Matter 2007, 19, 395024. [Google Scholar] [CrossRef]
  28. Mahrsia, R.B.; Choubani, M.; Bouzaїene, L.; Maaref, H. Nonlinear optical rectification in a vertically coupled lens-shaped InAs/GaAsquantum dots with wetting layers under hydrostatic pressure and temperature. J. Alloys Compd. 2016, 671, 200–207. [Google Scholar] [CrossRef]
  29. Yu, Y.-B.; Zhu, S.-N.; Guo, K.-X. Excitonic effects on the nonlinear optical rectification in one-dimensional quantum dots. Phys. Lett. A 2005, 335, 175–181. [Google Scholar] [CrossRef]
  30. Yıldırım, H.; Tomak, M. Nonlinear optical properties of a Pöschl-Teller quantum well. Phys. Rev. B 2005, 72, 115340. [Google Scholar] [CrossRef]
  31. Xie, W. Nonlinear optical rectification of a hydrogenic impurity in a disc-like quantum dot. Physical B 2009, 404, 4142–4145. [Google Scholar] [CrossRef]
  32. Zhang, L.; Xie, H.-J. Electric field effect on the second-order nonlinear optical properties of parabolic and semiparabolic quantum wells. Phys. Rev. B 2003, 68, 235315. [Google Scholar] [CrossRef]
  33. Karabulut, İ.; Atav, Ü.; Şafak, H. Comment on “Electric field effect on the second-order nonlinear optical properties of parabolic and semiparabolic quantum wells”. Phys. Rev. B 2005, 72, 207301. [Google Scholar] [CrossRef]
  34. Sauvage, S.; Boucaud, P.; Brunhes, T.; Glotin, F.; Prazeres, R.; Ortega, J.M.; Gérard, J.M. Second-harmonic generation resonant with s-p transition in InAs/GaAsself-assembled quantum dots. Phys. Rev. B 2001, 63, 113312. [Google Scholar] [CrossRef]
  35. Sedrakian, D.M.; Khachatrian, A.Z.; Andresyan, G.M.; Badalyan, V.D. The second harmonic generation in the symmetric well containing a rectangular barrier. Opt. Quantum Electron. 2004, 36, 893–904. [Google Scholar] [CrossRef] [Green Version]
  36. Li, B.; Guo, K.-X.; Zhang, C.-J.; Zheng, Y.-B. The second harmonic generation in parabolic quantum dots in the presence of electric and magnetic fields. Phys. Lett. A 2007, 367, 493–497. [Google Scholar] [CrossRef]
  37. Sauvage, S.; Boucaud, P.; Glotín, F.; Prazeres, R.; Ortega, J.-M.; Lemaître, A.; Gérard, J.-M.; Thierry-Mieg, V. Third-harmonic generation in InAs/GaAsself-assembled quantum dots. Phys. Rev. B 1999, 59, 9830–9833. [Google Scholar] [CrossRef] [Green Version]
  38. Zhang, L.; Xie, H.-J. Bound states and third-harmonic generation in a semi-parabolic quantum well with an applied electric field. Phys. E 2004, 22, 791–796. [Google Scholar] [CrossRef]
  39. Wang, G. Third-harmonic generation in cylindrical parabolic quantum wires with an applied electric field. Phys. Rev. B 2005, 72, 155329. [Google Scholar] [CrossRef]
  40. Shao, S.; Guo, K.-X.; Zhang, Z.-H.; Li, N.; Peng, C. Third-harmonic generation in cylindrical quantum dots in a static magnetic field. Solid State Commun. 2011, 151, 289–292. [Google Scholar] [CrossRef]
  41. Yıldırım, H.; Tomak, M. Third-harmonic generation in a quantum well with adjustable asymmetry under an electric field. Phys. Stats. Solidi B 2006, 243, 4057–4063. [Google Scholar] [CrossRef]
  42. Shao, S.; Guo, K.-X.; Zhang, Z.-H.; Li, N.; Peng, C. Studies on the third-harmonic generations in cylindrical quantum dots with an applied electric field. Superlattices Microstruc. 2010, 48, 541–549. [Google Scholar] [CrossRef]
  43. Bautista, J.E.Q.; Lyra, M.L.; Lima, R.P.A. Crossover from strong to weak exciton confinement and third-harmonic generation on one-dimensional quantum dots. Photonics Nanostruc. 2013, 11, 8–14. [Google Scholar] [CrossRef]
  44. Niculescu, E.C.; Cristea, M.; Radu, A. magnetic field effect on third-harmonic generation in quantum well wires with triangular cross-section. Phys. E 2014, 57, 138–144. [Google Scholar] [CrossRef]
  45. Kirak, M.; Altinok, Y. The electric field effects on the third-harmonic generation in spherical quantum dots with parabolic confinement. Eur. Phys. J. B 2012, 85, 344. [Google Scholar] [CrossRef]
  46. Kouhi, M. Electric field effect on the quadratic electro optic effects and electro absorption process in GaN/AlGaNspherical quantum dot. Optik 2016, 127, 3379–3382. [Google Scholar] [CrossRef]
  47. Bahari, A.; Moghadam, F.R. Quadratic electro-optic effect and electro-absorption process in CdSe-ZnS-CdSestructure. Physical E 2012, 44, 782–785. [Google Scholar] [CrossRef]
  48. Cristea, M.; Radu, A.; Niculescu, E.C. Electric field effect on the third-order nonlinear optical susceptibility in inverted core-shell nanodots with dielectric confinement. J. Lumin. 2013, 143, 592–599. [Google Scholar] [CrossRef]
  49. Wang, C.; Xiong, G. Quadratic electro-optic effects and electro-absorption process in InGaN/GaNcylinder quantum dots. Microelectron. J. 2006, 37, 847–850. [Google Scholar] [CrossRef]
  50. Kouhi, M.; Vahedi, A.; Akbarzadeh, A.; Hanifehpour, Y.; Joo, S.W. Investigation of quadratic electro-optic effects and electro-absorption process in GaN/AlGaNspherical quantum dot. Nanoscale Res. Lett. 2014, 9, 131. [Google Scholar] [CrossRef] [Green Version]
  51. Xie, S.; Xiong, G.; Feng, X.; Chen, Z. Characteristics of quadratic electro-optic effects and electro-absorption process in CdSeparabolic quantum dots. Microelectron. J. 2007, 38, 787–790. [Google Scholar] [CrossRef]
  52. Asadpour, S.H.; Sahrai, M.; Sadighi-Bonabi, R.; Soltani, A.; Mahrami, H. Enhancement of Kerr nonlinearity at long wavelength in a quantum dot nanostructure. Phys. E 2011, 43, 1759–1762. [Google Scholar] [CrossRef]
  53. Asadpour, S.H.; Hamedi, H.R.; Eslami-Majd, A.; Sahrai, M. Enhanced Kerr nonlinearity in a tunnel-coupled quantum well. Phys. E 2011, 44, 464–469. [Google Scholar] [CrossRef]
  54. Al-Nashy, B.; Amin, S.M.M.; Al-Khursan, A.H. Kerr effect in quantum dot structure. Optik 2014, 125, 4873–4875. [Google Scholar] [CrossRef]
  55. delCoso, R.; Solis, J. Relation between nonlinear refractive index and third-order susceptibility in absorbing media. J. Opt. Soc. Am. B 2004, 21, 640–644. [Google Scholar] [CrossRef] [Green Version]
  56. Su, H.; Chuang, S.L. Room-temperature slow light with semiconductor quantum-dot devices. Opt. Lett. 2006, 31, 271–273. [Google Scholar] [CrossRef] [PubMed]
  57. Kim, J.; Chuang, S.L.; Ku, P.C.; Chang-Hasnain, C.J. Slow light using semiconductor quantum dots. J. Phys. Condens. Matters 2004, 16, S3727. [Google Scholar] [CrossRef] [Green Version]
  58. Chang-Hasnain, C.J.; Chuang, S.L. Slow and fast light in semiconductor quantum-well and quantum-dot devices. J. Light. Technol. 2006, 24, 4642–4654. [Google Scholar] [CrossRef]
  59. Stevanović, L.; Filipović, N.; Pavlović, V. Effect of magnetic field on absorption coeffcients, refractive index changes and group index of spherical quantum dot with hydrogenic impurity. Opt. Mater. 2019, 91, 62–69. [Google Scholar] [CrossRef]
  60. Flayyih, A.H.; Al-Khursan, A.H. Integral gain in quantum dot semiconductor optical amplifiers. Superlattices Microstruc. 2013, 62, 81–87. [Google Scholar] [CrossRef]
  61. Owji, E.; Keshavarz, A.; Mokhtari, H. The effects of temperature, hydrostatic pressure and size on optical gain for GaAsspherical quantum dot laser with hydrogen impurity. Superlattices Microstruc. 2016, 98, 276–282. [Google Scholar] [CrossRef]
  62. Saravanamoorthy, S.N.; Peter, A.J.; Lee, C.W. Optical peak gain in PbSe/CdSecore-shell quantum dot in the presence of magnetic field for mid-infrared laser applications. Chem. Phys. 2017, 483–484, 1–6. [Google Scholar] [CrossRef]
  63. Owji, E.; Keshavarz, A.; Mokhtari, H. The effects of geometrical size, external electric fields and impurity on the optical gain of a quantum dot laser with a semi-parabolic spherical well potential. Phys. B 2017, 508, 7–11. [Google Scholar] [CrossRef]
  64. Chen, J.; Fan, W.J.; Xu, Q.; Zhang, X.W. Electronic structure and optical gain of InAsPN/GaP(N) quantum dots. Superlattices Microstruc. 2011, 49, 1–8. [Google Scholar] [CrossRef]
  65. Chen, J.; Fan, W.J.; Xu, Q.; Zhang, X.W.; Li, S.S.; Xia, J.B. Electronic structure and optical gain saturation of InAs1-xNx/GaAsquantum dots. J. Appl. Phys. 2009, 105, 123705. [Google Scholar] [CrossRef]
  66. Gladysiewicz, M.; Kudrawiec, R.; Wartak, M.S. Theoretical studies of optical gain tuning by hydrostatic pressure in GaInNAs/GaAsquantum wells. J. Appl. Phys. 2014, 115, 033515. [Google Scholar] [CrossRef]
  67. Mal, I.; Samajdar, D.P.; Peter, A.J. Theoretical studies on band structure and optical gain of GaInAsN/GaAs/GaAscylindrical quantum dot. Superlattices Microstruc. 2018, 119, 103–113. [Google Scholar] [CrossRef]
  68. Mal, I.; Samajdar, D.P.; Das, T.D. Calculation of band structure and optical gain of type-II GaSbBi/GaAsquantum wells using 14-band k.pHamiltonian. Superlattices Microstruc. 2017, 109, 442–453. [Google Scholar] [CrossRef]
  69. Mageshwari, P.U.; Peter, A.J.; Lee, C.W. Magnetic field induced optical gain in a dilute nitride quaternary semiconductor quantum dot. Opt. Mater. 2016, 60, 17–24. [Google Scholar] [CrossRef]
Figure 1. TOAC vs. diagrams: (a) devoid of noise, (b) under ADWN, and (c) under MLWN. In these diagrams the anharmonicity has (i) odd parity and k = 10−8, (ii) odd parity and k = 10−5, (iii) odd parity and k = 10−2, (iv) even parity and k = 10−8, (v) even parity and k = 10−5 and (vi) even parity and k = 10−2. (d) Depiction of TOAC peak heights vs. −log(k): (i) devoid of noise and OPA, (ii) devoid of noise and EPA, (iii) with ADWN and OPA, (iv) with ADWN and EPA, (v) with MLWN and OPA and (vi) with MLWN and EPA.
Atoms 10 00122 g001
Figure 2. TOAC vs. diagrams with (a) OPA and (b) EPA. In these diagrams (i) ADWN and ζ = 10−10, (ii) ADWN and ζ = 10−6, (iii) ADWN and ζ = 10−2, (iv) MLWN and ζ = 10−10, (v) MLWN and ζ = 10−6, (vi) MLWN and ζ = 10−2. (c) Depiction of TOAC peak heights vs. −log(ζ): (i) with ADWN and OPA, (ii) with ADWN and EPA, (iii) with MLWN and OPA and (iv) with MLWN and EPA.
Atoms 10 00122 g002
Figure 3. TORIC vs. diagrams (a) devoid of noise, (b) under ADWN and (c) under MLWN. In these diagrams the anharmonicity has (i) odd parity and k = 10−8, (ii) odd parity and k = 10−5, (iii) odd parity and k = 10−2, (iv) even parity and k = 10−8, (v) even parity and k = 10−5, (vi) even parity and k = 10−2. (d) Depiction of TORIC peak heights vs. −log(k): (i) devoid of noise and OPA, (ii) devoid of noise and EPA, (iii) with ADWN and OPA, (iv) with ADWN and EPA, (v) with MLWN and OPA and (vi) with MLWN and EPA.
Atoms 10 00122 g003
Figure 4. TORIC vs. diagrams with (a) OPA and (b) EPA. In these diagrams (i) ADWN and ζ = 10−10, (ii) ADWN and ζ = 10−6, (iii) ADWN and ζ = 10−2, (iv) MLWN and ζ = 10−10, (v) MLWN and ζ = 10−6, (vi) MLWN and ζ = 10−2. (c) Depiction of TOAC peak heights vs. −log(ζ): (i) with ADWN and OPA, (ii) with ADWN and EPA, (iii) with MLWN and OPA and (iv) with MLWN and EPA.
Atoms 10 00122 g004
Figure 5. NOR vs. diagrams (a) devoid of noise, (b) under ADWN and (c) under MLWN. In these diagrams the anharmonicity has (i) odd parity and k = 10−8, (ii) odd parity and k = 10−5, (iii) odd parity and k = 10−2, (iv) even parity and k = 10−8, (v) even parity and k = 10−5, (vi) even parity and k = 10−2. (d) Depiction of GF for NOR vs. −log(k): (i) devoid of noise and OPA, (ii) devoid of noise and EPA, (iii) with ADWN and OPA, (iv) with ADWN and EPA, (v) with MLWN and OPA and (vi) with MLWN and EPA.
Atoms 10 00122 g005
Figure 6. NOR vs. diagrams with (a) OPA and (b) EPA. In these diagrams (i) ADWN and ζ = 10−10, (ii) ADWN and ζ = 10−6, (iii) ADWN and ζ = 10−2, (iv) MLWN and ζ = 10−10, (v) MLWN and ζ = 10−6, (vi) MLWN and ζ = 10−2. (c) Depiction of GF for NOR vs. –log(ζ): (i) with ADWN and OPA, (ii) with ADWN and EPA, (iii) with MLWN and OPA and (iv) with MLWN and EPA.
Atoms 10 00122 g006
Figure 7. SHG vs. diagrams (a) devoid of noise, (b) under ADWN and (c) under MLWN. In these diagrams the anharmonicity has (i) odd parity and k = 10−8, (ii) odd parity and k = 10−5, (iii) odd parity and k = 10−2, (iv) even parity and k = 10−8, (v) even parity and k = 10−5, (vi) even parity and k = 10−2. (d) Depiction of GF for SHG vs. −log(k): (i) devoid of noise and OPA, (ii) devoid of noise and EPA, (iii) with ADWN and OPA, (iv) with ADWN and EPA, (v) with MLWN and OPA and (vi) with MLWN and EPA.
Atoms 10 00122 g007
Figure 8. SHG vs. diagrams with (a) OPA and (b) EPA. In these diagrams (i) ADWN and ζ = 10−10, (ii) ADWN and ζ = 10−6, (iii) ADWN and ζ= 10−2, (iv) MLWN and ζ = 10−10, (v) MLWN and ζ = 10−6, (vi) MLWN and ζ = 10−2. (c) Depiction of GF for SHG vs. −log(ζ): (i) with ADWN and OPA, (ii) with ADWN and EPA, (iii) with MLWN and OPA and (iv) with MLWN and EPA.
Atoms 10 00122 g008
Figure 9. THG vs. diagrams (a) devoid of noise, (b) under ADWN and (c) under MLWN. In these diagrams the anharmonicity has (i) odd parity and k = 10−8, (ii) odd parity and k = 10−5, (iii) odd parity and k = 10−2, (iv) even parity and k = 10−8, (v) even parity and k = 10−5, (vi) even parity and k = 10−2. (d) Depiction of GF for THG vs. −log(k): (i) devoid of noise and OPA, (ii) devoid of noise and EPA, (iii) with ADWN and OPA, (iv) with ADWN and EPA, (v) with MLWN and OPA and (vi) with MLWN and EPA.
Atoms 10 00122 g009
Figure 10. THG vs. diagrams with (a) OPA and (b) EPA. In these diagrams (i) ADWN and ζ = 10−10, (ii) ADWN and ζ = 10−6, (iii) ADWN and ζ = 10−2, (iv) MLWN and ζ = 10−10, (v) MLWN and ζ = 10−6, (vi) MLWN and ζ = 10−2. (c) Depiction of GF for THG vs. −log(ζ): (i) with ADWN and OPA, (ii) with ADWN and EPA, (iii) with MLWN and OPA and (iv) with MLWN and EPA.
Atoms 10 00122 g010
Figure 11. EAC vs. diagrams (a) devoid of noise, (b) under ADWN and (c) under MLWN. In these diagrams the anharmonicity has (i) odd parity and k = 10−8, (ii) odd parity and k = 10−5, (iii) odd parity and k = 10−2, (iv) even parity and k = 10−8, (v) even parity and k = 10−5, (vi) even parity and k = 10−2. (d) Depiction of EAC minimum peak values vs. −log(k): (i) devoid of noise and OPA, (ii) devoid of noise and EPA, (iii) with ADWN and OPA, (iv) with ADWN and EPA, (v) with MLWN and OPA and (vi) with MLWN and EPA.
Atoms 10 00122 g011
Figure 12. EAC vs. diagrams with (a) OPA and (b) EPA. In these diagrams (i) ADWN and ζ = 10−10, (ii) ADWN and ζ = 10−6, (iii) ADWN and ζ = 10−2, (iv) MLWN and ζ = 10−10, (v) MLWN and ζ = 10−6, (vi) MLWN and ζ = 10−2. (c) Depiction of EAC peak minima vs. −log(ζ): (i) with ADWN and OPA, (ii) with ADWN and EPA, (iii) with MLWN and OPA and (iv) with MLWN and EPA.
Atoms 10 00122 g012
Figure 13. DCKE vs. diagrams (a) devoid of noise, (b) under ADWN and (c) under MLWN. In these diagrams the anharmonicity has (i) odd parity and k = 10−8, (ii) odd parity and k = 10−5, (iii) odd parity and k = 10−2, (iv) even parity and k = 10−8, (v) even parity and k = 10−5, (vi) even parity and k = 10−2. (d) Depiction of DCKE peak values vs. −log(k): (i) devoid of noise and OPA, (ii) devoid of noise and EPA, (iii) with ADWN and OPA, (iv) with ADWN and EPA, (v) with MLWN and OPA and (vi) with MLWN and EPA.
Atoms 10 00122 g013
Figure 14. DCKE vs. diagrams with (a) OPA and (b) EPA. In these diagrams (i) ADWN and ζ = 10−10, (ii) ADWN and ζ = 10−6, (iii) ADWN and ζ = 10−2, (iv) MLWN and ζ = 10−10, (v) MLWN and ζ = 10−6, (vi) MLWN and ζ = 10−2. (c) Depiction of DCKE peak vs. −log(ζ): (i) with ADWN and OPA, (ii) with ADWN and EPA, (iii) with MLWN and OPA and (iv) with MLWN and EPA.
Atoms 10 00122 g014
Figure 15. Plots of (a) CF for RI vs. −log(k) and (b) CF for AC vs. −log(k): (i) devoid of noise and under OPA, (ii) devoid of noise and under EPA, (iii) with ADWN and under OPA, (iv) with ADWN and under EPA, (v) with MLWN and under OPA and (vi) with MLWN and under EPA. Plots of (c) CF for RI vs. −log(ζ) and (d) CF for AC vs. −log(ζ): (i) with ADWN and under OPA, (ii) with ADWN and under EPA, (iii) with MLWN and under OPA and (iv) with MLWN and under EPA.
Atoms 10 00122 g015
Figure 16. GI vs. diagrams (a) devoid of noise, (b) under ADWN and (c) under MLWN. In these diagrams the anharmonicity has (i) odd parity and k = 10−8, (ii) odd parity and k = 10−5, (iii) odd parity and k = 10−2, (iv) even parity and k = 10−8, (v) even parity and k = 10−5, (vi) even parity and k = 10−2. (d) Depiction of GI peak values vs. −log(k): (i) devoid of noise and OPA, (ii) devoid of noise and EPA, (iii) with ADWN and OPA, (iv) with ADWN and EPA, (v) with MLWN and OPA and (vi) with MLWN and EPA.
Atoms 10 00122 g016
Figure 17. GI vs. diagrams with (a) OPA and (b) EPA. In these diagrams (i) ADWN and ζ = 10−10, (ii) ADWN and ζ = 10−6, (iii) ADWN and ζ = 10−2, (iv) MLWN and ζ = 10−10, (v) MLWN and ζ = 10−6, (vi) MLWN and ζ = 10−2. (c) Depiction of GI peak vs. −log(ζ): (i) with ADWN and OPA, (ii) with ADWN and EPA, (iii) with MLWN and OPA and (iv) with MLWN and EPA.
Atoms 10 00122 g017
Figure 18. OG vs. diagrams (a) devoid of noise, (b) under ADWN and (c) under MLWN. In these diagrams the anharmonicity has (i) odd parity and k = 10−8, (ii) odd parity and k = 10−5, (iii) odd parity and k = 10−2, (iv) even parity and k = 10−8, (v) even parity and k = 10−5, (vi) even parity and k = 10−2. (d) Depiction of OG peak values vs. −log(k): (i) devoid of noise and OPA, (ii) devoid of noise and EPA, (iii) with ADWN and OPA, (iv) with ADWN and EPA, (v) with MLWN and OPA and (vi) with MLWN and EPA.
Atoms 10 00122 g018
Figure 19. Plots of (a) J vs. −log(k), (b) OG peak vs. J and (c) band gap vs. −log(k): (i) without noise and under OPA, (ii) without noise and under EPA, (iii) with ADWN and under EPA, (iv) with ADWN and under EPA, (v) with MLWN and under OPA and (vi) with MLWN and under EPA.
Atoms 10 00122 g019
Figure 20. OG vs. diagrams with (a) OPA and (b) EPA. In these diagrams (i) ADWN and ζ = 10−10, (ii) ADWN and ζ = 10−6, (iii) ADWN and ζ = 10−2, (iv) MLWN and ζ = 10−10, (v) MLWN and ζ = 10−6, (vi) MLWN and ζ = 10−2. (c) Depiction of OG peak vs. −log(ζ): (i) with ADWN and OPA, (ii) with ADWN and EPA, (iii) with MLWN and OPA and (iv) with MLWN and EPA.
Atoms 10 00122 g020
Figure 21. Plots of (a) J vs. −log(ζ), (b) OG peak vs. J and (c) band gap vs. −log(ζ): (i) with ADWN and under OPA, (ii) with ADWN and under EPA, (iii) with MLWN and under OPA and (iv) with MLWN and under EPA.
Atoms 10 00122 g021
Figure 22. Plots of DG vs. σv (a) without noise, (b) with ADWN and (c) with MLWN. In these diagrams (i) OPA and k = 10−8, (ii) OPA and k = 10−5, (iii) OPA and k = 10−2, (iv) EPA and k = 10−8, (v) EPA and k = 10−5, (vi) EPA and k = 10−2. (d) Depiction of DG peak values vs. −log(k): (i) in absence of noise and under OPA, (ii) in absence of noise and under EPA, (iii) with ADWN and under OPA, (iv) with ADWN and under EPA, (v) with MLWN and under OPA and (vi) with MLWN and under EPA.
Atoms 10 00122 g022
Publisher’s Note: MDPI stays neutral with regard to jurisdictional claims in published maps and institutional affiliations.