Abstract
Satellite excitations and final state configuration interactions appear due to the many-electron correlations and result in a photoelectron spectrum complex final state structure instead of single lines corresponding to one-hole states. In the present work, both processes are considered in a framework of the many-body perturbation theory, and two techniques, namely the spectral function and CI (configuration interaction) methods are considered. It is shown that for the calculation of satellite lineshapes and low-energy Auger decay, the spectral function method is more appropriate, but in the case of strong final state interactions, the methods of solution of Dyson equation or secular matrix are superior. The results obtained for satellites and low energy Auger decay in the Ne 1s, Ne 2p photoelectron spectra, the Co 3s, and the Th 5p photoelectron spectra are in agreement with the experimental data.
1. Introduction
The interaction of a single vacancy with more complex states with two vacancies and one excited electron results in a breakdown of the one-electron picture in the 4p photoelectron spectra of lanthanides and the 5p spectra of actinides [1,2,3,4,5], and strong deviation of multiplet structure of the 3s spectra of 3d metals from that obtained in Hartree–Fock approximation [6,7,8,9,10,11]. The theory of these effects is essential in the investigations of materials by photoelectron spectroscopy. Satellite lines in the photoelectron spectra of noble gases have been the subject of several experimental works and their study provides detailed information on the dynamics of many electron correlations [12,13,14,15,16,17]. It was obtained theoretically [18,19] and confirmed experimentally [20] that monopole shake-up and shake-off satellites take about 20% of the intensity of the main line. Thus, the account for satellite intensities is required in using theoretical photoionization cross-sections in the elemental analysis by photoelectron spectroscopy. The first satellite calculations were made in the “overlapping” approximation [21,22,23,24], in which the satellite intensity was proportional to the square of overlap integral between ground state Hartree–Fock wave functions and relaxed final state wave functions. In addition, a combination of configuration interaction and “overlapping” methods was used for satellite calculation [25,26].
It was an idea of Miron Ya. Amusia to consider the hole potential as a perturbation potential for the ground state wave functions and to use the spectral function of the initial hole (see, e.g., [1]) to calculate the whole spectrum, i.e., main line, shake-up satellites, and shake off continuum [27]. This technique was applied for the shake-up satellites in photoelectron spectra of noble gases [28,29,30] and extended to valence and core Auger transitions [31,32,33,34,35]. Some predictions of these theoretical results for the valence Auger transitions were confirmed experimentally [36,37]. The creation of a new of HAXPES (hard x-ray photoelectron spectroscopy) experimental techniques [38,39] caused further development of the theory of many-electron effects in photoionization [40,41]. Similar theoretical approaches were used for the understanding of atomic many-electron effects in photoelectron spectra of atoms in chemical compounds, namely the 3s-spectra of Co [42], the 4p-spectra of Ba [43], the 5p-spectra of Th [44], and U [45].
Thus many-electron effects change the one-electron picture of photoionization [1] and knowledge of the nature of many-electron effects is required for the correct interpretation of XPS data on the compounds under investigation. Furthermore, in the case of noble gases, a comparison of theoretical and experimental results is required to understand photoionization and related phenomena [35]. In the present paper, the many-electron approaches to core relaxation and multiplet splitting are developed and examples of their applications are considered.
2. Theoretical Approach
The relaxation of atomic orbitals caused by ionization of the k-shell is described by the excitations of electron-hole pairs under the action of suddenly switched potential of the k-hole [27]. The corresponding Feynman diagram is shown in Figure 1a, where a wavy line stands for the interaction, determined by the Coulomb integral, right (left) directed arrows denote particles (holes), which are added to the initial atomic configuration.
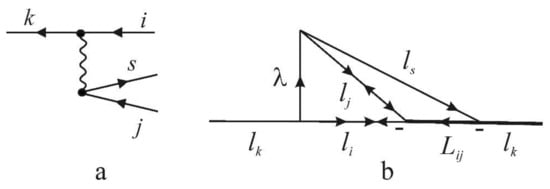
Figure 1.
Graphs for the satellite’s excitation. (a) Feynman diagram for the satellite excitation. Arrows directed from left to right (right to left) denote particles (holes), wavy line denotes Coulomb interaction. (b) angular momentum graph, corresponding to the Feynman diagram (a). Angular momentum graph for the spin part in which interaction line is removed should be included.
Coulomb integral, corresponding to a wavy line may be written as:
where and are multipole values of direct and exchange parts, and angular weight factors and depend on the coupling scheme . The case corresponds to monopole shake-up satellites, and the case corresponds to Auger decay or to final state configuration interaction. The Coulomb integrals were calculated using the atomic wave functions , obtained by the Hartree-Fock method [46,47] using the standard formula:
To calculate the angular part of the Feynman diagram, one must plot an angular momentum graph [48], in which the interaction vertex is topologically equivalent to the Feynman diagram and the free particle and hole lines are connected in correspondence to the coupling scheme [35]. Figure 1b shows the angular momentum graph for the satellite excitation in the case of the LS-coupling scheme. The spin momentum graph is obtained by removing an interaction line [48]. Additional arrows are also added in the case of coupling of holes [49]. When reducing the angular momentum graph of Figure 1b together with the spin momentum graph and adding factors for Coulomb interaction vertex [48] one obtains:
where if electrons li and lj are non-equivalent, if electrons li and lj are equivalent, and [a] denotes 2a + 1.
For the exchange graph, one must interchange lines of i- and j-holes at the Coulomb interaction line, what results in additional phase factors, and one obtains the weight factor before exchange integral:
where , if electrons li and lj are non-equivalent, and , if electrons li and lj are equivalent. Formulas (3) and (4) differ from the formulas for Auger decay [50], obtained by coupling of initial hole’s and final electron’s angular momentums and spins into Lij and Sij, by inessential common phase factor only.
The k-vacancy spectrum, which includes the main line, discrete shake-up, continuum shake-off excitations, and Auger decay is represented by a spectral function:
where E is the energy parameter of k-hole, which runs over all relevant values and − is the self-energy of k-vacancy.
In the second order of perturbation theory, the self-energy is represented by the Feynman diagrams of Figure 2a–c, and is defined by its real and imaginary parts as follows:
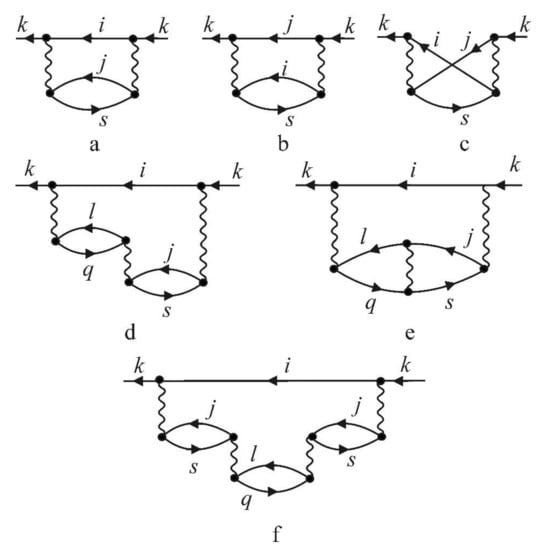
Figure 2.
Feynman diagrams for the spectral function in a simplified forth-order approach. (a–c) Direct and exchange second-order diagrams, (d,e) direct and exchange third-order diagrams for the decay of satellite into continuum, (f) fourth-order diagram (exchange parts are not shown).
It is assumed, that the sums in Equations (6) and (7) include integration over continuum energies also.
The integral of the spectral function equals to the unity and the intensity of all spectral distribution is proportional the photoionization cross-section calculated in Hartree–Fock approximation [27].
The positions of discrete satellites are the solutions of the Dyson equation:
The intensities of the main line and shake-up satellite relative to all spectral distribution are proportional to the spectroscopic factors:
If the discrete line is in the continuum of another transition, its spectroscopic factor may be calculated as an integral of the spectral function. Spectroscopic factors of all main lines in photoelectron spectra calculated by spectral function [18] and “overlapping” [19] methods are approximately the same and all are close to the value 0.8, and in general agree with the experiment [20].
The second-order diagrams and Formula (7) represent the broadening of the satellite due to the direct transitions from one-hole states to the shake-off continuum . If there exist at the same energy a discrete shake-up satellite it is broadened by the decay into underlying continuum . This process is represented by the Feynman diagram in Figure 2f and the contribution to the imaginary part of the self-energy is written as:
Figure 2d,e represent the interference between two ways of excitation of shake-off continuum, namely direct , and via shake-up resonance . The contribution of these diagrams to the spectral function is written as:
It is seen from Formulas (5), (7), (10) and (11), that contributions of decay channels to the spectral function are additive (in the numerator of Equation (5)) and the spectral functions for decay channels can be separated. Thus one can obtain the spectral function for low-energy Auger decay [31].
3. Noble Gases
Calculation of spectral functions in the simplified forth order approach (see Formulas (5)–(7), (10) and (11), and Figure 2) made it possible to reproduce strongly asymmetrical satellite lineshapes and to estimate intensities and lineshapes of low energy Auger decay. Figure 3 shows theoretical lineshape of the satellite , which is broadened by the decay into three continua , , and . The spectral densities of the satellite transferred to these three low energy Auger transitions are also shown. According to our calculations, the most intense is the transition to continuum, the intensity of transition to is significantly smaller, and a transitions to continuum is almost completely depressed. This prediction was confirmed by Kaneyashi et al. [36], who obtained the relative intensities 1D:1S:3P = 1500:400:300.
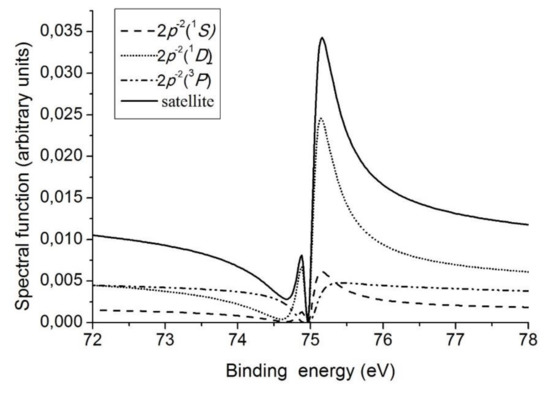
Figure 3.
Theoretical lineshape of the satellite which is broadened by the decay into three continua , and (at the satellite energy scale).
Figure 4 shows the satellite state , which is asymmetrically broadened due to decay into and continua. Theoretical curve reproduces experimental strongly asymmetrical lineshape having a Fano profile [12]. Theoretical lineshapes of low-energy Auger decay of this state are shown in Figure 5. It is seen in Figure 5, that the intensity of decay into the singlet channel is larger than the intensity of decay into the triplet channel . This result is in qualitative agreement with the experimental data of Hikosaka et al. [37].
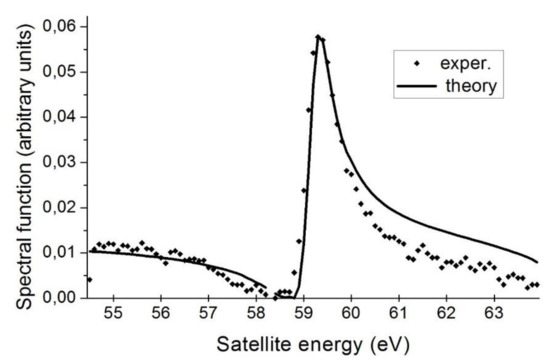
Figure 4.
Theoretical lineshape of satellite of Ne photoionization (solid line), diamonds experiment [12].
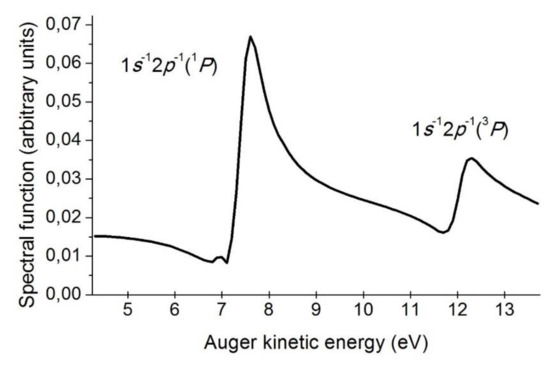
Figure 5.
Theoretical lineshape of valence Auger decay of satellite state into two continua and .
4. Atoms in Chemical Compounds
The photoionization of 3s-levels of 3d elements with the configuration due to the interaction between 3s-hole and unfilled 3d-shell results in a line split in two components. These components correspond to two states: a low spin state with total spin and a high spin state with total spin . It can be shown that this splitting is proportional to the spin S of the initial 3dN state. However, for Co3+(3d6(5D)) using atomic Hartree–Fock wavefunctions [46,47], we obtained exchange integral = 0.492 a.u., resulting in a splitting 13.4 eV between the states 4D and 6D, whereas experimental splitting is just 4.7 eV. Furthermore, the ratio of the spectral line intensities is not equal to a statistical ratio (2S + 2):2S = 6:4 [42]. In some works, this problem was solved by multiplication of the exchange integral by some scaling factor [10,11]. However, this formal decrease of the exchange integral is due to the interaction of the initial one-hole state with more complex two-hole-one-particle states [7,8,9]. This interaction is represented by the Feynman diagram shown in Figure 2a. Since holes i and j in the final state are equivalent, the exchange part is absent. The corresponding angular momentum graphs are shown in Figure 6. In this graph, all lines correspond to holes and a black square denotes fractional parentage coefficients for the hole configurations. Using graphical methods for calculating angular momentum graphs [48], we obtain the following formula for the weight factor before the Coulomb integral:
where l1, l2, and l3 correspond to s-, p-, and d-electrons, respectively, is the fractional parentage coefficient for the hole configurations of the 3d shell; is the number of holes in the 3d shell in the initial state. In our case, we obtained coefficients for the interaction of the term of initial state with excited states and 0.683 and 0.446, respectively.
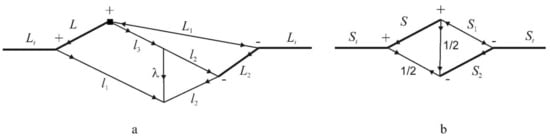
Figure 6.
Angular momentum graphs for the calculation of angular weight factors for the interaction between initial state in photoionization and a the state . (a) Orbital part, (b) spin part.
Formula (12) makes it possible to draw some qualitative conclusions about the configuration interaction under consideration. In the first line of the first 6j-symbol l1 = 0 and l3 = 2. Thus, according to the triangle rule for the first line of this 6j-symbol there is only one possible value for L2, i.e., L2 = 2. Therefore, only the term 1D among three possible terms 3P, 1D, and 1S, of the 3p−2 shell is involved in the configuration interaction. This circumstance makes it possible not only to simplify the calculations but also to qualitatively estimate the effect of the configuration interaction on the splitting of the 3s-line in the photoelectron spectrum. Consider atoms with the shell more than half-filled in the state of the ground term . According to the table of fractional parentage coefficients [51], the addition of one electron to the ground term results in terms of the configuration 3dN+1 with the spin S1 = S − 1/2. As shown above, the interaction of the state 3s−13dN with the states 3p−23dN+1 is possible only if the 3p−2 shell has the term 1D. For this reason and because the relation is fulfilled for ground terms when the high-spin state of 3s−13dN configuration does not interact with the configuration . Therefore, the configuration interaction at affects only the position of the low-spin state, resulting in the reduction of the splitting between low-spin and high-spin states.
In the case under consideration (the ground term 5D of the 3d6 shell), the interaction between the excited states involving two terms 4P and 4F of the configuration 3d7 is also possible. The Feynman diagrams of such an interaction are shown in Figure 2d,e. The corresponding formula for the self-energy part is written as:
where sums run over all distinct terms γ and δ of the configuration under consideration. Since only term 1D of 3p−2 configuration is possible, the sum runs over terms of 3dN+1 configuration with S1 = St.
The experimental 3s-photoelectron spectrum of Co3+ ion in paramagnetic BiCoO3 [42] is shown in Figure 7. Theoretical splitting of the 3s-line with account for configuration interaction (CI) 5.1 eV is in good agreement with experimental value 4.7 eV and with theoretical result 5.4 eV [7], obtained with account for a larger number of configurations. In the Hartree–Fock approximation (HF), the value of splitting equals 13.4 eV. The spectroscopic factor of the low-spin state calculated by Formula (9) equals 0.75. Taking into account the statistical ratio of the high-spin to low-spin component 1.5, we obtain theoretical ratio 2, which is equal to the experimental value. It was also pointed out that interaction with exited configuration 3p-4f is important [9]. However, the value of leading Coulomb integral in this case = −0.0088 a.u. is significantly less then = 0.650 a.u., used in the present work for the main channel of CI. That is why the main features of the spectrum can be reproduced by our method, which is equivalent to solving the secular matrix of dimension 3.
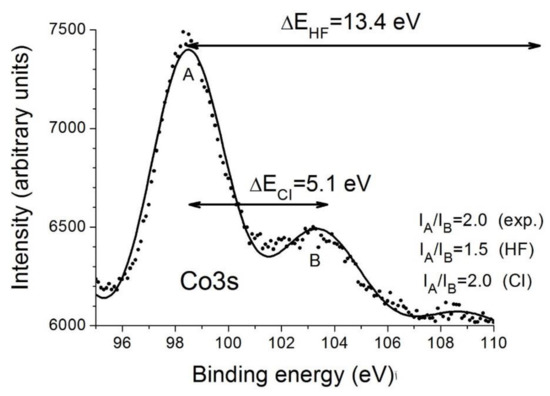
Figure 7.
Experimental 3s-photoelectron spectrum of Co3+ ion in paramagnetic BiCoO3 [42]. Theoretical line splitting in HF approximation (HF) and with account for configuration interaction (CI) are also shown.
In photoelectron spectra of the Th 5p [44] and U 5p [45] of ThO2 and UO2 a complex structure is observed instead of two components of the spin doublet 5p1/2 and 5p3/2. In XPS spectrum of ThO2, shown in Figure 8 a strong satellite peak with a binding energy of about 20 eV larger than the energy of the 5p3/2 peak appears. The experimental spin-orbit splitting 55.5 eV is significantly larger than the result of our Dirac–Fock calculation of 47.9 eV and the line 5p1/2 is asymmetrically broadened. These many-electron effects appear due to the interaction of the initial hole states 5p3/2(1/2) with the more complex two-hole-one-particle states . In this case, we used an intermediate coupling scheme and the corresponding momentum graph is shown in Figure 9. Reduction of this momentum graph results in the following formula for the weight factor:
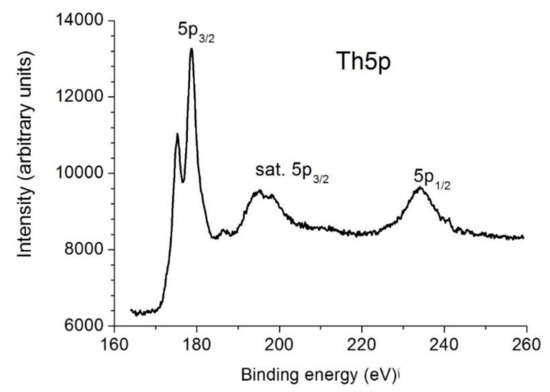
Figure 8.
Experimental Th5p photoelectron spectrum of ThO2 [44].
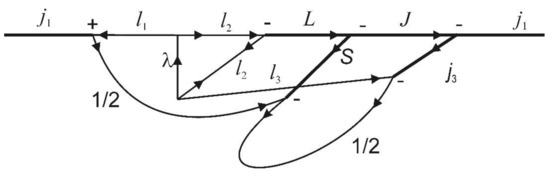
Figure 9.
Momentum graph for the calculation of final state configuration interaction in intermediate coupling scheme.
Where l1, l2, and l3 correspond to 5p-, 5d-holes, and 5f-electron, respectively, j1 is the total momentum of the 5p−1 hole, L, S, and J correspond to the terms of configuration 5d−2, the summation is over all half-integer κ in the specified interval, and λ takes values 1 and 3. Formula (14) is a generalization of the non-relativistic formula for Auger decay [50] in the case of intermediate coupling. Note that the first of the 6j-symbols in Formula (14) is also present in the non-relativistic formula [43]. It follows from the triangular condition for elements of the first row of this 6j-symbol, that interaction of the initial vacancy is possible only with three terms 1DJ, 3FJ, and 1GJ of the shell 5d−2.
Formula (14) was used to calculate the interaction of the initial hole 5p−1 with the excited states 5d−25f in the secular matrix. In addition, the interaction between two-hole-one-particle states was taken into account. The spectrum of the Th 5p3/2 electrons was calculated by solving the secular matrix. The eigenvalues of the secular matrix correspond to the positions of the spectral lines, and the squares of the elements of the eigenvector, corresponding to the energy of the main line give the intensities of all lines. In the case of ionization of the 5p1/2 subshell the levels of the excited configuration are far from the single-hole state, whereas Auger decay into the continuous states is possible, which leads to the asymmetrical broadening of the Th 5p1/2 line. To calculate the spectrum of the 5p1/2 electrons, we used the spectral function method (see Formula (5)). The theoretical spectrum with overall energy shift −9.6 eV representing solid-state effects [44] is shown in Figure 10. The calculated Th 5p spectrum consists of three groups of lines which can be attributed to the 5p1/2 and 5p3/2 lines and satellites, i.e., the states. Many-electron effects reduce the binding energies of the 5p3/2 electrons, and as a result, spin–orbit splitting reaches the value 55 eV, which corresponds to the experimental value 56 eV. It is seen in Figure 10 that the 5p1/2 line is asymmetrically broadened with raised low binding energy side. The spectroscopic factor of the 5p1/2 line, estimated as the integral of the spectral function Equation (5) in an interval of 10 eV (which corresponds to the interval where the intensity of the line was experimentally determined) with background subtraction equals 0.69. Thus the theoretical ratio of the intensities I(5p3/2):I(5p1/2), when the satellites are included in 5p3/2 line, equals 2.9:1. Experiential value of this ratio depends on the background subtraction. When Shirley’s method was used, this ratio equals 5:1, but in linear background subtraction, we obtained the ratio 3.6:1.
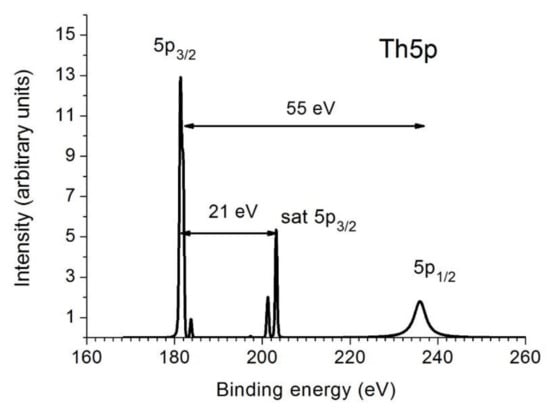
Figure 10.
Theoretical Th 5p photoelectron spectrum. The satellite structures of the 5p3/2 line were calculated by the CI method. The spectral function of 5p1/2 line was calculated in the second order of perturbation theory. The lineshape 5p1/2 is slightly asymmetrical, with a raised low-binding energy side.
5. Conclusions
In the present work, it was shown that for different relations between interaction parameters in the final state, appearing after photoionization, different approaches of MBPT can be used. A spectral function approach with account for the imaginary part of the self-energy in simplified fourth-order make it possible to calculate asymmetrical lineshapes of satellites in photoelectron spectra and of low-energy Auger spectra. Dyson’s equation in the third-order makes it possible to calculate the line positions in the case of weak interaction between excited states. In particular, in the case of 3s-spectra of 3d-elements accounting for a very limited number of Feynman diagrams made it possible to reach agreement with the experiment and to draw a qualitative conclusion on many-electron effects for 3d-shell more than half-filled. However, in the case of strong CI in 5p-spectra, the method of secular matrix solution is more appropriate. This series of research was inspired by Miron Ya. Amusia, who was the first person to proposed to use unified MBPT technique for CI and satellite excitations.
Author Contributions
V.G.Y., software and theoretical calculations; Y.A.T., methodology and experimental investigations. All authors have read and agreed to the published version of the manuscript.
Funding
The work was supported by IGIC RAS state assignment and RRC “KI” state assignment.
Institutional Review Board Statement
The study was conducted in accordance with the Declaration of Helsinki, and approved by the Institutional Review Board of IGIC RAS in agreement with RRC “KI” 04.05.2022.
Informed Consent Statement
Not applicable.
Data Availability Statement
Not applicable.
Conflicts of Interest
The authors declare no conflict of interest.
References
- Wendin, G. Breakdown of one-electron pictures in photoelectron spectra. In Structure and Bonding; Springer: Berlin/Heidelberg, Germany, 1981; Volume 45, pp. 1–125. ISBN 978-3662157800. [Google Scholar]
- Kowalczyk, S.P.; Ley, L.; Martin, R.L.; McFeely, F.R.; Shirley, D.A. Relaxation and final-state structure in XPS of atoms, molecules, and metals. Faraday Discuss. Chem. Soc. 1975, 60, 7–17. [Google Scholar] [CrossRef] [Green Version]
- Sham, T.K.; Wendin, G. Screening and configuration-interaction effects in the 5p X-ray-photoelectron spectrum of Th metal. Phys. Rev. Lett. 1980, 44, 817–820. [Google Scholar] [CrossRef]
- Boring, M.; Cowan, R.D. Satellite structure in the 5p and 5s X-ray-photoelectron spectra of the actinides. Phys. Rev. B 1981, 23, 445–448. [Google Scholar] [CrossRef]
- Fadley, C.S.; Shirley, D.A. Multiplet splitting of metal-atom electron binding energies. Phys. Rev. A 1970, 2, 1109–1113. [Google Scholar] [CrossRef] [Green Version]
- Kowalczyk, S.P.; Ley, L.; Pollak, R.A.; McFeely, F.R.; Shirley, D.A. New multiplet structure in photemission from MnF2. Phys. Rev. B 1973, 7, 4009–4011. [Google Scholar] [CrossRef] [Green Version]
- Viinikka, E.-K.; Ohrn, Y. Configuration mixing in the 3s-hole state of transition-metal ion. Phys. Rev. B 1975, 11, 4168–4175. [Google Scholar] [CrossRef]
- Bagus, P.S.; Freeman, A.J.F.; Sasaki, F. Prediction of new multiplet structure in photoemission experiments. Phys. Rev. 1975, 30, 850–853. [Google Scholar] [CrossRef]
- Bagus, P.S.; Broer, R.; Ilton, E.S. A new near degeneracy effect for photoemission in transition metals. Chem. Phys. Lett. 2004, 394, 150–154. [Google Scholar] [CrossRef]
- Kochur, A.G.; Ivanova, T.M.; Shchukarev, A.V.; Sidorov, A.A.; Kiskin, M.A.; Novotortsev, V.M.; Eremenko, I.L. Mn3s X-ray photoelectron spectra of polynuclear trimethylacetate complexes of manganese. Bull. Russ. Acad. Sci. Phys. 2010, 74, 625–630. [Google Scholar] [CrossRef]
- Okada, K.; Kotani, A. Interatomic and intra-atomic configuration interactions in core-level X-ray photoemission spectra of late transition metal compounds’. J. Phys. Soc. Jpn. 1992, 61, 4619–4637. [Google Scholar] [CrossRef]
- Svensson, S.; Eriksson, B.; Martensson, N.; Wendin, G.; Gelius, U. Electron shake-up and correlation satellites and continuum shake-off distributions in X-ray photoelectron spectra of the rare gas atoms. J. Electron Spectrosc. Relat. Phenom. 1988, 47, 327–384. [Google Scholar] [CrossRef]
- Pahler, M.; Caldwell, C.D.; Schaphorst, S.J.; Krause, M.O. Intrinsic linewidths of neon 2s2p5 (1,3P)nl 2L correlation satellites. J. Phys. B At. Mol. Opt. Phys. 1993, 26, 1617–1625. [Google Scholar] [CrossRef]
- Hall, R.I.; Dawber, G.K.; Ellis, K.; Zubek, M.; Avaldi, L.; King, G.C. Near-threshold study of the neon photoelectron satellites. J. Phys. B At. Mol. Opt. Phys. 1991, 24, 4133–4146. [Google Scholar] [CrossRef]
- Yarzhemsky, V.G.; Amusia, M.Y.; Bolognesi, P.; Avaldi, L. A study of the Ne 2s2p5(3P)3s and 3p correlation satellites up to 75 eV above threshold. J. Phys. B At. Mol. Opt. Phys. 2010, 43, 185204. [Google Scholar] [CrossRef]
- Krause, M.O.; Whitfield, S.B.; Caldwell, C.D.; Wu, J.-Z.; Schaphorst, S.J.; van der Meulen, P.; de Lange, C.A.; Hansen, R.W.C. Outer ns, np correlation satellites in the rare gases—A photoelectron spectrometry study with an undulator photon source. J. Electron Spectrosc. Relat. Phenom. 1992, 58, 79–104. [Google Scholar] [CrossRef]
- Kikas, A.; Osborne, S.J.; Ausmees, A.; Svensson, S.; Sairanen, O.-P.; Aksela, S. High-resolution study of the correlation satellites in photoelectron spectra of the rare gases. J. Electron Spectrosc. Relat. Phenom. 1996, 77, 241–266. [Google Scholar] [CrossRef]
- Yarzhemsky, V.G.; Nefedov, V.I.; Trzhaskovskaya, M.B.; Band, I.M.; Szargan, R. The influence of core hole relaxation on the main-line intensities in X-ray photoelectron spectra. J. Electron Spectrosc. Relat. Phenom. 2002, 123, 1–10. [Google Scholar] [CrossRef]
- Yarzhemsky, V.G.; Trzhaskovskaya, M.B. Spectroscopic factors of atomic subshells for HAXPES applications. At. Data Nucl. Data Tables 2021, 139, 101387. [Google Scholar] [CrossRef]
- Seah, M.P.; Gilmore, I.S. Quantitative X-ray photoelectron spectroscopy: Quadrupole effects, shake-up, Shirley background, and relative sensitivity factors from a database of true X-ray photoelectron spectra. Phys. Rev. B 2006, 73, 174113, Erratum in Phys. Rev. B 2007, 75, 149901. [Google Scholar] [CrossRef]
- Åberg, T. Theory of X-ray satellites. Phys. Rev. 1967, 156, 35–41. [Google Scholar] [CrossRef]
- Manne, R.; Åberg, T. Koopmans’ theorem for inner-shell ionization. Chem. Phys. Lett. 1970, 2, 282–284. [Google Scholar] [CrossRef]
- Martin, R.L.; Shirley, D.A. Theory of core-level photoemission correlation state spectra. J. Chem. Phys. 1976, 64, 3685–3689. [Google Scholar] [CrossRef] [Green Version]
- Armen, G.B.; Åberg, T.; Karim, K.R.; Levin, J.C.; Crasemann, B.; Brown, G.S.; Chen, M.H.; Ice, G.E. Threshold double photoexcitation of argon with synchrotron radiation. Phys. Rev. Lett. 1985, 54, 182–185. [Google Scholar] [CrossRef] [PubMed]
- Sukhorukov, V.L.; Lagutin, B.M.; Petrov, I.D.; Schmoranzer, H.; Ehresmann, A.; Vollweiler, F.; Schartner, K.-H. Resonance structure of the photoionization cross sections of the Kr atom in the energy region between single and double ionization thresholds. J. Electron Spectrosc. Relat. Phenom. 1995, 76, 421–426. [Google Scholar] [CrossRef]
- Lagutin, B.M.; Petrov, I.D.; Sukhorukov, V.L.; Whitfield, S.B.; Langer, B.; Viefhaus, J.; Wehlitz, R.; Berrah, N.; Mahler, W.; Becker, U. Cross sections and angular distributions of the photoelectron correlation satellites of the Xe atom. J. Phys. B At. Mol. Opt. Phys. 1996, 29, 937–976. [Google Scholar] [CrossRef]
- Kheifets, A.S.; Amusia MYa Yarzhemsky, V.G. On the validity of quasi-particle approximation in photoelectron spectroscopy. J. Phys. B. At. Mol. Opt. Phys. 1985, 18, L343–L350. [Google Scholar] [CrossRef]
- Yarzhemsky, V.G.; Armen, G.B.; Larkins, F.P. Calculation of the shake-up satellites in the 1s and 2s X-ray photoelectron spectra of neon. J. Phys. B At. Mol. Opt. Phys. 1993, 26, 2785–2794. [Google Scholar] [CrossRef]
- Kheifets, A.S. Green’s function calculation of the satellite spectrum of neon. J. Phys. B At. Mol. Opt. Phys. 1995, 28, 3791–3803. [Google Scholar] [CrossRef]
- Yarzhemsky, V.G.; Kheifets, A.S.; Armen, G.B.; Larkins, F.P. Linewidths and intensities of satellites in photoelectron spectra in the presence of an underlying continuum. J. Phys. B At. Mol. Opt. Phys. 1995, 28, 2105–2112. [Google Scholar] [CrossRef]
- Yarzhemsky, V.G.; Larkins, F.P. The shapes of Auger decay lines in photoelectron satellite spectra. Eur. Phys. J. D At. Mol. Opt. Plasma Phys. 1999, 5, 179–184. [Google Scholar] [CrossRef]
- Yarzhemsky, V.G.; Amusia, M.Y.; Chernysheva, L.V. Lineshape of Ne 1s photoionization satellite [1s2s](3S) 3s and its valence Auger decay spectrum. J. Electron Spectrosc. Relat. Phenom. 2002, 127, 153–159. [Google Scholar] [CrossRef]
- Yarzhemsky, V.G.; Nefedov, V.I.; Amusia MYa Chernysheva, L.V. The shapes of photoelectron satellite spectra. Surf. Rev. Lett. 2002, 9, 1209–1212. [Google Scholar] [CrossRef]
- Yarzhemsky, V.G.; Sgamellotti, A. Auger rates of second-row atoms calculated by many-body perturbation theory. J. Electron Spectrosc. Relat. Phenom. 2002, 125, 13–24. [Google Scholar] [CrossRef]
- Amusia, M.Y.; Chernysheva, L.V.; Yarzhemsky, V.G. Handbook of Theoretical Atomic Physics; Springer: Berlin/Heidelberg, Germany, 2012; p. 799. [Google Scholar] [CrossRef] [Green Version]
- Kaneyasu, T.; Hikosaka, Y.; Shigemasa, E.; Penent, F.; Lablanquie, P.; Aoto, T.; Ito, K. Autoionization of the Ne+ Rydberg states formed via valence photoemission. J. Phys. B At. Mol. Opt. Phys. 2007, 40, 4047–4060. [Google Scholar] [CrossRef]
- Hikosaka, Y.; Aoto, T.; Lablanquie, P.; Penent, F.; Shigemasa, E.; Ito, K. Experimental investigation of core-valence double photoionization. Phys. Rev. Lett. 2006, 97, 053003. [Google Scholar] [CrossRef]
- Püttner, R.; Goldsztejn, G.; Céolin, D.; Rueff, J.-P.; Moreno, T.; Kushawaha, R.K.; Marchenko, T.; Journel, L.; Lindle, D.W.; Piancastelli, M.N.; et al. Direct Observation of Double-Core-Hole Shake-Up States in Photoemission. Phys. Rev. Lett. 2015, 114, 093001. [Google Scholar] [CrossRef]
- Goldsztejn, G.; Marchenko, T.; Püttner, R.; Journel, L.; Guillemin, R.; Carniato, S.; Selles, P.; Travnikova, T.; Céolin, D.; Lago, A.F.; et al. Double-Core-Hole States in Neon: Lifetime, Post-Collision Interaction, and Spectral Assignment. Phys. Rev. Lett. 2016, 117, 133001. [Google Scholar] [CrossRef]
- Amusia, M.Y.; Chernysheva, L.V.; Yarzhemsky, V.G. On photoionization in the hard X-ray region. JETP Lett. 2013, 97, 704–707. [Google Scholar] [CrossRef] [Green Version]
- Yarzhemsky, V.G.; Amusia, M.Y. Calculation of Ar photoelectron satellites in the hard-X-ray region. Phys. Rev. A 2016, 93, 063406. [Google Scholar] [CrossRef] [Green Version]
- Yarzhemsky, V.G.; Teterin, Y.A.; Presnyakov, I.A.; Maslakov, K.I.; Teterin, A.Y.; Ivanov, K.E. Many-electron effects in Co 3s X-ray photoelectron spectra of diamagnetic ScCoO3 and paramagnetic BiCoO3 Cobaltites. JETP Lett. 2020, 111, 422–427. [Google Scholar] [CrossRef]
- Yarzhemsky, V.G.; Teterin, Y.A.; Sosulnikov, M.I. Dynamic dipolar relaxation in X-ray photoelectron spectra of Ba4p subshell in barium compounds. J. Electron Spectrosc. Relat. Phenomom. 1992, 59, 211–222. [Google Scholar] [CrossRef]
- Yarzhemsky, V.G.; Teterin Yu, A.; Maslakov, K.I.; Teterin, A.Y.; Ivanov, K.E. Many-electron effects in Th 5p and 5s X-ray photoelectron spectra of ThO2. JETP Lett. 2021, 114, 609–615. [Google Scholar] [CrossRef]
- Maslakov, K.I.; Yarzhemsky, V.G.; Teterin, Y.A.; Teterin, A.Y.; Ivanov, K.E. Complex XPS spectra structure of U5p electrons and the uranium oxidation state. Radiochemistry 2020, 62, 608–616. [Google Scholar] [CrossRef]
- Amusia, M.Y.; Chernysheva, L.V. Computation of Atomic Processes; IOP Publishing: Bristol/Philadelphia, PA, USA, 1997; ISBN 9780750302296. [Google Scholar]
- Amusia, M.Y.; Chernysheva, L.V. Computation of atomic and molecular processes. In Introducing the ATOM-M Software Suite; Springer: Berlin/Heidelberg, Germany, 2021; p. 456. ISBN 978-3-030-85142-2. [Google Scholar]
- Lindgren, I.; Morrison, J. Atomic Many-Body Theory; Springer: Berlin/Heidelberg, Germany, 1982; p. 472. ISBN 978-3-642-96614-9. [Google Scholar]
- Judd, B.R. Second Quantization and Atomic Spectroscopy; Baltimore MD Johns Hopkins press: Baltimore, MD, USA, 1967; ISBN 0801803225/9780801803222. [Google Scholar]
- Walters, D.L.; Bhalla, C.P. Nonrelativistic auger Rates, X-ray rates, and fluorescence yields for the K shell. Phys. Rev. A 1971, 3, 1919–1926. [Google Scholar] [CrossRef]
- Sobelman, I.I. Atomic spectra and radiative transitions. In Chemical Physics Book Series (CHEMICAL, V. 1); Springer: Berlin/Heidelberg, Germany, 1979; p. 308. ISBN 978-3-662-05905-0. [Google Scholar]
Publisher’s Note: MDPI stays neutral with regard to jurisdictional claims in published maps and institutional affiliations. |
© 2022 by the authors. Licensee MDPI, Basel, Switzerland. This article is an open access article distributed under the terms and conditions of the Creative Commons Attribution (CC BY) license (https://creativecommons.org/licenses/by/4.0/).