Abstract
Pulsating auroras are usually observed with ultralow-frequency (ULF) waves in the Pc 3–5 band (period 10–600 s). These auroras are thought to result from interactions between energetic electrons and chorus waves, but their relationship with ULF waves remains an open question. In this study, we investigated this question by conducting a comparative study on two ULF wave events with pulsating auroras observed near the magnetic footprints. Conjugate observations from the Magnetospheric Multiscale mission and the Chinese Yellow River Station were used. In both events, lower-band chorus waves were observed, which were suggested to be connected with the auroral pulsations by wavelet analysis. The intensity of these waves oscillates at the period of the ULF waves, but the physics laid behind them differs by events. During the event of 22 January 2019, compressional ULF waves changed the threshold for the whistler anisotropy instability periodically, affecting the emission of chorus waves. In the event on 10 January 2016, poloidal ULF waves modulated the chorus wave generation by regulating electron temperature anisotropy through drift resonance. ULF waves in these events may originate from perturbations in the solar wind. We highlight the role of ULF waves in the solar wind–magnetosphere–ionosphere coupling, which requires further study.
1. Introduction
How energy flows in the solar system is one of the critical questions in solar–terrestrial space physics. In the terrestrial magnetosphere, ultralow-frequency (ULF) waves in the Pc 3–5 band (period 10–600 s [1]) have been studied for decades due to their essential roles in energy transport throughout the entire system. ULF waves can originate from either external sources, such as solar wind dynamic pressure pulses, the Kelvin–Helmholtz instability and periodical waves in the solar wind, or internal sources, such as wave–particle interactions [1,2,3,4,5,6]. These widely distributed waves have periods close to time scales of particle bounce and drift motion, making it possible for them to exchange energy with particles efficiently through drift resonance [5,7,8,9,10,11,12] and drift–bounce resonance [13,14,15,16,17,18,19].
ULF waves are magnetohydrodynamic waves in the macroscale (∼10 km). However, they can transfer energy into smaller scales, modulating waves with higher frequencies. In the scale of ion cyclotron motion, direct evidence of ions simultaneously interacting with ULF waves and electromagnetic ion cyclotron waves has been reported [20]. In the electron scale, ULF waves can modulate the intensity of whistler-mode very low frequency (VLF) waves (e.g., chorus waves and electrostatic electron cyclotron harmonic (ECH) waves) by affecting electron density [21] and the distribution of hot electrons [22,23,24]. In addition, periodic regulation of magnetic field configurations caused by ULF waves leads to the modulated nonlinear growth of chorus waves [25].
Diffuse pulsating auroras are extensively researched because of their potential implications on wave–particle interactions. These auroras are believed to be connected with lower-band chorus waves or ECH waves, which can scatter electrons with higher (>a few keV) or lower (hundreds of eV to a few keV) energies into the loss cone [26,27,28,29]. Previous investigations have demonstrated the one-to-one correlation between precipitating electron fluxes and chorus wave elements [30]. Finer structures of pulsating auroras (e.g., multiple time-scale beats) have been examined using high-speed imaging, affirming their origins from chorus wave–electron resonant interactions [31]. Moreover, some auroral pulsations also display the periodicity at the Pc 3–5 band, which may be linked to ULF waves. Although several instances of auroral emissions modulated by chorus waves associated with compressional ULF waves have been documented [32,33], the physical connection between ULF waves (especially their transverse branches) and pulsating auroras remains unclear. In this study, we investigated the modulation of dayside pulsating auroras by ULF waves through a comparison of two events using conjugate observations from the Magnetospheric Multiscale Mission (MMS) [34] spacecraft and the Chinese Yellow River Station (YRS). We find that both compressional and transverse ULF waves can modulate the intensity of lower-band chorus waves, resulting in auroral pulsations. Additionally, we established the observational evidence chain of energy transport from the solar wind down to the ionosphere. We emphasize the role of ULF waves in this process, which warrants further investigation.
2. Instrumentation and Methods
In this study, we analyzed in situ observations from the MMS in the dayside outer magnetosphere. The MMS consists of four identical spacecraft. All the spacecraft are equatorial-orbit satellites equipped with instruments measuring particles and fields. We used electron flux data acquired by the Fly’s Eye Energetic Particle Spectrometer (FEEPS) [35] and fast plasma investigation (FPI) [36] dual electron spectrometers (DES). The ion flux and moment data were acquired by the FPI dual ion spectrometers (DIS) and the hot plasma composition analyzer (HPCA) [37]. The magnetic field, electric field, and wave power spectral density data were obtained by the flux gate magnetometers (FGM) [38], the electric field double probe (EDP) [39,40], and the digital signal processor (DSP) in the FIELDS [41] instrumentation suite, respectively. FEEPS detects energy and pitch angle-resolved electron differential fluxes from 25 keV to 650 keV with a sr solid-angle coverage. FPI measures electron and ion velocity–space distribution from 10 eV to 30 keV without distinguishing ion species.HPCA measures composition-resolved ion distributions from 1 eV to 40 keV. DSP provides magnetic (BPSD) and electric (EPSD) field power spectral densities covering the frequency range of 0.2–6000 Hz and 1–8000 Hz. The temporal resolution of the used FEEPS, FPI, HPCA, FGM, EDP, and DSP data is ∼2.4 s, 4.5 s, 10 s, 62.5 ms, 31.2 ms, and 2 s, respectively. Note that we averaged data from four spacecraft to reduce noise, since the distances between spacecraft are small (tens of km) and nearly all data from them are similar.
Ground-based aurora imaging data required in this study were obtained by all-sky imagers (ASIs) at YRS. YRS is located at Ny-Ålesund, Svalbard (corrected geomagnetic latitude , magnetic local time (MLT) ), which is one of the few points in the Northern Hemisphere where optical observations of auroras can be made in the dayside. Three identical ASIs with narrow-band interferential filters at 557.7 nm, 630.0 nm, and 427.8 nm have been conducting continuous auroral observations in YRS since 2003. The auroral emissions at these three bands are mainly caused by electron precipitation with energies of 0.5 to a few keV, <500 eV, and >a few keV, respectively [42]. The temporal resolution of the ASI data is 10 s (exposure time: 7 s, readout time: 3 s) and the spatial resolution is ∼1 km (zenith) to ∼36 km (horizon) at an altitude of 150 km.
To estimate the footprints of MMS, we used the T01 [43,44] model and the International Geomagnetic Reference Field (IGRF) model to trace magnetic field lines. The input solar wind parameters were set based on the mean values of OMNI data 15 min before and after both events (for the 22 January 2019 event: , interplanetary magnetic field (IMF) , IMF and ; for the 10 January 2016 event: , IMF , IMF and ). Since MMS is located in the outer magnetosphere and its footprints are located near the edge of the field of view, the magnetic field line mapping is a potential source of uncertainty. Therefore, we integrated counts between – latitudes to reduce the uncertainty.
3. Results
3.1. The 22 January 2019 Event
A ULF wave event was observed by MMS on 22 January 2019 (Figure 1). During this event, MMS was located at L ∼9.5 and MLT ∼10.1 h. The measured magnetic and electric fields oscillate quasi-periodically, as shown in Figure 1a–c. Note that the wave fields inthe geocentric solar ecliptic (GSE) coordinates (Figure 1b,c) are detrended with a 90 s time window. Near the magnetic footprints of MMS, pulsating diffuse auroras were observed by the 557.7 nm ASI at YRS. Figure 1g–l presents the original ASI images for two successive periods and Figure 1d shows the 90 s detrended counts (integrated between – latitudes in altitude-adjusted corrected geomagnetic (AACGM) coordinates). The auroral snapshots correspond to the peaks and valleys in Figure 1d. The 427.8 nm ASI also observed the pulsating aurora, while the 630.0 nm ASI did not capture relevant signals (see Video S1 in the Supporting Information). Since MMS was positioned near the equator (magnetic latitude ), the GSE-z component is close to the direction parallel to background magnetic fields. According to wavelet analysis [45], we find the diffuse aurora pulsates at the same period (∼47.6 s) with the GSE-z component of magnetic fields (Figure 1e,f), which agrees with prior reports of pulsating auroras modulated by compressional ULF waves [32]. The wavelet power spectrograms of all components are shown in Figure S1 in the Supporting Information.
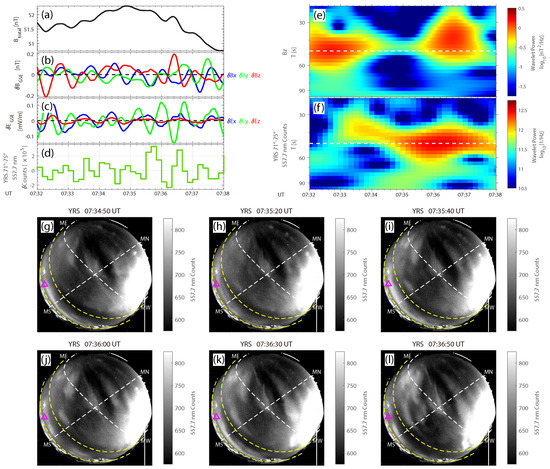
Figure 1.
Overview of the 22 January 2019 event. (a–c) Field observations from MMS spacecraft. (a) The magnetic field strength measured by FGM. (b,c) 90 s detrended magnetic (b) and electric (c) field components in geocentric solar ecliptic (GSE) coordinates, derived from FGM and EDP measurements respectively. Blue, green and red curves in (b,c) show the GSE-x, y and z components, respectively. (d) 90 s detrended counts (integrated between – latitudes in altitude-adjusted corrected geomagnetic (AACGM) coordinates), calculated from YRS 557.7 nm ASI data. (e,f) Wavelet power spectrograms of the measured magnetic field GSE-z component (e) and integrated counts (f). White dashed lines mark the period of 47.6 s. (g–l) Auroral images obtained by YRS 557.7 nm ASI. Yellow dashed curves in (g–l) show and latitudes in AACGM coordinates, corresponding to the integration area in (d). White dashed curves in (g–l) mark the latitude and longitude that cross the zenith. Magenta triangles in (g–l) represent the magnetic footprints of MMS.
Pulsating auroras are thought to be connected with the pitch angle scattering of electrons by VLF waves [26,27,29,31,32]. Therefore, we next investigated the VLF wave activities during this event. Figure 2a–c shows the ULF wave fields in mean (15 min averaged) field-aligned (MFA) coordinates [5]. Accompanied with ULF waves, lower-band chorus waves with were observed (Figure 2d). Using measured quantities, we estimated the propagating time of precipitating electrons with energy around the minimum cyclotron resonant energy [46] to the emission height of auroras to be ∼2.2 s [47]. The brightness of pulsating auroras oscillates in phase with the residual chorus power (, where P is the fast Fourier transform power integrated between – and is a 90 s running average of P [10]) after being time-shifted (Figure 2e). Interpolating the 2 s resolution wave power data to the temporal resolution of auroral imaging (10 s), we calculated the squared wavelet coherence [45] between them. The coherence at the pulsating period (47.6 s) is high (>0.80, Figure 2f), suggesting the auroral pulsation is caused by the observed chorus waves. We also derived the wavelet coherence between the residual chorus power and as shown in Figure 2g (∼0.75), which further indicates the connection between chorus emissions and compressional ULF waves.
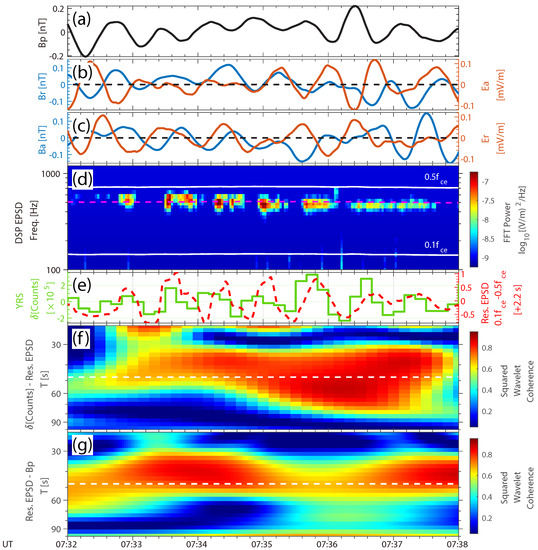
Figure 2.
Observations of chorus waves in the 22 January 2019 event. (a–c) Ultralow-frequency wave fields in mean field-aligned coordinates, derived from FGM and EDP measurements. (a) The parallel magnetic field . (b) The radial magnetic field (blue curve) and azimuthal electric field (orange curve). (c) The azimuthal magnetic field (blue curve) and radial electric field (orange curve). (d) The electric field fast Fourier transform power spectrogram, obtained by DSP. White curves mark the frequencies of and ( is the local cyclotron frequency of electrons). The magenta dashed curve indicates the frequency of . (e) The 90 s detrended ASI counts (same as Figure 1d) (green curve) and the 2.2 s time-shifted residual chorus power (integrated between –) (red dashed curve). (f) The squared wavelet coherence between the detrended counts and the residual power in (e). (g) The squared wavelet coherence between the residual chorus power and in (a,e). The white dashed line marks the period of 47.6 s.
To understand the role of ULF waves in this event, we analyzed the excitation of chorus waves. According to the linear theory of the whistler anisotropy instability [48], the threshold condition can be written as:
in which , and are the perpendicular temperature, the parallel temperature, and the parallel beta of electrons respectively. and are fitting parameters. Therefore, the whistler anisotropy instability depends on electron temperature anisotropy, parallel thermal pressure, and the parallel component of magnetic fields (). As shown in Figure 3a,b, the residual chorus power has an anti-phase relationship with . We derived the specific electron temperature anisotropy for each energy channel (Figure 3c) by [49]:
where is the electron phase space density, E is the energy channel, and is the pitch angle. The calculated minimum cyclotron resonant energy [46] for is marked by the black dashed curve in Figure 3c. Above the minimum resonant energy, the electron temperature anisotropy is positive, with the maximum anisotropy lying in 100–400 keV. Consequently, the plasma environment can excite the whistler anisotropy instability to form chorus waves. However, the energy fluxes of 100–400 keV electrons do not oscillate with , indicating that the variation of chorus intensity is not caused by changes from the anisotropy (Figure 3d). We propose the oscillation of changes the threshold for the whistler anisotropy instability (the right-hand side of Equation (1)) quasi-periodically, leading to the modulated emission of chorus waves.
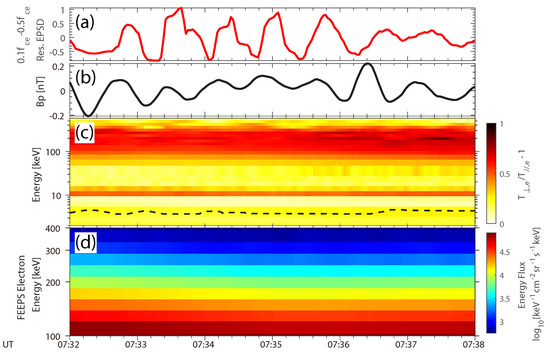
Figure 3.
Observations relevant to chorus wave excitation in the 22 January 2019 event. (a) The residual chorus power (same as that in Figure 2e, but without being time-shifted). (b) The parallel magnetic field , same as Figure 2a. (c) The specific electron temperature anisotropy for each energy channel, calculated from FEEPS and FPI-DES data. The black dashed curve in (c) marks the minimum cyclotron resonant energy for . (d) The energy-time spectrogram for 100–400 keV electron omni-directional energy fluxes, derived from FEEPS data.
3.2. The 10 January 2016 Event
Another ULF wave event was observed by MMS on 10 January 2016 at MLT ∼10.9 h near the magnetopause (Figure 4a–c). Pulsating diffuse auroras were observed by YRS simultaneously near the magnetic footprints. Figure 4g–l shows two successive pulsation periods recorded by the 557.7 nm ASI. The 427.8 nm ASI also observed the pulsating aurora, while the 630.0 nm ASI did not (see Video S2 in Supporting Information). Considering the non-monochromaticity of waves, we used a 60 s time window to detrend data. The detrended ASI counts (integrated between AACGM – latitudes, Figure 4d) oscillate quasi-periodically with ULF wave fields (Figure 4b,c). The wavelet power spectrogram in Figure 4e shows the electric field GSE-y component fluctuating at ∼43.5 s. Figure 4f suggests the integrated ASI counts have two main period components. Here we only discuss the component of the shorter period, which was located at ∼43.5 s. As MMS was positioned near the local noon, GSE-y is close to the azimuthal direction (eastward). However, the power of the magnetic field GSE-z component (, close to the parallel direction) near 43.5 s is weak (see Figure S2 in the Supporting Information), indicating the physics behind it is different from that of the 22 January 2019 event.
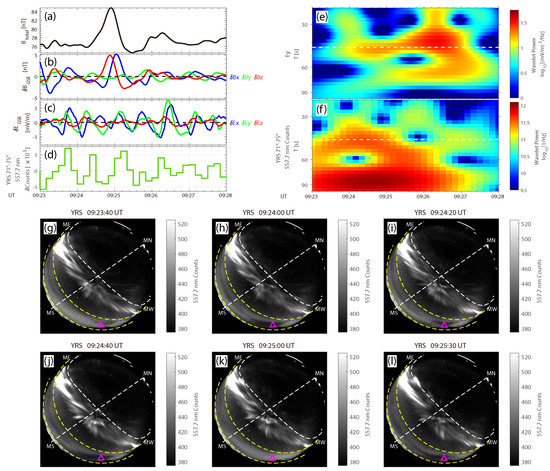
Figure 4.
Overview of the 10 January 2016 event with the same format as Figure 1, except (e) shows the wavelet power spectrogram of the measured electric field GSE-y component. The data in (b–d) are detrended with a 60 s time window. White dashed lines in (e,f) mark the period of 43.5 s.
The auroral pulsation in this event is also connected with chorus waves. Figure 5a–c gives the measured fields in MFA coordinates [5], which suggest the ULF transverse waves are dominated by their poloidal branches (the radial magnetic field and the azimuthal electric field ). Note that a significant variation is presented in around 09:24–09:26 UT, which could be caused by variations of solar wind dynamic pressure [1] or transients in the foreshock and magnetosheath [50,51]. Lower-band chorus waves are observed at ∼0.16 (Figure 5d). Based on observations and modeled fields, we estimated the propagating time of minimum-resonant energy-precipitating electronsfrom MMS to the auroral emission height to be ∼1.2 s. The aurora brightness varies in phase with the time-shifted residual power of chorus waves (integrated between –), as shown in Figure 5e. The mean squared wavelet coherence between the detrended counts and the residual chorus power at the pulsating period (43.5 s) is ∼0.54 (maximum: 0.79, Figure 5f), indicating the auroral pulsation results from the observed chorus waves. However, the coherence between the residual power and at 43.5 s is low most of the time (Figure 5g), which implies that the modulation of chorus intensity is irrelevant to .
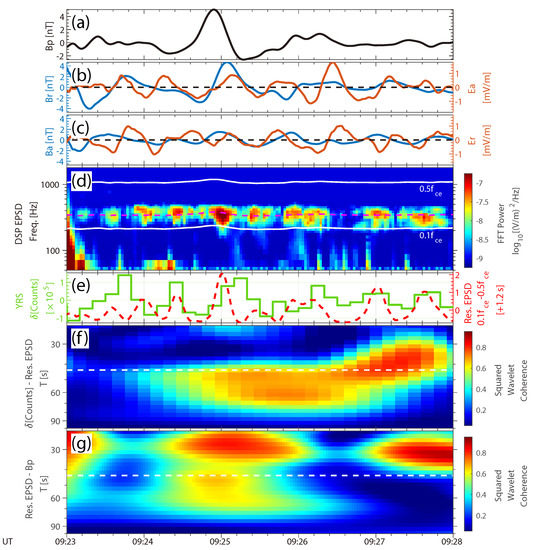
Figure 5.
Observations of chorus waves in the 10 January 2016 event, with the same format as Figure 2. The magenta dashed curve in (d) marks the frequency of . The residual chorus power in (e) is time-shifted by 1.2 s. The white dashed line in (f,g) represents the period of 43.5 s.
The excitation of chorus waves in this event differs from that in the 22 January 2019 event. The oscillation of the residual chorus power has a shorter period than (Figure 6a,b), suggesting that the modulation of chorus intensity is irrelevant to . This is consistent with wavelet power spectrograms of the integrated counts and . Figure 6c presents the specific electron temperature anisotropy for each energy channel, with the minimum cyclotron resonance energy [46] for marked by the black dashed curve. The anisotropy above the minimum resonance energy is positive, which means the whistler anisotropy instability can be excited.
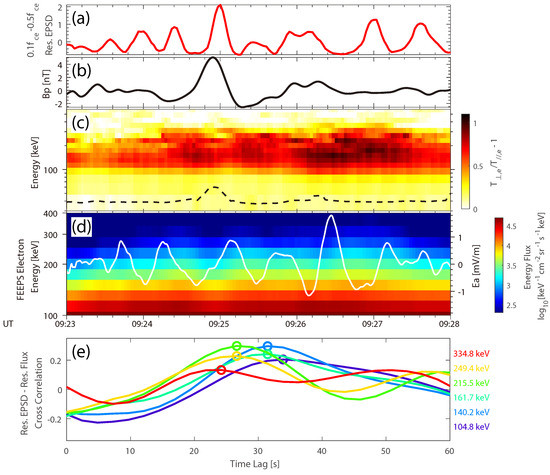
Figure 6.
Observations relevant to chorus wave excitation in the 10 January 2016 event. Panels (a–c) are in the same format as Figure 3a–c. The black dashed curve in (c) marks the minimum cyclotron resonant energy for . (d) The energy-time spectrogram for electron omni-directional energy fluxes between 100–400 keV, derived from FEEPS data. The superimposed white curve gives the waveform of . (e) The cross-correlation between the residual chorus power (a) and residual fluxes of six representative energy channels. The color of the curve represents the corresponding energy channel. The position of maximum correlation for each channel is marked with colored circles.
Zooming in on the energy range of high anisotropy (100–400 keV), we find the corresponding electron energy fluxes oscillate with quasi-periodically (Figure 6d). However, the mean squared wavelet coherence between the residual chorus power and at the pulsating period is relatively low (∼0.31). We further calculated the cross-correlation [27,32] between the residual power and residual fluxes of 100–400 keV electrons as functions of time lags, as shown in Figure 6e. The time lag for maximum cross-correlation decreases as the energy channel increases, indicating phase differences between electron fluxes of different energies.
To explain the relationship between the relatively low coherence and the phase differences mentioned above, we present 20–30 mHz band-pass filtered and electron residual fluxes in Figure 7b,c. Correlations between these oscillations and the residual chorus power (Figure 7a) can be identified. For electrons with low energies (<161.7 keV), the phase of flux oscillation is ∼90 behind . The phase relationships between residual fluxes of 334.8–388.7 keV electrons and are unstable, due to the low count rates of these energy channels. Nevertheless, ∼180 phase shifts across energy (161.7–388.7 keV) can be observed, agreeing with the characteristic signature of drift resonance between ULF waves and electrons [5,7,8].
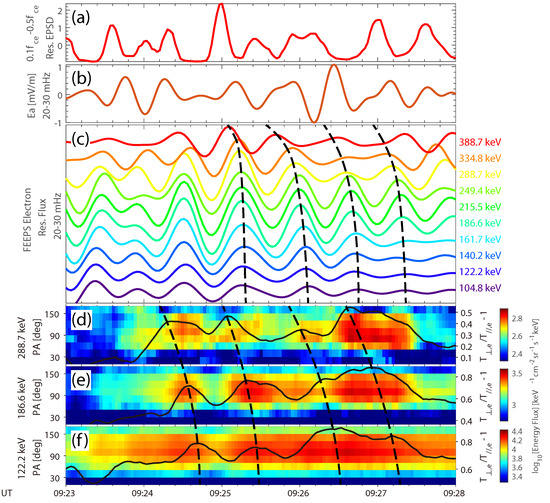
Figure 7.
Evidence of drift resonance in the 10 January 2016 event. (a) The residual chorus power (same as Figure 6a). (b,c) 20–30 mHz band-pass filtered (b) and residual fluxes for 100–400 keV electrons (c). (d–f) Pitch angle-time spectrograms of 288.7, 186.6, and 122.2 keV electrons, superimposed with corresponding electron temperature anisotropy. Black dashed guiding curves in (c–f) mark the peaks of residual fluxes and anisotropy.
The phase shifts induced by drift resonance also affect the modulation of electron temperature anisotropy by ULF waves. Figure 7d,f shows the pitch angle distributions of 288.7, 186.6, and 122.2 keV electrons. The calculated specific anisotropy for each channel is given by black curves superimposed on the spectrograms. The anisotropy oscillation of higher energy electrons leads that of lower energy electrons, consistent with the pattern of flux variations. We propose that chorus intensity is modulated by transverse ULF waves () in this event, through changing electron temperature anisotropy quasi-periodically (the left-hand side of Equation (1)). However, the phase shifts resulting from drift resonance disarrange the oscillation of anisotropy, leading to the relatively low coherence between chorus intensity and ULF wave fields.
4. Discussion
In this study, we present a comparative analysis of two events characterized by the simultaneous occurrence of ULF waves and pulsating auroras observed in the magnetosphere and at ground (Event 1: 22 January 2019; Event 2: 10 January 2016). In both events, modulated emissions of lower-band chorus waves are detected, which are suggested to be linked with the auroral pulsations. However, distinct differences arise in the excitation of chorus waves between the two events. Our findings can be summarized as follows.
- In Event 1, we observed that the frequencies of auroral pulsations and compressional ULF waves are similar to each other, whereas in Event 2, the oscillation period of auroral pulsations is close to that of transverse ULF waves.
- We identified that the modulation of chorus waves in Event 1 is caused by the change in the threshold for the whistler anisotropy instability induced by ULF waves. However, in Event 2, the modulation results from the variation of electron temperature anisotropy generated by ULF waves.
- Our analysis suggests that the relatively low coherence between chorus intensity and ULF wave fields in Event 2 may be attributed to phase shifts induced by drift resonance.
Investigating possible sources of the observed ULF waves gives us information on energy transport from the solar wind to the magnetosphere. Variations of magnetic fields in Event 2 are about one order of magnitude larger than those in Event 1, indicating that the mechanisms forming ULF waves in the two events are different. During Event 1, the geomagnetic environment is quiet (mean , mean ). The observed compressional Pc 4 (7–22 mHz [1]) waves can result from wave–particle interactions in the foreshock and bowshock [52,53,54,55]. For transverse Pc 3 (22–100 mHz [1]) waves in Event 2, we find they may be related to quasi-periodical dynamic pressure changes in the magnetosheath. As shown in Figure 8, MMS was traveling inbound across the magnetopause before Event 2 (marked by vertical red dashed lines). In the boundary layer (the magenta shaded area in Figure 8b–d), multiple magnetopause-crossings were observed. The measured ion energy spectrum changes between “solar wind-like” and “magnetosphere-like” repeatedly, with synchronous fluctuations of ion number density (), and magnetic fields (Figure 8a–d). This pattern is consistent with the quasi-static response of the magnetopause to dynamic pressure variations in the magnetosheath [56]. We conducted wavelet analysis on the magnetic field strength during 09:11–09:16 UT to study the possible connection between the magnetopause oscillation and transverse ULF waves in Event 2 (Figure 8e,f). The peak of wavelet power locates near 87.0 s, which is twice the pulsating period in Event 2 (43.5 s). We propose a scenario in which the poloidal ULF waves in Event 2 are harmonics of field line resonances [4,57,58] induced by fast-mode waves resulting from periodical magnetopause oscillations. Note that in the inner magnetosphere, electrons cannot resonate with even-mode ULF waves by drift resonance, since the acceleration and deceleration cancel each other over a bounce period [1,9]. However, in the dayside outer magnetosphere, off-equatorial magnetic field minima caused by solar wind forcing distort particles’ orbits [59] and modify the resonance condition [60,61], making even-mode ULF wave-electron drift resonance possible [1]. Nevertheless, due to a lack of available observations in the upstream solar wind, direct evidence on the source of ULF waves in Event 2 is still insufficient.
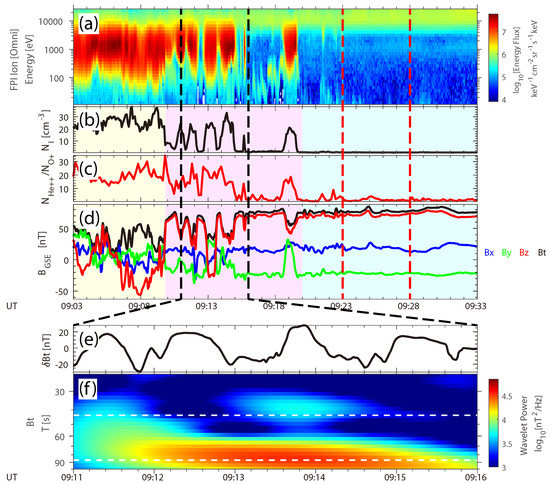
Figure 8.
Overview of the plasma environment near the ULF wave event on 10 January 2016. (a–d) Ion and magnetic field observations between 09:03–09:33 UT. (a) The energy–time spectrogram of ion omni-directional energy fluxes, derived from FPI-DIS data. (b) The ion number density, measured by FPI-DIS. (c) The ratio between number densities of and , calculated from HPCA data. (d) The magnetic field strength and components in GSE coordinates, measured by FGM. (e,f) 120 s detrended magnetic field strength (e) and the wavelet power spectrogram of the measured magnetic field strength (f) between 09:11 and 09:16 UT. Note that the y-axis of (f) is in log-scale. The yellow, magenta, and cyan shaded areas in (a–d) mark the duration when MMS was traveling in the magnetosheath, the boundary layer, and the magnetosphere, respectively. Vertical red dashed lines in (a–d) correspond to the duration of the ULF wave event (Figure 4, Figure 5, Figure 6 and Figure 7). Horizontal white dash lines in (f) mark periods of 87.0 s and 43.5 s, respectively.
In higher latitudes beyond the – latitude range, other auroral activities can also be seen (Figure 9). In Event 1, pulsating auroras were observed in th – latitude in the 557.7 nm-band, as shown in Figure 9a and Video S1. These pulsating auroral patches are different from those investigated above, which may result from wave–particle interactions in the outer region of the magnetosphere. The 630.0 nm ASI did not capture these auroras as well (Figure 9c). In Event 2, however, discrete auroral activities were recorded by both 557.7 nm and 630.0 nm ASIs (Video S2). The corresponding keograms (Figure 9e,g) present quasi-periodical poleward-moving signatures, consistent with the characteristics of dayside poleward-moving auroral forms [62]. These auroras are proposed as ionospheric signatures of flux transfer events, agreeing with the negative IMF mentioned in Section 2 [63,64]. The discrete auroras near the time period of this event have been investigated in a prior study due to their connections with throat auroras [65].
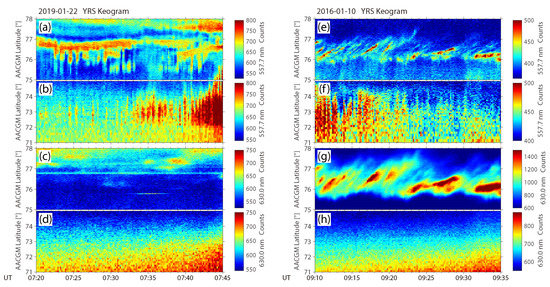
Figure 9.
YRS ASI north–south keograms along the central meridians. (a–d) Keograms between 07:20 and 07:45 UT on 22 January 2019. (a,b) 557.7 nm ASI keograms between – latitudes (a) and – latitudes (b). Panels (c,d) are in the same format as (a,b), except that they apply to the 630.0 nm ASI. (e–h) Keograms between 09:10 and 09:35 UT on 10 January 2016, with the same format as (a–d).
This research advances the current understanding of the dayside pulsating aurora formation building from previous work [26,27,31,32]. The modulated emissions of aurora-related chorus waves are discussed by utilizing the linear theory [48], which suggests both compressional and transverse ULF waves can trigger auroral pulsations. Furthermore, this study establishes a chain of observational evidence on energy transport from the solar wind to the ionosphere. We highlight the role of ULF wave–particle interactions in the coupling between the solar wind, the magnetosphere, and the ionosphere, which warrants further exploration.
Supplementary Materials
The following supporting information can be downloaded at: https://www.mdpi.com/article/10.3390/universe9060258/s1, Video S1: Movie of pulsating auroras observed at YRS between 07:20–07:50 UT on 22 January 2019; Video S2: Movie of pulsating auroras observed at YRS between 09:10–09:40 UT on 10 January 2016; Figure S1: Wavelet power spectrograms of ULF wave components in GSE coordinates between 07:32–07:38 UT on 22 January 2019; Figure S2: Wavelet power spectrograms of ULF wave components in GSE coordinates between 09:23–09:28 UT on 10 January 2016.
Author Contributions
Conceptualization, Q.-G.Z., J.-J.L., Z.-Y.L., and X.-Y.L.; methodology, Q.-G.Z., Z.-J.H., J.-J.L., X.-Z.Z., C.Y., Z.-F.Y., and X.-X.Z.; software, X.-Y.L., Z.-F.Y., and Z.-K.X.; validation, Z.-F.Y., X.-X.Z., and Z.-K.X.; formal analysis, X.-Y.L., and Q.-G.Z.; investigation, X.-Y.L., Z.-F.Y., X.-X.Z., Z.-K.X., and Z.-Y.L.; resources, Q.-G.Z., Z.-J.H., and J.-J.L.; data curation, Z.-J.H., J.-J.L., J.B.B., C.T.R., R.E.E., and P.-A.L.; writing—original draft preparation, X.-Y.L.; writing—review and editing, Q.-G.Z., Z.-Y.L., Z.-F.Y., X.-Z.Z., and C.Y.; visualization, X.-Y.L.; supervision, Q.-G.Z.; project administration, Q.-G.Z., Z.-J.H., and J.-J.L.; funding acquisition, Q.-G.Z. All authors have read and agreed to the published version of the manuscript.
Funding
This research was funded by National Natural Science Foundation of China 42230202, Major Project of Chinese National Programs for Fundamental Research and Development 2021YFA0718600 and China Space Agency Project D020301.
Data Availability Statement
We acknowledge the use of MMS Science Data Center (https://lasp.colorado.edu/mms/sdc/public/search/) for providing MMS data accessed on 1 September 2022, including survey-mode electron distributions from the Fly’s Eye Energetic Particle Spectrometer (FEEPS), fast-mode particle distributions and moments from the Fast Plasma Investigation (FPI), survey-mode ion moments from the Hot Plasma Composition Analyzer (HPCA), survey-mode magnetic fields from the Fluxgate Magnetometers (FGM), fast-mode electric fields from the Electric Field Double Probe (EDP) and fast-mode plasma wave power spectral densities from the Digital Signal Processor (DSP). The time intervals of interest is 2019-01-22 09:23–09:28 UT and 2016-01-10 09:03–09:33 UT. We thank the Space Physics Data Facility at the NASA Goddard Space Flight Center for providing the OMNI solar wind dynamic pressure, interplanetary magnetic field, the horizontal symmetric disturbance index and auroral electrojet index data accessed on 1 September 2022 (https://cdaweb.gsfc.nasa.gov/index.html/). We acknowledge Polar Research Institute of China for providing all-sky imager (ASI) data at YRS accessed on 1 September 2022 (http://www.chinare.org.cn/aurora/dataquery).
Acknowledgments
Thanks to Shan Wang, Li Li, Bin Li, Hao-Bo Fu and Hua-Yu Zhao for useful discussions.
Conflicts of Interest
The authors declare no conflict of interest.
References
- Zong, Q.G.; Rankin, R.; Zhou, X.Z. The interaction of ultralow-frequency pc3-5 waves with charged particles in Earth’s magnetosphere. Rev. Mod. Plasma Phys. 2017, 1, 10. [Google Scholar] [CrossRef]
- Jacobs, J.; Kato, Y.; Matsushita, S.; Troitskaya, V. Classification of geomagnetic micropulsations. J. Geophys. Res. 1964, 69, 180–181. [Google Scholar] [CrossRef]
- Samson, J.C.; Jacobs, J.A.; Rostoker, G. Latitude-dependent characteristics of long-period geomagnetic micropulsations. J. Geophys. Res. 1971, 76, 3675–3683. [Google Scholar] [CrossRef]
- Claudepierre, S.G.; Elkington, S.R.; Wiltberger, M. Solar wind driving of magnetospheric ULF waves: Pulsations driven by velocity shear at the magnetopause. J. Geophys. Res. 2008, 113, A05218. [Google Scholar] [CrossRef]
- Zong, Q.G.; Zhou, X.Z.; Wang, Y.F.; Li, X.; Song, P.; Baker, D.N.; Fritz, T.A.; Daly, P.W.; Dunlop, M.; Pedersen, A. Energetic electrons response to ULF waves induced by interplanetary shocks in the outer radiation belt. J. Geophys. Res. 2009, 114, A10204. [Google Scholar] [CrossRef]
- Liu, W.; Sarris, T.; Li, X.; Ergun, R.; Angelopoulos, V.; Bonnell, J.; Glassmeier, K. Solar wind influence on Pc4 and Pc5 ULF wave activity in the inner magnetosphere. J. Geophys. Res. 2010, 115, A12201. [Google Scholar] [CrossRef]
- Southwood, D.J.; Kivelson, M.G. Charged particle behavior in low-frequency geomagnetic pulsations. I—Transverse waves. J. Geophys. Res. 1981, 86, 5643–5655. [Google Scholar] [CrossRef]
- Southwood, D.J.; Kivelson, M.G. Charged particle behavior in low-frequency geomagnetic pulsations. II—Graphical approach. J. Geophys. Res. 1982, 87, 1707–1710. [Google Scholar] [CrossRef]
- Hao, Y.X.; Zong, Q.G.; Wang, Y.F.; Zhou, X.Z.; Zhang, H.; Fu, S.Y.; Pu, Z.Y.; Spence, H.E.; Blake, J.B.; Bonnell, J.; et al. Interactions of energetic electrons with ULF waves triggered by interplanetary shock: Van Allen Probes observations in the magnetotail. J. Geophys. Res. 2014, 119, 8262–8273. [Google Scholar] [CrossRef]
- Claudepierre, S.G.; Mann, I.R.; Takahashi, K.; Fennell, J.F.; Hudson, M.K.; Blake, J.B.; Roeder, J.L.; Clemmons, J.H.; Spence, H.E.; Reeves, G.D.; et al. Van Allen Probes observation of localized drift resonance between poloidal mode ultra-low frequency waves and 60 keV electrons. Geophys. Res. Lett. 2013, 40, 4491–4497. [Google Scholar] [CrossRef]
- Elkington, S.R.; Sarris, T.E. The role of pc-5 ULF waves in the radiation belts: Current understanding and open questions. In Waves, Particles, and Storms in Geospace: A Complex Interplay; Oxford University Press (OUP): Oxford, UK, 2016; p. 80. [Google Scholar]
- Li, L.; Zhou, X.Z.; Omura, Y.; Zong, Q.G.; Rankin, R.; Chen, X.R.; Liu, Y.; Yue, C.; Fu, S.Y. Drift resonance between particles and compressional toroidal ULF waves in dipole magnetic field. J. Geophys. Res. 2021, 126, e2020JA028842. [Google Scholar] [CrossRef]
- Oimatsu, S.; Nosé, M.; Teramoto, M.; Yamamoto, K.; Matsuoka, A.; Kasahara, S.; Yokota, S.; Keika, K.; Le, G.; Nomura, R.; et al. Drift-bounce resonance between pc5 pulsations and ions at multiple energies in the nightside magnetosphere: Arase and MMS observations. Geophys. Res. Lett. 2018, 45, 7277–7286. [Google Scholar] [CrossRef]
- Oimatsu, S.; Nosé, M.; Le, G.; Fuselier, S.A.; Ergun, R.E.; Lindqvist, P.; Sormakov, D. Selective acceleration of O+ by drift-bounce resonance in the Earth’s magnetosphere: MMS observations. J. Geophys. Res. 2020, 125, e2019JA027686. [Google Scholar] [CrossRef]
- Zong, Q.G.; Wang, Y.F.; Zhang, H.; Fu, S.Y.; Zhang, H.; Wang, C.R.; Yuan, C.J.; Vogiatzis, I. Fast acceleration of inner magnetospheric hydrogen and oxygen ions by shock induced ULF waves. J. Geophys. Res. 2012, 117, A11206. [Google Scholar] [CrossRef]
- Min, K.; Takahashi, K.; Ukhorskiy, A.Y.; Manweiler, J.W.; Spence, H.E.; Singer, H.J.; Claudepierre, S.G.; Larsen, B.A.; Soto-Chavez, A.R.; Cohen, R.J. Second harmonic poloidal waves observed by Van Allen Probes in the dusk-midnight sector. J. Geophys. Res. 2017, 122, 3013–3039. [Google Scholar] [CrossRef]
- Yamamoto, K.; Nosé, M.; Keika, K.; Hartley, D.P.; Smith, C.W.; MacDowall, R.J.; Lanzerotti, L.J.; Mitchell, D.G.; Spence, H.E.; Reeves, G.D.; et al. Eastward propagating second harmonic poloidal waves triggered by temporary outward gradient of proton phase space density: Van Allen Probe A observation. J. Geophys. Res. 2019, 124, 9904–9923. [Google Scholar] [CrossRef]
- Liu, Z.Y.; Zong, Q.G.; Zhou, X.Z.; Zhu, Y.F.; Gu, S.J. Pitch Angle Structures of Ring Current Ions Induced by Evolving Poloidal Ultra-Low Frequency Waves. Geophys. Res. Lett. 2020, 47, e2020GL087203. [Google Scholar] [CrossRef]
- Li, X.Y.; Liu, Z.Y.; Zong, Q.G.; Zhou, X.Z.; Hao, Y.X.; Rankin, R.; Zhang, X.X. Pitch angle phase shift in ring current ions interacting with ultra-low-frequency waves: Van Allen Probes observations. J. Geophys. Res. 2021, 126, e2020JA029025. [Google Scholar] [CrossRef]
- Liu, Z.Y.; Zong, Q.G.; Rankin, R.; Zhang, H.; Wang, Y.F.; Zhou, X.Z.; Fu, S.Y.; Yue, C.; Zhu, X.Y.; Pollock, C.J.; et al. Simultaneous macroscale and microscale wave-ion interaction in near-earth space plasmas. Nat. Commun. 2022, 13, 5593. [Google Scholar] [CrossRef]
- Li, W.; Thorne, R.; Bortnik, J.; Nishimura, Y.; Angelopoulos, V. Modulation of whistler mode chorus waves: 1. Role of compressional Pc4-5 pulsations. J. Geophys. Res. 2011, 116, A06206. [Google Scholar] [CrossRef]
- Xia, Z.; Chen, L.; Dai, L.; Claudepierre, S.G.; Chan, A.A.; Soto-Chavez, A.R.; Reeves, G.D. Modulation of chorus intensity by ULF waves deep in the inner magnetosphere. Geophys. Res. Lett. 2016, 43, 9444–9452. [Google Scholar] [CrossRef]
- Zhang, X.J.; Chen, L.; Artemyev, A.V.; Angelopoulos, V.; Liu, X. Periodic excitation of chorus and ECH waves modulated by ultralow frequency compressions. J. Geophys. Res. 2019, 124, 8535–8550. [Google Scholar] [CrossRef]
- Zhang, X.J.; Angelopoulos, V.; Artemyev, A.V.; Hartinger, M.D.; Bortnik, J. Modulation of whistler waves by ultra-low-frequency perturbations: The importance of magnetopause location. J. Geophys. Res. 2020, 125, e2020JA028334. [Google Scholar] [CrossRef]
- Li, L.; Omura, Y.; Zhou, X.Z.; Zong, Q.G.; Rankin, R.; Yue, C.; Fu, S.Y. Nonlinear wave growth analysis of chorus emissions modulated by ULF waves. Geophys. Res. Lett. 2022, 49, e2022GL097978. [Google Scholar] [CrossRef]
- Thorne, R.M.; Ni, B.; Tao, X.; Horne, R.B.; Meredith, N.P. Scattering by chorus waves as the dominant cause of diffuse auroral precipitation. Nature 2010, 467, 943–946. [Google Scholar] [CrossRef]
- Shi, R.; Hu, Z.J.; Ni, B.; Han, D.; Chen, X.C.; Zhou, C.; Gu, X. Modulation of the dayside diffuse auroral intensity by the solar wind dynamic pressure. J. Geophys. Res. 2014, 119, 10092–10099. [Google Scholar] [CrossRef]
- Ni, B.; Thorne, R.M.; Zhang, X.; Bortnik, J.; Pu, Z.; Xie, L.; Hu, Z.J.; Han, D.; Shi, R.; Zhou, C.; et al. Origins of the earth’s diffuse auroral precipitation. Space Sci. Rev. 2016, 200, 205–259. [Google Scholar] [CrossRef]
- Fukizawa, M.; Sakanoi, T.; Miyoshi, Y.; Hosokawa, K.; Shiokawa, K.; Katoh, Y.; Kazama, Y.; Kumamoto, A.; Tsuchiya, F.; Miyashita, Y.; et al. Electrostatic electron cyclotron harmonic waves as a candidate to cause pulsating auroras. Geophys. Res. Lett. 2018, 45, 12661–12668. [Google Scholar] [CrossRef]
- Kasahara, S.; Miyoshi, Y.; Yokota, S.; Mitani, T.; Kasahara, Y.; Matsuda, S.; Kumamoto, A.; Matsuoka, A.; Kazama, Y.; Frey, H.U.; et al. Pulsating aurora from electron scattering by chorus waves. Nature 2018, 554, 337–340. [Google Scholar] [CrossRef]
- Hosokawa, K.; Miyoshi, Y.; Ozaki, M.; Oyama, S.I.; Ogawa, Y.; Kurita, S.; Kasahara, Y.; Kasaba, Y.; Yagitani, S.; Matsuda, S.; et al. Multiple time-scale beats in aurora: Precise orchestration via magnetospheric chorus waves. Sci. Rep. 2020, 10, 3380. [Google Scholar] [CrossRef]
- Motoba, T.; Ebihara, Y.; Ogawa, Y.; Kadokura, A.; Engebretson, M.J.; Angelopoulos, V.; Gerrard, A.J.; Weatherwax, A.T. On the driver of daytime Pc3 auroral pulsations. Geophys. Res. Lett. 2019, 46, 553–561. [Google Scholar] [CrossRef]
- Motoba, T.; Ogawa, Y.; Ebihara, Y.; Kadokura, A.; Gerrard, A.J.; Weatherwax, A.T. Daytime Pc5 diffuse auroral pulsations and their association with outer magnetospheric ULF waves. J. Geophys. Res. 2021, 126, e2021JA029218. [Google Scholar] [CrossRef]
- Burch, J.L.; Moore, T.E.; Torbert, R.B.; Giles, B.L. Magnetospheric Multiscale overview and science objectives. Space Sci. Rev. 2016, 199, 5–21. [Google Scholar] [CrossRef]
- Blake, J.B.; Mauk, B.H.; Baker, D.N.; Carranza, P.; Clemmons, J.H.; Craft, J.; Crain, J.W., Jr.; Crew, A.; Dotan, Y.; Fennell, J.F.; et al. The Fly’s Eye Energetic Particle Spectrometer (FEEPS) sensors for the Magnetospheric Multiscale (MMS) mission. Space Sci. Rev. 2016, 199, 309–329. [Google Scholar] [CrossRef]
- Pollock, C.; Moore, T.; Jacques, A.; Burch, J.; Gliese, U.; Saito, Y.; Omoto, T.; Avanov, L.; Barrie, A.; Coffey, V.; et al. Fast Plasma Investigation for Magnetospheric Multiscale. Space Sci. Rev. 2016, 199, 331–406. [Google Scholar] [CrossRef]
- Young, D.T.; Burch, J.L.; Gomez, R.G.; Santos, A.D.L.; Miller, G.P.; IV, P.W.; Paschalidis, N.; Fuselier, S.A.; Pickens, K.; Hertzberg, E.; et al. Hot plasma composition analyzer for the Magnetospheric Multiscale mission. Space Sci. Rev. 2016, 199, 407–470. [Google Scholar] [CrossRef]
- Russell, C.T.; Anderson, B.J.; Baumjohann, W.; Bromund, K.R.; Dearborn, D.; Fischer, D.; Le, G.; Leinweber, H.K.; Leneman, D.; Magnes, W.; et al. The Magnetospheric Multiscale magnetometers. Space Sci. Rev. 2016, 199, 189–256. [Google Scholar] [CrossRef]
- Ergun, R.E.; Tucker, S.; Westfall, J.; Goodrich, K.A.; Malaspina, D.M.; Summers, D.; Wallace, J.; Karlsson, M.; Mack, J.; Brennan, N.; et al. The axial double probe and fields signal processing for the MMS mission. Space Sci. Rev. 2016, 199, 167–188. [Google Scholar] [CrossRef]
- Lindqvist, P.A.; Olsson, G.; Torbert, R.B.; King, B.; Granoff, M.; Rau, D.; Needell, G.; Turco, S.; Dors, I.; Beckman, P.; et al. The spin-plane double probe electric field instrument for MMS. Space Sci. Rev. 2016, 199, 137–165. [Google Scholar] [CrossRef]
- Torbert, R.B.; Russell, C.T.; Magnes, W.; Ergun, R.E.; Lindqvist, P.A.; LeContel, O.; Vaith, H.; Macri, J.; Myers, S.; Rau, D.; et al. The FIELDS instrument suite on MMS: Scientific objectives, measurements, and data products. Space Sci. Rev. 2016, 199, 105–135. [Google Scholar] [CrossRef]
- Hu, Z.J.; Yang, H.; Huang, D.; Araki, T.; Sato, N.; Taguchi, M.; Seran, E.; Hu, H.; Liu, R.; Zhang, B.; et al. Synoptic distribution of dayside aurora: Multiple-wavelength all-sky observation at Yellow River Station in Ny-Ålesund, Svalbard. J. Atmos. Sol.-Terr. Phys. 2009, 71, 794–804. [Google Scholar] [CrossRef]
- Tsyganenko, N.A. A model of the near magnetosphere with a dawn-dusk asymmetry 1. Mathematical structure. J. Geophys. Res. 2002, 107, SMP 12-1–SMP 12-15. [Google Scholar] [CrossRef]
- Tsyganenko, N.A. A model of the near magnetosphere with a dawn-dusk asymmetry 2. Parameterization and fitting to observations. J. Geophys. Res. 2002, 107, SMP 10-1–SMP 10-17. [Google Scholar] [CrossRef]
- Grinsted, A.; Moore, J.; Jevrejeva, S. Application of the cross wavelet transform and wavelet coherence to geophysical time series. Nonlinear Process. Geophys. 2004, 11, 561–566. [Google Scholar] [CrossRef]
- Kennel, C.F.; Petschek, H.E. Limit on stably trapped particle fluxes. J. Geophys. Res. 1966, 71, 1–28. [Google Scholar] [CrossRef]
- Hamlin, D.A.; Karplus, R.; Vik, R.C.; Watson, K.M. Mirror and azimuthal drift frequencies for geomagnetically trapped particles. J. Geophys. Res. 1961, 66, 1–4. [Google Scholar] [CrossRef]
- Gary, S.P.; Wang, J. Whistler instability: Electron anisotropy upper bound. J. Geophys. Res. 1996, 101, 10749–10754. [Google Scholar] [CrossRef]
- Fu, H.; Yue, C.; Ma, Q.; Kang, N.; Bortnik, J.; Zong, Q.G.; Zhou, X.Z. Frequency-dependent responses of plasmaspheric hiss to the impact of an interplanetary shock. Geophys. Res. Lett. 2021, 48, e2021GL094810. [Google Scholar] [CrossRef]
- Zhang, H.; Zong, Q.; Connor, H.; Delamere, P.; Facskó, G.; Han, D.; Hasegawa, H.; Kallio, E.; Kis, Á.; Le, G.; et al. Dayside transient phenomena and their impact on the magnetosphere and ionosphere. Space Sci. Rev. 2022, 218, 40. [Google Scholar] [CrossRef]
- Wang, B.; Nishimura, Y.; Hietala, H.; Angelopoulos, V. Investigating the role of magnetosheath high-speed jets in triggering dayside ground magnetic ultra-low frequency waves. Geophys. Res. Lett. 2022, 49, e2022GL099768. [Google Scholar] [CrossRef]
- Bolshakova, O.V.; Troitskaya, V.A. Relation of the IMF direction to the system of stable oscillations. Dokl. Akad. Nauk. USSR 1968, 180, 343–346. [Google Scholar]
- Troitskaya, V.A. Discoveries of sources of Pc 2-4 waves-A review of research in the former USSR. In Solar Wind Sources of Magnetospheric Ultra-Low-Frequency Waves; Engebretson, M.J., Takahashi, K., Scholer, M., Eds.; American Geophysical Union (AGU): Washington, DC, USA, 1994; pp. 45–54. [Google Scholar] [CrossRef]
- Heilig, B.; Lühr, H.; Rother, M. Comprehensive study of ULF upstream waves observed in the topside ionosphere by CHAMP and on the ground. Ann. Geophys. 2007, 25, 737–754. [Google Scholar] [CrossRef]
- Bier, E.A.; Owusu, N.; Engebretson, M.J.; Posch, J.L.; Lessard, M.R.; Pilipenko, V.A. Investigating the IMF cone angle control of Pc3-4 pulsations observed on the ground. J. Geophys. Res. 2014, 119, 1797–1813. [Google Scholar] [CrossRef]
- Glassmeier, K.H.; Auster, H.U.; Constantinescu, D.; Fornaçon, K.H.; Narita, Y.; Plaschke, F.; Angelopoulos, V.; Georgescu, E.; Baumjohann, W.; Magnes, W.; et al. Magnetospheric quasi-static response to the dynamic magnetosheath: A THEMIS case study. Geophys. Res. Lett. 2008, 35, L17S01. [Google Scholar] [CrossRef]
- Southwood, D.J. Some features of field line resonances in the magnetosphere. Planet. Space Sci. 1974, 22, 483–491. [Google Scholar] [CrossRef]
- Rae, I.J.; Donovan, E.F.; Mann, I.R.; Fenrich, F.R.; Watt, C.E.J.; Milling, D.K.; Lester, M.; Lavraud, B.; Wild, J.A.; Singer, H.J.; et al. Evolution and characteristics of global Pc5 ULF waves during a high solar wind speed interval. J. Geophys. Res. 2005, 110, A12211. [Google Scholar] [CrossRef]
- Shabansky, V.P. Some processes in the magnetosphere. Space Sci. Rev. 1971, 12, 299–418. [Google Scholar] [CrossRef]
- Li, X.Y.; Liu, Z.Y.; Zong, Q.G.; Zhou, X.Z.; Hao, Y.X.; Pollock, C.J.; Russell, C.T.; Lindqvist, P.A. Off-equatorial minima effects on ULF wave-ion interaction in the dayside outer magnetosphere. Geophys. Res. Lett. 2021, 48, e2021GL095648. [Google Scholar] [CrossRef]
- Li, X.Y.; Liu, Z.Y.; Zong, Q.G.; Liu, J.J.; Fu, S.Y.; Zhou, X.Z.; Hao, Y.X.; Pollock, C.J.; Russell, C.T.; Ergun, R.E.; et al. ULF wave-induced ion pitch angle evolution in the dayside outer magnetosphere. Geophys. Res. Lett. 2022, 49, e2022GL098108. [Google Scholar] [CrossRef]
- Fasel, G.J.; Lee, L.C.; Smith, R.W. A mechanism for the multiple brightenings of dayside poleward-moving auroral forms. Geophys. Res. Lett. 1993, 20, 2247–2250. [Google Scholar] [CrossRef]
- Sandholt, P.E.; Deehr, C.S.; Egeland, A.; Lybekk, B.; Viereck, R.; Romick, G.J. Signatures in the dayside aurora of plasma transfer from the magnetosheath. J. Geophys. Res. 1986, 91, 10063–10079. [Google Scholar] [CrossRef]
- Frey, H.U.; Han, D.; Kataoka, R.; Lessard, M.R.; Milan, S.E.; Nishimura, Y.; Strangeway, R.J.; Zou, Y. Dayside aurora. Space Sci. Rev. 2019, 215, 51. [Google Scholar] [CrossRef]
- Han, D.S.; Liu, J.J.; Chen, X.C.; Xu, T.; Li, B.; Hu, Z.J.; Hu, H.Q.; Yang, H.G.; Fuselier, S.A.; Pollock, C.J. Direct evidence for throat aurora being the ionospheric signature of magnetopause transient and reflecting localized magnetopause indentations. J. Geophys. Res. 2018, 123, 2658–2667. [Google Scholar] [CrossRef]
Disclaimer/Publisher’s Note: The statements, opinions and data contained in all publications are solely those of the individual author(s) and contributor(s) and not of MDPI and/or the editor(s). MDPI and/or the editor(s) disclaim responsibility for any injury to people or property resulting from any ideas, methods, instructions or products referred to in the content. |
© 2023 by the authors. Licensee MDPI, Basel, Switzerland. This article is an open access article distributed under the terms and conditions of the Creative Commons Attribution (CC BY) license (https://creativecommons.org/licenses/by/4.0/).