1. Introduction
Black aurora phenomena are typically observed as dark regions within the diffuse aurora background [
1]. Several types of black aurora have been observed and described in the literature [
2,
3,
4,
5,
6]. These observations have been classified into three types: black vortex streets (also known as black curls), which are induced by Kelvin–Helmholtz instabilities in a divergent electric field and rotate clockwise [
2,
4]; black arcs, which are typically observed in the midnight region and are a few hundred meters to 10 km wide [
2,
6]; and black patches (also known as black rings), which are also found in the midnight sector and are a few hundred meters to 14 km wide [
2,
3]. Black arcs have been observed to propagate equatorward at a speed of a few hundred meters per second [
2,
6], while black patches (or black arc segments) have been observed to propagate eastward at speeds of 0.2–3.4 km/s. Despite the variety of structures and dynamics observed in these three types of black aurora, the mechanism underlying their generation and motion has not been clearly confirmed through multiple observation data.
Satellite observation data has been used to propose potential mechanisms underlying the characteristics of black aurora. One such mechanism was proposed by [
7], who found a correspondence between intense divergent electric fields observed by spacecraft at lower altitudes (around 800 km) and the black aurora phenomenon. They suggested that divergent electric field structures were the mechanism underlying the black vortex streets. Another proposed mechanism for black aurora was the reduction of downward electron flux [
5]. Ref. [
5] used multiple quasi-simultaneous observations from optical imaging data derived from an aircraft and electron flux data deduced from the FAST satellite to propose that black auroras observed using a narrow field camera were caused by the reduction of downward electron energy flux. Furthermore, [
5] suggested that small-scale suppression of pitch angle diffusion, rather than inverted V-type potential structures, was the mechanism underlying the generation of black auroras. Finally, [
8] proposed that downward field-aligned currents (FACs), comprised of upward-flowing thermal electrons, were confirmed to be related to black aurora.
Magnetospheric field-line resonances (FLRs) are standing shear Alfvenic oscillations along magnetic field-lines, which can be generated by various mechanisms such as solar wind dynamic pressure pulse [
9], Kelvin–Helmholtz instability near the magnetopause [
10], or cavity mode driven via coupling to fast magnetosonic mode waves [
11,
12,
13]. The excitation of FLRs can occur directly when a broadband impulse originating from an abrupt pressure pulse in the solar wind impacts the magnetosphere [
9]. This impulse launches compressional waves spanning a wide frequency spectrum, resulting in a continuous and broad distribution of wave power. The unique characteristic of the initial pulse, despite the broadband nature of the spectrum, is its short duration, which enforces an initial phase correlation across the entire frequency range. This phase correlation becomes evident in the FLRs generated by the solar wind dynamic pressure pulse. Previous studies using observations and simulations have shown that poleward-moving auroral arcs are related to FLRs, and the first observational evidence supporting this scenario was presented by [
9]. It was suggested that FLRs can generate periodic upward FACs, which increase the luminosity of poleward-moving auroral arcs. The FACs associated with hydromagnetic FLRs were modeled by [
14], who demonstrated how these currents close in the E region ionosphere through Pedersen currents. FLRs have been proposed as a potential source of discrete auroral arcs due to their magnetic and electric field structures resembling the characteristic features of the auroral current system, including both upward and downward FACs connected through Pedersen currents. During one half of the wave cycle, when an FLR is excited, it exhibits a prominent upward FAC in the latitudinal center of the waveform, accompanied by two regions of smaller-amplitude, downward-directed FACs on either side. Researchers have conducted a study on the dissipation of ultra-low frequency (ULF) Alfvén waves and the resulting electron energization in the auroral magnetosphere. Using a two-fluid approximation in the converging magnetic field geometry present above the ionosphere, they examined the dynamics of electrons in this region. As the cycle of the Alfvén wave progresses, the direction of the current alternates between upward and downward over hundreds of seconds. During the phase of the upward current, magnetospheric electrons undergo acceleration to high energies in a parallel electric field directed downward into the ionosphere. During the subsequent half cycle of the Alfvén wave, the electrons that were lost from the magnetosphere in the first half cycle are replaced by cold ionospheric electrons. These ionospheric electrons are accelerated upward into the magnetosphere, reaching similarly high energies under the influence of the downward wave electric field. Further investigations have strengthened the understanding of the link between black aurora and downward FACs. For instance, a study conducted by [
8] analyzed data from the Freja satellite and observed a strong correlation between black aurora and downward FACs in the auroral ionosphere. The researchers proposed that black aurora arises as a result of the reduction in the downward flow of charged particles within the ionosphere. Although previous studies have estimated total ionospheric FACs using in situ observational studies with total ionospheric convection electric fields and conductivities deduced from on-board data [
15,
16], there is no observational study that focuses on the relationship between downward FACs induced by FLRs and poleward-moving black auroral arcs. This paper aims to estimate both upward FACs corresponding to ordinary auroral phenomenon and downward FACs related to black auroras, using the same physical principles. The study will investigate the relationship between FLRs and poleward-moving black auroras.
However, direct observational evidence of this relationship is currently lacking due to the difficulty of obtaining in situ FLR observations and high-resolution simultaneous optical observations. In this paper, we present the first observational evidence from both spacecraft and ground-based observations to support the theory that poleward-moving black auroras can be induced by FLRs through downward FACs. Building on the work of [
9], we extend the analysis to investigate the corresponding relationship between black auroral observations and downward FACs associated with FLRs.
3. Observations
To better illustrate the relationship between poleward-moving black auroras and FLRs, we calculated the distribution of downward FACs associated with FLRs in different latitudes following the theoretical work proposed by [
9,
14]. Their method involves estimating the latitudinal distribution of FACs, which serve as a proxy for variations in auroral luminosity, in relation to standing ULF waves. Specifically, they focus on the toroidal branch of hydromagnetic waves, assuming magnetic field perturbations above the ionosphere to be in the azimuthal direction. The wave field profile at a fixed longitude is described by:
In the standard FLR model [
10], ULF waves are confined to a specific region where the field-line eigenfrequencies closely match the driving frequencies. This confinement ensures that the wave frequency
ω remains constant within the wave active region, which is defined by
G(
t,
x) in terms of its spatial and temporal extents. By applying Ampère’s law, the wave-induced FACs can be calculated:
In this simplified model, the wave-induced FACs and magnetic fields demonstrate evident quasi-periodic oscillations. These oscillations can be observed due to the presence of
(the partial derivative of
with respect to
) and
’ (the gradient of
Notably, the vertical
direction aligns closely (or in an antiparallel manner, depending on the hemisphere) with the geomagnetic field-lines, further contributing to the clear manifestation of these oscillatory patterns.
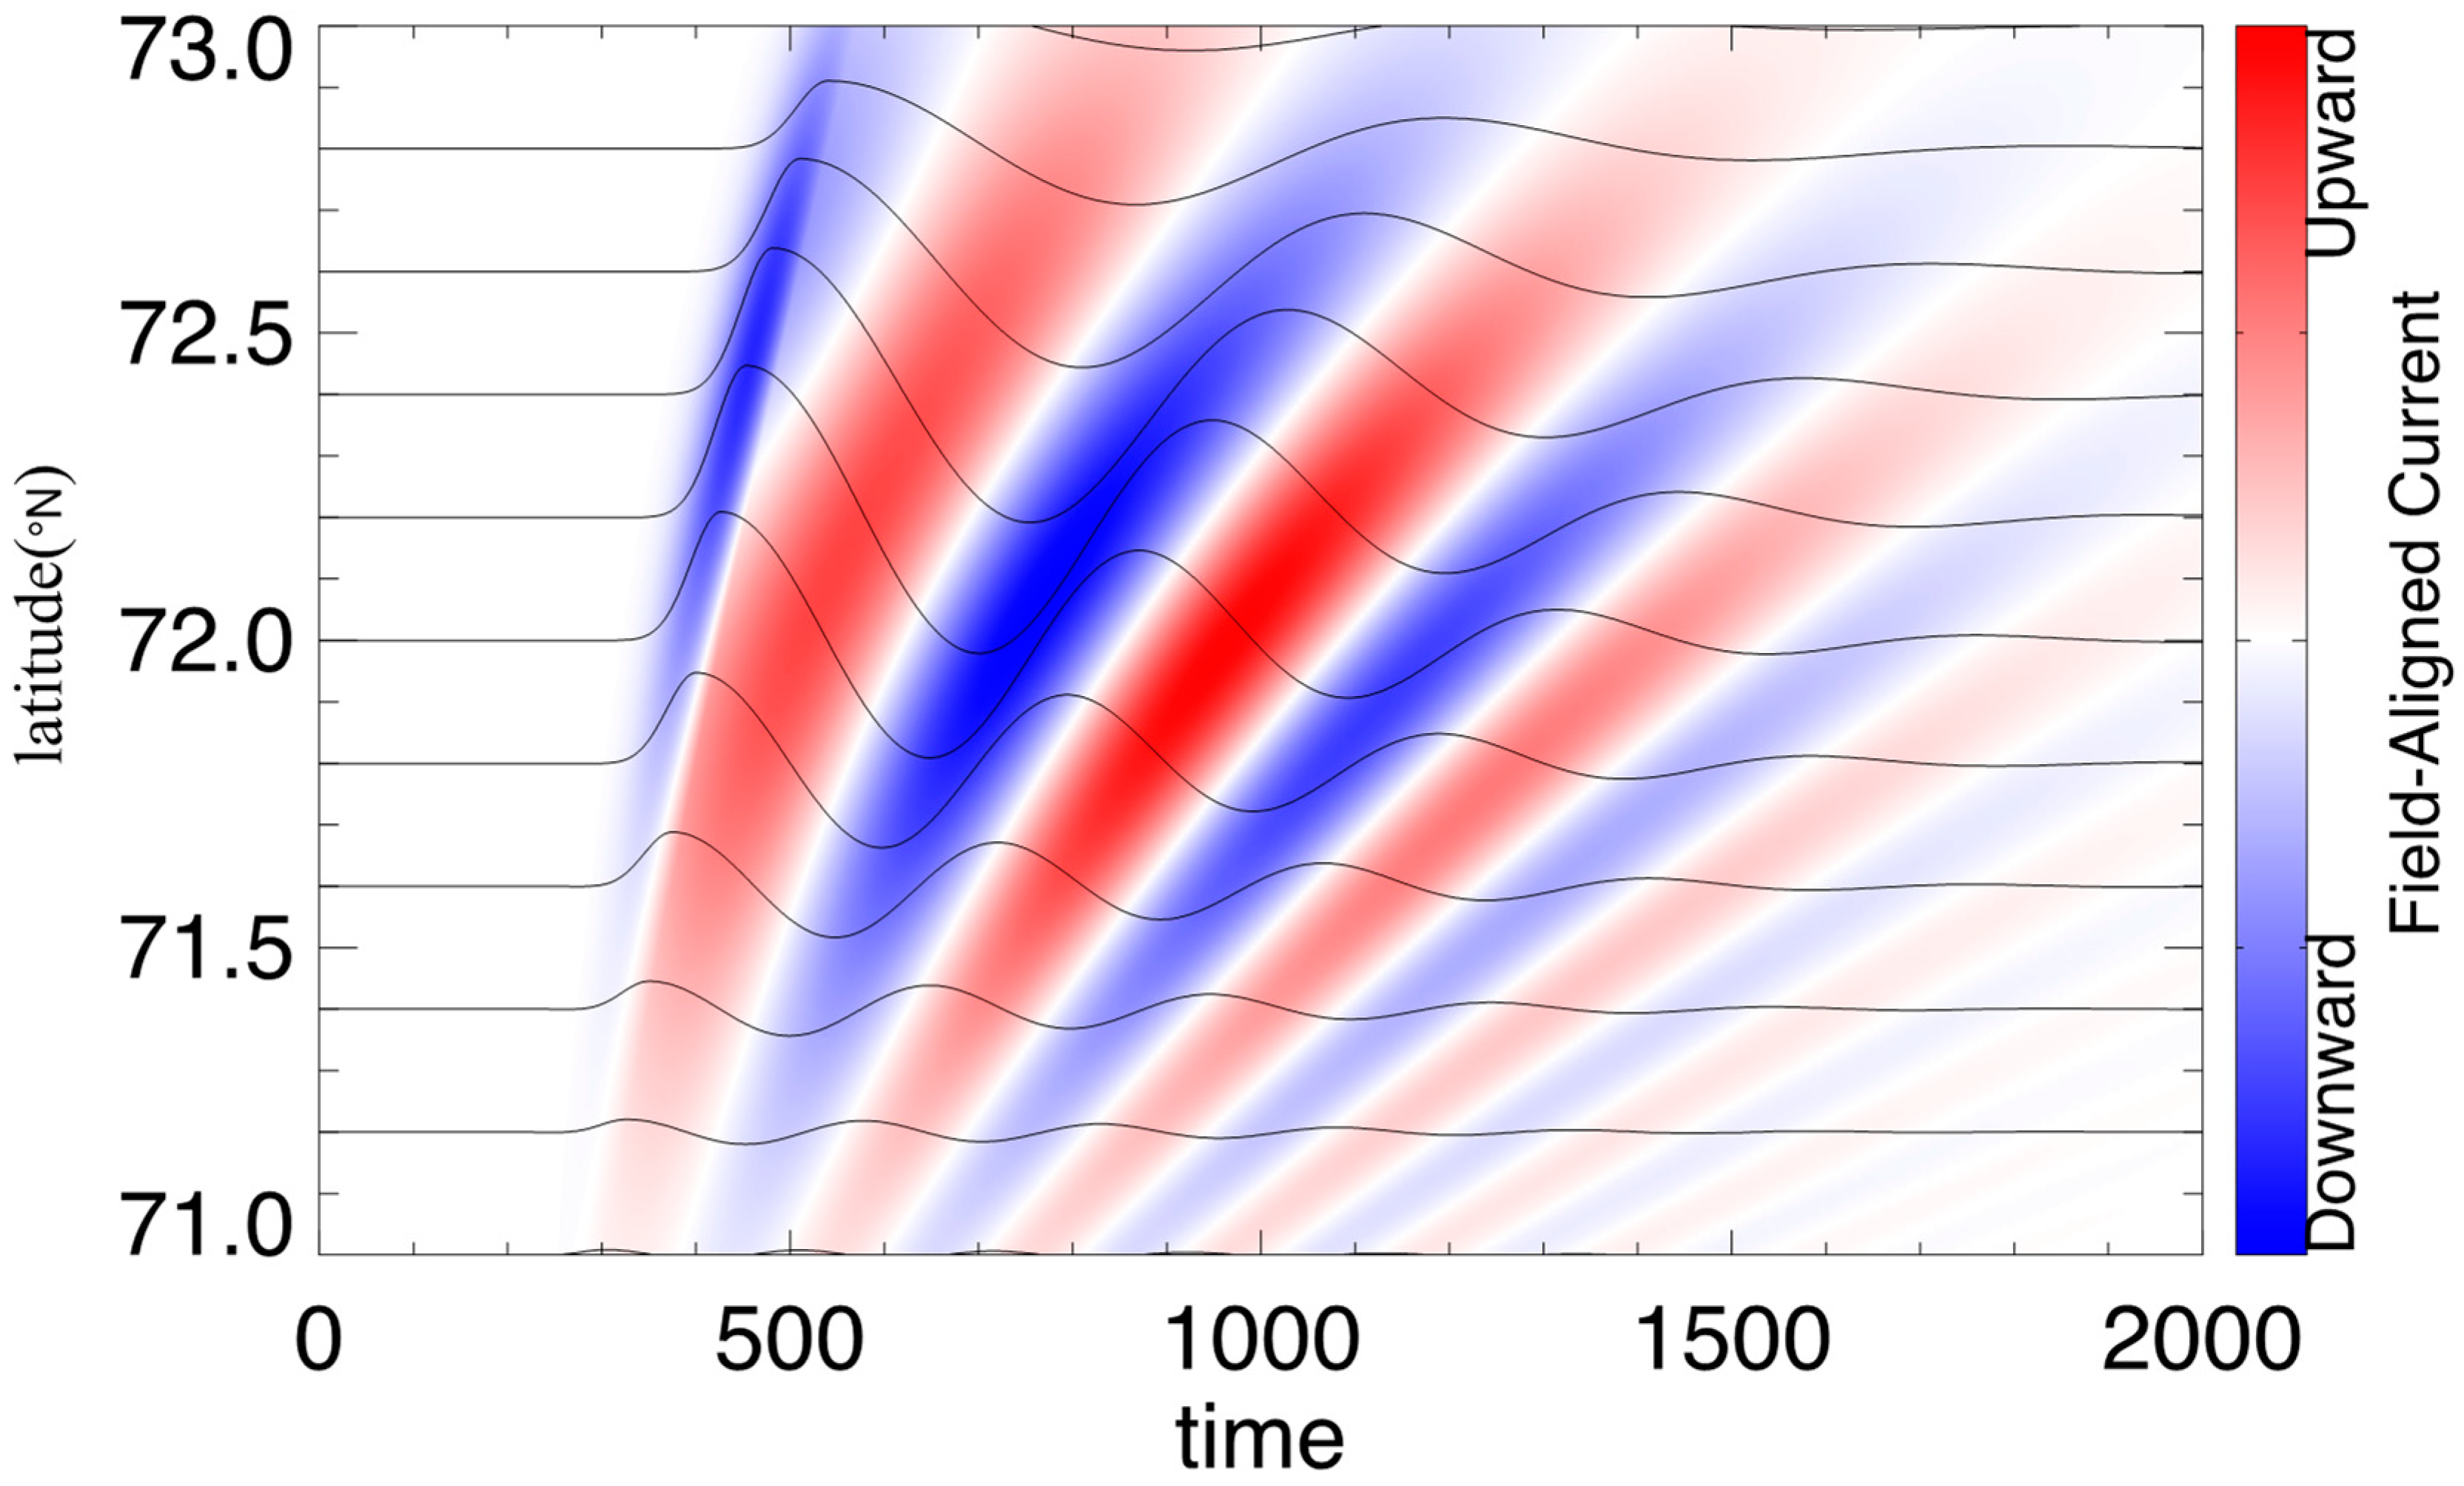
Figure 1 shows the result of the latitudinal distribution of FACs (as colored patches) as functions of time and latitudes. The azimuthal component of the magnetic fields (as solid lines) is presented in field-aligned coordinates, which corresponds to the in-situ THEMIS observations. In this event, FLRs induced by a solar wind dynamic pressure pulse were observed by three THEMIS satellites in the inner magnetosphere, as shown in
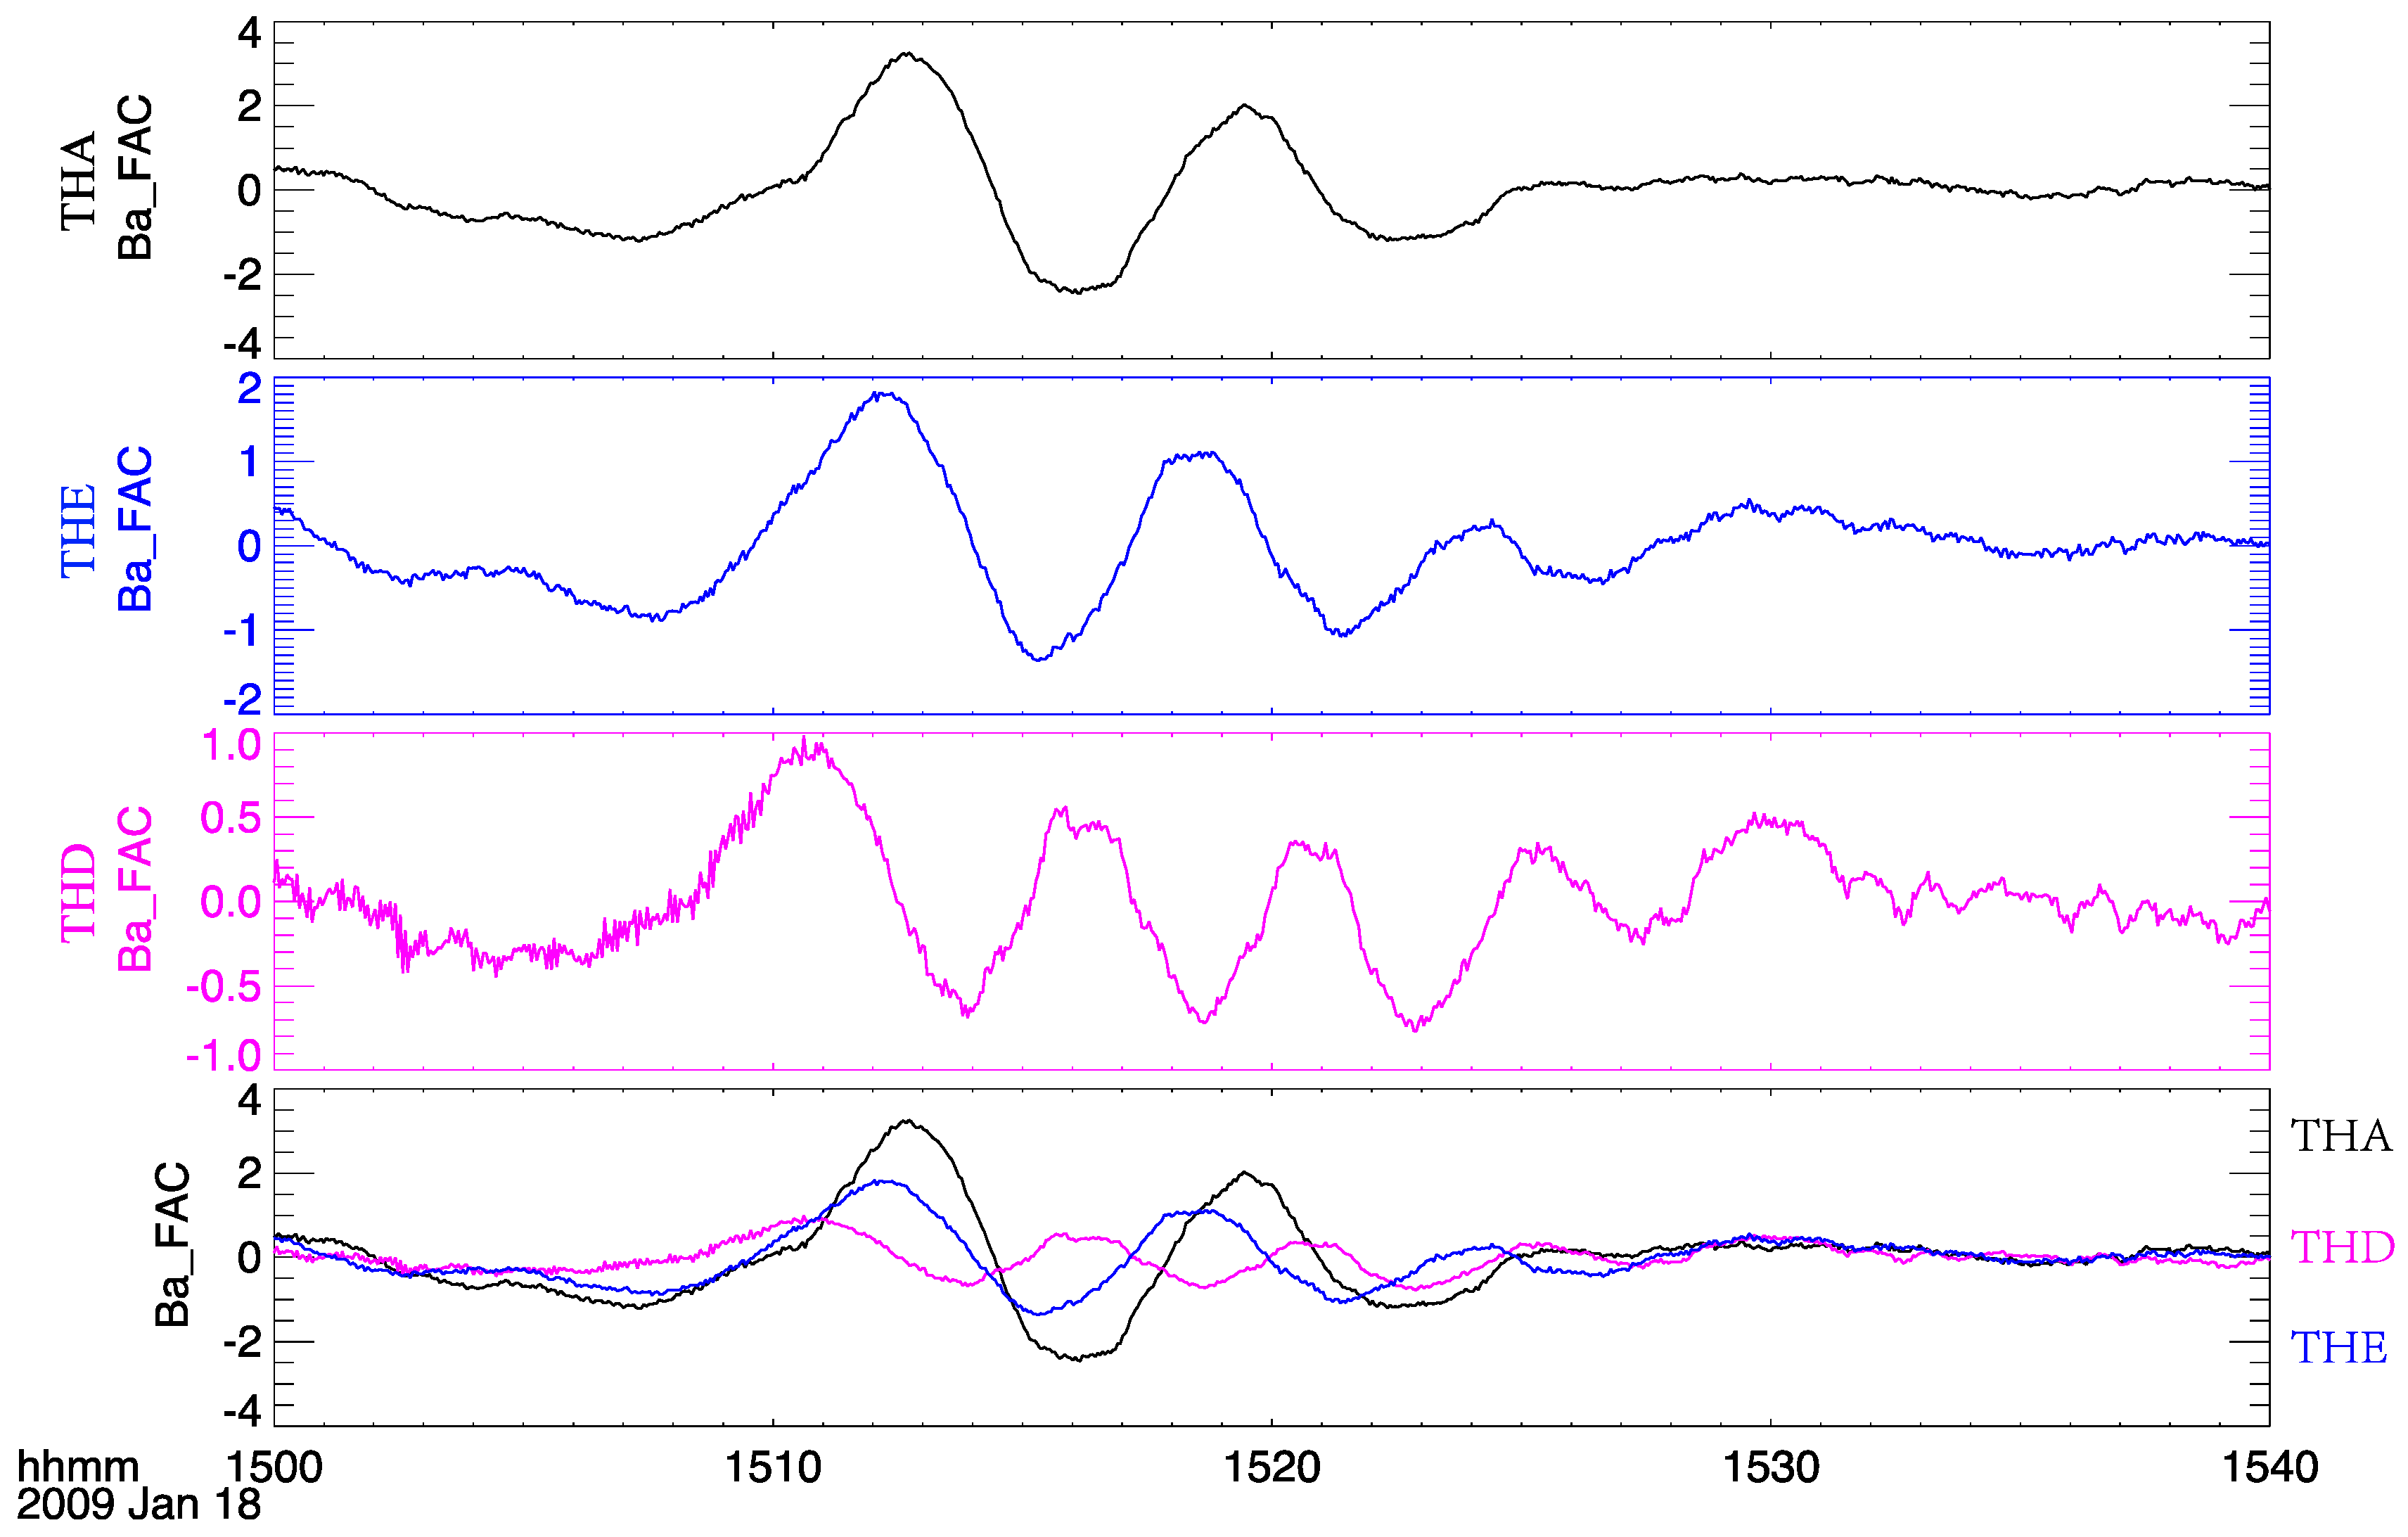
Figure 2. The magnetic field perturbations were first observed by THEMIS-D (small L shell), followed by THEMIS-E (larger L shell), and THEMIS-A (largest L shell), respectively. Based on the multiple THEMIS observations, we infer that the magnetic field perturbations were first induced in lower latitudes and then produced in higher latitudes, which is consistent with the THEMIS observations. In this event, we observed that downward FACs (i.e., negative
values) related to black auroras appeared immediately during the first ascending stages of the azimuthal component of magnetic field perturbations. The poleward motion of the downward FACs correspond to the phase shift of the waves across latitudes.
By analyzing solar wind data from the WIND satellite and OMNI, [
9] presented an isolated positive solar wind dynamic pressure pulse at 14:16 universal time (UT) on 18 January 2009. Three THEMIS satellites (THEMIS-A, THEMIS-D, and THEMIS-E) located in the dawnside magnetosphere have observed the quasi-sinusoidal wave signature when the positive solar wind dynamic pressure pulse arrived at the magnetosphere, as shown in
Figure 2. The ULF wave frequencies derived from wavelet analysis of electric and magnetic fields are 2.3 mHz, 3.5 mHz, and 2.7 mHz for THEMIS-A, THEMIS-D, and THEMIS-E, respectively, which are consistent with the eigenfrequency results derived from model simulation [
17]. In this case, the observed waves induced by the solar wind dynamic pressure pulse were toroidal branches of the standing hydromagnetic waves, as the azimuthal component of magnetic and radial component of the electric field are more significant [
9]. Thus, we can confirm that a positive solar wind dynamic pressure pulse produced the observed FLRs in this event by using WIND satellite and multiple THEMIS satellites, respectively.
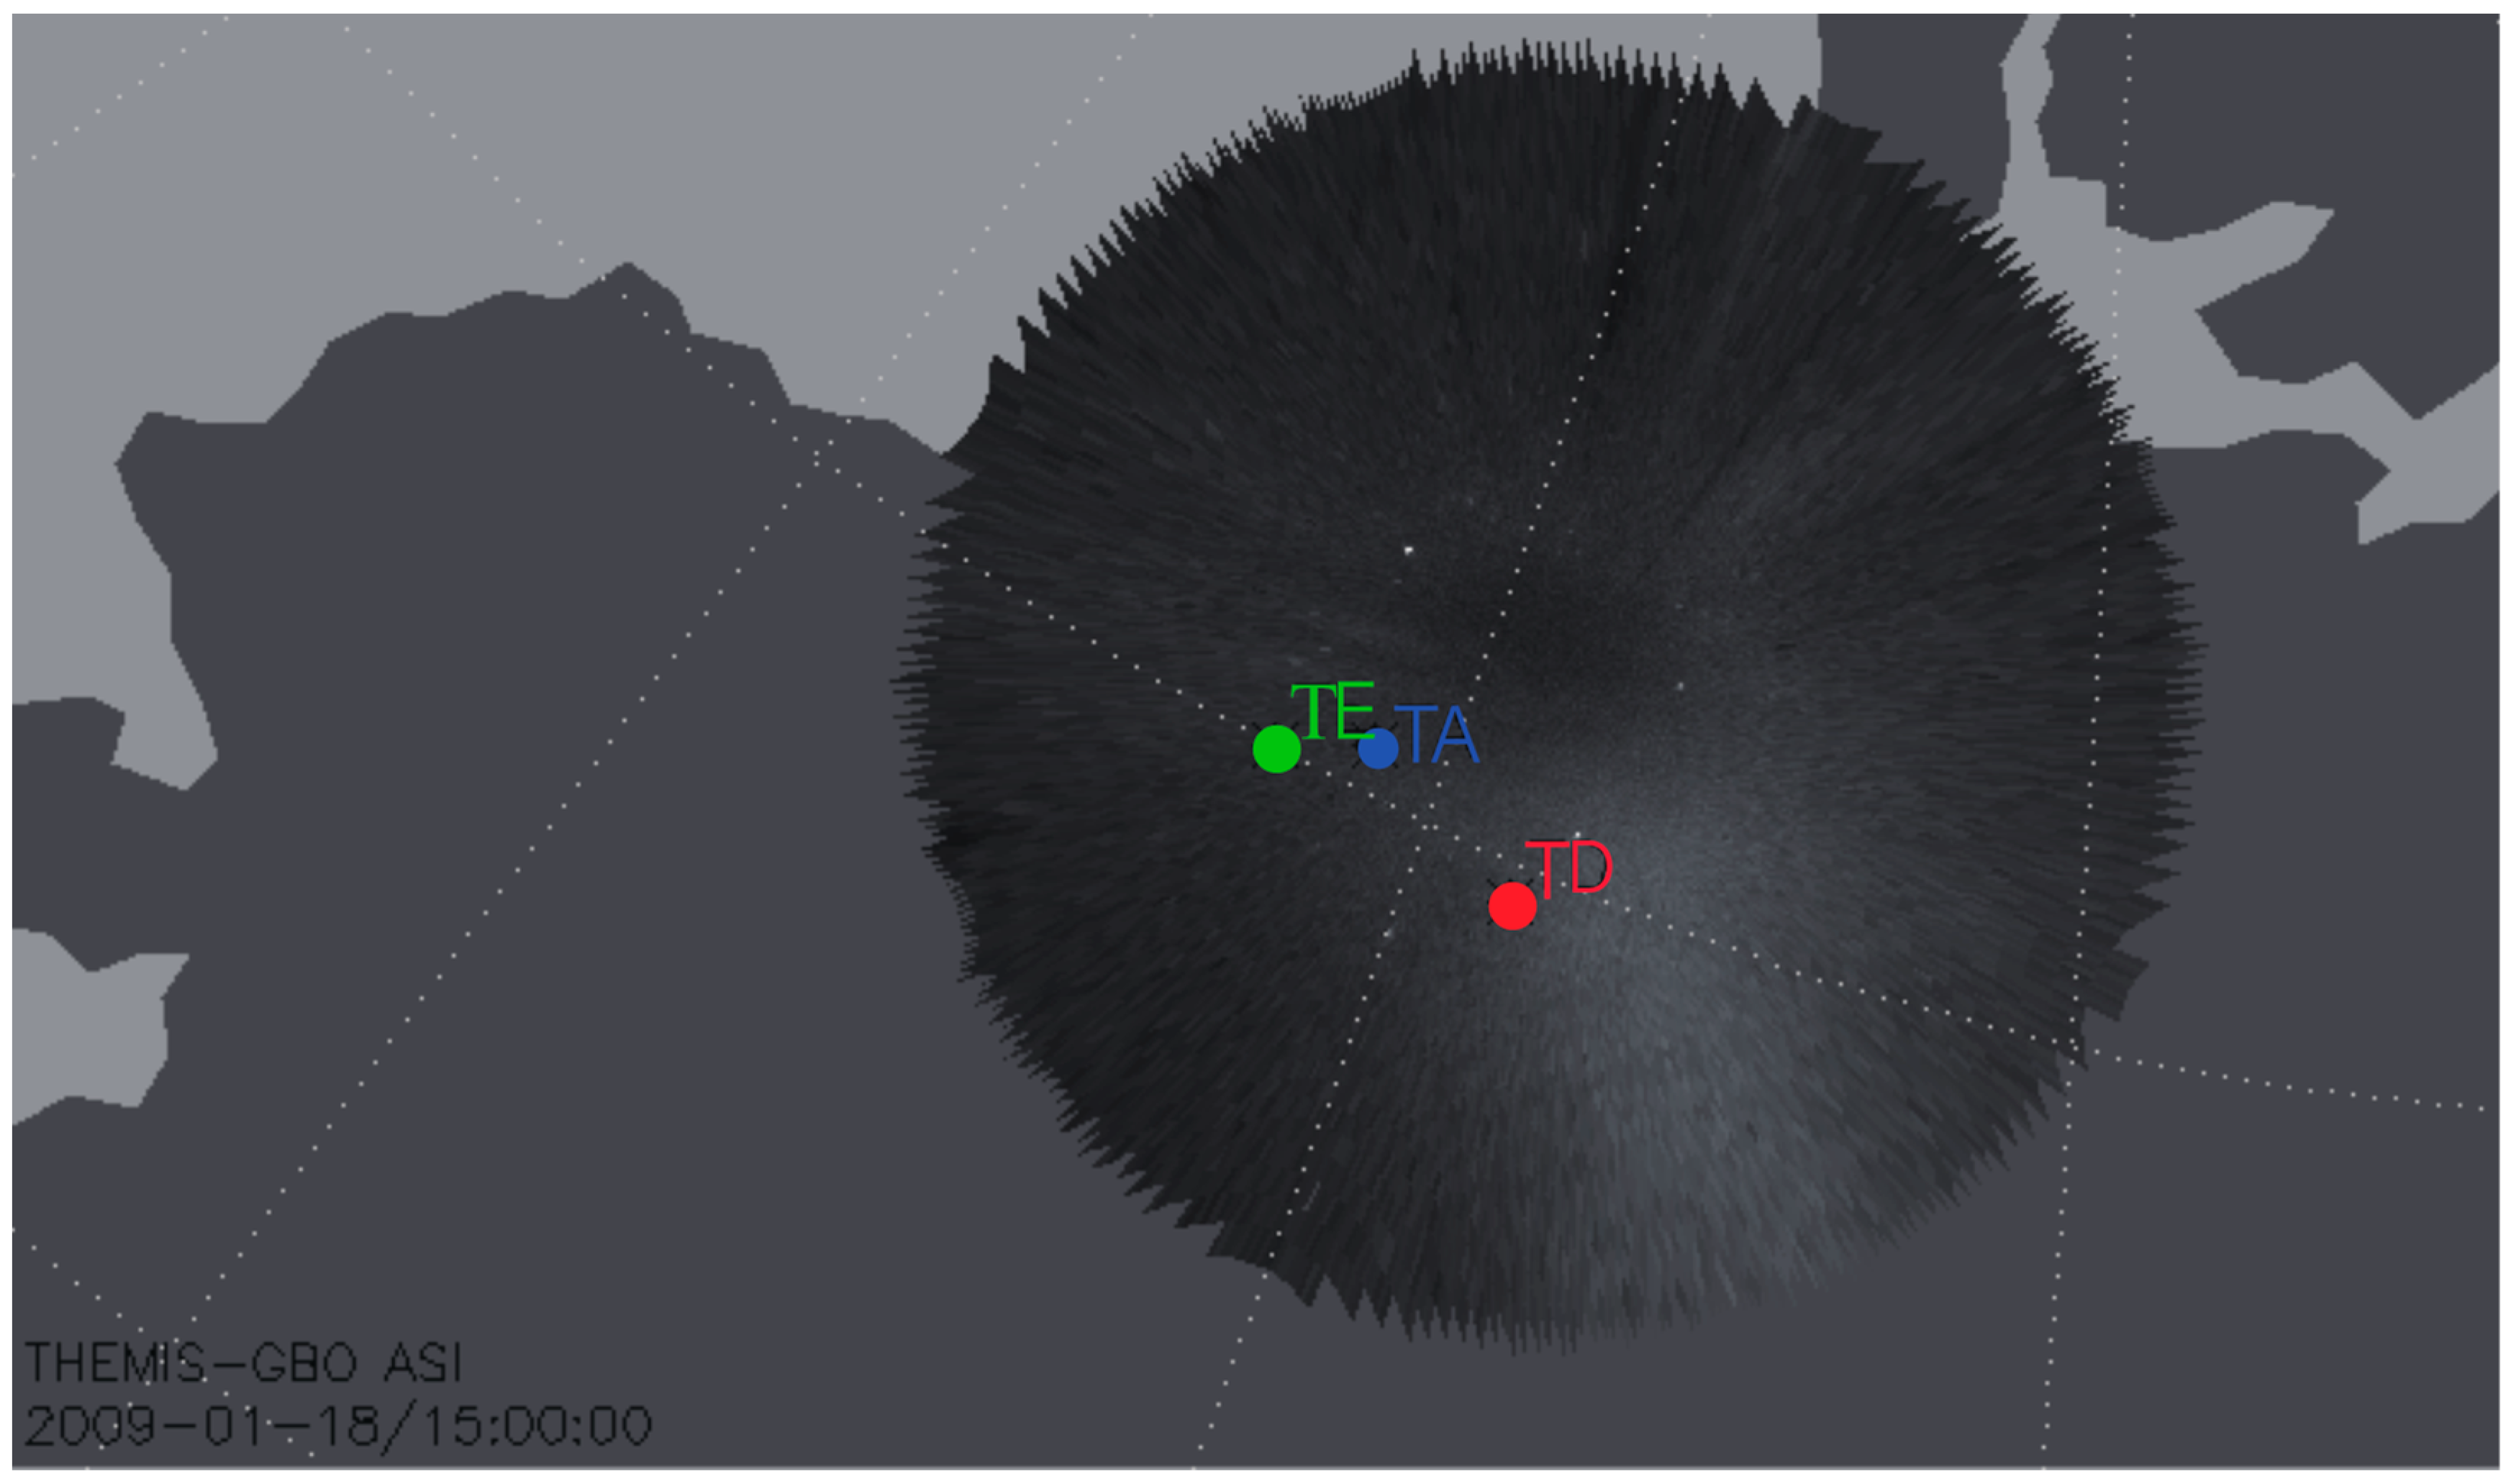
To better correlate the in situ observations obtained from multiple THEMIS spacecrafts with the ionospheric response to the FLRs, we utilized realistic solar wind parameters and the T96 model to calculate the magnetic footprints of THEMIS.
Figure 3 shows that all three magnetic footprints of THEMIS were within the field of view of the INUV all-sky camera, with THEMIS-A, THEMIS-E, and THEMIS-D located in the higher, middle, and lower latitude areas, respectively. This provides important context for interpreting the ionospheric response to the FLRs observed by THEMIS, as it allows us to compare the in situ observations with the corresponding ionospheric signatures.
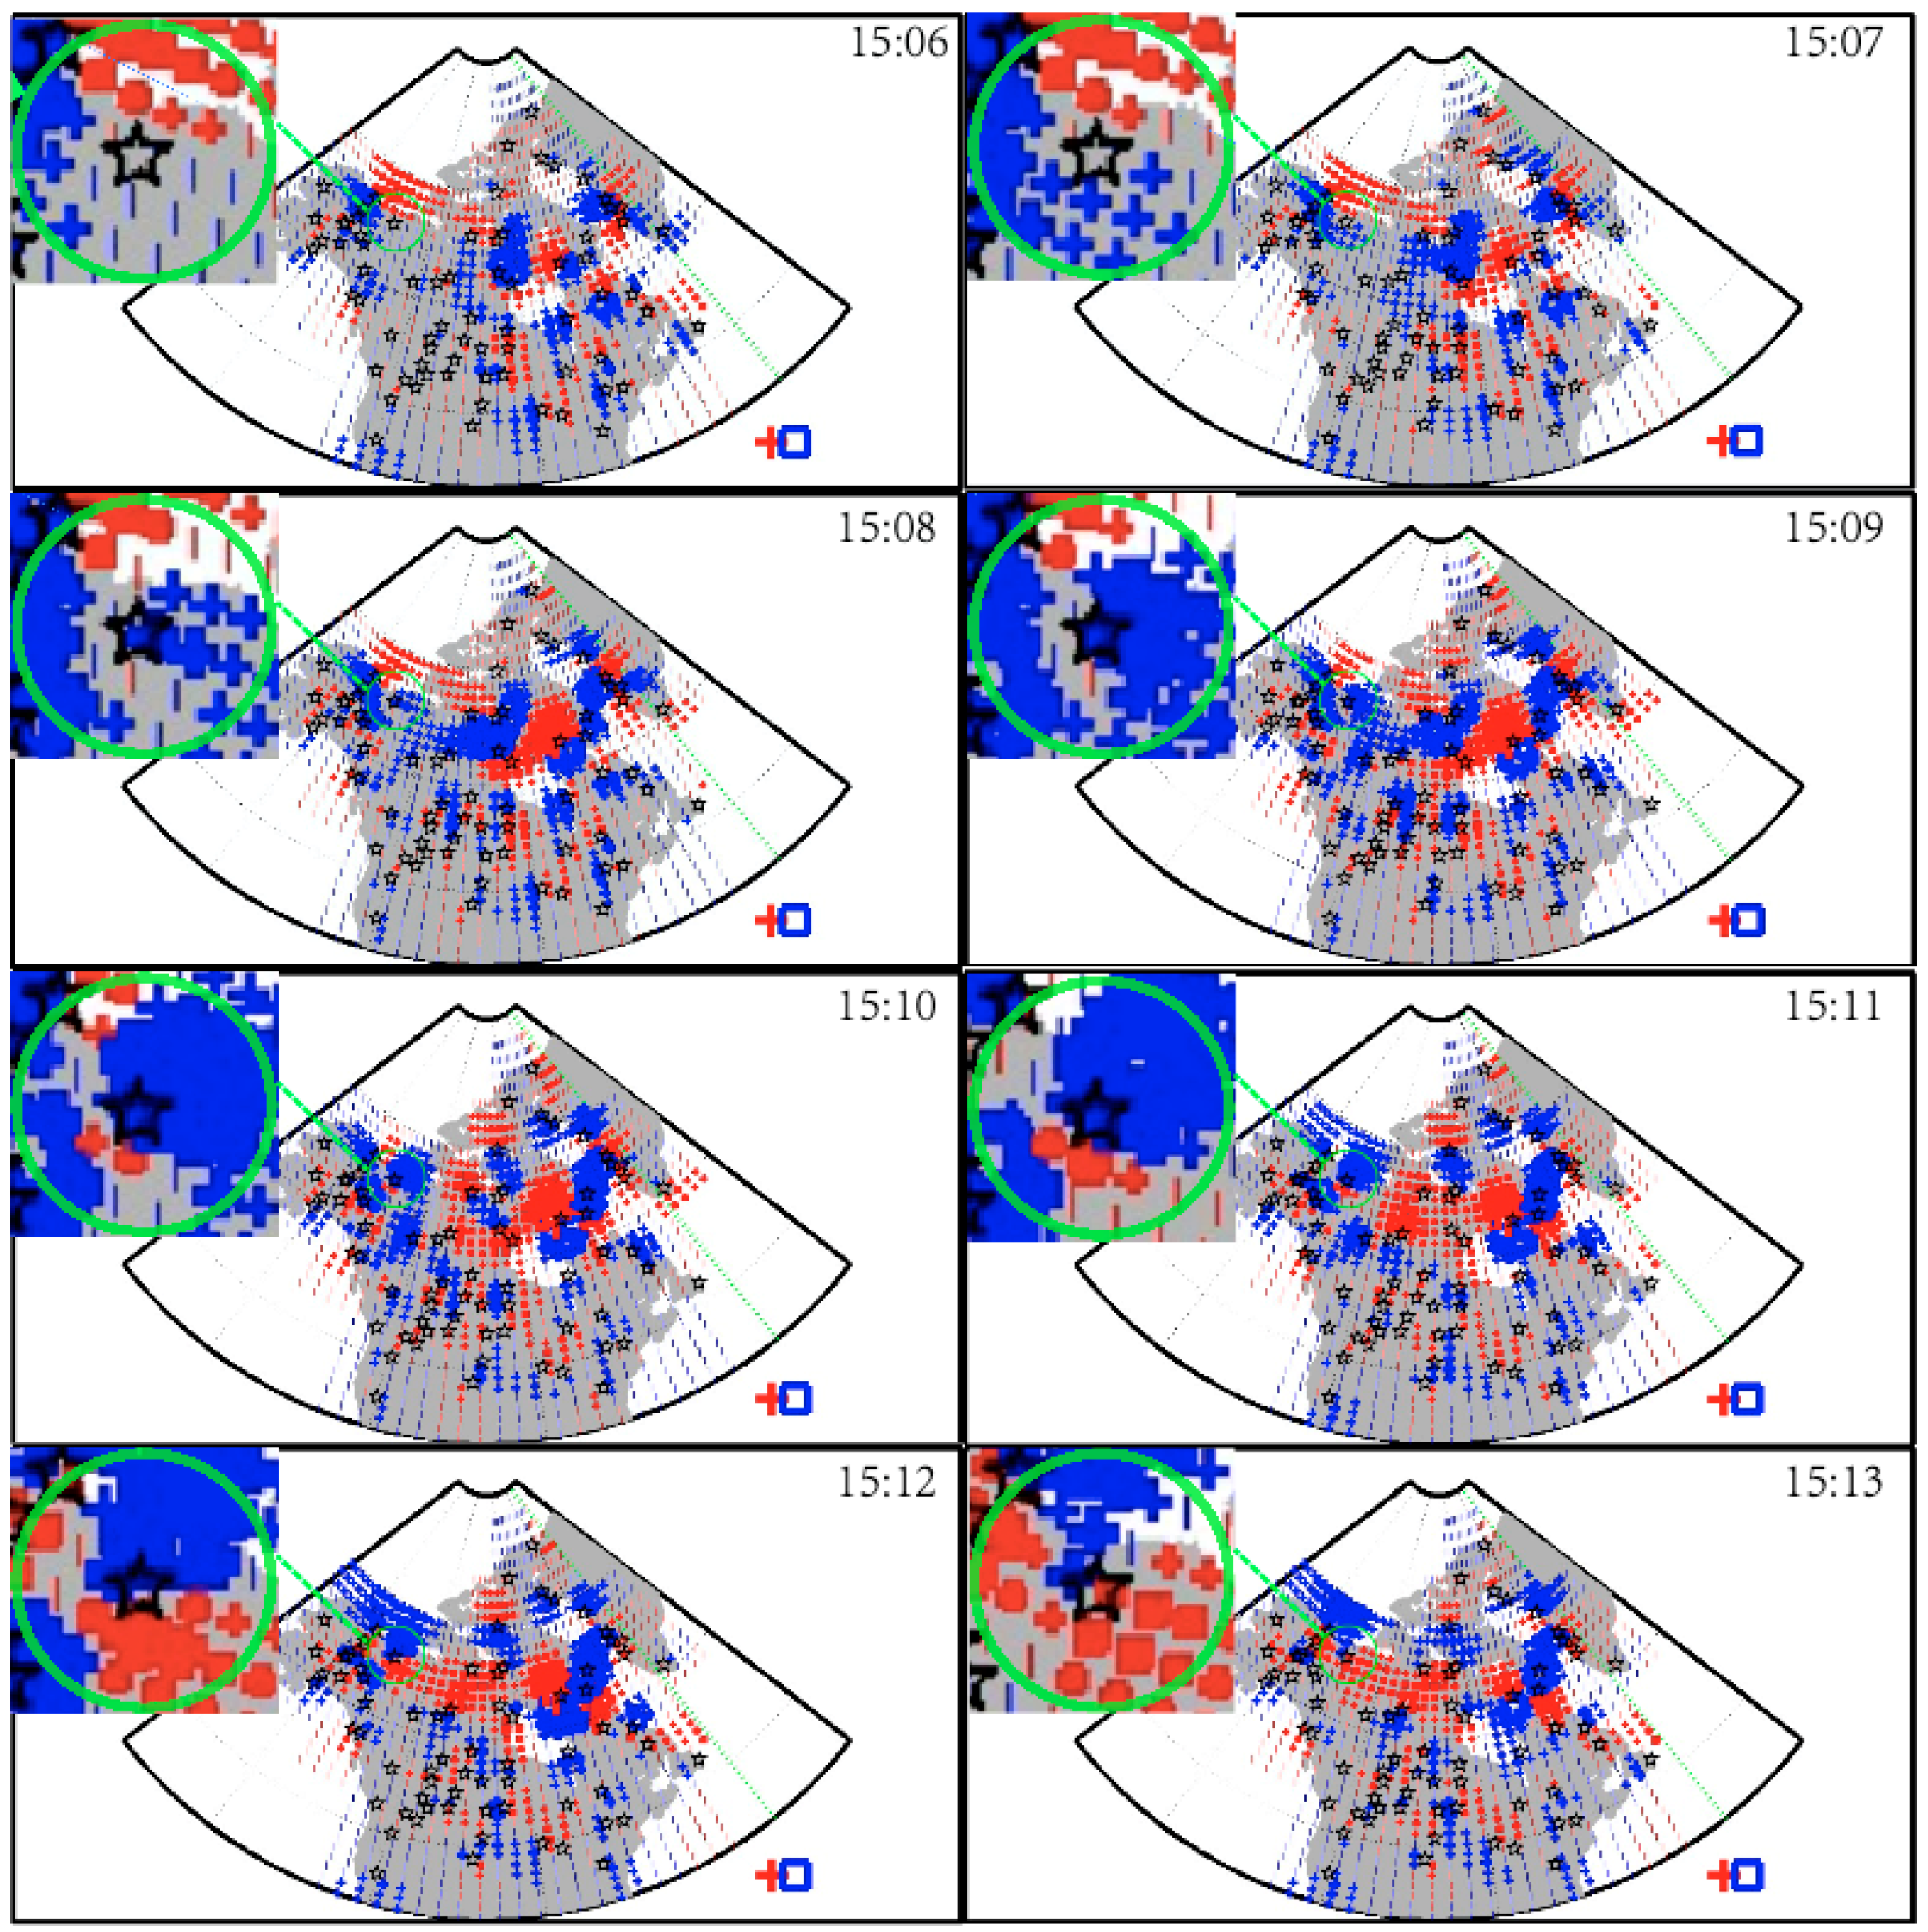
To correlate the in situ observations obtained from multiple THEMIS spacecrafts and the ionospheric response to the FLRs, we utilized the spherical elementary current system (SECS) method [
18,
19,
20], as shown in
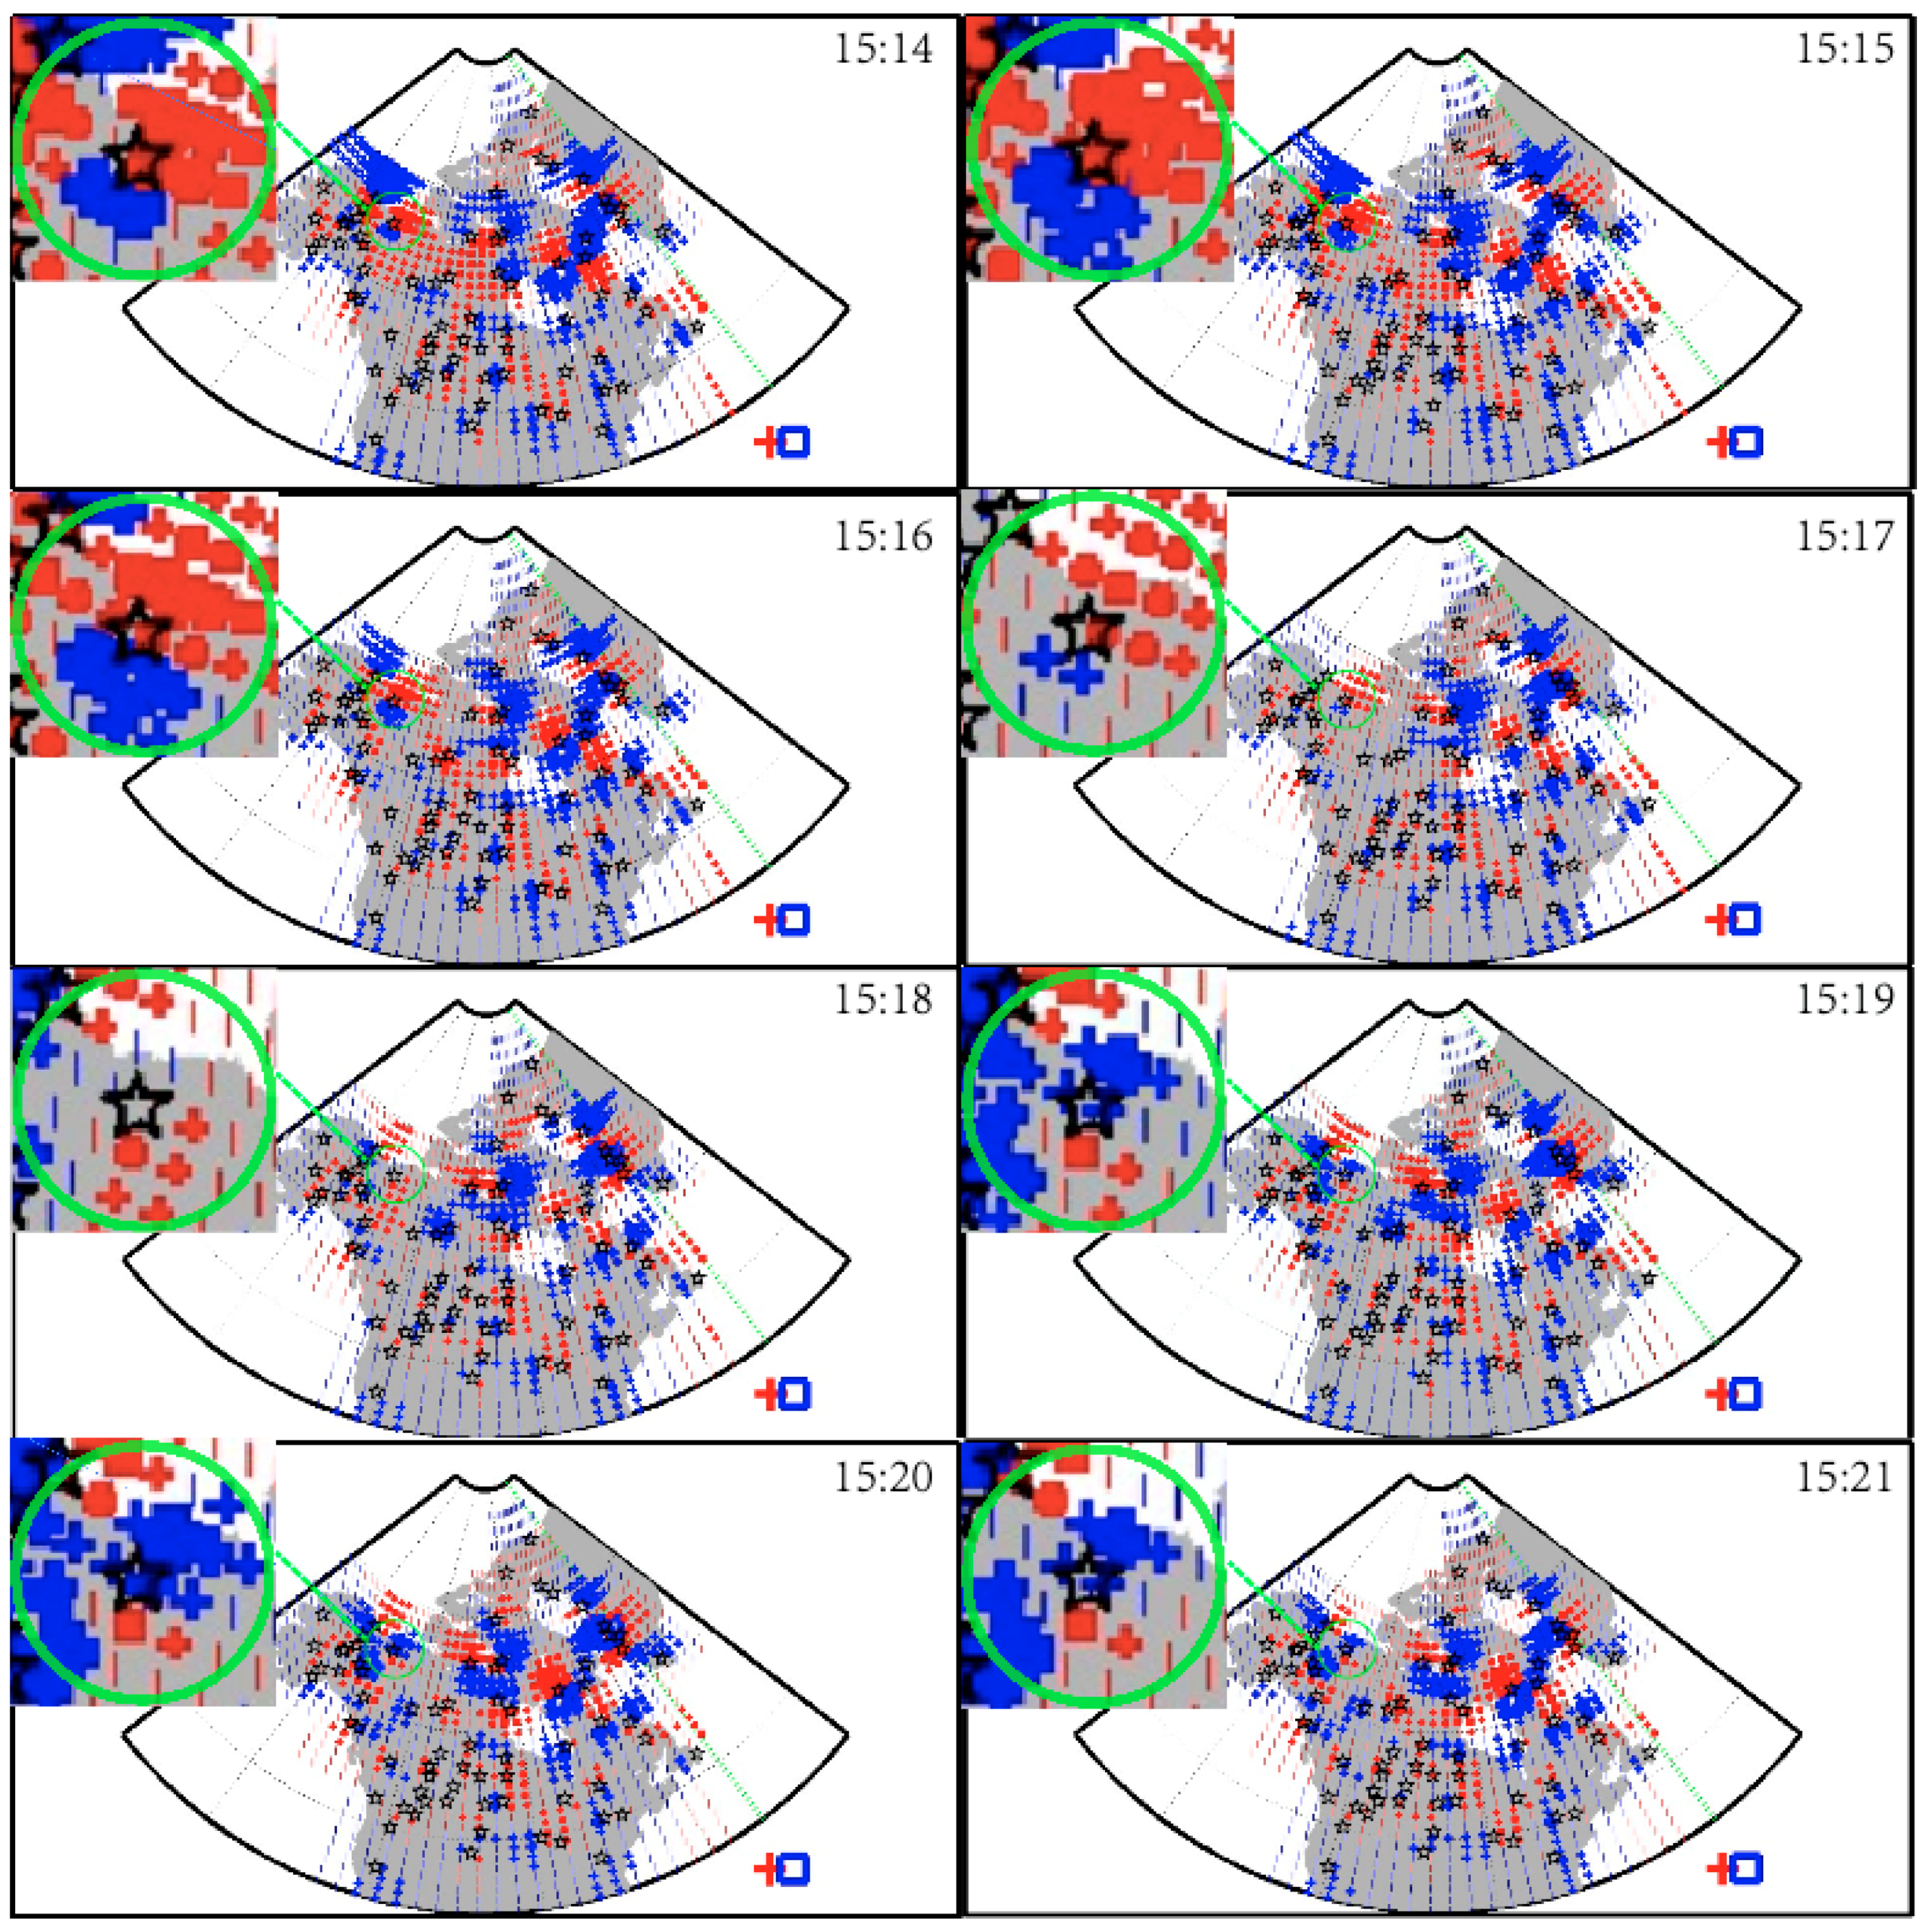
Figure 4 and
Figure 5. In this study, we used ground magnetometer arrays around the INUV all-sky camera station in North America to calculate the time evolution of the equivalent ionospheric currents (EICs). The FAC intensity was proportional to the Hall–Pederson conductance ratio (generated by an integration of the vertical component of the EICs curl over every grid region) under the assumption that the gradient of the ionospheric conductance was zero in the direction perpendicular to the electric field [
20,
21]. By reconstructing a divergence-free current system based on the zero-gradient assumption, we obtained the distribution of FACs. Only magnetometers above 38 degrees were used in this event because the magnetometers in lower areas have larger angles between ionospheric normal directions and localize magnetic field-lines [
20,
22]. In
Figure 4 and
Figure 5, the red area and the blue area represent upward and downward FACs, respectively, while the black stars correspond to the magnetometers used in this event. To better illustrate the evolution of the FACs in the field of view of the INUV station, we zoomed in on the FACs distribution in the top-left corner of each panel in
Figure 4 and
Figure 5. At 1506 UT, the high latitude part of the INUV station’s field of view was located within the red region with upward FACs, while the blue region representing downward FACs appeared at the low latitude part, with the red region dominating. At 1507 UT, the downward FACs represented by the blue region in the low latitude part began to increase, while the red region corresponding to upward FACs began to decrease. After 1507 UT, the blue region expanded in the northwest direction, gradually covering the entire north part of the field view of the INUV station at 1511 UT, indicating that the downward FACs had covered the north part of the INUV station’s field of view at that time. Subsequently, the blue region in the north part began to decrease and propagate to the northwest direction, while the red region corresponding to upward FACs began to increase and also propagate to the northwest part of the field view of the INUV station. After 1511 UT, the red region expanded and gradually covered the entire north part of the field view of the INUV station at 1517 UT.
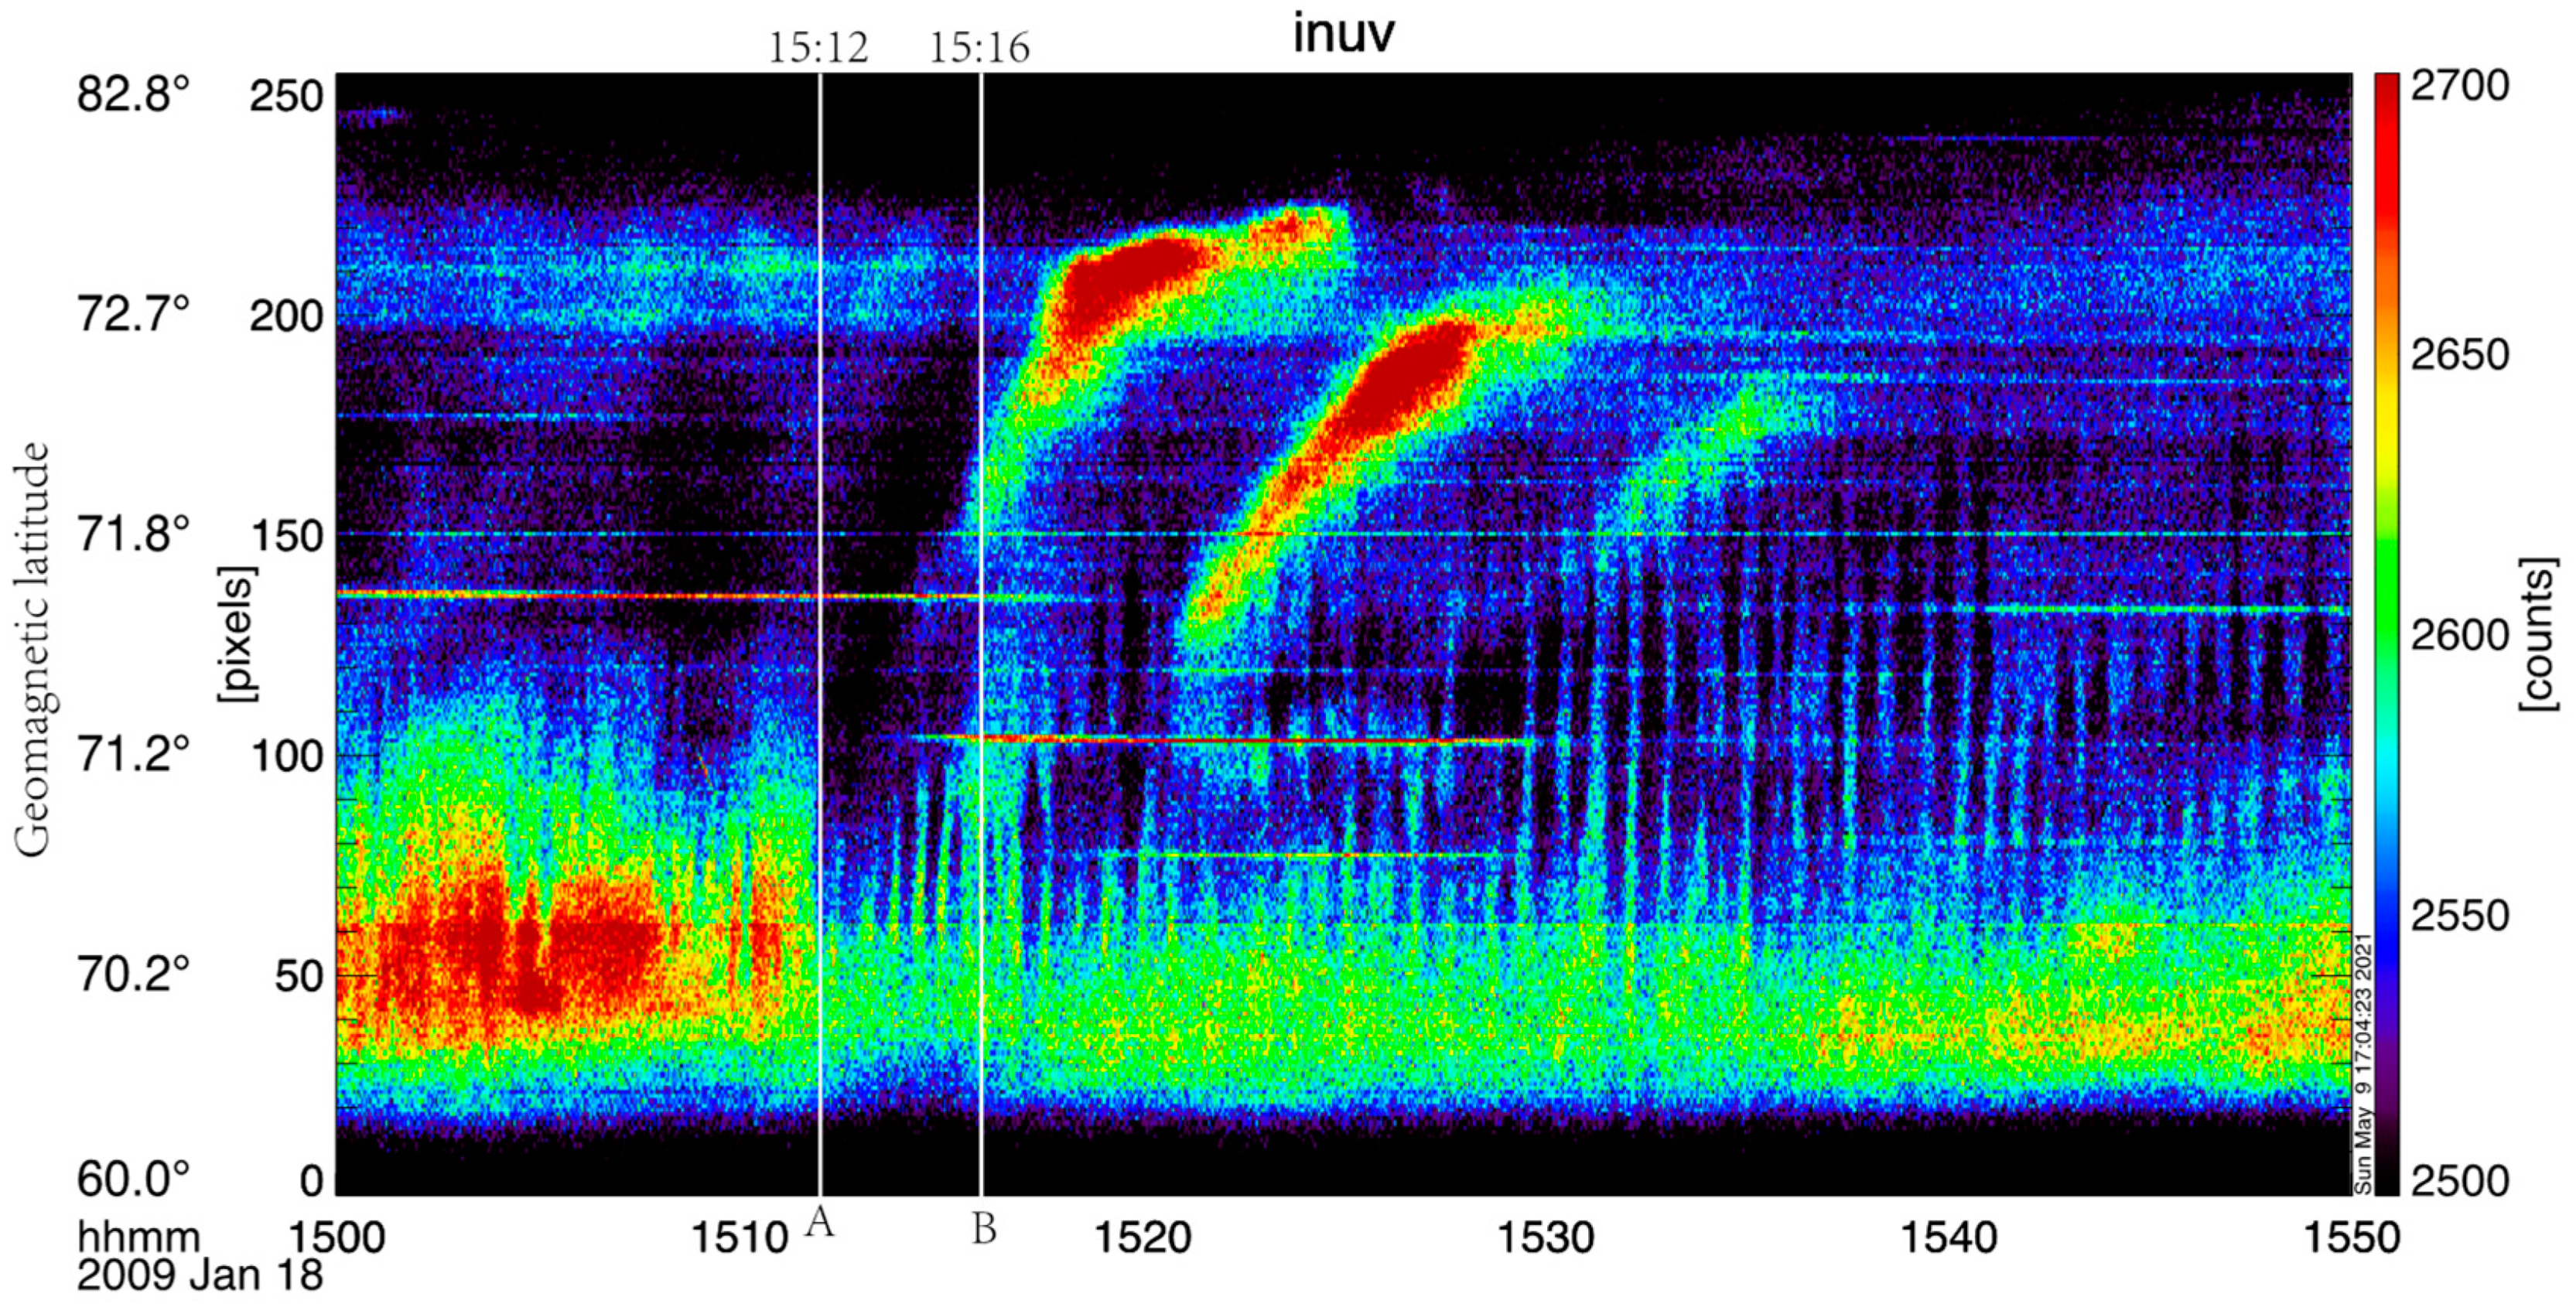
Figure 6 displays the keogram from the INUV all-sky camera, which illustrates the temporal and latitudinal evolution of the black aurora from 1500 UT to 1550 UT. As shown in
Figure 6, the keogram shows a decrease in auroral luminosity in the lower latitude region beginning at 1512 UT. This reduction then propagates poleward, reaching the poleward boundary at 1516 UT. In this event, we can find that field-aligned currents presented in
Figure 4 and
Figure 5 show a clear poleward motion. Before the FLRs deduced by the solar wind dynamic pressure pulse, the upward (red region) and downward (blue region) field-aligned currents at 1506 UT in
Figure 4 covered the north and south part of field view of the INUV station, respectively. Then, the downward field-aligned currents propagated poleward and covered the entire north part of field view of the INUV station at 1511 UT. We also can find that the auroral luminosity presented in
Figure 6 first shows significant reduction at 1512 UT at lower latitude aera. After that, downward and upward field-aligned currents continue to propagate poleward, and upward field-aligned currents covered all the north part of the field view of the INUV station at 1517 UT in
Figure 5. In
Figure 6, the auroral luminosity observations indicated that auroral luminosity reduction stopped at 1516 UT in the high latitude area, which showed that black auroras did drift with the field-aligned currents. Following this, the auroral luminosity began to increase again in the lower latitude region.
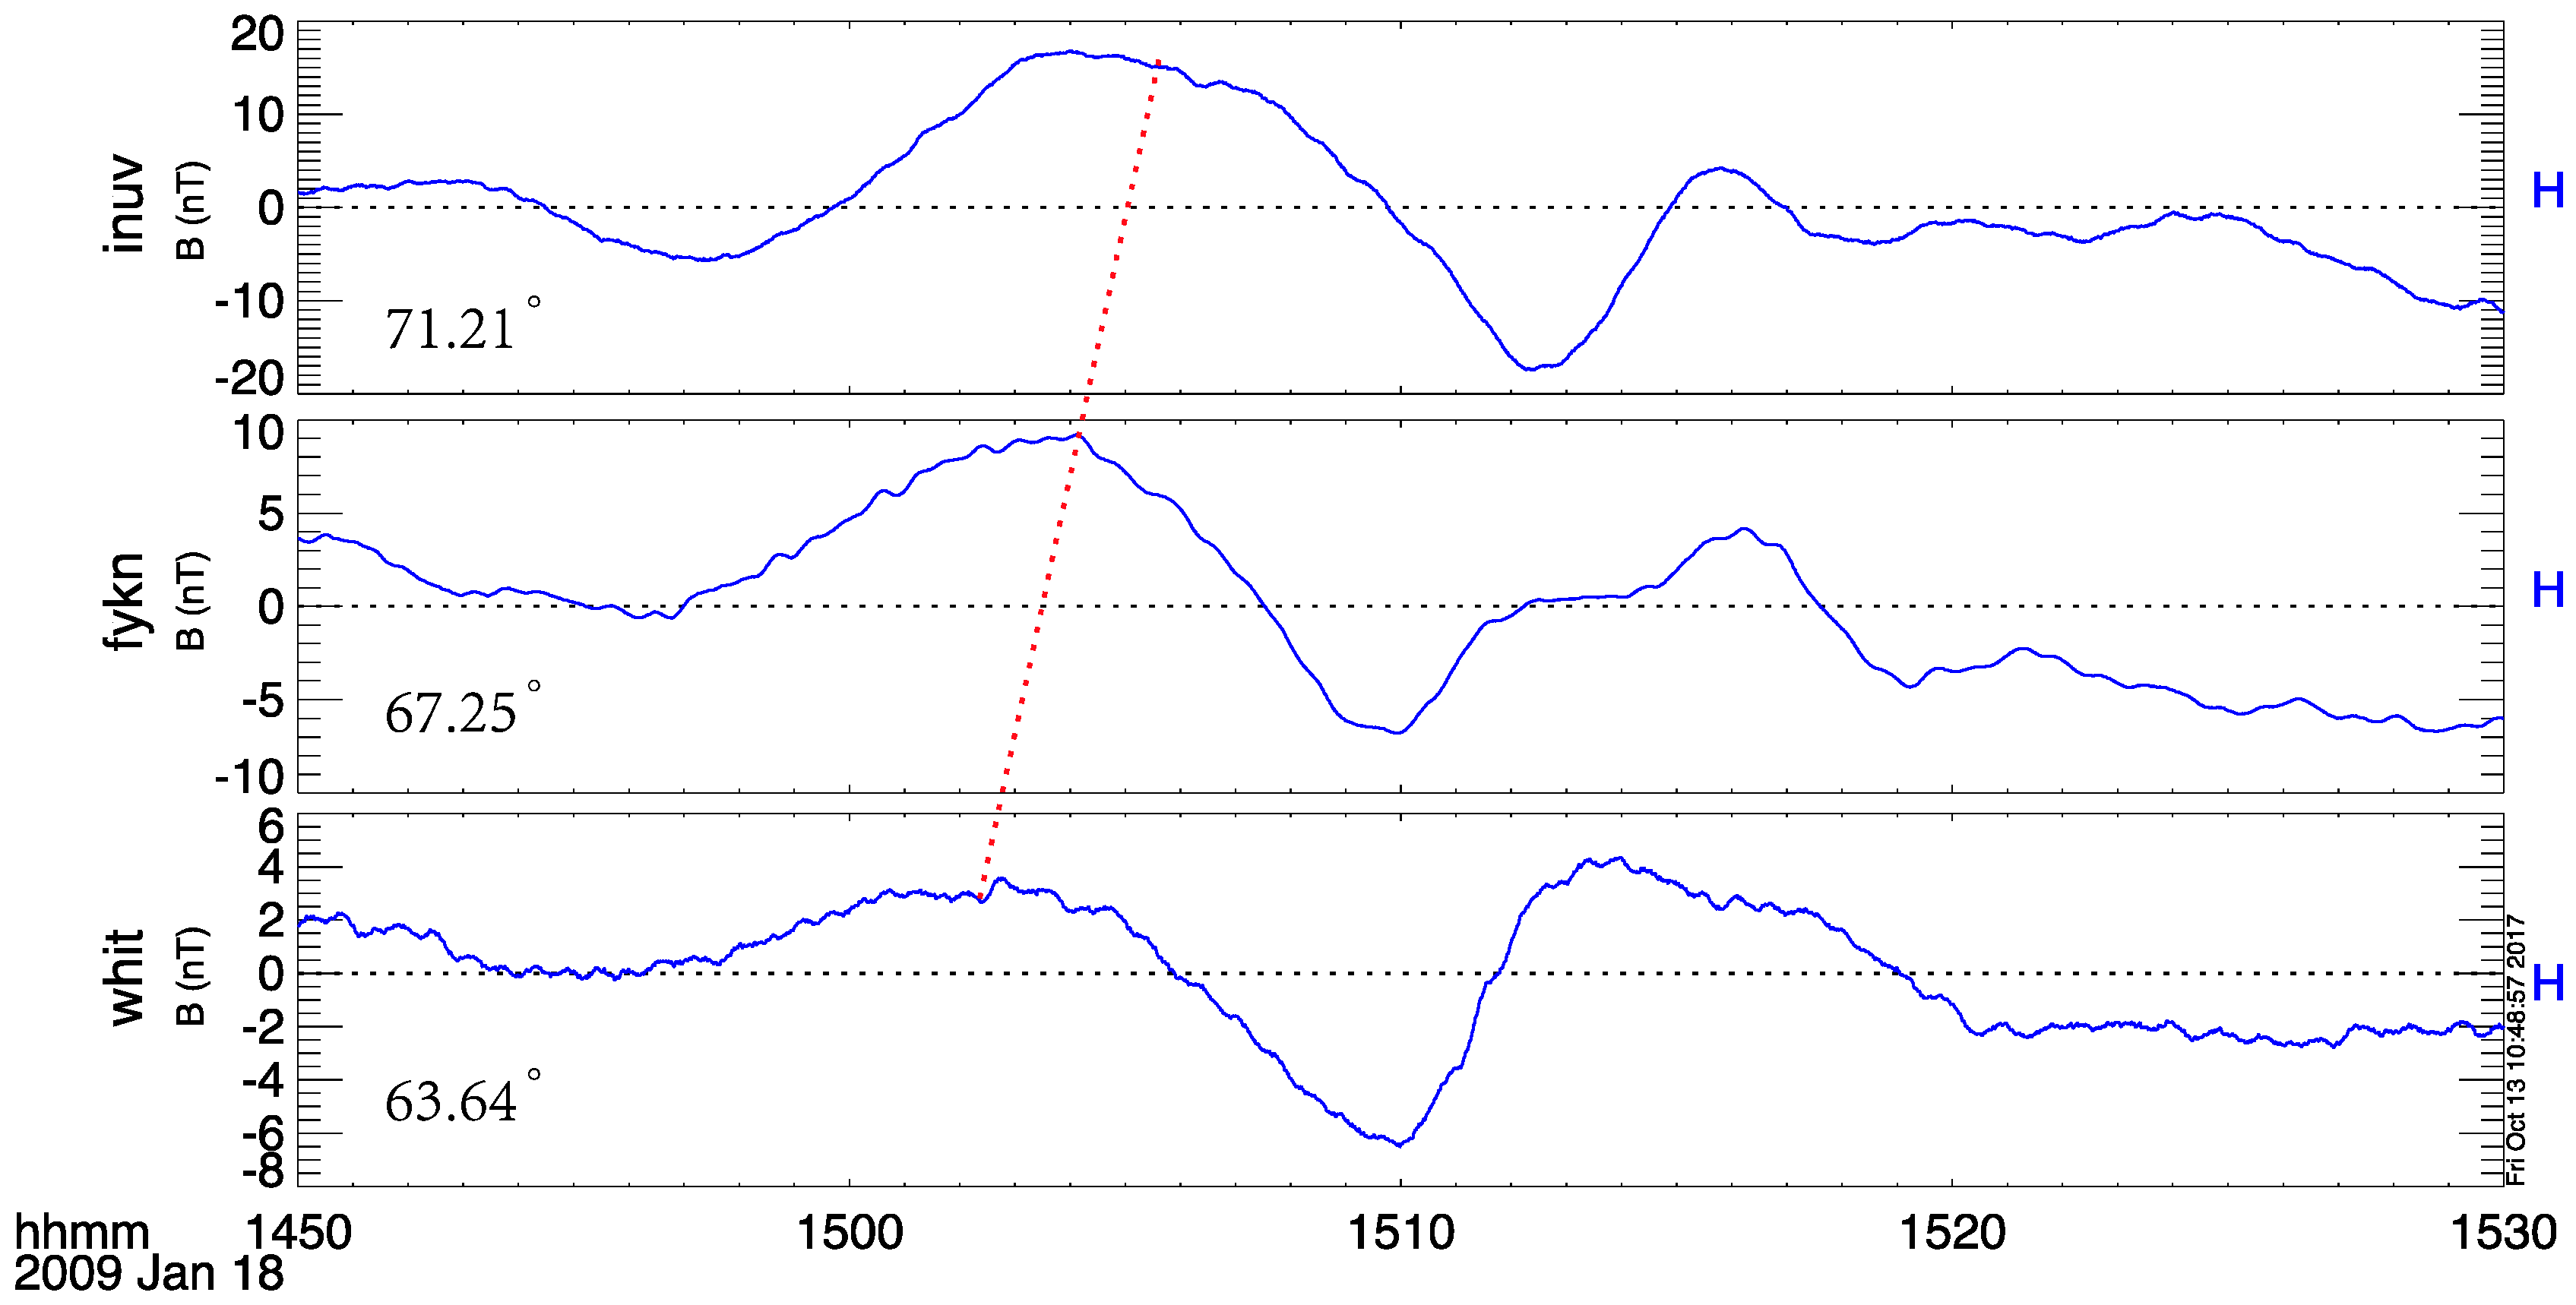
Figure 7 presents data on the H component of the magnetic field, derived from three magnetometers in the THEMIS ground-based magnetometer array. All three magnetometers, located at approximately 270 degrees in magnetic longitude and near the footprints of the THEMIS satellites, detect clear variations in the H component. The WHIT station, situated in a lower latitude region, observed these variations prior to the INUV station in a higher latitude region. The phase lag of bipolar variations crossing the three magnetometers indicates that the propagation direction is poleward, consistent with the observations of the multiple THEMIS satellites and the black aurora. The THEMIS satellite magnetic footprints and the INUV all-sky camera are located at dawnside, which suggests a westward propagation on the ground.
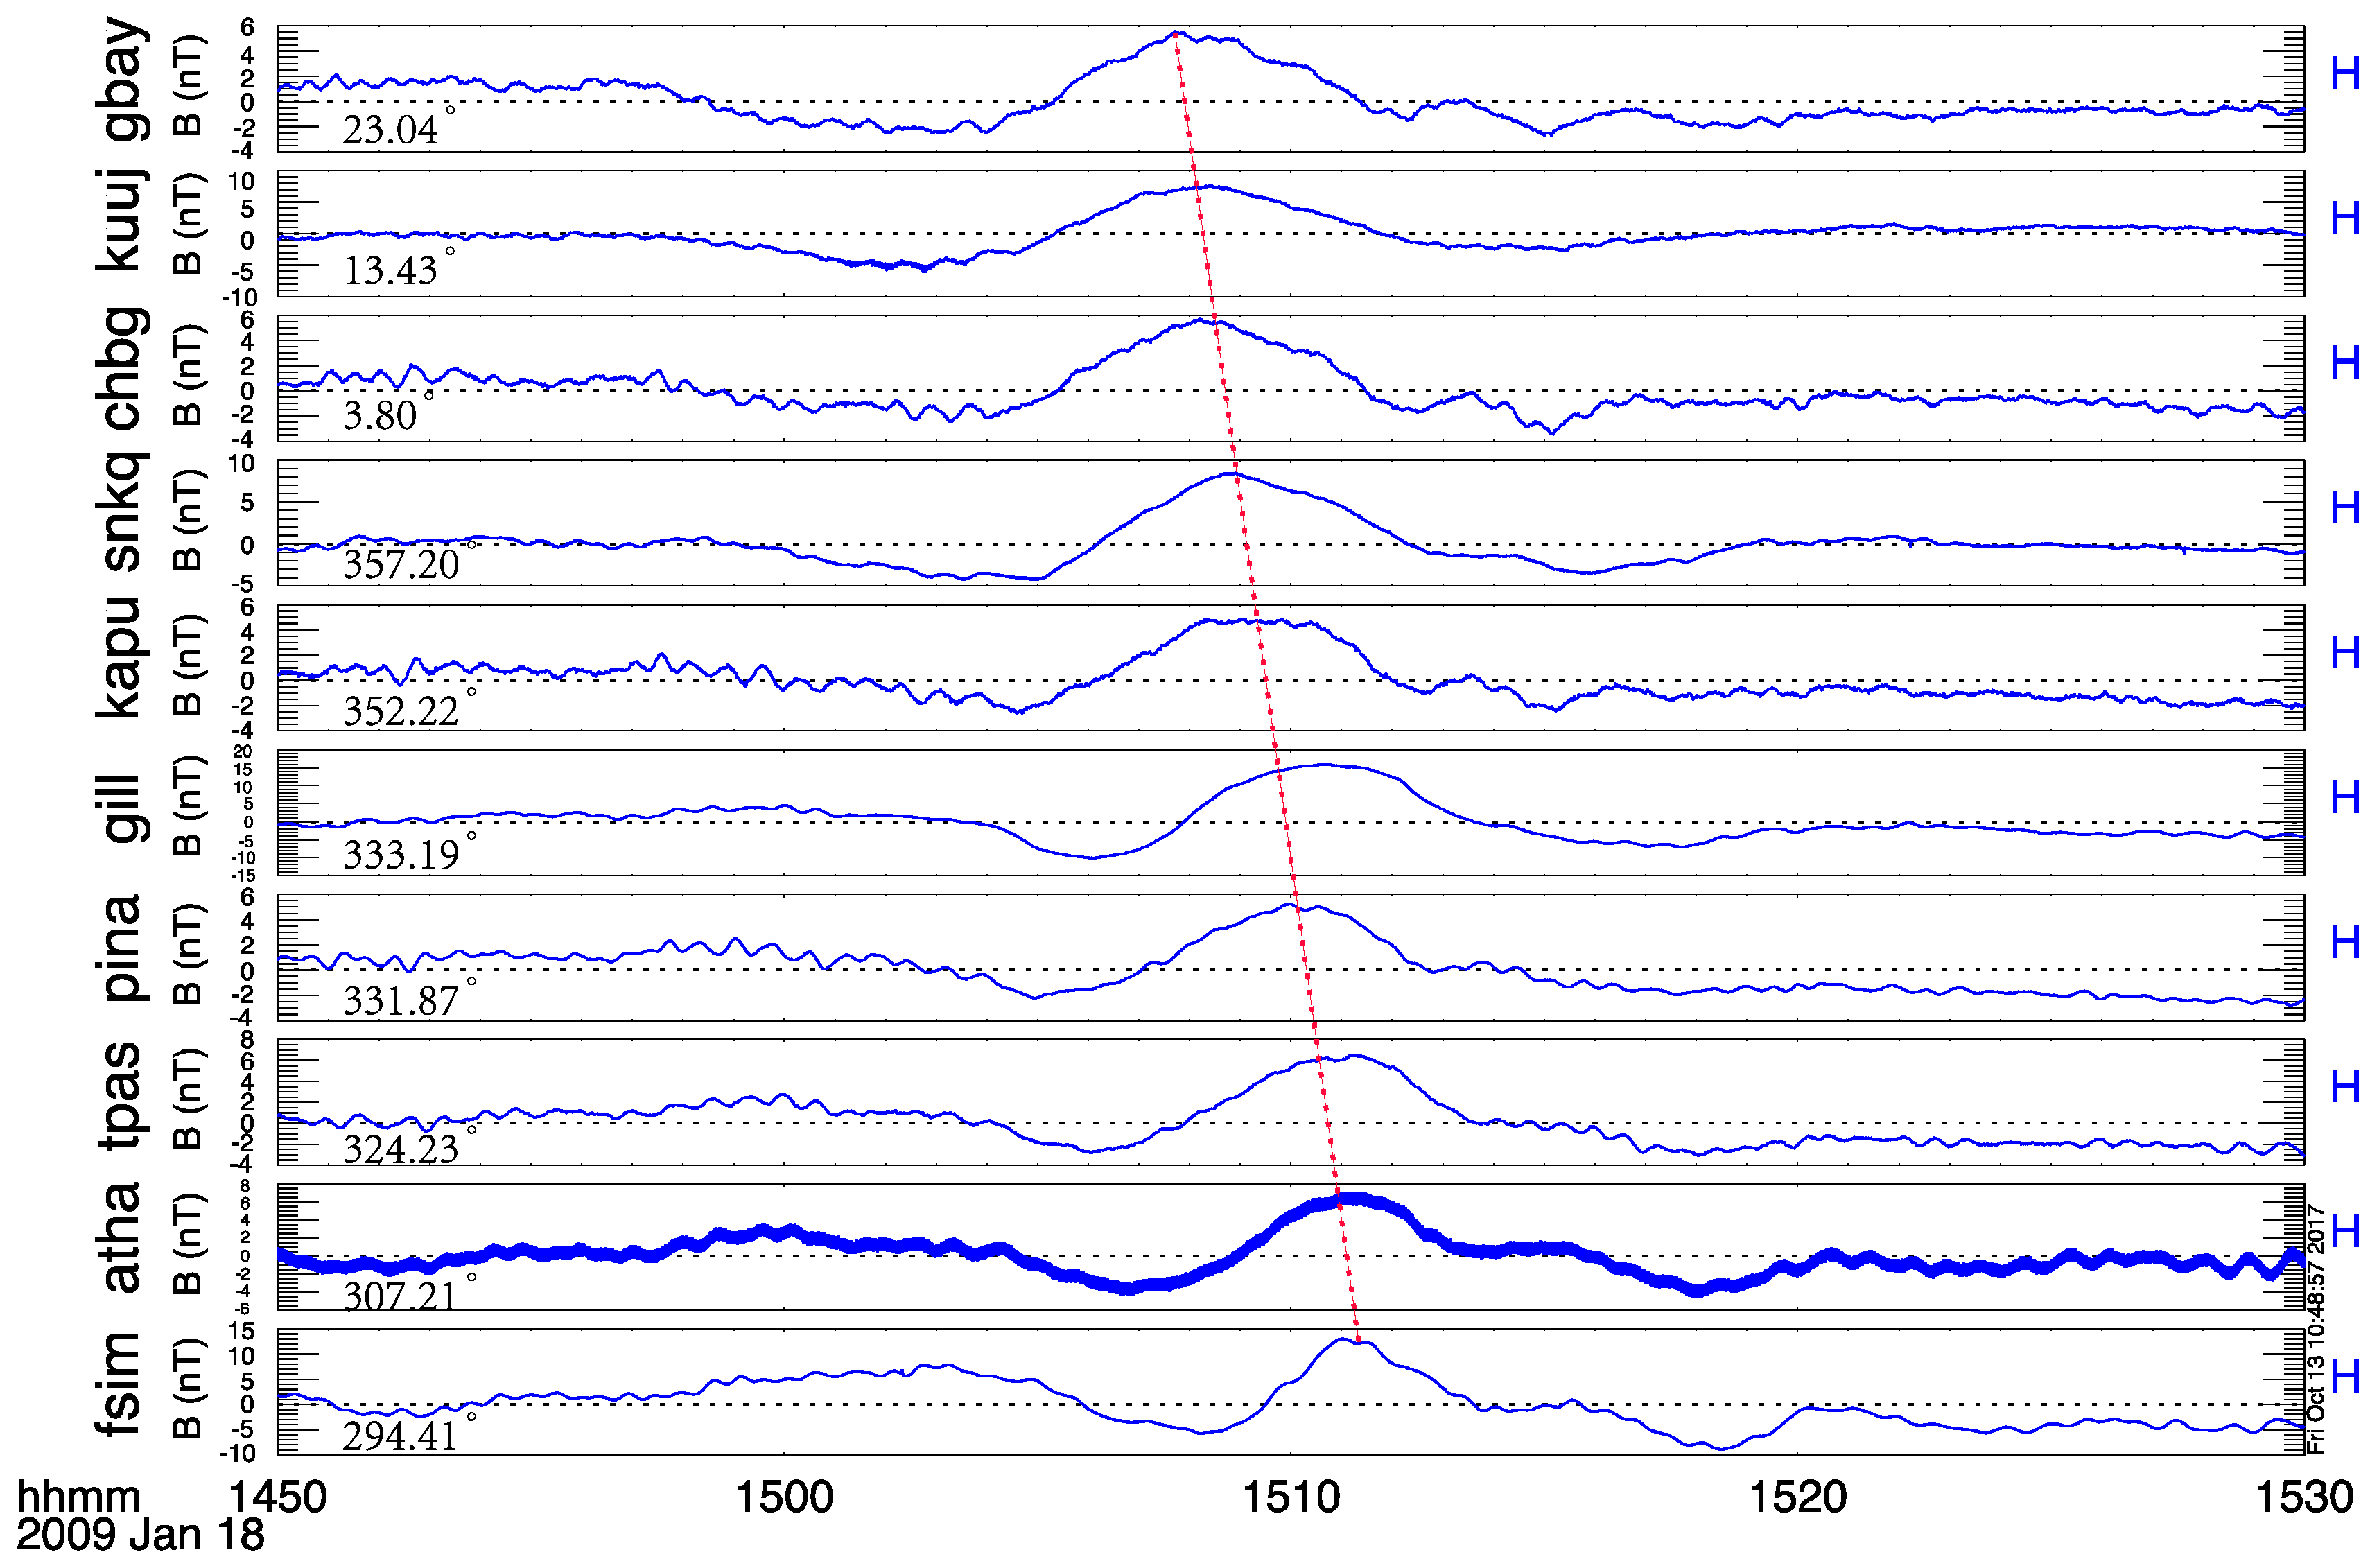
Figure 8 shows the H component of the magnetic field in regions of similar latitude as the THEMIS footprints but different longitudes, where a clear westward propagation signature is observed. These findings indicate that both poleward and westward motions were present in this event, consistent with the magnetospheric response to the solar wind at dawnside.
4. Discussion
This study presents a causal chain demonstrating that black auroras could be generated by field-line resonances (FLRs) triggered by positive solar wind dynamic pressure pulses. Using observations from multiple THEMIS satellites and ground-based magnetometer arrays, we have shown that FLRs could produce downward FACs, which are associated with the auroral luminosity reduction that connects with black auroras. The upward and downward FACs are represented by red and blue regions in
Figure 4 and
Figure 5, respectively, which are derived from ground magnetometer arrays. The evolution of FACs presented in
Figure 4 and
Figure 5 showed clear quasi-periodic oscillations and a characteristic poleward motion.
With limited opportunities for joint observation, we have identified two additional cases of black auroras associated with field-line resonance: one on 2 March 2011, and another on 29 October 1998 (not shown here). These observations suggest that the black auroras generated by field-line resonance after a solar wind dynamic pressure pulse, as described in this paper, is not a coincidence.
Additionally, auroral observations from the INUV all-sky camera near the footprints of the THEMIS satellites have shown a clear reduction of auroral luminosity in lower latitude areas when downward FACs covered the entire north part of the field of view of the INUV station.
Figure 6 shows the progression of the black aurora as a keogram. By analyzing the keogram, we determined that the average poleward speed of the black auroral arc is 1.18 km/s. We also calculated the average poleward speed of the downward FACs (FACs) to be 1.41 km/s, which is slightly higher than the propagation speed of the black auroras. Additionally, we found that the minimum movement speed of the magnetic field H component is about 2.11 km/s, which is greater than the movement speed of both the black auroras and the downward FACs.
Figure 8 illustrates that the westward propagation speed is larger than the poleward movement. This difference in speed may be attributed to the significant longitude gap between the INUV (226.23° E) and FYKN (214.79° E) stations. This event study presents for the first time a complete chain that black auroras could be generated by downward FACs associated with FLRs after a positive solar wind dynamic pressure pulse, which was confirmed by simultaneous multiple space-based and ground-based solar wind, magnetospheric, and ground observations.
Using space-based and ground-based data, we have suggested some explanations that take into account the characteristics of black auroras. A major generation mechanism is the divergent electric field, as proposed by [
7,
8], who found a corresponding relationship between divergent electric fields with black auroras and directly indicated that a downward electric field contributed to generating black auroras. However, there is no direct observation evidence to support this theory. Ref. [
23] proposed that black auroras should drift with ionospheric convection if the downward electric field contributed to the black auroras. Then, [
6] also proposed that FACs are not associated with black auroras because the drift velocity is incompatible with a downward electric field from simultaneous ground-based aurora observations and incoherent scatter radar observations.
The relationship between black aurora and downward FACs has been a topic of research interest for several decades. FACs are a significant link between the magnetosphere and ionosphere, and they play a crucial role in producing the aurora [
24,
25]. Currents flow perpendicular to the mean magnetic field within the lower ionosphere, closing the magnetospheric–ionospheric circuit by connecting the upward and downward FACs. Energy is transmitted from the magnetosphere to the ionosphere and is dissipated through Joule heating, while friction between atmospheric neutrals and ions can enhance energy dissipation in the ionosphere due to auroral particle precipitation. When particles from the magnetosphere precipitate into the ionosphere, they create upward directed FACs that are associated with auroral electrons. These electrons produce inverted-V signatures in the electron differential energy flux [
26,
27]. On the other hand, downward FACs are typically associated with black auroras. Black auroras are a type of aurora that appears as a dark patch against a bright auroral background. Downward FACs are electric currents that flow along the magnetic field-lines towards the Earth’s surface. They are thought to be an important component of the Earth’s magnetosphere–ionosphere coupling and play a significant role in the dynamics of the ionosphere. Several studies have investigated the relationship between black aurora and downward FACs. One of the earliest studies observed black auroras and measured downward FACs using rocket-borne instruments, which proposed that black auroras were associated with downward FACs and suggested that the two phenomena were linked through a current circuit in the ionosphere. And then, the Freja mission discovered an unexpected and fascinating occurrence of very intense (1 V/m) and small-scale electric fields at auroral latitudes between 800 and 1700 km in altitude, which is typically below the bottom of the auroral acceleration region. These fields have unique characteristics different from those observed at higher altitudes within the auroral acceleration region or the ionosphere. The particle, current, and plasma signatures of these intense fields suggest that they are associated with the optical phenomenon of black aurora, often found adjacent to auroral arcs. The first reported event observed by Freja showed two narrow electric field structures of 1 V/m with radially diverging electric fields, and they were related to dropouts of precipitating electrons and a downward field-aligned current [
7]. Subsequent studies have provided further evidence for the relationship between black aurora and downward FACs. For example, ref. [
8] analyzed data from the Freja satellite and found a strong correlation between black aurora and downward FACs in the auroral ionosphere. The authors suggested that black aurora is a manifestation of the reduction of the downward flow of charged particles in the ionosphere. Ref. [
28] used spectral ratios of emissions from a camera employing a filter wheel to show that black aurora is caused by a reduction of high-energy electron precipitation. A theory has been proposed to account for the occurrence of black auroras, suggesting that a coupled ionospheric–magnetospheric generation mechanism is responsible. This mechanism proposes that a downward field-aligned current is carried by cold electrons, which flow out of the topside ionosphere within the black aurora and create the phenomenon in the ionosphere. In this event, we can find that the downward FACs presented in
Figure 4 and
Figure 5 show a clear poleward motion during 1511–1517 UT. In
Figure 6, the auroral luminosity observations indicated that the auroral luminosity reduction during 1512–1516 UT in high latitude areas, which showed that black auroras did drift with the FACs. This fact is consistent with the theory proposed by [
7,
8], which supports that downward FACs contribute to black auroras.
