Abstract
The analysis of the spatiotemporal picture of particle radiation in relativistic heavy-ion collisions in terms of correlation femtoscopy scales, emission, and source functions allows one to probe the character of the evolution of the system created in the collision. Realistic models, such as the integrated hydrokinetic model (iHKM), used in the present work, are able to simulate the entire evolution process of strongly interacting matter produced in high-energy nuclear collisions. The mentioned model describes all the stages of the system’s evolution, including thermalisation and hydrodynamisation, which can help researchers figure out the specific details of the process and better understand the formation mechanisms of certain observables. In the current paper, we investigated the behaviour of the pion and kaon interferometry radii and their connection with emission functions in ultrarelativistic heavy-ion collisions at the Large Hadron Collider within iHKM. We focused on the study of the emission time scales at different energies for both particle species (pions and kaons) aiming to gain deeper insight into relation of these scales and the peculiarities of the mentioned system’s collective expansion and decay with the experimentally observed femtoscopy radii. One of our main interests was the problem of the total system’s lifetime estimation based on the femtoscopy analysis.
1. Introduction
The investigation of the evolution process character of the extremely small, hot, dense, and rapidly expanding systems created in relativistic heavy-ion collisions has always been of great interest to researchers since the first studies of these phenomena started. The comprehensive analysis demonstrates that, soon after the smashing of the two colliding nuclei (each one of them can be initially thought of as a set of nucleons), the strongly coupled quark–gluon system is formed. Being at first non-equilibrium, this system some time later becomes thermalised and continues expanding as a whole liquid-like piece of matter [1,2,3,4]. Its expansion at this stage can be described within a relativistic hydrodynamics approach. As the system expands, it gradually cools down, becomes dedensified, and begins losing equilibrium. Below some temperature or energy density (usually the temperatures close to 150–160 MeV are spoken of), the system disintegrates, and its parts one by one are transformed into sets of hadrons. However, the produced hadrons do not likely become free immediately after the fireball decay. The latter would imply a sudden switching from a near-zero mean free path length to a near-infinity one, which seems hardly feasible. The particles would rather continue interacting intensively and evolving collectively, as single hadronic medium for some time. Therefore, to estimate the overall lifetime of the system created after the collision, one should in theory account for the hadronic phase of the matter evolution and try to find out the time scale (at least approximate), during which the hadronic medium stays connected enough to be considered a unified system.
In the literature, however, there are two different approaches to the stated problem. The first one supposes that, right after the hadronisation (and maybe a very short hadronic stage), the so-called “freeze-out” takes place, so that the chemical composition of the system and, almost simultaneously, the particle momentum spectra are frozen and no longer change, except for decays of resonances. Such an assumption goes back to the pioneering works by Fermi, Pomeranchuk, and Landau [5,6,7] and is typical for thermal models with statistical hadronisation [8,9,10,11,12], hydro-inspired freeze-out parametrisations, e.g., Cracow [13,14], Buda–Lund [15], and blast wave [16,17,18], and hydrodynamics models with statistical hadronisation [19,20,21,22,23,24,25,26,27,28,29,30,31,32]. The latter usually employ the Cooper–Frye formalism [33] or its generalisations [34] to hadronise the system at the freeze-out hypersurface. There are various computer codes, developed for the calculations of statistical hadronisation in different models, e.g., SHARE [35,36], THERMUS [37], used for the extraction of thermodynamic parameters from the fits to the ratios of particle yields, or THERMINATOR [38,39], used as an event generator, producing particles based on the thermodynamic parameter values specified at a certain freeze-out hypersurface.
The second approach suggests the existence of a long “afterburner” stage of the collision (lasting about 5–10 fm/c or until the temperature drops to 80–120 MeV), which plays an important role in the measured observables’ formation. The corresponding theoretical description of heavy-ion collisions in this case is carried out within various hybrid (hydro+cascade) and full evolutionary models, aiming to simulate the entire process of the created system’s evolution, from the initial state formation to the final hadron cascade stage [40,41,42,43,44,45,46,47,48,49,50,51]. The study presented in this paper was carried out in the most-developed complete model—the integrated hydrokinetic model (iHKM)—which includes as one of the stages of the system’s evolution also a description of the process of the thermalisation/hydrodynamisation of initially non-thermal matter [52].
The existing experimental data on spectra do not allow giving a clear preference to one of these approaches and yield the estimates for the kinetic freeze-out temperature in a very wide range (such as 100–140 MeV [29]), depending on the particle species selected for the analysis, momentum cuts, the inclusion/exclusion of resonance decays, and so on. The results on resonance yields and yields’ ratios [53,54,55] speak in favour of the afterburner scenario; the experimental ratio values decrease when one goes from peripheral to central collisions, in contrast with almost flat dependency (keeping close to the measured values for peripheral events) obtained in the models, which do not account for the hadron re-scattering stage of collision (e.g., thermal model, blast wave model). These models also overestimate the measured yield values. A nearly flat dependency on centrality is actually observed in experiments for the ratio, as the ’s decay products almost do not interact with the dense hadronic medium due to a large lifetime of this resonance. The observed suppression of the short-lived yield ratio to kaon yield is likely due to re-scattering of decay products during the afterburner collision stage, and this effect is stronger in central events because of the higher number of produced particles and longer hadronic stage duration in this case. However, the system’s lifetime determined based on these results depends on the cross-sections and reaction channels used in the model for the hadronic stage. The correlation femtoscopy data are also considered as a potential source of information on the duration of the matter collective motion in high-energy A + A collisions. For instance, in the ALICE Collaboration’s experimental analysis [56], the “freeze-out time” value for the TeV Pb + Pb collisions at the LHC is defined from the fit to the measured longitudinal femtoscopy radii dependency on (the result is 10–11 fm/c), but the fitting formula does not account for the strong transverse collective flow that should develop in such collisions.
In our previous papers [57,58,59], a simple method for the estimation of the times of pion and kaon maximal emission, based on the particle spectra and the dependencies of longitudinal femtoscopy radii on the pair transverse mass , was proposed and tested in simulations within the different versions of the (integrated) hydrokinetic model [52,60]. Soon after the first of the mentioned publications, the proposed prescription was used by the ALICE Collaboration in their experimental analysis of kaon femtoscopy for the TeV Pb + Pb collisions at the LHC [61]. It provided estimates for the kinetic freeze-out temperature, MeV, and the maximal emission times, fm/c and fm/c, close to those obtained in our paper [60] (see the details below).
A clear influence of the post-hydrodynamic phase on the soft physics results was also noted in our analysis of different particle number ratios [62,63] at the LHC energies. These studies include a comparison of the values calculated in the full iHKM simulation regime with those obtained in a reduced regime without a hadronic cascade stage and also with the thermal model results [8,9].
According to simulation analysis presented in [64,65], a large fraction (about 60% or even more) of identified resonances at the LHC are produced in the hadronic phase of collision, while primary particles coming from the QGP hadronisation cannot be observed due to rescattering of their decay daughters. By contrast, primary mesons with a lifetime of ≈50 fm/c can be identified without problems, apparently because they decay after the finishing of the intensive hadron rescattering phase (however, the iHKM simulation results in [64] do not exclude that the hadronic stage may lead to an additional increase in the identified number due to the correlation effect). The recent ALICE Collaboration data on the and yield ratios in TeV Pb + Pb collisions at the LHC confirm “the dominance of the rescattering effect in the hadronic phase” [55] for results and its small significance in the case.
All these results seem to support the conception of continuous (rather than sudden) freeze-out and a prolonged afterburner stage. In accordance with this evolution picture, particles possessing different momenta and originating from different sources (primary particles and those leaving the system after elastic/inelastic reactions with the hadronic medium at the afterburner stage of collision) can be expected to radiate from the system at different times.
In the current paper, we tried to investigate the process of pion and kaon emission considered in [57,59] in more detail, clarify the relationship between the extracted emission times and the femtoscopy radii, and if possible, propose a way for the estimation of the full system’s lifetime, including the afterburner stage, based on our analysis of ultrarelativistic heavy-ion collisions within the integrated hydrokinetic model.
2. Research Motivation
In our studies [57,58,59], the transverse momentum spectra and femtoscopy radii for the A + A collisions at the top RHIC and the two LHC energies were fit with simple analytical formulas, containing parameters describing the system’s effective temperature, the strength of the collective flow, and the time of maximal emission for particles of each sort. The fitting formulas were obtained in approximation, suggesting that all the particles with comparably low momenta ( GeV/c) are emitted from the system at the hypersurface of constant proper time , limited in the transverse direction. Of course, the real emission picture for both pion and kaon mesons is much more complicated, so that the extracted maximal emission times correspond only to some effective values, approximately reflecting the time scales when the emission process for a given particle species is the most intensive.
To cross-check the fitting results and to obtain a more-detailed picture of the particle emission process in [57,58,59], we additionally built plots of averaged emission functions in coordinates for particles with small (in accordance with the earlier applied approximation). The figures show that the emission function maximum for pions should be close to the particlisation time for the centre of the expanding system, which is in agreement with the previously obtained fitting result. As for the kaon emission function, it had two apparent maxima (one close to the pionic one and the other lying about 4 fm/c higher), such that the value obtained from the fit was lying between them and could be associated with the “mean” maximal emission time with respect to the two maxima on the plot. The second maximum of the kaon emission function, causing the extracted maximal emission times for kaons to be about 2–3 fm/c larger than those for pions, is likely connected with the decays of resonance (its lifetime is about 4 fm/c), producing an additional noticeable portion of kaons after particlisation of the created fireball.
To investigate the emission process in more detail, we constructed the emission time distributions for both considered particle sorts (see Figure 1 and Figure 2), which can be obtained by integrating the previously analysed emission function histograms over transverse radius . An interesting thing one can notice about these distributions is that most particles of both species seem to be produced in the late, hadronic stage of the collision, so that the total number of pions and kaons emitted close to the hadronisation hypersurface is noticeably smaller than that of mesons radiated later. Near the time of hadronisation in the centre of the system (9–10 fm/c), one can see only local distribution maxima on the presented plots.
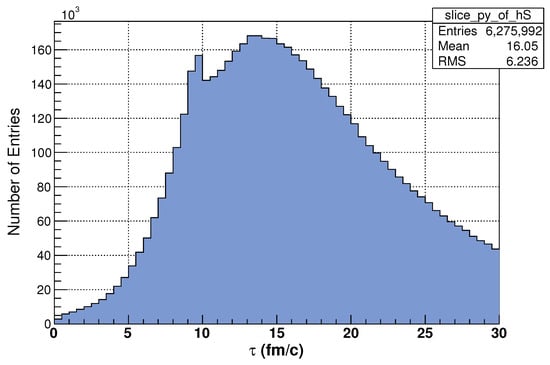
Figure 1.
The time of emission distribution for pions in central Pb + Pb collisions (c = 0–5%) at the LHC energy TeV simulated within iHKM, GeV/c, .

Figure 2.
The same as in Figure 1 for kaons.
The found peculiarity of distributions is in agreement with our previous conclusions about the continuous character of particle spectra freeze-out; however, it is not clear why the extracted values of , obtained from the fits to single-particle spectra and femtoscopy scales, do not reflect the apparent prevalence of the late post-hydrodynamic stage contribution in the total amount of emitted particles, following from the distribution figures.
Another interesting fact about the extracted maximal emission times is that their values are very close for the two considered LHC collision energies, TeV and TeV (the same applies to the times of particlisation of the corresponding systems). At first glance, it seems that, at higher collision energy, the created system should live longer and produce more particles, so that the corresponding times of maximal emission should be larger. Instead, at the two energies in our analysis for the most-central collisions (c = 0–5%), we have comparable for both pions and kaons, fm/c and fm/c at TeV and fm/c (or even fm/c; see [57] for details) and fm/c at TeV. The corresponding temperatures, entering the fitting formulas, are MeV and MeV, respectively.
In Section 4, we try to investigate in detail the above-stated issues.
3. Materials and Methods
As was already mentioned, the analysis of relativistic heavy-ion collisions for this work was carried out based on the results of computer simulations within the integrated hydrokinetic model (iHKM) [52,60,66,67]. The model successfully reproduces the experimental data on bulk hadronic observables (including femtoscopy radii) for the high-energy collisions at the LHC and RHIC [52,58,63,68]. It also allows achieving a good agreement with the data on direct photon production for the two mentioned collider experiments [69,70,71].
One of the most-important distinct features of the iHKM, as compared to other hybrid models used for the simulation of A + A collisions, is the presence of the pre-thermal dynamics description for the strongly interacting matter created as a result of the collision (it is implemented using the energy–momentum transport approach based on the Boltzmann equation in the relaxation time approximation—see the papers [52,66,67] for the details). During the corresponding evolution stage, the system is gradually transformed from an essentially non-equilibrium state it has at the very initial times right after the overlapping of the two colliding nuclei to a nearly equilibrated state, which can be further described in the approximation of relativistic viscous hydrodynamics [72,73]. The initial energy density distribution, serving as a starting point for the pre-thermal stage, is generated with the GLISSANDO code [74]:
Here, the parameter defines the initial energy density in the centre of the system, and the parameter regulates the proportion between the contributions from the binary collision and wounded nucleon models to the in (1). These two parameters are used to adjust the model to the simulation of the concrete collision experiment.
For the initial momentum distribution, we take the anisotropic momentum distribution, inspired by the colour glass condensate effective gluon field theory:
where , , is space–time rapidity, and is the model parameter, describing the initial momentum anisotropy (see [52,66,67] for the details).
The hydrodynamic stage of the matter expansion lasts until the temperature in the system drops to the particlisation value (depending on the equation of state (EoS) utilised for the continuous quark–gluon matter; in the iHKM, we use the Laine–Schroeder [75] and the HotQCD Collaboration [76] EoSs). Below the particlisation temperature, the continuous medium transforms into the system of hadrons, which keeps on expanding, while the hadrons interact intensively with each other, so that numerous particle creation and annihilation processes take place. This post-hydrodynamic stage of the matter evolution is described with the help of the UrQMD hadron cascade model [77,78].
The analytical formulas for spectra and femtoscopy radii fitting in [57,58,59] are obtained from the following considerations.
One assumes that the particlisation occurs at the hypersurface , limited in the direction transverse to the beam axis (), which should be reasonable at least for the particles with not very high momenta ( GeV/c). Accordingly, the Wigner function for soft bosons can be written as follows:
where is the inverse temperature, is the collective four-velocity (here, in the definition, and are longitudinal and transverse rapidities, which correspond to the respective velocities and ), and is the cutoff factor, narrowing the particlisation hypersurface in the transverse direction:
The parameter here describes the collective flow intensity, in such a way that the lower is the value of , the stronger is the flow (in the case of absent flow, ; for more details, see [57,59]).
Given Equation (3) for the Wigner function, one can obtain the approximate formulas for the momentum spectra and correlation functions. Applying the modified Cooper–Frye prescription (it suggests that the overall particlisation hypersurface is built as a set of points , corresponding to the maximal emission of particles with momentum p; see [60] for the details) at the previously defined particlisation hypersurface and using the saddle point method, one arrives at the following expressions for the spectra and the longitudinal femtoscopy radii [79]:
Here, , is the pair mean transverse momentum, is the temperature at the maximal emission hypersurface , is the transverse collective velocity at the saddle point, and
is the squared ratio of the longitudinal homogeneity length to (as usual in femtoscopy studies, the direction coincides with that of the beam axis, corresponds to the pair transverse momentum vector, and is orthogonal to the two others). Equation (6) is valid for the transverse flow of an arbitrary profile and strength; however, it was derived under the assumption of small , corresponding to the top part of the correlation function peak.
According to the method, originally proposed in [57], in order to estimate the values for pions and kaons, one needs to find the values of T and first from the combined fit to the pion and kaon spectra based on Equation (5) and, after that, determine the maximal emission times and from the femtoscopy radii fitting (at already fixed T and ) using Equation (6).
4. Results and Discussion
4.1. Emission Time Distributions
As was already mentioned, the emission time distributions for both pions and kaons, shown in Figure 1 and Figure 2 for the case of TeV Pb + Pb central collisions at the LHC, suggest that a large number of particles leave the system noticeably later than the time of full particlisation, which is about 9–10 fm/c for the considered LHC energies (rather similar plots were obtained for TeV collisions as well). The mean values that can be calculated based on the presented model histograms are 16.05 fm/c and 18.70 fm/c for pions and kaons, respectively, and an interesting question is why these time scales do not match with estimated based on the femtoscopy radii dependencies (i.e., 10.3 fm/c and 12.7 fm/c).
Here, one should consider several different factors that could possibly lead to such a result and try to find which of them played the major role in this situation.
One of the relevant factors could be the non-Gaussian shape of the corresponding particle emission functions and the correlation functions, which are used to determine the femtoscopy radii. In [80], the non-Gaussian character of pion and kaon emission was observed in our studies of the corresponding source functions (which can be defined as time-integrated distributions of distances between the particles forming pairs in femtoscopy analysis), calculated in the HKM (a previous version of the iHKM) for the case of Pb + Pb collisions at the LHC energy TeV. In Figure 3, we demonstrate the projections of the mentioned meson source functions together with the Gaussian fits to them. As one can see, the actual shape of the source functions, especially in the out and long directions, includes noticeable non-Gaussian tails. The effect looks even more pronounced for pions. In our method for the maximal emission time estimation, we fit interferometry radii dependencies on , and as follows from Equation (6), the larger are the values, the larger can be the resulting . The radii are extracted from the Gaussian fits to the correlation functions , which are connected with the source functions through the so-called Koonin integral equation [81]:
where is the integral transform kernel, reflecting the correlation mechanism(s) supposed to exist between the emitted particles, and the asterisk denotes the pair rest frame.
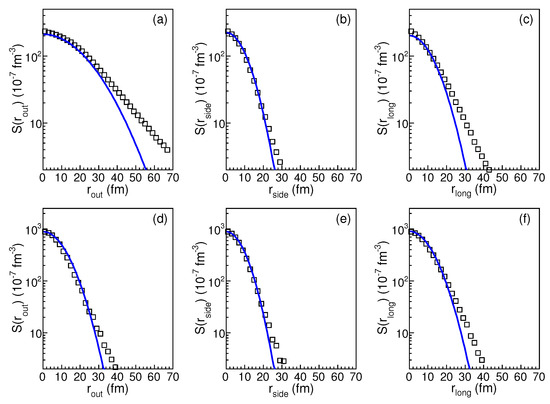
Figure 3.
The source function projections calculated in the iHKM for pions (Panels (a–c)) and kaons (Panels (d–f)) produced in central Pb + Pb collisions at the LHC energy TeV, GeV/c, . Squares represent the model output, and lines show the corresponding Gaussian fits.
Accordingly, the pairs from the non-Gaussian tail of the source function, characterised by the large distances between emitted particles, will not contribute directly to the value of the femtoscopy radius and, eventually, to the value. In such a way, some amount of particles that escape from the system at the late stage of the collision can be missed by the femtoscopy analysis, but still be visible in the overall distribution.
In the correlation function plots, such pairs, containing, e.g., particles coming from the long-lived resonance decays or liberated from the system after a series of elastic/inelastic reactions with other hadrons constituting the expanding hadronic medium (so that the distance between the two particles in the pair can be fairly large), typically form a practically invisible sharp and narrow peak [82], which can reduce the intercept value, determined from the fit to the correlation function, but does not really affect the radii.
In [57], we tried to reduce the effects stemming from the non-Gaussianity of the correlation functions by fitting them in a narrow q range ( GeV/c), which also better corresponds to the assumptions made when deriving Formula (6). As a result, we observed the more-uniform behaviour of the pion and kaon radii, closer to scaling (still broken because of the collective flow and afterburner rescattering effects), with common T and parameters corresponding to the combined pion and kaon spectra fitting; however, only a hardly noticeable increase of the femtoscopy radii (about 4%) could be reached.
The presence of a post-hydrodynamic hadronic cascade stage in the model certainly increases the resulting femtoscopy radii; in our analysis, carried out during the work in the papers [57,83], we found for the case of the LHC TeV Pb + Pb collisions that the switching off of the cascade stage reduced the radii values by 12% for pions and by 25–30% for kaons. However, the maximal emission time extraction we are currently interested in was performed based on the full calculation mode results, i.e., with the hadron cascade turned on, so the above observation can hardly help us solve the stated problem.
A more-thorough analysis of the procedure we applied for the extraction, however, suggests the following possible solution. Although the analytical Formulas (5) and (6), used for the spectra and the femtoscopy radii fitting, were derived under the assumption of isochronous particle emission from the hypersurface fragment with , typical for particles with not very high transverse momenta, the actual data fitting included also the region of comparably high ( GeV/c) and ( GeV/c). This apparently implies that the emission time distributions, actually corresponding to the applied fitting scheme, should as well include particles from a wide momentum region (still not exceeding, however, the region of hydrodynamics approximation applicability). Therefore, in Figure 4 and Figure 5, we show the pion distributions constructed with a momentum cut GeV/c for central Pb + Pb collisions at the LHC energy TeV (analogous distributions for kaons demonstrate a similar tendency as compared to the previous Figure 2). In Figure 5, an additional constraint, fm, was applied.

Figure 4.
The same as in Figure 1, but for a wide region, GeV/c.

Figure 5.
The same as in Figure 4, but with the constraint fm.
As one can see, the presented histograms correspond much better to the estimates we previously obtained from the spectra and radii fitting, so that the distribution maxima are close to the full particlisation time (≈10 fm/c), the tails corresponding to the hadronic phase look much smaller and do not dominate in the overall distributions, and the mean emission time values are 12.5 fm/c and 10.4 fm/c for the -unconstrained and -constrained cases, respectively.
The obtained wide-momentum-range distributions seem to be more relevant for characterising the emission process from the system as a whole. However, what about the low-momentum distributions shown before in Figure 1 and Figure 2 and depicting a quite rich and prolonged hadronic stage of the matter evolution? Could we use these distributions to obtain estimates of the afterburner phase duration, corresponding to the “maximal emission times”, but now determined based on low-momentum spectra and radii? In principle, such an estimate would be in agreement with the modified Cooper–Frye prescription [60], used in [57,59] for the derivation of Formulas (5) and (6) and suggesting that the particles with different momenta p should be emitted from separate pieces of the complex hadronisation hypersurface, composed as a united set of all such fragments.
Therefore, to test such an approach, we used the described method for the estimation, but applying the low-momentum cuts on and . The combined and K spectra fitting was performed for the range GeV/c and gave the values MeV, , , which were then fixed at the fitting. The latter was performed for GeV/c and resulted in the maximal emission time values fm/c and fm/c.
Comparing these times with Figure 1 and Figure 2, one can see that the new values correspond to the maxima of the shown low-momentum emission time distributions and can be possibly interpreted as evidence of a prolonged afterburner stage and used as “upper-limit” estimates for the overall system’s lifetime (in the sense that they are defined based on low-momentum data and particles with low are expected to leave the system later than those with high ). The new value for kaons is also in agreement with the emission picture presented in Figure 2 of our paper [64], which implies that active production at the hadronic stage of collision lasts until ≈15–20 fm/c, while resonance decays serve as an extra source of kaons (see also Figure 6 of this article).

Figure 6.
Emission functions constructed in the iHKM for pairs, coming from decays [64], in two regimes: (a) free streaming of hadrons created at the particlisation stage (plus those coming from resonance decays), and (b) full iHKM calculation including UrQMD cascade as the final afterburner stage. The graphs correspond to the LHC Pb + Pb collisions at TeV, c = 5–10%; the transverse momentum and rapidity ranges are GeV/c and , respectively.
4.2. Particlisation Times at Different Collision Energies
In the previous subsection, we focused on the particle emission picture including long and intensive emission from the hadronic stage of collision and on the estimation of the effective time scales characterising the emission duration. However, a detailed analysis of this problem cannot bypass the question of the hydrodynamic stage duration, defining the moment, when one should switch from the description of the system’s evolution in terms of a continuous medium to the description in terms of particles.
Conventionally, one assumes that the system’s hadronisation takes place at some critical temperature or energy density (whose concrete values depend on the applied equation of state for quark–gluon matter). As was mentioned, in the iHKM, we use two such equations of state, namely the Laine–Schroeder [75] EoS and the HotQCD Collaboration [76] one. The former is associated with the particlisation temperature MeV and the corresponding energy density GeV/fm, while for the latter, the values MeV and GeV/fm are taken. The stated switching criterion implies that the particlisation process is not isochronous for different parts of the system, but starts quite early at the periphery and gradually reaches the centre. Thus, the system can be considered fully hadronised when the hadronisation has completed in its centre.
As we already remarked in the Introduction, an interesting fact about the particlisation times in ultrarelativistic heavy-ion collisions at the top RHIC and the LHC energies is that, in the iHKM, they are very close to each other (about 8–10 fm/c), despite great differences in the collision energies (and, apparently, the corresponding initial energy densities). This feature is also reflected in the close maximal emission times obtained for pions in our studies related to the corresponding collision experiments [57,58,59].
To examine this issue, we built plots of the time evolution for the energy density in the centre of hydrodynamic grid within iHKM (see Figure 7 and Figure 8) in the case of the LHC Pb + Pb collisions at the two energies, TeV and TeV. The Laine–Schroeder EoS was used in the simulations for both energies with the critical energy density GeV/fm. For comparison, we also placed the curves corresponding to the ideal relativistic hydrodynamics three-dimensional Gubser solution [84]:
and the Bjorken solution for purely longitudinal expansion, in the presented figures. The initial maximal values for the Gubser and the Bjorken flows correspond to those in the iHKM. Furthermore, in the Gubser flow case, the parameter q value, fm, defining the transverse width of the energy density profile was chosen based on the fit to the initial iHKM profile.

Figure 7.
The energy density at the centre of the system depending on proper time . The iHKM curves for the two LHC energies, TeV and TeV, together with the 3D Gubser solutions (9) of the relativistic hydrodynamics equations. The parameter q value, fm, is defined from the Gubser fit to the initial iHKM profiles; the initial values correspond to the iHKM ones.

Figure 8.
The same as in Figure 7, but 1D Bjorken solutions, , are shown for comparison with the iHKM curves.
From the comparison with the 1D Bjorken flow case (see Figure 8), one can conclude that the presence of strong transverse flow along with the longitudinal one is an important factor leading to the observed small difference in the particlisation times for the two collision energies (about 9.2 fm/c and 9.8 fm/c for the iHKM in the shown figure), defined as the moments when the respective energy densities drop to GeV/fm. Indeed, we see that, at the times after 3 fm/c, the Bjorken expansion is much slower than in the iHKM, the ratio between the two (about 1.5) does not change with time, so that the respective particlisation times (about 26 fm/c and 36 fm/c) are much higher than in our model, the ratio between these times, , is about 1.35, and therefore, the difference between them is quite large (about 10 fm/c).
The Gubser flow, accounting for the transverse matter expansion, results in an behaviour more similar to the iHKM curves at fm/c and particlisation times much closer to those from the iHKM (about 6.7 fm/c and 7.3 fm/c), also with a small difference between the two values. The analysis of the particlisation time dependency on the initial energy density in the iHKM shows that, for the considered RHIC and LHC energy range in central collisions at a fixed EoS and initial time , the in the iHKM grows slowly with , approximately as , where s is close to 7. In our opinion, such a behaviour can be explained by the intensive 3D expansion of the system, which takes place at large in high-energy A + A collisions and leads to a fast subsequent decay of the created fireball. The suggestion about the breakdown of the hydrodynamic description as a result of the intensive 3D expansion of the systemsformed in high-energy hadron collisions was made already in 1953 by Landau in his pioneering paper concerning the hydrodynamic approach in high-energy physics [7].
The energy density behaviour, somewhat similar to that shown in Figure 7 and Figure 8, can be also observed in the following non-relativistic analytical solution of both ideal hydrodynamics and Boltzmann equations (see, e.g., [85,86]). The corresponding distribution function can be written as
where N is total particle number, m is the particle mass, is the initial Gaussian radius of the system, and is the initial temperature.
Given the distribution function (10), one easily finds the corresponding dependency of the energy density at on time:
where A is a constant.
In Figure 9, we present the illustration corresponding to the solution (11). The black line corresponds to a higher initial energy density, regulated by the parameter, which in this case has the value MeV. For the blue line, MeV, and the initial energy density is about two-times lower than for the black line. In both cases, the Gaussian radius of the initial fireball is fm, and the mass of the particles in the gas is GeV/. The black curve in the figure is shifted 1 fm/c left, so that, after fm/c, we have the same energy density for both evolving systems. Therefore, similar to Figure 7 and Figure 8, the same “particlisation” conditions are reached at nearly the same expansion times for the systems with the two different initial energy densities/temperatures, when the system’s expansion becomes essentially three-dimensional.
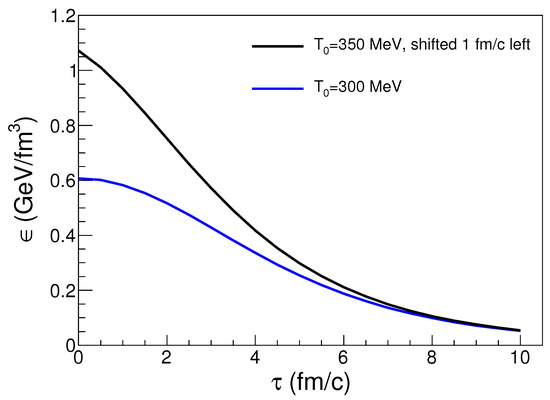
Figure 9.
The energy density at the centre of the system dependencies on time in non-relativistic hydrodynamics and the Boltzmann equations’ solution (11) with the two different initial values reaching the value GeV/fm almost simultaneously (see the text for the details).
Although we consider the presented results quite interesting and worth attention in the context of heavy-ion collision studies, of course, there are certain aspects of the investigated phenomena left outside the scope of our research, so that additional analysis combined with further improvement of the utilised approaches should bring an even more-comprehensive and -detailed understanding of the collision dynamics. In particular, so far, we did not address the issue of light nuclei, molecules, and other loosely bound objects’ production in A + A collisions, while the corresponding observables were actively analysed in recent experimental and theoretical studies. In our study of the resonance production for TeV LHC Pb + Pb collisions, we obtained underestimated values of the ratio in peripheral events. This problem could be re-analysed in more detail, and the corresponding calculations for the TeV case could be carried out. Other possible ways of extending our analysis could be accounting for high- phenomena (like jets), consideration of the physics outside the midrapidity region, and adjusting the model for the description of planned ultra-high- and intermediate-energy (corresponding to the Beam Energy Scan program) experiments. The viscous hydrodynamics part of our model can be additionally improved by the implementation of the bulk viscosity and heat conductivity effects, as well as switching from boost-invariant to full-(3 + 1)D simulations.
5. Conclusions
We considered the two paradoxical femtoscopic observations in ultrarelativistic heavy-ion collisions. The first one is the closeness of the observed maximal emission times at the quite different collision energies. It can be explained by the intensive 3D (!) expansion of the system, which leads, starting from some time, to a fast decay of the formed continuous medium for a wide range of high collision energies. Therefore, all the corresponding systems reach the decay energy almost simultaneously.
Another paradoxical effect is that, despite the sufficient duration of the post-hydrodynamic/afterburner cascade stage, the observed times of the maximal emission are close to the particlisation times. The key to the answer lies in different pictures of particle radiation in the narrow soft range and in a more wide one, typical for the femtoscopy analysis. For the latter, the times of maximal emission extracted from the corresponding fits nearly coincide with the particlisation times. For the former, the times are significantly larger and reflect the duration of the afterburner stage at this momentum interval.
Author Contributions
Conceptualisation, Y.S.; data curation, M.A. and V.S.; funding acquisition, Y.S.; investigation, M.A. and V.S.; methodology, Y.S.; project administration, Y.S.; supervision, Y.S.; visualisation, M.A. and V.S.; writing, original draft, V.S. All authors have read and agreed to the published version of the manuscript.
Funding
The research was carried out within the NAS of the Ukraine Targeted Research Program “Collaboration in advanced international projects on high-energy physics and nuclear physics”, Agreement No. 7/2023 between the NAS of Ukraine and BITP of the NAS of Ukraine. The work was also supported by a grant from the Simons Foundation (Grant Number 1039151, Y.S., V.S., and M.A.). The author Yu.S. is supported by the Excellence Initiative Research University grant of the Warsaw University of Technology.
Data Availability Statement
All the necessary data are presented in the tables and figures within the article. The model results demonstrated in the graphs can also be obtained from the authors in tabular form.
Acknowledgments
Y.S. is grateful to J. Schukraft, J. Stachel, P. Braun-Munzinger, and A. Dainese for stimulating and fruitful discussions. Y.S. is also grateful to the ExtreMe Matter Institute (EMMI) at GSI in Darmstadt, where he was affiliated at the beginning of the work on the current paper, and to Hanna Zbroszczyk for her invitation to continue these studies in Warsaw University of Technology (WUT) as the Visiting Professor.
Conflicts of Interest
The authors declare no conflict of interest. The funders had no role in the design of the study; in the collection, analyses, or interpretation of the data; in the writing of the manuscript; nor in the decision to publish the results.
References
- Adams, J. et al. [STAR Collaboration] Experimental and Theoretical Challenges in the Search for the Quark Gluon Plasma: The STAR Collaboration’s Critical Assessment of the Evidence from RHIC Collisions. Nucl. Phys. A 2005, 757, 102–183. [Google Scholar] [CrossRef]
- Adcox, K. et al. [PHENIX Collaboration] Formation of dense partonic matter in relativistic nucleus-nucleus collisions at RHIC: Experimental evaluation by the PHENIX collaboration. Nucl. Phys. A 2005, 757, 184–283. [Google Scholar] [CrossRef]
- Back, B.B. et al. [PHOBOS Collaboration] The PHOBOS Perspective on Discoveries at RHIC. Nucl. Phys. A 2005, 757, 28–101. [Google Scholar] [CrossRef]
- Arsene, I. et al. [BRAHMS Collaboration] Quark Gluon Plasma and Color Glass Condensate at RHIC? The perspective from the BRAHMS experiment. Nucl. Phys. A 2005, 757, 1–27. [Google Scholar] [CrossRef]
- Fermi, E. High Energy Nuclear Events. Prog. Theor. Phys. 1950, 5, 570–583. [Google Scholar] [CrossRef]
- Pomeranchuk, I.Y. On the theory of multiple particle production in a single collision. Dokl. Akad. Nauk SSSR 1951, 78, 889–891. [Google Scholar]
- Landau, L.D. On the multiple production of particles in high energy collisions. Izv. Akad. Nauk SSSR 1953, 17, 51–64. [Google Scholar]
- Andronic, A.; Braun-Munzinger, P.; Redlich, K.; Stachel, J. The thermal model on the verge of the ultimate test: Particle production in Pb-Pb collisions at the LHC. J. Phys. G Nucl. Part. Phys. 2011, 38, 124081. [Google Scholar] [CrossRef]
- Stachel, J.; Andronic, A.; Braun-Munzinger, P.; Redlich, K. Confronting LHC data with the statistical hadronization model. J. Phys. Conf. Ser. 2014, 509, 012019. [Google Scholar] [CrossRef]
- Braun-Munzinger, P.; Koch, V.; Schaefer, T.; Stachel, J. Properties of hot and dense matter from relativistic heavy ion collisions. Phys. Rep. 2016, 621, 76–126. [Google Scholar] [CrossRef]
- Andronic, A.; Braun-Munzinger, P.; Redlich, K.; Stachel, J. Decoding the phase structure of QCD via particle production at high energy. Nature 2018, 561, 321–330. [Google Scholar] [CrossRef] [PubMed]
- Andronic, A.; Braun-Munzinger, P.; Friman, B.; Lo, P.M.; Redlich, K.; Stachel, J. The thermal proton yield anomaly in Pb-Pb collisions at the LHC and its resolution. Phys. Lett. B 2019, 792, 304–309. [Google Scholar] [CrossRef]
- Florkowski, W.; Broniowski, W.; Michalec, M. Thermal analysis of particle ratios and pT spectra at RHIC. Acta Phys. Pol. B 2002, 33, 761–769. [Google Scholar]
- Broniowski, W.; Florkowski, W. Description of the RHIC pT-spectra in a thermal model with expansion. Phys. Rev. Lett. 2001, 87, 272302. [Google Scholar] [CrossRef] [PubMed]
- Csorgo, T.; Lorstad, B. Bose-Einstein Correlations for Three-Dimensionally Expanding, Cylindrically Symmetric, Finite Systems. Phys. Rev. C 1996, 54, 1390–1403. [Google Scholar] [CrossRef]
- Schnedermann, E.; Sollfrank, J.; Heinz, U.W. Thermal phenomenology of hadrons from 200 AGeV S+S collisions. Phys. Rev. C 1993, 48, 2462–2475. [Google Scholar] [CrossRef]
- Retiere, F.; Lisa, M.A. Observable implications of geometrical and dynamical aspects of freeze-out in heavy ion collisions. Phys. Rev. C 2004, 70, 044907. [Google Scholar] [CrossRef]
- Kisiel, A.; Florkowski, W.; Broniowski, W.; Pluta, J. Femtoscopy in hydro-inspired models with resonances. Phys. Rev. C 2006, 73, 064902. [Google Scholar] [CrossRef]
- Chojnacki, M.; Florkowski, W.; Broniowski, W.; Kisiel, A. Soft heavy-ion physics from hydrodynamics with statistical hadronization—Predictions for the Large Hadron Collider. Phys. Rev. C 2008, 78, 014905. [Google Scholar] [CrossRef]
- Bozek, P.; Wyskiel, I. Rapid hydrodynamic expansion in relativistic heavy-ion collisions. Phys. Rev. C 2009, 79, 044916. [Google Scholar] [CrossRef]
- Ollitrault, J.-Y. Anisotropy as a signature of transverse collective flow. Phys. Rev. D 1992, 46, 229. [Google Scholar] [CrossRef]
- Teaney, D.; Shuryak, E.V. Unusual space-time evolution for heavy-ion collisions at high energies due to the QCD phase transition. Phys. Rev. Lett. 1999, 83, 4951. [Google Scholar] [CrossRef]
- Kolb, P.F.; Sollfrank, J.; Heinz, U. Anisotropic transverse flow and the quark-hadron phase transition. Phys. Rev. C 2000, 62, 054909. [Google Scholar] [CrossRef]
- Ornik, U.; Pluemer, M.; Schlei, B.R.; Strottman, D.; Weiner, R.M. Hydrodynamical analysis of symmetric nucleus-nucleus collisions near 200A GeV. Phys. Rev. C 1996, 54, 1381. [Google Scholar] [CrossRef] [PubMed]
- Sollfrank, J.; Huovinen, P.; Kataja, M.; Ruuskanen, P.V.; Prakash, M.; Venugopalan, R. Hydrodynamical description of 200A GeV/c S+Au collisions: Hadron and electromagnetic spectra. Phys. Rev. C 1997, 55, 392. [Google Scholar] [CrossRef]
- Hung, C.M.; Shuryak, E.V. Equation of State, Radial Flow and Freeze-out in High Energy Heavy Ion Collisions. Phys. Rev. C 1998, 57, 1891. [Google Scholar] [CrossRef]
- Morita, K.; Muroya, S.; Nakamura, H.; Nonaka, C. Numerical analysis of a two-pion correlation function based on a hydrodynamical model. Phys. Rev. C 2000, 61, 034904. [Google Scholar] [CrossRef]
- Hirano, T. Is early thermalization achieved only near midrapidity in Au+Au collisions at = 130 GeV? Phys. Rev. C 2001, 65, 011901. [Google Scholar] [CrossRef]
- Hirano, T.; Tsuda, K. Collective flow and two-pion correlations from a relativistic hydrodynamic model with early chemical freeze out. Phys. Rev. C 2002, 66, 054905. [Google Scholar] [CrossRef]
- Shen, C.; Heinz, U.W.; Huovinen, P.; Song, H. Systematic parameter study of hadron spectra and elliptic flow from viscous hydrodynamic simulations of Au+Au collisions at = 200 GeV. Phys. Rev. C 2010, 82, 054904. [Google Scholar] [CrossRef]
- Bozek, P. Flow and interferometry in 3+1 dimensional viscous hydrodynamics. Phys. Rev. C 2012, 85, 034901. [Google Scholar] [CrossRef]
- Kisiel, A.; Galazyn, M.; Bozek, P. Pion, kaon, and proton femtoscopy in Pb–Pb collisions at = 2.76 TeV modeled in 3+1D hydrodynamics. Phys. Rev. C 2014, 90, 064914. [Google Scholar] [CrossRef]
- Cooper, F.; Frye, G. Single-particle distribution in the hydrodynamic and statistical thermodynamic models of multiparticle production. Phys. Rev. D 1974, 10, 186. [Google Scholar] [CrossRef]
- Molnar, D.; Wolff, Z. Self-consistent conversion of a viscous fluid to particles. Phys. Rev. C 2017, 95, 024903. [Google Scholar] [CrossRef]
- Torrieri, G.; Steinke, S.; Broniowski, W.; Florkowski, W.; Letessier, J.; Rafelski, J. SHARE: Statistical Hadronization with Resonances. Comput. Phys. Commun. 2005, 167, 229–251. [Google Scholar] [CrossRef]
- Torrieri, G.; Jeon, S.; Letessier, J.; Rafelski, J. SHAREv2: Fluctuations and a comprehensive treatment of decay feed-down. Comput. Phys. Commun. 2006, 175, 635–649. [Google Scholar] [CrossRef][Green Version]
- Wheaton, S.; Cleymans, J.; Hauer, M. THERMUS—A Thermal Model Package for ROOT. Comput. Phys. Commun. 2009, 180, 84–106. [Google Scholar] [CrossRef]
- Kisiel, A.; Taluc, T.; Broniowski, W.; Florkowski, W. Therminator: Thermal heavy-Ion generator. Comput. Phys. Commun. 2006, 174, 669–687. [Google Scholar] [CrossRef]
- Chojnacki, M.; Kisiel, A.; Florkowski, W.; Broniowski, W. THERMINATOR 2: THERMal heavy IoN generATOR 2. Comput. Phys. Commun. 2012, 183, 746–773. [Google Scholar] [CrossRef]
- Nonaka, C.; Bass, S.A. Space-time evolution of bulk QCD matter. Phys. Rev. C 2007, 75, 014902. [Google Scholar] [CrossRef]
- Hirano, T.; Heinz, U.W.; Kharzeev, D.; Lacey, R.; Nara, Y. Mass ordering of differential elliptic flow and its violation for ϕ mesons. Phys. Rev. C 2008, 77, 044909. [Google Scholar] [CrossRef]
- Pratt, S.; Vredevoogd, J. Femtoscopy in Relativistic Heavy Ion Collisions and its Relation to Bulk Properties of QCD Matter. Phys. Rev. C 2008, 78, 054906, Erratum in Phys. Rev. C 2009, 79, 069901. [Google Scholar] [CrossRef]
- Petersen, H.; Steinheimer, J.; Burau, G.; Bleicher, M.; Stoecker, H. Fully integrated transport approach to heavy ion reactions with an intermediate hydrodynamic stage. Phys. Rev. C 2008, 78, 044901. [Google Scholar] [CrossRef]
- Petersen, H. Identified particle spectra and anisotropic flow in an event-by-event hybrid approach in Pb+Pb collisions at = 2.76 TeV. Phys. Rev. C 2011, 84, 034912. [Google Scholar] [CrossRef]
- Werner, K.; Karpenko, I.; Pierog, T. “Ridge” in Proton-Proton Scattering at 7 TeV. Phys. Rev. Lett. 2011, 106, 122004. [Google Scholar] [CrossRef] [PubMed]
- Song, H.; Bass, S.A.; Heinz, U. Elliptic flow in = 200 GeV Au+Au collisions and = 2.76 TeV Pb+Pb collisions: Insights from viscous hydrodynamics+hadron cascade hybrid model. Phys. Rev. C 2011, 83, 054912, Erratum in Phys. Rev. C 2013, 87, 019902. [Google Scholar] [CrossRef]
- Giacalone, G.; Noronha-Hostler, J.; Luzum, M.; Ollitrault, J.-Y. Hydrodynamic predictions for 5.44 TeV Xe+Xe collisions. Phys. Rev. C 2018, 97, 034904. [Google Scholar] [CrossRef]
- Giacalone, G.; Noronha-Hostler, J.; Luzum, M.; Ollitrault, J.-Y. Confronting hydrodynamic predictions with Xe-Xe data. Nucl. Phys. A 2019, 982, 371–374. [Google Scholar] [CrossRef]
- Zhao, W.; Xu, H.J.; Song, H. Collective flow in 2.76 and 5.02 A TeV Pb+Pb collisions. Eur. Phys. J. C 2017, 77, 645. [Google Scholar] [CrossRef]
- Bhalerao, R.S.; Jaiswal, A.; Pal, S. Collective flow in event-by-event partonic transport plus hydrodynamics hybrid approach. Phys. Rev. C 2015, 92, 014903. [Google Scholar] [CrossRef]
- McDonald, S.; Shen, C.; Fillion-Gourdeau, F.; Jeon, S.; Gale, C. Hydrodynamic predictions for Pb+Pb collisions at 5.02 TeV. Phys. Rev. C 2017, 95, 064913. [Google Scholar] [CrossRef]
- Naboka, V.Y.; Karpenko, I.A.; Sinyukov, Y.M. Thermalization, evolution, and observables at energies available at the CERN Large Hadron Collider in an integrated hydrokinetic model of A+A collisions. Phys. Rev. C 2016, 93, 024902. [Google Scholar] [CrossRef]
- Adams, J. et al. [STAR Collaboration] K(892)* Resonance Production in Au+Au and p+p Collisions at = 200 GeV at RHIC. Phys. Rev. C 2005, 71, 064902. [Google Scholar] [CrossRef]
- Abelev, B.B. et al. [ALICE Collaboration] K*(892)0 and Φ(1020) production in Pb-Pb collisions at = 2.76 TeV. Phys. Rev. C 2015, 91, 024609. [Google Scholar] [CrossRef]
- Acharya, S. et al. [ALICE Collaboration] Production of K*(892)0 and ϕ(1020) in pp and Pb–Pb collisions at = 5.02 TeV. Phys. Rev. C 2022, 106, 034907. [Google Scholar] [CrossRef]
- Aamodt, K. et al. [ALICE Collaboration] Two-pion Bose–Einstein correlations in central Pb–Pb collisions at = 2.76 TeV. Phys. Lett. B 2011, 696, 328–337. [Google Scholar] [CrossRef]
- Sinyukov, Y.M.; Shapoval, V.M.; Naboka, V.Y. On mT dependence of femtoscopy scales for meson and baryon pairs. Nucl. Phys. A 2016, 946, 227–239. [Google Scholar] [CrossRef]
- Adzhymambetov, M.D.; Shapoval, V.M.; Sinyukov, Y.M. Description of bulk observables in Au+Au collisions at top RHIC energy in the integrated hydrokinetic model. Nucl. Phys. A 2019, 987, 321–336. [Google Scholar] [CrossRef]
- Shapoval, V.M.; Sinyukov, Y.M. Kaon and pion maximal emission times extraction from the femtoscopy analysis of 5.02A TeV LHC collisions within the integrated hydrokinetic model. Nucl. Phys. A 2021, 1016, 122322. [Google Scholar] [CrossRef]
- Akkelin, S.V.; Hama, Y.; Karpenko, I.A.; Sinyukov, Y.M. Hydro-kinetic approach to relativistic heavy ion collisions. Phys. Rev. C 2008, 78, 034906. [Google Scholar] [CrossRef]
- Acharya, S. et al. [ALICE Collaboration] Kaon femtoscopy in Pb-Pb collisions at = 2.76 TeV. Phys. Rev. C 2017, 96, 064613. [Google Scholar] [CrossRef]
- Sinyukov, Y.M.; Shapoval, V.M. Particle production at energies available at the CERN Large Hadron Collider within evolutionary model. Phys. Rev. C 2018, 97, 064901. [Google Scholar] [CrossRef]
- Shapoval, V.M.; Sinyukov, Y.M. Bulk observables in Pb+Pb collisions at = 5.02 TeV at the CERN Large Hadron Collider within the integrated hydrokinetic model. Phys. Rev. C 2019, 100, 044905. [Google Scholar] [CrossRef]
- Shapoval, V.M.; Braun-Munzinger, P.; Sinyukov, Y.M. K*(892) and ϕ(1020) production and their decay into the hadronic medium at the Large Hadron Collider. Nucl. Phys. A 2017, 968, 391–402. [Google Scholar] [CrossRef][Green Version]
- Ilner, A.; Blair, J.; Cabrera, D.; Markert, C.; Bratkovskaya, E. Probing hot and dense nuclear matter with K*, vector mesons. Phys. Rev. C 2019, 99, 024914. [Google Scholar] [CrossRef]
- Naboka, V.Y.; Akkelin, S.V.; Karpenko, I.A.; Sinyukov, Y.M. Initialization of hydrodynamics in relativistic heavy ion collisions with an energy-momentum transport model. Phys. Rev. C 2015, 91, 014906. [Google Scholar] [CrossRef]
- Shapoval, V.M.; Adzhymambetov, M.D.; Sinyukov, Y.M. Femtoscopy scales and particle production in the relativistic heavy ion collisions from Au+Au at 200 AGeV to Xe+Xe at 5.44 ATeV within the integrated hydrokinetic model. Eur. Phys. J. A 2020, 56, 260. [Google Scholar] [CrossRef]
- Sinyukov, Y.; Adzhymambetov, M.; Shapoval, V. Particle Production in Xe+Xe Collisions at the LHC within the Integrated Hydrokinetic Model. Particles 2020, 3, 114–122. [Google Scholar] [CrossRef]
- Naboka, V.Y.; Sinyukov, Y.M.; Zinovjev, G.M. Direct-photon spectrum and elliptic flow produced from Pb+Pb collisions at = 2.76 TeV at the CERN Large Hadron Collider within an integrated hydrokinetic model. Phys. Rev. C 2018, 97, 054907. [Google Scholar] [CrossRef]
- Naboka, V.Y.; Sinyukov, Y.M.; Zinovjev, G.M. Photon spectra and anisotropic flow in heavy ion collisions at the top RHIC energy within the integrated hydrokinetic model with photon hadronization emission. Nucl. Phys. A 2020, 1000, 121843. [Google Scholar] [CrossRef]
- Sinyukov, Y.; Shapoval, V. Direct Photon Production in High-Energy Heavy Ion Collisions within the Integrated Hydrokinetic Model. J 2022, 5, 1–14. [Google Scholar] [CrossRef]
- Israel, W.; Stewart, J.M. Transient relativistic thermodynamics and kinetic theory. Ann. Phys. 1979, 118, 341. [Google Scholar] [CrossRef]
- Karpenko, I.; Huovinen, P.; Bleicher, M. A 3+1 dimensional viscous hydrodynamic code for relativistic heavy ion collisions. Comput. Phys. Commun. 2014, 185, 3016. [Google Scholar] [CrossRef]
- Bozek, P.; Broniowski, W.; Rybczynski, M.; Stefanek, G. GLISSANDO 3: GLauber Initial-State Simulation AND mOre, ver. 3. Comput. Phys. Commun. 2019, 245, 106850. [Google Scholar] [CrossRef]
- Laine, M.; Schroeder, Y. Quark mass thresholds in QCD thermodynamics. Phys. Rev. D 2006, 73, 085009. [Google Scholar] [CrossRef]
- Bazavov, A. et al. [The HotQCD Collaboration] The equation of state in (2+1)-flavor QCD. Phys. Rev. D 2014, 90, 094503. [Google Scholar] [CrossRef]
- Bass, S.A.; Belkacem, M.; Bleicher, M.; Brandstetter, M.; Bravina, L.; Ernst, C.; Gerland, L.; Hofmann, M.; Hofmann, S.; Konopka, J.; et al. Microscopic Models for Ultrarelativistic Heavy Ion Collisions. Prog. Part. Nucl. Phys. 1998, 41, 225–370. [Google Scholar] [CrossRef]
- Bleicher, M.; Zabrodin, E.; Spieles, C.; Bass, S.A.; Ernst, C.; Soff, S.; Bravina, L.; Belkacem, M.; Weber, H.; Stocker, H.; et al. Relativistic Hadron-Hadron Collisions in the Ultra-Relativistic Quantum Molecular Dynamics Model. J. Phys. G Nucl. Part. Phys. 1999, 25, 1859–1896. [Google Scholar] [CrossRef]
- Sinyukov, Y.M.; Akkelin, S.V.; Tolstykh, A.Y. Interferometry radii for expanding hadron resonance gas. Nucl. Phys. A 1996, 610, 278. [Google Scholar] [CrossRef]
- Shapoval, V.M.; Sinyukov, Y.M.; Karpenko, I.A. Emission source functions in heavy ion collisions. Phys. Rev. C 2013, 88, 064904. [Google Scholar] [CrossRef]
- Koonin, S.E. Proton Pictures of High-Energy Nuclear Collisions. Phys. Lett. B 1977, 70, 43. [Google Scholar] [CrossRef]
- Bolz, J.; Ornik, U.; Pluemer, M.; Schlei, B.R.; Weiner, R.M. Resonance decays and partial coherence in Bose-Einstein correlations. Phys. Rev. D 1993, 47, 3860. [Google Scholar] [CrossRef]
- Shapoval, V.M.; Braun-Munzinger, P.; Karpenko, I.A.; Sinyukov, Y.M. Femtoscopy correlations of kaons in Pb+Pb collisions at LHC within hydrokinetic model. Nucl. Phys. A 2014, 929, 1–8. [Google Scholar] [CrossRef]
- Gubser, S.S. Symmetry constraints on generalizations of Bjorken flow. Phys. Rev. D 2010, 82, 085027. [Google Scholar] [CrossRef]
- Csizmadia, P.; Csorgo, T.; Lukacs, B. New analytic solutions of the non-relativistic hydrodynamical equations. Phys. Lett. B 1998, 443, 21–25. [Google Scholar] [CrossRef]
- Sinyukov, Y.M.; Akkelin, S.V.; Hama, Y. Freeze-Out Problem in Hydrokinetic Approach to A+A Collisions. Phys. Rev. Lett. 2002, 89, 052301. [Google Scholar] [CrossRef]
Disclaimer/Publisher’s Note: The statements, opinions and data contained in all publications are solely those of the individual author(s) and contributor(s) and not of MDPI and/or the editor(s). MDPI and/or the editor(s) disclaim responsibility for any injury to people or property resulting from any ideas, methods, instructions or products referred to in the content. |
© 2023 by the authors. Licensee MDPI, Basel, Switzerland. This article is an open access article distributed under the terms and conditions of the Creative Commons Attribution (CC BY) license (https://creativecommons.org/licenses/by/4.0/).