Article

Advances in Mass Spectrometers for Flyby Space Missions for the Analysis of Biosignatures and Other Complex Molecules

Physics Institute, University of Bern, 3012 Bern, Switzerland
*
Author to whom correspondence should be addressed.
Universe 2022, 8(8), 416; https://doi.org/10.3390/universe8080416
Submission received: 27 May 2022 / Revised: 13 July 2022 / Accepted: 3 August 2022 / Published: 10 August 2022
(This article belongs to the Special Issue Developments and Technology Trends in the Space-Borne Instrumentation)

Abstract

:
Spacecraft flybys provide access to the chemical composition of the gaseous envelope of the planetary object. Typical relative encounter velocities range from km/s to tens of km/s in flybys. For speeds exceeding about 5 km/s, modern mass spectrometers analyzing the rapidly encountering gas suffer from intrinsic hypervelocity impact-induced fragmentation processes causing ambiguous results when analyzing complex molecules. In this case, instruments use an antechamber, inside which the incoming species collide many times with the chamber wall. These collisions cause the desired deceleration and thermalization of the gas molecules. However, these collisions also dissociate molecular bonds, thus fragmenting the molecules, and possibly forming new ones precluding scientists from inferring the actual chemical composition of the sampled gas. We developed a novel time-of-flight mass spectrometer that handles relative encounter velocities of up to 20 km/s omitting an antechamber and its related fragmentation. It analyzes the complete mass range of m/z 1 to 1000 at an instance. This innovation leads to unambiguous analysis of complex (organic) molecules. Applied to Enceladus, Europa or Io, it will provide reliable chemical composition datasets for exploration of the Solar System to determine its status, origin and evolution.

1. Introduction

Assessing the chemical composition of neutral gas and ions in extra-terrestrial upper atmospheres with mass spectrometers provides valuable information answering scientific questions related to the present state and to the pathways of the origin and evolution of the Solar System objects. Especially on planetary bodies without proper atmospheres, the tenuous atmospheres may contain neutral gas, ions and condensed matter from the surface such as, for example, ice and dust grains. They may have multiple origins. A sputtering component may contribute to the composition of it, see, e.g., [1,2]. In addition to outgassing and other supplies such as, for example, accretion, species may also originate active volcanism, e.g., [3,4], or plumes [5,6]. Impacting micrometeorites and radiation interaction with the surface lift surface material, micrometeorites and fractures thereof into the upper atmosphere forming dust clouds contain solid samples [7,8,9].
The species of interest are strongly dependent on the underlying scientific question(s) and priorities of the mission and are a major design driver. In general, of particular interest are often minor (low-relative-abundance) species and their isotopologues. Regarding the complexity of molecules to be analyzed, two major groups of questions can be identified: on the one hand, fundamental questions on the origin and evolution of many Solar System objects can be revealed by analyzing atomic gas and simple molecules present in the exosphere [10]. Many of those species are known or at least expected to be present in various exospheres to at least some extent including CH4, CO, NH3, N2; the noble gasses up to Xe and the isotopic ratios D/H, 3He/4He, 13C/12C, 15N/14N, 20Ne/22Ne, 38Ar/36Ar, 36Ar/40Ar, as well as those of Kr and Xe, e.g., [11,12,13,14,15] and references. The named species cover a mass range of about m/z 1 to 135, where m/z is the mass-to-charge ratio.
In addition to this well-established list of molecules of interest, objects may harbor specific molecules. For example, Jupiter’s moon Io is one of the most volcanically active body in the Solar System, e.g., [16]. Related to its volcanism, it is known to possess sulfur compounds given its present active volcanism [17]. At the high mass side, cyclic octaatomic sulfur (S8) is thought to be present. Given the sulfur-rich environment and accounting for the fact that Io cannot only consist of sulfur, at least moderately complex compounds are imaginable on this moon. Anticipating for a slightly extended mass range thus seems necessary. Since only in situ analysis will reveal the presence of such moderately complex species, instrumentation has to account for such molecules in a mass range of at least about m/z 1 to 300.
On the other hand, in the framework of assessing habitability, and even in the search for chemical signatures of life, ocean-bearing moons became a focus of research. For example, Saturn’s moon Enceladus and potentially Jupiter’s moon Europa have plumes that are believed to be connected to their subsurface water oceans [6,18]. If the plumes originate the oceans, then their upper atmospheres provide a window to their subsurface oceans, e.g., [19]. An investigation with an impact ionization mass spectrometer performed during an Enceladus flyby revealed species of higher masses up to m/z 200 to be present in ice grains originating in Enceladus’ ocean [20,21]. A typical amino acid has a molecular mass of about 110 Da. Thus, it is generally accepted that a mass range of about m/z 1 to 1000 is reasonable for analysis of plume vapor, e.g., [22]. In analogy, a potential water vapor plumes on Europa could include similarly organic complex species, however, recent studies with the Hubble Space Telescope/Space Telescope Imaging Spectrograph of Europa showed that an in situ analysis with dedicated measurement technology is necessary due to the limits in both sensitivity and spatial resolution of remote sensing devices from Earth or Earth orbit [6,23].
Upper atmospheres are accessible during spacecraft flybys [15,24,25,26,27,28,29,30,31,32]. Typical relative encounter velocities were (or will be) between about 2 km/s and about 19 km/s. The Cassini spacecraft to Saturn system had relative encounter velocities of 6.2 to 17.7 km/s during the Enceladus E0–E22 flybys [33]. Especially modern mission concepts demand for a high relative encounter velocity targeting 18–19 km/s to reach unvisited worlds, e.g., [24,29,34].
Mass spectrometry is a proven technique for the in situ investigation of chemical compositions of gaseous and solid samples [11,35,36]. The analysis of solid samples demands for impact ionization mass spectrometers, e.g., [30]. In contrast, gas phase analysis is performed with mass spectrometers with an electron ionization source. Whereas the impact ionization mass spectrometers analyze both simple and moderately complex molecules in dust and ice grains, mass spectrometers with electron ionization analyzing gaseous samples have the ability to analyze more complex molecules but only if in gas phase [37,38,39]. This contribution focuses on gaseous analysis.
Complex molecules and radicals are of fragile nature, their correct mass spectrometric registration is challenging because these molecules might fragment during the ionization process. The high relative encounter velocities of spacecraft during flybys are a major design driver for both spaceborne instrumentation and the related mission design given the high kinetic energies of encountering species.

2. Current State of the Art

2.1. Gas Sampling Mass Spectrometers

In the Saturn system, the Ion and Neutral Gas Mass Spectrometer (INMS) on board Cassini [31] analyzed a plume [40] during a flyby of Enceladus demonstrating the advantages of mass spectrometry for composition analysis [5]. The quadrupole mass spectrometer on board the spacecraft identified organic compounds mostly with molecular masses below m/z 50 [5,31,41]. INMS could analyze a mass range of up to m/z 99.5 at about unitary mass resolution (at 10% mass peak height), thus, without the capability to resolve isobaric interferences. Unitary mass resolution is typically referred to as the mass resolution that is necessary to resolve nominal species at integer masses rather than actual masses, i.e., 2D+ (m/z 2) from 1H2D+ (m/z 3) as compared to He+ (m/z 3.016) from 1H2D+ (m/z 3.022) [42,43]. The typical transmission of quadrupole mass spectrometers is in the order of 1% due to the metastable transfer trajectories of species in the mass analyzer [44]. Such instruments need to scan over the mass range, resulting in two major drawbacks.
First, the scanning over the complete mass range consumes from seconds to hours depending on the selected trade-off between mass resolution and sensitivity, e.g., [31]. Such a time consumption contrasts the quick nature of flybys. For example, assessing the Enceladus E5 flyby of Cassini at a relative encounter velocity of 17.7 km/s, the spacecraft spent about 80 s at an altitude below 500 km from the surface, and about 25 s below 100 km [33]. This issue even persisted during the slower E7 flyby (7.7 km/s), during which mass scanning was performed so that the cadence of masses measured was about 1.5 s [45]. The high cadence was chosen to provide simultaneous measurements of density and composition information over all masses in the region of interest during the flyby [45]. The price for achieving such a high cadence was the poor sensitivity, however, the resulting spatial resolution was still found to be poor for scientific interpretation [45]. Additionally, scientific interpretation is even more complicated as every part of the mass range is analyzed at a different instant corresponding to a different altitude.
Second, the poor transmission translates to poor sensitivity. This is particularly an issue as a minimal distance to the object of interest has to be maintained, often owing to uncertainties in both the maneuvers and trajectories with respect to the knowledge of the ephemeris of the object. Cassini performed a flyby of Enceladus with 23 km distance at its closest approach [33]. The number density of species present in exospheres typically exponentially decreases with increasing altitude, e.g., [1,25]. As only a limited fraction of the encountering species can be analyzed in the instruments due to, for example, ionization efficiency and geometrical parameters [46], instruments need to be sensitive when analyzing the exosphere. Although accumulating spectra increases the signal-to-noise ratio, it is limited by the time spent at the region of interest, which is determined by the flyby trajectory, i.e., the flyby speed.
In analogy, the species of interest attributed to plumes have limited scale heights as well, e.g., [45,47]. Thus, they become less abundant at higher altitudes up to a point where the sensitivity of an instrument is not capable anymore to detect the traces of species. However, the total number densities of plume structures in proximity of the closest approach of a spacecraft are so high that an excess of necessary species for mass spectrometric registration is present.
The moderate sensitivities that the INMS instrument was designed for (≥104 cm−3 in open-source neutral mode and ≥105 cm−3 in closed-source neutral mode) [31] in combination with the poor spatial resolution led to the selection of time-of-flight mass spectrometers on more recent missions.
The ROSINA instrument suite on board the ROSETTA mission contained such a time-of-flight instrument [39]. It achieved a sensitivity of 10−4 A/mbar. A sensitivity of 10−3 A/mbar corresponds to 0.2 counts/s if the number density is 1 cm−3 [39]. The sensitivity was sufficient to show that spacecraft outgassing was present even after years in space [48,49]. Mass spectrometers measure this local gas cloud as ambient gas. Measurements revealed that species typically include hydrocarbons in the mass range below about m/z 100 [48]. Species originating the spacecraft interfere measurements, however, as the species exponentially decay over time, this effect can be partially compensated for. Nevertheless, dedicated cleanliness campaigns are necessary for modern spacecraft to mitigate outgassing.
Especially Jupiter’s icy moons have received considerable attention. Two spacecraft will visit the Jovian system in the near future namely ESA’s L-class Jupiter Icy Moons Explorer (JUICE) [28] and NASA’s large strategic science mission Europa Clipper [27]. The selected mass spectrometer experiments will investigate the chemical composition of the exospheres and plumes, if present. They follow two different implementations of the time-of-flight (TOF) technique. The Neutral and Ion Mass spectrometer (NIM) on board JUICE is a classical TOF instrument with an ion mirror [50,51] measuring the complete mass range at an instant, and a repetition frequency of typically 10 kHz. The resulting spectra are histogrammed to improve signal-to-noise ratio, from 0.1 s to 300 s to reach a dynamic range of more than six decades for a single gain step. The dynamic range describes the ratio between the smallest and largest detectable number density of species. Near closest approach, a measurement cadence of 100 ms can be achieved translating to a superior spatial resolution [38]. It achieves a mass resolution of m/Δm 1100 (full width at half maximum, FWHM) and analyzes the mass range of m/z 1 to 1000 with a sensitivity of about 10−4 A/mbar [38]. When integrating these spectra during post-processing over 5 s, a detection threshold of about 1 cm−3 and a dynamic range of 106 can be achieved [25,38].
The mass resolution of NIM is sufficient for answering the scientific questions thanks to electron ionization, as demonstrated by its selection for spaceflight on board JUICE. Electron ionization is a well-established technique in spaceborne mass spectrometers [37,38,39,52]. Incoming species are ionized before entering the mass analyzer with a beam of electrons at about 70 eV. The impacting electrons create a characteristic fragmentation pattern for each molecule. These patterns are documented in databases allowing for a simple, trustful reconstruction of the original molecules overcoming mass resolution concerns for both moderately complex and complex molecules.
To increase the mass resolution, the Mass Spectrometer for Planetary Exploration (MASPEX) instrument on board Europa Clipper makes use of the multi-bounce technique [37,53]. Details on the comparison and use case of MASPEX-type and NIM-type instruments are described in reference [11]. Species bounce multiple times between two ion mirrors before they are registered, which significantly increases their time-of-flight. During the increased drift time, the species separate more, resulting in a mass resolution of up to about m/Δm 35,000 (FWHM) [54]. However, for this mass resolution, the mass range has to be limited around the mass of interest (so that the mass spectrum can still be interpreted), in fact, actually the higher the mass resolution (the more bounces in the ion-optical system are performed), the smaller the mass range becomes. For a complete composition analysis with MASPEX, one would need to record a full mass spectrum at low resolution, which also includes the fragmentation patterns of the molecules, and then zoom in on mass ranges of interest with higher resolution to resolve isobaric interferences as needed. Brockwell et al. [37] reports on this trade-off between mass range, time consumption and mass resolution. This is in stark contrast with NIM, which always measures the full mass spectrum. In MASPEX’s ambient science operation mode, acquiring a nominal mass spectrum corresponds to a mass range of m/z 2 to 32 and consumes 23 s but achieves a maximal mass resolution of about 7000 and a mass resolution of 37 for 1H2D at m/z 3 (10% valley definition). Such a spectrum is composed of several individual spectra requiring scanning of the species of interest. Greater mass range can be covered as indicated by Miller et al. [54] showing a mass range of about m/z 1 to more than 600, though only slightly overcoming unitary mass resolution (FWHM). Thus, when covering the complete mass range in reasonable time for flybys, scientists need to accept a mass resolution that is orders of magnitudes lower than its maximal capability of the MASPEX instrument.
To partially compensate for this issue, the experiment incorporates enrichment cells. Some species are collected in a cryotrap during the flyby and released later for a detailed analysis. However, this procedure remains an indirect measurement with uncertainties, especially regarding the collection of species and the thermal release of them. These design choices result in a sensitivity of 8 × 10⁻⁵ [37] and a dynamic range of 5 × 10⁴ [54] without enrichment cell (see reference [37] for details).
In conclusion, there remains a trade-off between analyzing the complete mass range directly and therefore reliably at the cost of a lower mass resolution. The selection of the appropriate instrument is therefore determined by the specific scientific questions of the mission.

2.2. Instrument Features: The Open and the Closed Source

The NIM instrument provides an open-source mode [55] and a closed-source mode to handle the rapidly incoming gas stream [56]. In open-source mode, species entering the mass spectrometer are ionized and deflected into the analyzer section by 90° by electrostatic means. This technique provides a high field of view of 10° elevation × 300° azimuth. Given the higher kinetic energies of species when flying by faster, the deflection voltage needs to be increased to maintain the focus of the ion-optical deflection system. This limit is reached at about 5 km/s with high voltages on the electrodes compatible with space instrumentation.
Higher relative encounter velocities can be achieved by using the closed-source mode [56]. Species enter a gold-coated antechamber, where many collisions with the chamber walls decelerate them down to reach thermal equilibrium with the chamber walls. The chamber walls have to be kept at temperatures exceeding −17 °C preventing condensation, however, a cool antechamber wall is favorable for a thermalization of species. This thermal gas is then guided into the mass analyzer by the resulting pressure enhancements, which additionally increases the sensitivity [46]. NIM’s antechamber (closed-source mode) may increase the sensitivity by about a factor of 8–15 compared to its background level, which is comparable to open-source mode.
The MASPEX instrument on board Europa Clipper only uses a closed source independent of the relative encounter velocity [54]. Substantial engineering effort was needed to select the appropriate material for the impacting surface and the antechamber wall. A gold coating was chosen for the antechamber mitigating reactive oxygen interference during measurements [57]. The severity of chemical reactions and its related effects in the antechamber on the calibration of MASPEX at 5 km/s is still under investigation, however, chemical reactions inside the antechamber were demonstrated [57]. Upon thermalization of species in this antechamber, they are guided either directly into the ion source, where electron ionization ionizes species, or on the enrichment cells for temporary storage.

2.3. Fragmentation Due to Hypervelocity Impacts

In addition to the beneficial fragmentation caused by electron ionization, sampling with a closed source especially at the so-called hypervelocities exceeding 5 km/s may also result in undesirable fragmentation of species that cannot be accounted for, referred to as hypervelocity impact (HVI) induced fragmentation. Species impact on the antechamber wall (NIM) or on the impact plate and the antechamber wall due to rebound (MASPEX). About 10 collisions are necessary for thermalization. The initial kinetic energy of species at m/z 1000 is 0.5 keV at 10 km/s and 2.1 keV at 20 km/s, and scales linearly with mass. For comparison, the bond-dissociation energy of a carbon–carbon bond is 3.6 eV and about 11 eV for the triple bonds [43,58]. This energy corresponds to m/z 22 at 10 km/s.
Depending on the size of the molecules (or dust grains), they may undergo substantial chemical alteration during HVI, as some of the kinetic energy is consumed for breaking the chemical bonds of the molecules, forming radicals which may undergo further chemical transformation. Regarding these energies, it is actually unlikely that such molecules remain intact. Molecular behavior and its related re-formation and synthesis upon impacts are studied for dust grains [59,60,61] and both moderately complex and complex molecules [62]. Although chemical alteration, i.e., breakup, is considerably larger at higher velocities, it already occurs at 0.9 km/s [63]. In fact, this issue persists even when using impact ionization mass spectrometers, as these instruments measure the plasma created by the impacting dust particle.
Modeling of both bond-dissociation and potential chemical alteration contradicts direct in situ measurements. Jaramillo-Botero et al. [64] provided an onset velocity of about 5 km/s for bond-dissociation of both bare species and species embedded in ice grains. They also offer modeling of molecular dynamics for the fragmentation of species within this velocity range. Although statistical modeling of bond dissociation upon HVIs is possible for single species, deriving the original molecule from the actually received data of the mass spectrometer is very challenging, in the best case. In the recorded spectra, the fragments of species resulting from the HVI-induced fragmentation may indistinguishably superpose other species that were also present in the plume or exosphere. Consequently, the results of such measurements are ambiguous. This is demonstrated by the inability to attribute mass peaks obtained from closed source measurements during Enceladus flybys to locally present species during the INMS/Cassini post-calibration campaign [5].
Even a higher mass resolution cannot overcome this issue. A solution proposed for this issue is relying on calibration data provided by other instruments to determine at least, for example, the reactive oxygen abundance [57], though such ultraviolet spectrometers lack sensitivity and spatial resolution and measure the column density.
In addition to these technical limitations of available instrumentation, there is a limitation of calibration facilities for these instruments. Currently available testing facilities providing a beam consisting of neutral gas species achieve velocities of about 4 km/s for H2, and considerably less for heavier species [65]. It uses a thermal nozzle that heats the gas before supersonic free jet expansion. Heating complex molecules to 600 °C breaks most relevant bonds and is thus impractical for usage. Novel concepts are investigated [66] promising a mean beam velocity of 10 km/s, and more later. However, they are not yet available. Thus, there are currently no available test facilities confirming the bond-dissociation models in a velocity range between about 4 and 20 km/s.
For the mentioned reasons, neither of the two available flagship mass spectrometers NIM and MASPEX are suitable candidates for a reliable analysis of complex molecules if the mission design requires hypervelocity flybys exceeding 5 km/s, as none of them provide direct, real-time analysis of species ensuring integrity of the data. Likewise, impacting mass spectrometers suffer from the same conceptual limitations.
Here, we present a mass spectrometer, referred to as OpenTOF, using a novel type of ion-optical system providing the capability to perform unambiguous analysis of complex molecules for relative encounter velocities of up to 20 km/s by invention of the direct open source.

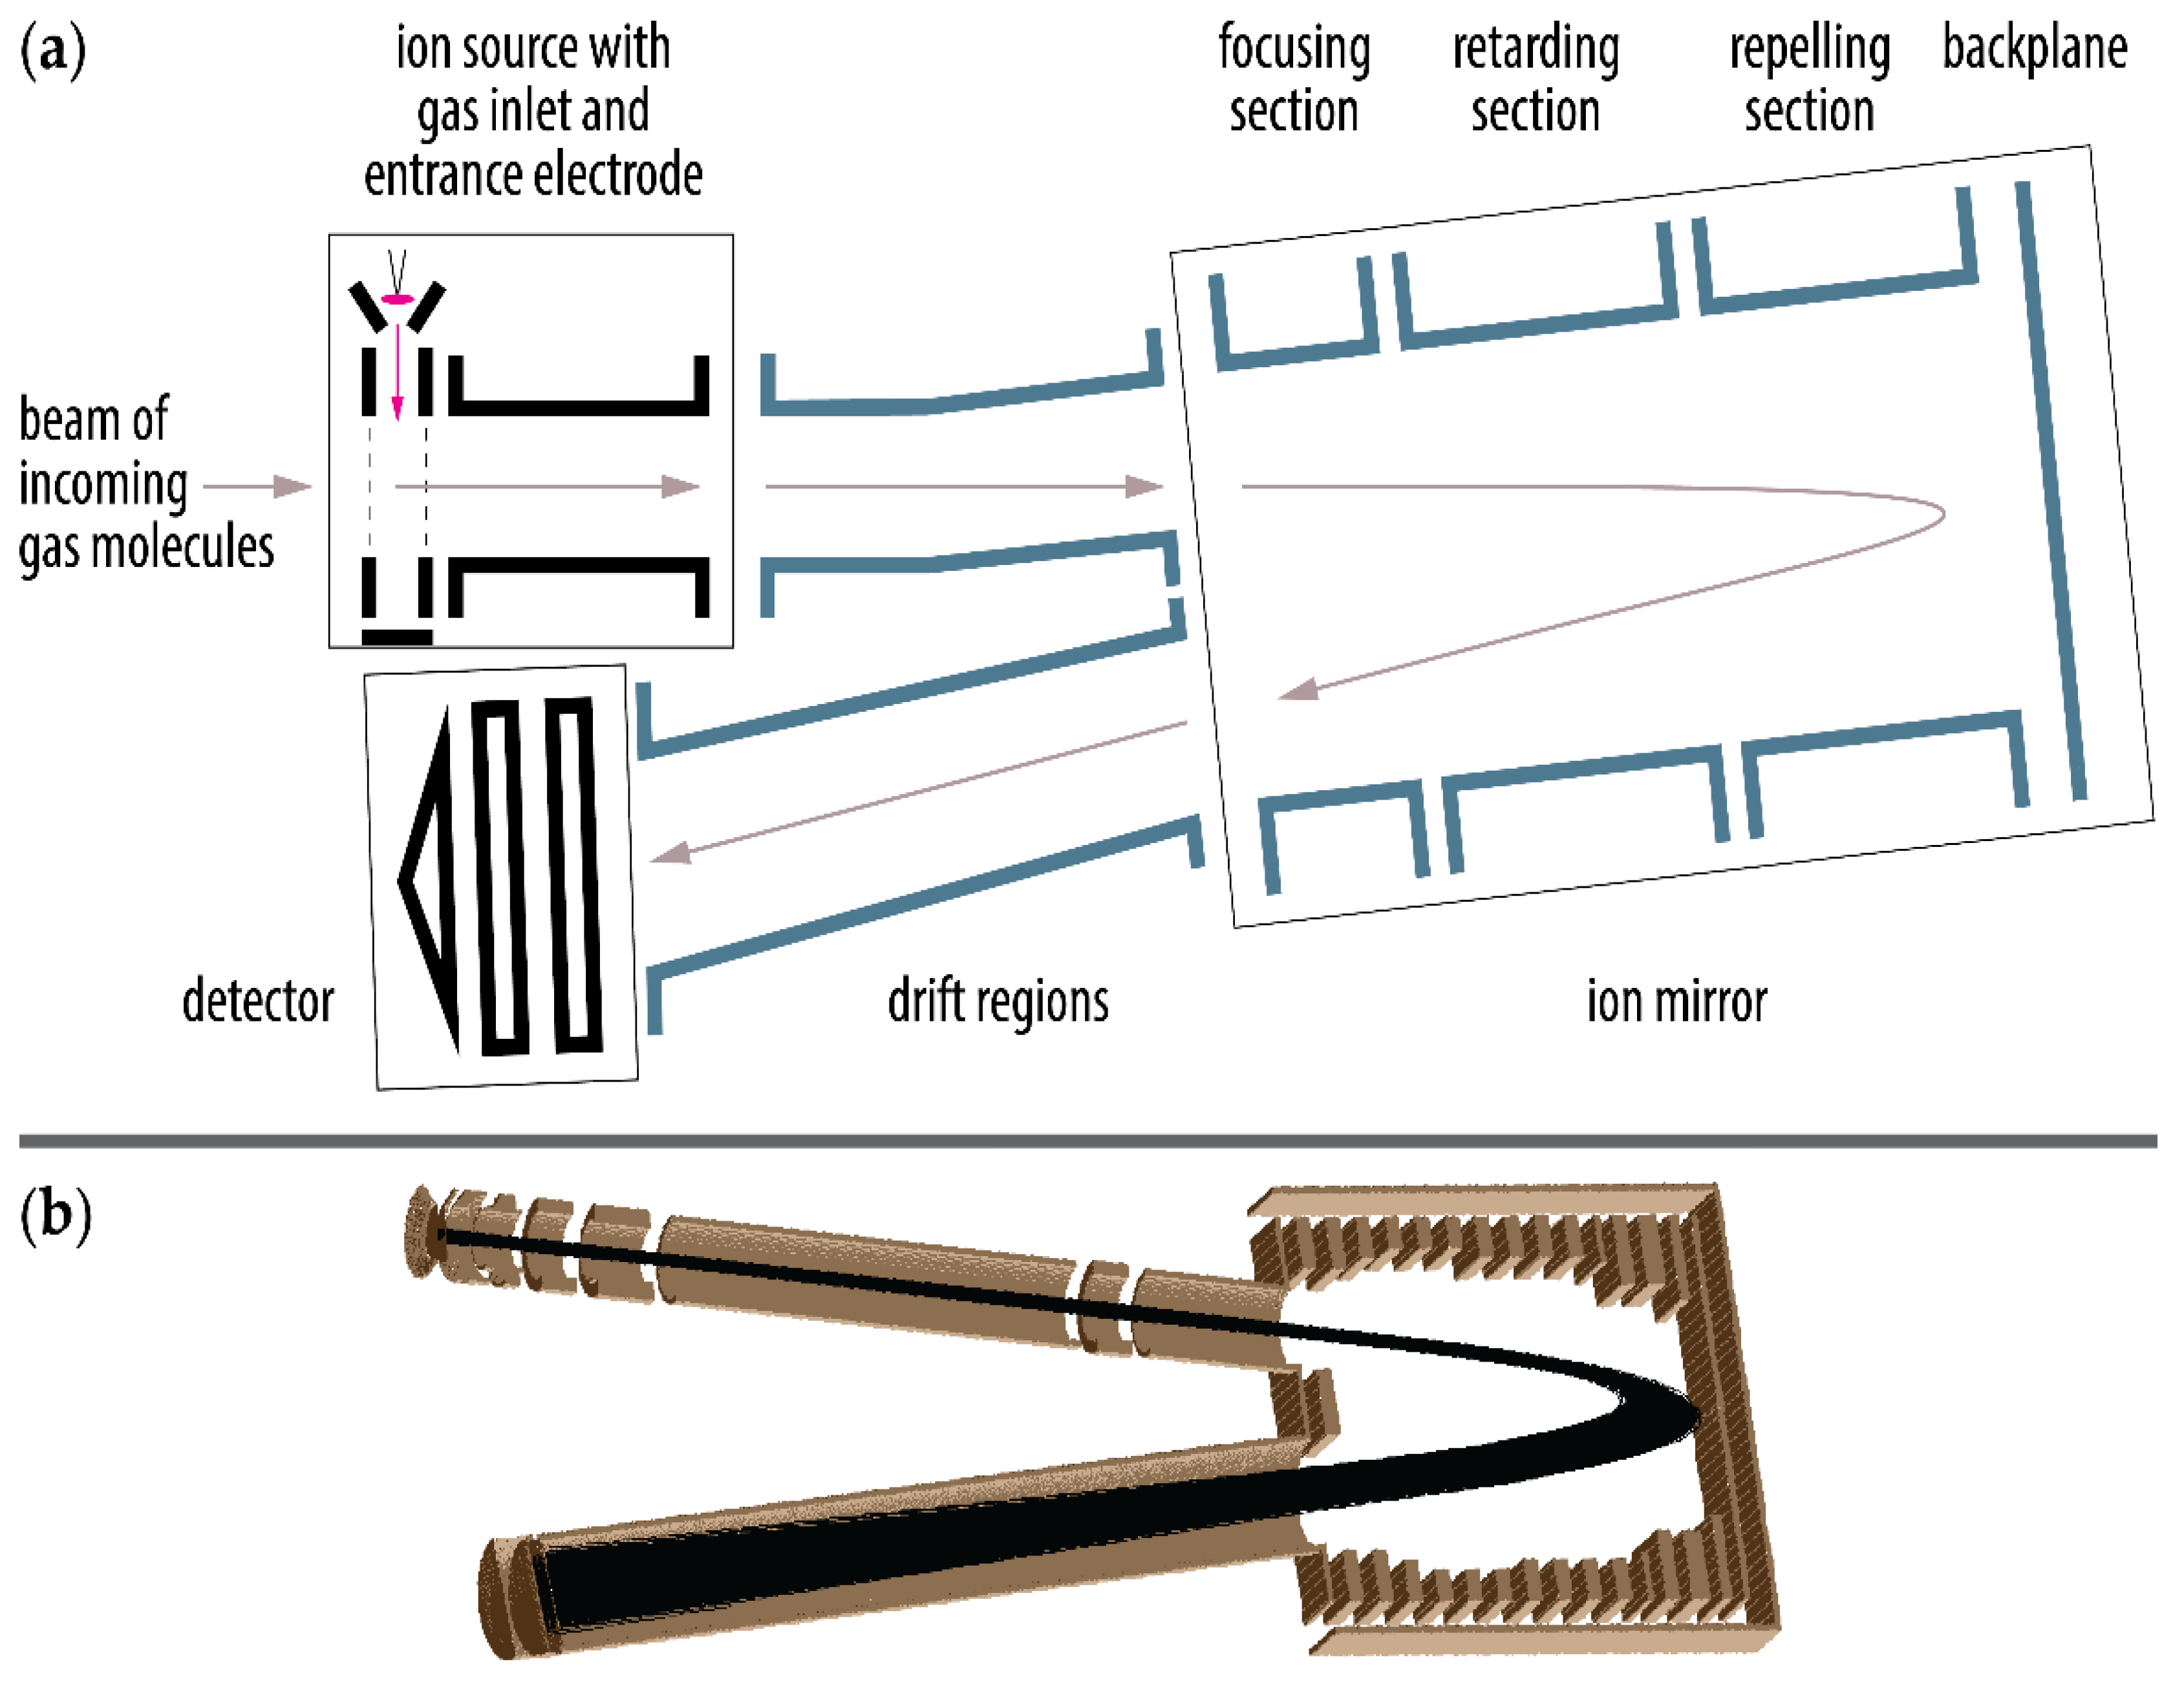
3. The OpenTOF Instrument

The OpenTOF Instrument is an instrument designed for instant analysis of neutral gas consisting of simple, moderately complex and complex molecules optimized for the requirements of flybys. Its direct open source is a solution to the quest of omitting the antechamber while maintaining the level of the used high voltages to overcome HVI-related fragmentation [67,68]. The direct open source is a technique that enables sampling of complex molecules at hypervelocity, i.e., speeds exceeding 5 km/s, by directly guiding the incoming gas into the mass analyzer where they can be analyzed. In this respect, this directly means that collisions with a wall are mitigated preventing HVI-induced fragmentation and its related difficulties. Linked to a direct open source, the mass analyzer has to be adapted to account for the high kinetic energy of the incoming species.
We designed this instrument using a SIMION® optimizer engine. Details on the optimizer engine are described in reference [69]. We updated it to be compatible with updated infrastructure, in combination with the adaptation of existing modules [70] to fit the needs of this mass spectrometer. Baseline initial conditions of the particles was a beam consisting of thermally distributed particles over the mass range m/z 1 to 1000 with a velocity shift of 10 km/s to account for the relative encounter velocity of the spacecraft. This velocity was varied in subsequent simulations to reach a maximum of up to 20 km/s. We present the ion-optical design of the instrument in the 10 km/s case, based on extensive ion-optical simulations. The OpenTOF design is likely to be testable in the near future in contrast to higher velocities due to availability of suitable calibration facilities. However, the simulations were indicative for velocities of up to 20 km/s when modifying the electrode voltages slightly. We used 1000 particles per m/z. Due to the redundancy of the filaments, the majority of the ion source’s volume has to be projected on the detector. In addition, we accounted for spacecraft pointing errors by adding off-axis velocity components to the velocity distribution to study the field of view derived from a cone half-angle ω.
The mass resolution R of this instrument is calculated as
R = m/Δm = t/(2 Δt)
where m is the mass-to-charge ratio m/z, t is the flight time TOF of the species and Δm and Δt are the peak width measured at the full width at half maximum (FWHM). Other definitions such as the valley definition exist, however, a comparison is only possible if and only if the peaks are perfectly symmetrical and isolated [71]. OpenTOF is designed to achieve a mass resolution of at least 1000 for higher masses.

3.1. Ion-Optical System

The ion-optical system is a time-of-flight mass spectrometer [72] with a grid-free ion mirror [50] to compensate for the initial thermal energy distribution (Figure 1, panels a and b). This simple design consists of an ion source with gas inlet, a drift region, an ion mirror, a second drift region, and a detector.
Voltages are adapted specifically to each relative encounter velocity in flight according to the given flight plan. The voltages of the mass analyzer are similar to previous instrumentation [38,52,73]. For the 10 km/s case, the voltage on the focusing section has the highest magnitude of about –5 kV and the drift tube is set to be at about −2 kV. The voltage of the back plane has to be high enough to provide a sufficiently strong ion repulsion with respect to the kinetic energy of species, i.e., 1.1 kV. The retarding section and the repelling section control the elaborate voltage gradient between the ion mirror entrance and the back plane, for achieving the time focus on the detector and good geometrical focusing to maximize the ion-optical transmission.
The ion source benefits from an electron ionization source [74] providing ionization of the species at 70 eV allowing for database empowered identification of the species. The electrons’ trajectories (magenta in Figure 1, panel a) are orthogonal to the incoming gas (gray in Figure 1, panel a). Positive ions can be measured when switching off the electron beam. A high voltage pulse of +600 V (start signal) applied to the first electrode that the gas encounters, referred to as the entrance electrode, extracts the ions to reach the detector (stop signal). This almost instantly applied extraction field adds about 300 eV of kinetic energy on average to the species. Thermal species have considerably lower energies despite exospheres being a hot region. Once accelerated, species separate in the drift tube according to their mass-to-charge ratio. An additional focusing section between the drift regions and the retarding section is responsible for the spatial focus on the detector. The recorded time spectra can easily be converted into mass spectra using known peaks in the recorded mass spectrum for a calibration [50].
The instrument has a characteristic length of 250 mm, as do its predecessors [51,75,76]. This length corresponds to flight times of about 500 ns for m/z 1 and 22 µs for m/z 1000 at 10 km/s relative encounter velocity.

3.2. Detector System and Data Processing Unit

Both the requirements for the data processing unit (DPU) and its implementation are almost the same to the ones of the successfully developed flight instruments NIM [38] and Neutral Gas Mass Spectrometer (NGMS) instruments [51,52], from which the electronics draw heritage. Technological advances allow for replacing selected components increasing its performance while maintaining a high technical readiness level. The subsystems are:
  • On-board computer (FPGA) with associated read-out electronics;
  • Low and high voltage power supplies;
  • An electron ionization source;
  • A high voltage pulser.
The data acquisition path of the detector follows the established high reliability analog-to-digital converter (ADC) approach. Once the ions in the mass analyzer hit the chevron-stacked micro-channel plates, they trigger an electron avalanche inside the plates amplifying the signal by about 106. The resulting pulse has an approximate width of 500 ps and is collected on an impedance matched anode [77]. Taking into account the front-end filtering and additional low noise amplifiers, peaks in the order of 50 mV full-scale range can be measured with a 2 GHz ADC, translating to about 10−4 A/mbar [39].
The DPU handles the fast data stream of the ADC by performing a histogram of single waveforms. A waveform comprising the full mass range is recorded every 100 µs. The DPU accumulates these waveforms to store a complete mass spectrum every 100 ms (minimum), or more if commanded. Integration time of 300 s per individual spectrum represents the maximum constrained by possible overflow of the histogramming memory. Depending on the downlink data product allocated, further lossy compression is possible [78]. Although the compression factor can be selected upon command to account for allocated downlink rates, we baseline a compression factor of about 7 in analogy to previous instrumentation [38,52].
These capabilities lead to two baseline measurement modes, namely, the low-cadence mode and the high-cadence mode. When accepting a low spatial resolution, 10,000 waveforms are accumulated to form a single spectrum that can be transferred every 1 s, corresponding to a low spatial resolution. For a high spatial resolution, only 1000 waveforms are accumulated so that the DPU stores a spectrum every 100 ms. Knowing the relative encounter velocity of an actual flyby, the resulting spatial resolution can be calculated (see also Table 1).
Nowadays, high-speed ADCs exceeding a vertical resolution of 12-bit exist. Thus, they provide sufficient dynamic range and outperform NGMS’ demonstrated dynamic range of 106 in 1 s of accumulation time over the complete mass range [52,79]. Taking into account the maximum time-of-flight of the masses 300 and 1000, a horizontal digitization of 16-bit is necessary in both cases. Another reason for accumulating the waveforms to a single spectrum is that this method reduces the total data product, as transferring every single waveform exceeds current downlink capabilities. Thus, the low-cadence mode necessitates a lower data rate and vice versa.
Thus, in proximity to the closest approach, i.e., typically some hundreds of kilometers away from the object of interest [25], the sampling mode is seamlessly changed from low-cadence mode to high-cadence mode. This results in about 800 spectra for an exemplary Cassini E5 flyby in the region below 500 km altitude or about 250 spectra for an altitude below 100 km corresponding to a possible plume flythrough event. For comparison, the INMS instrument recorded the masses at m/z 28 and 44 ten times each in the E5 flyby below 100 km altitude [80,81].
Table 1 provides an overview of selected mission scenarios at varying configurations of the instrument electronics, i.e., the high-speed ADC vertical resolution and varying flyby speeds, to derive data rates and spatial resolution of the instrument for a given scenario. The flyby speeds correspond to orbits, referred to as orbit analog, that were flown, will be flown, or are planned to be flown, for reference. For each scenario, we provide the data rates for the both the low-cadence mode (low-c.m.) and the high-cadence mode (high-c.m.). The vertical resolution of the ADC on a novel mission would be selected according to the current technological availability and is only shown to illustrate its influence on data rates.

3.3. Mechanical and Electrical Realization

The ion-optical system is directly mounted on the printed circuit board (PCB) [67,68,82]. Thanks to this approach, both high-voltage connectors and cables can be saved. This is of particular interest in engineering, since the appropriate selection of high voltage connectors has been very challenging in designing space instrumentation, often requiring custom solutions. Such solutions increase the overall risk of the project, and consume budgets. In addition to the saved size and mass, the electrical performance of the high voltage pulser benefits from this approach. Given the 2 ns to reach the extraction potential of about +600 V for typical pulsers, removing additional capacitance of the cable steepens the signal rise time reduces the overshoots, thus resulting in a higher mass resolution for lower masses.
The direct mounting of the ion-optical system on the PCBs provides additional flexibility to prepare the instrument for a harsh radiation environment. Especially for missions to Europa, for which a total ionizing dose of about 100 krad after shielding is expected [38,83], removing extra parts inside the connectors that become compromised upon radiation exposure is helpful. Despite the direct mounting, the electronics can still be shielded by the demanded 2 mm of Ta equivalent for a JUICE-type mission scenario [38,83,84], as extra metal sheets can be added and selected electrodes can be manufactured out of Ta, W or WCu. Radiation shielding of the detector is performed analogously to references [84,85,86]. These authors describe the shielding of the NIM detector, which was achieved by deriving the necessary shielding thickness from simulation of the expected environment and distributing the found shielding mass around the detector respecting the geometry of both itself and the mass analyzer. The shielding and associated radiation mitigation will be implemented according to the destination of the instrument.
As from an electronics point of view, the subsystems of NIM and this instrument are almost interchangeable, the power consumption of the integrated OpenTOF instrument will correspond to NIM’s power consumption of 11 W maximum [38].

4. Results

This section provides an overview of the scientific performance parameter (see also Table 2).

4.1. Sensitivity and Dynamic Range

The high transmission of the ion-optical system maintains its calculated sensitivities. The transmission through the mass analyzer for species ionized in the ion source is 1 under nominal flight conditions throughout the complete mass range of m/z 1 to 1000 (Figure 2). This is in agreement with other sensitive time-of-flight instruments [38,51,67] and contrasts quadrupole mass spectrometers. This goal is achieved by the grid-free design of the mass analyzer and an optimized ion-optical system [50]. A transmission of 1 is fundamental for composition analysis. With a lower transmission, certain species or fractions of them would be excluded from being recorded. As for the majority of cases, it could not be assured exactly which property led to the exclusion. Thus, mass fractionation inside the mass analyzer may occur distorting the found relative abundances of species resulting in a bias that cannot be accounted for. In a similar manner, a transmission less than 1 could affect isotope composition analysis. Thus, this high transmission is fundamental for a highly accurate isotope composition analysis as well.
The design of this ion-optical system prevents from HVI-induced fragmentation at all velocities. For relative encounter velocities exceeding the specified 20 km/s, still no HVI-induced fragmentation would occur. Instead, the voltages applied to the ion-optical system would be insufficient to both focus and project the ionized gas particles on the detector. This would result in a reduced transmission of certain species clipping the mass range in which reliable analysis is possible. Accepting an increase of these design parameter would also increase the maximal relative encounter velocity.
The condition of the transmission equaling 1 is fulfilled up to a cone half-angle ω of ≤3°. To include a conservative margin, we set the cone half-angle ω to 2 degrees resulting in a field of view of ±2° azimuthal and elevational for this instrument, which compares well to the approximately 2° to 3° field of view of the INMS instrument in open-source mode after which the instrument’s performance starts to drop significantly [31]. Increasing the field of view to 5° is possible without any modification on the instrument, however, at the expense of accepting a shortened mass range to about m/z 1 to 300 due to a reduced transmission for heavier species.
The transmission of this instrument is comparable to its predecessors. Abplanalp et al. [76] found the dimensions of these instruments to be sufficient for analyzing a total number density of 1 cm−3 with the presented performance in a prototype instrument for the NGMS instrument. In fact, these instruments were designed to analyze the tenuous exosphere on a lunar lander in a first operation mode and analyze the output of a gas chromatograph in a second operation mode [51]. This series of instruments provided sensitivity of about 10−4 A/mbar for thermal gas, which was useful to detect even traces of species at about 10−16 mbar partial pressure within 1 s [51]. As the relevant concepts in the ion source [74] and electronics [52] remained when transferring them to the flyby instrument NIM, NIM’s sensitivity is similar to its predecessors [25,38]. For a flyby velocity of 10 km/s, this performance results in about 100 ion counts/s for a neutral gas density of 1 cm−3 in the OpenTOF instrument.
Likewise, the OpenTOF instrument has a similar sensitivity as NIM in open-source mode. The main difference between the OpenTOF and NIM, however, is the lack of pressure enhancements in the closed-source mode. This affects the instrument’s detection level when measuring the exosphere ten thousands of kilometers away from the closest approach of the object of interest, where total number densities are low, i.e., in the order of about 103 cm−3, e.g., [1,25]. However, this effect is at least partially compensated for by technological advancements in electronics.
In close proximity to the closest approach during a plume flythrough, the number density of H2O, which dominates such plumes, is estimated to be in the order 109 cm−3 [45]. Fortunately, such a total number density is, however, found in its predecessor instrument NGMS inside the ion source, when operated with a gas chromatograph that constantly leaks its gas into the ion source [79,87]. Thus, a similar sensitivity for this instrument is projected, although measurements with the laboratory prototype will determine its achievable sensitivity in future studies. In addition, given the pressures inside the ion source and the fact that the vertical resolution of the ADC increased since the development of the NGMS instrument, the dynamic range of this instrument is expected to be at least comparable to the NGMS instrument [79], i.e., 106 in 1 s.

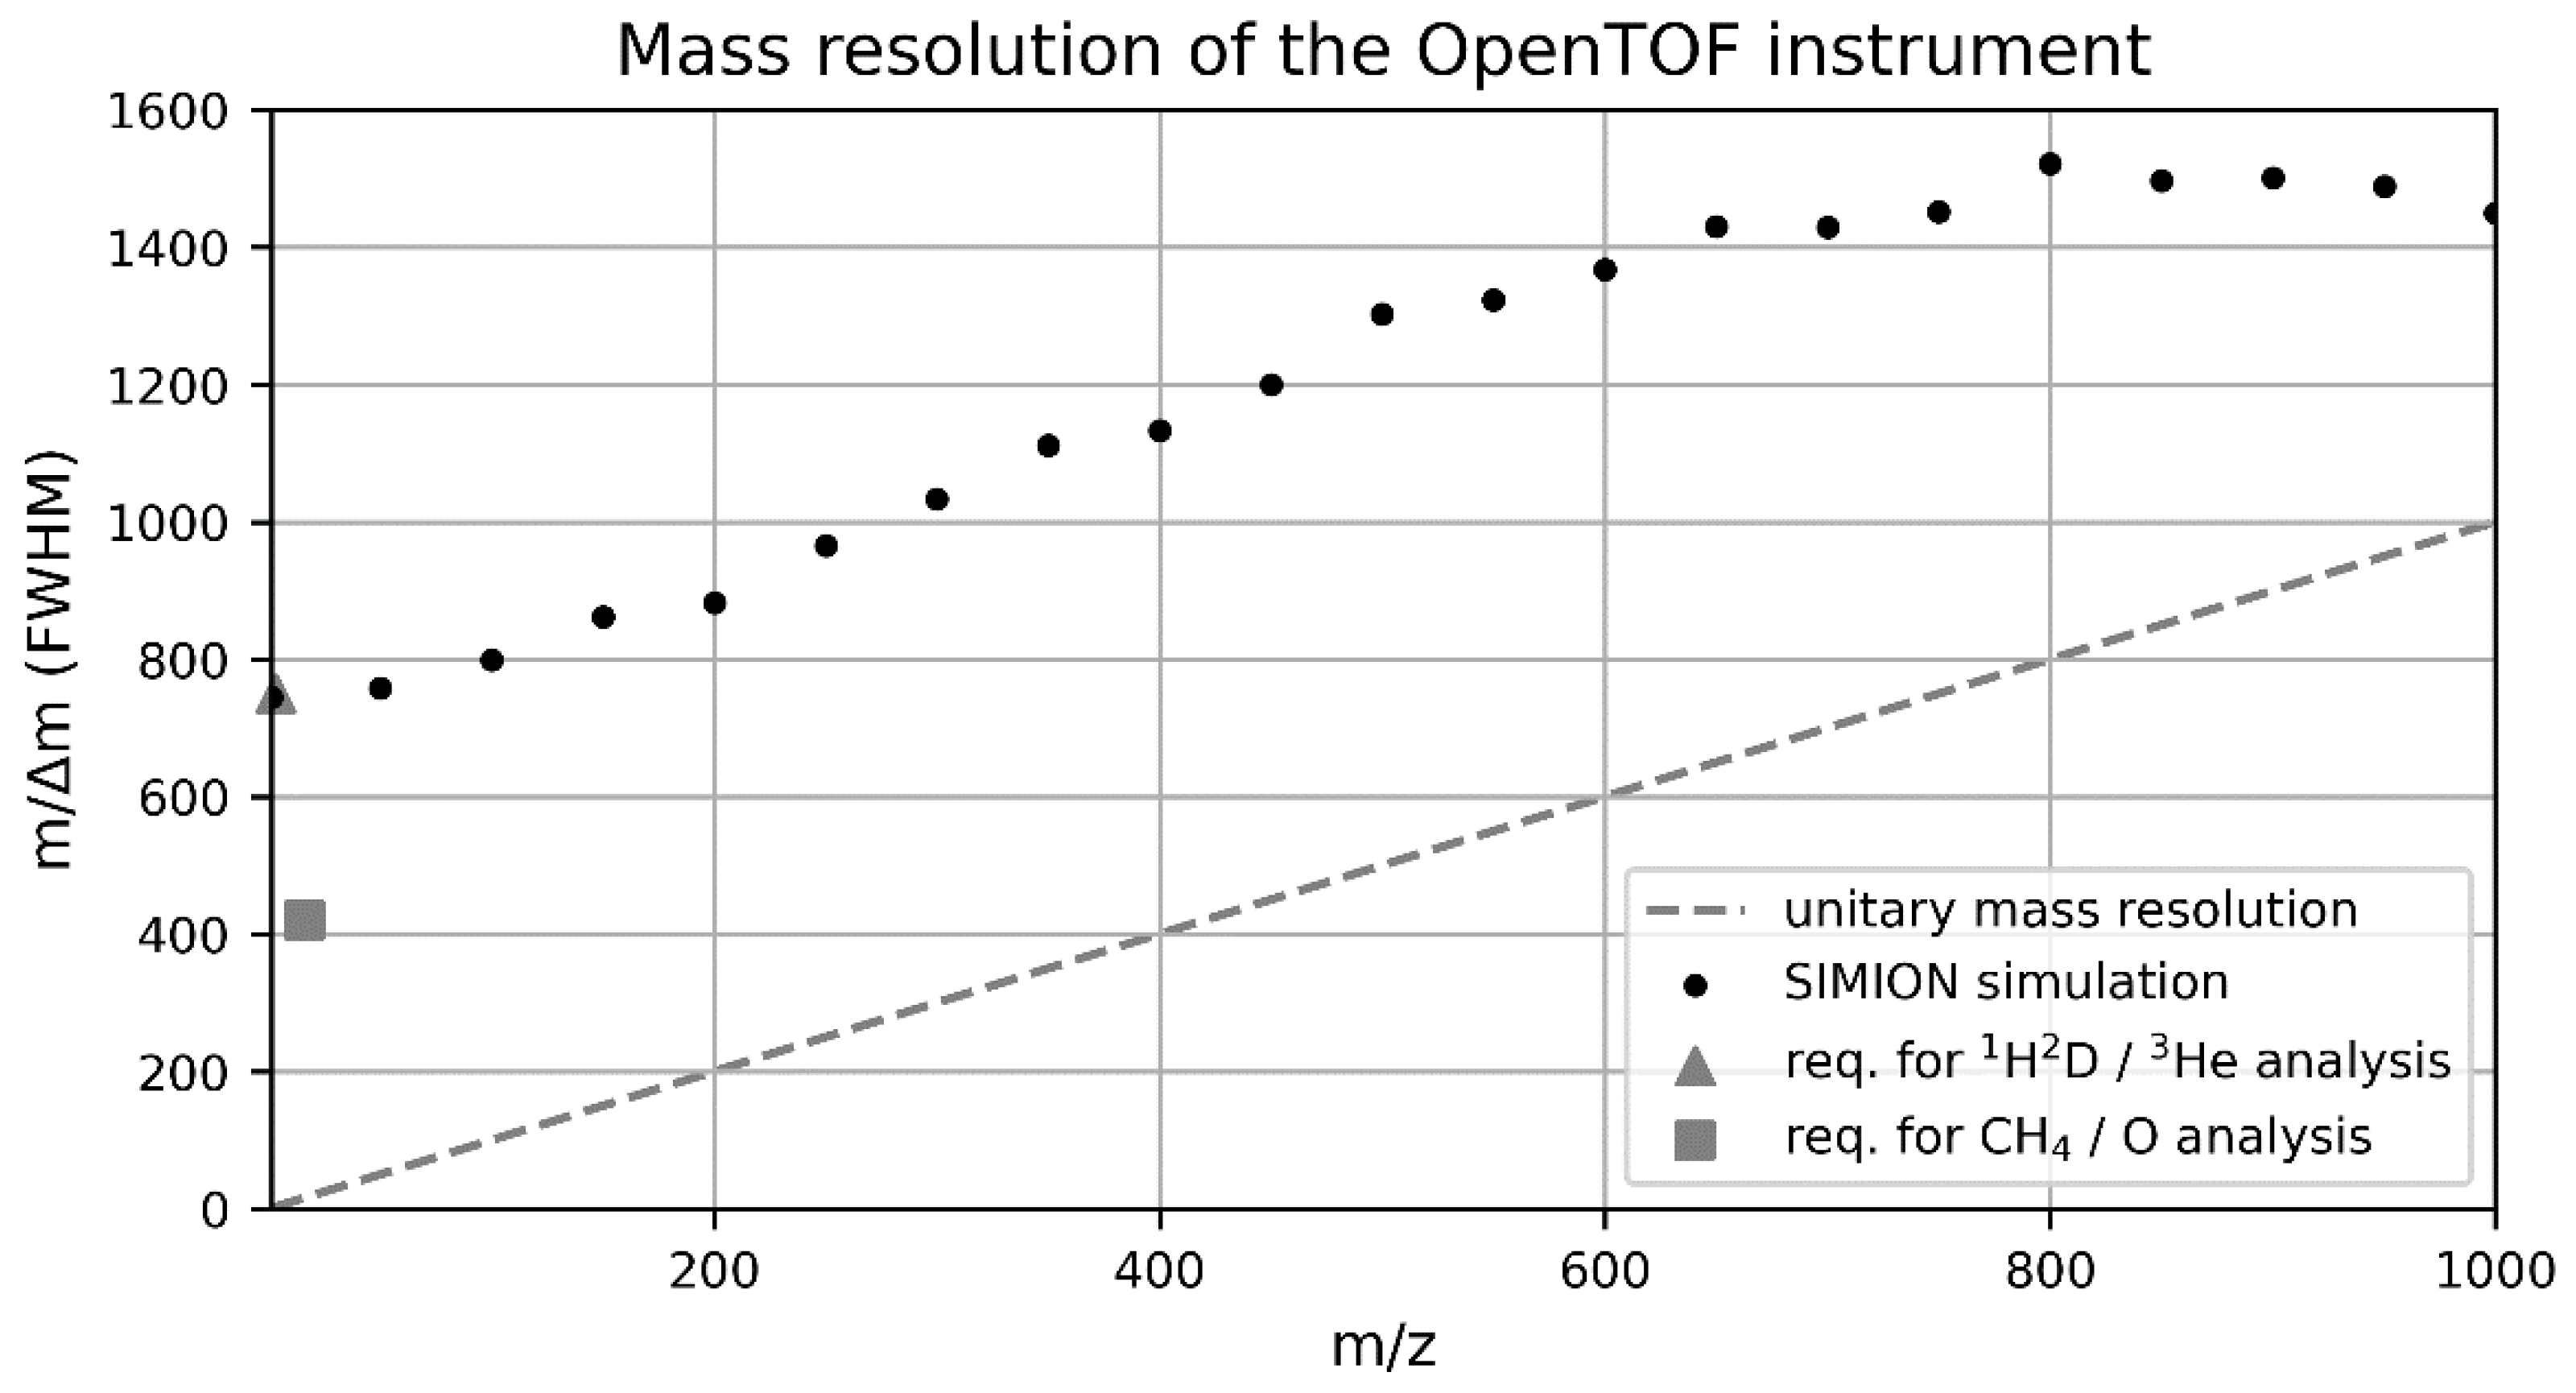
4.2. Mass Resolution

Figure 3 shows the simulated mass resolution of the ion-optical system over the mass range. The mass resolution starts at about m/Δm 760 (FWHM) for lower masses and rapidly increases to m/Δm 1000 for moderately heavy masses to achieve a mass resolution of m/Δm 1520 for m/z 800 where it about saturates. This performance exceeds unitary mass resolution by factors for lower masses.
The mass resolution allows for answering various scientific questions. Resolving 3He and 1H2D at m/z 3 demands a mass resolution exceeding about m/Δm 750 (Figure 3). For reference, the MASPEX instrument achieves a mass resolution of m/Δm 37 (10% valley definition) for this mass [37]. Figure 4, panel a, shows the resolved mass peaks. Moreover, panel b shows the resolved mass peaks of 16O+ and CH4+. In addition to the resolving power of the ion-optical system, the rise time of the high voltage pulser influences the mass resolution of these light species. Accounting for the close proximity of the high voltage pulser to the pulsed electrode in this novel mechanical design, the instrument can achieve the calculated mass resolution for these masses.
Figure 4, panel c, shows a simulated mass spectrum of the clearly resolved masses m/z 999 and m/z 1000. The Gaussian fit of the peaks can easily be inferred in post analysis. Higher masses could be recorded if reasonably abundant, as the given horizontal digitization of the electronics allows for measuring molecular masses of up to about m/z 2100. However, the conservative limit of the mass range is to have unit mass resolution, otherwise violating the constraint of resolving at least adjacent mass lines separated by a mass unit in the spectrum. Additionally, the ion-optical transmission of 1 starts to decrease for masses considerably higher than m/z 1000. Thus, the achieved mass resolution exceeding m/Δm 1000 (FWHM) leads to a mass range of at least m/z 1 to 1000 including margin.

5. Discussion

The OpenTOF instrument enables novel mission concepts with unprecedented possibilities. Eliminating the antechamber and replacing it with the direct open source [68] prepares for measurements of complex molecules and radicals during flybys in the velocity range of 0 to 20 km/s without interference of HVI-induced fragmentation due to bond-dissociation [64] and its related issues regarding an ambiguous interpretation of data [5,68].
The scientific performance of an instrument determines its applicability. Compared to previously flown instrumentation, e.g., [31], the performance is significantly increased over the relevant parameters namely sensitivity, mass resolution, the ability to perform quick analysis and size.
Compared to instruments currently under development [37,38], we designed OpenTOF to perform measurements a velocity range of up to 20 km/s without HVI-induced fragmentation. Compared to MASPEX, OpenTOF’s achievable mass resolution and the lack of a cryotrap are the main differences. Both having their advantages and shortcomings. The mass resolution of MASPEX outperforms the mass resolutions of both NIM and OpenTOF by factors. For example, it can resolve CO from N2 at m/z 28 and distinguish between other simple molecules, which is beyond the capabilities, and therefore beyond the science questions, of both NIM and OpenTOF chasing different scientific goals. For both moderately complex and complex molecules, however, the fragmentation caused by electron ionization creates a characteristic pattern serving as a fingerprint of species that is spread over almost the complete mass range beneath the species of interest and sometimes even slightly above the nominal molecular mass. Thus, analyzing only selected regions of the spectrum, albeit at a high mass resolution, is insufficient to reliably identify these compounds, especially as an apparent molecule could be a fragment of a more complex species. For example, CO could also represent a fragment created during HVI, thus, compromising the measurements. In fact, countless species with a molecular weight below 1000 have the potential to form the CO fragment. In addition, modelling the HVI-induced fragmentations and attributing its original molecule might be possible for single compounds, a reliable attribution of complex molecules in an unknown mixture necessitates instant analysis of the complete mass range, especially regarding the flyby speeds targeted for this instrument and its related altitude variations. Moreover, there is simply no time to scan over a complete mass range of m/z 1 to 1000 during a flythrough while maintaining the maximal achievable mass resolution of MASPEX and maintaining a reasonable sensitivity, as indicated by overcoming the scanning quadrupole instruments. Implementing the proposed cryotrap for postponing the analysis once time is available comes along with its own drawbacks namely that HVI-induced fragmentation persists. Thus, the OpenTOF instruments follows the science case of NIM-type instrumentation [38,89] and related instruments providing an overview of species present in both exospheres and plumes, if present, rather than providing very detailed analysis of only pre-selected species. Following this approach, this instrument offers the unprecedented possibility to measure radicals, moderately complex molecules and complex molecules at hypervelocity reliably, as necessitated by both previous missions [81] and future mission concepts, e.g., [24,29,34].
It could be imagined that the OpenTOF instrument is embedded in an instrument suite similarly as realized for Rosina/ROSETTA [39] with its two mass spectrometers. However, the common resource consumption, i.e., size [88], of MASPEX and OpenTOF question such an approach.
When compared to NIM, the drawbacks are the lack of pressure enhancement due to the omitted antechamber and the constrained field of view. Flying through a plume, the sensitivity of this instrument is expected to be compatible to NIM [25], as species are sufficiently available. For measurements of the exosphere, the sensitivity of OpenTOF is expected to be equal in open-source mode and lower in closed-source mode. This limitation has to be accepted when measuring moderately complex and complex molecules at higher velocities in the tenuous exosphere. In addition, despite NIM could measure dust, the diameter of the entrance hole is tiny, making dust measurements unlikely. The design of OpenTOF relinquishes dust measurements to dedicated instrumentation, as it focuses on measurements of neutral gas with an additional option to measure positive ions.
Conflicting pointing requirements of payloads can easily be resolved. Direct measurements at high relative encounter velocities come along with a moderate field of view of 2°, or larger if accepting a constrained mass range. Mounting the instrument on a slewing mechanism is anticipated to resolve conflicting spacecraft pointing priorities. This simple mechanism has already been successfully flight-proven as part of the Colour and Stereo Surface Imaging System on board ExoMars Trace Gas Orbiter [90]. The additionally consumed mass exceeds the mass savings regarding the simplified mounting of the ion-optical system. The total mass budget consists of the instrument mass (3.5 kg [68]), shielding mass (3.8 kg for Europa flybys [68]) and the slewing mechanism, which weighs about 2.5 kg for a shielded (NIM-baseline) instrument.
Spacecraft outgassing has been the reason for dedicated cleanliness campaigns. In addition to outgassing of the spacecraft, there is a second source supplying this cloud. Species impacting the spacecraft backscatter or fragment depending on the impacting conditions. The resulting products supply this cloud with a sputtering contribution. This gas cloud is measured with all mass spectrometers in space independent of the used technique. This instrument is therefore subject to the routinely performed contamination control procedures. In addition, the direct open source technique seems to offer promising capabilities to overcome this issue using energy differences of species [68], however, such a capability, its extent and its impact are subject to future studies.
Future studies will also include rigorous testing, especially of the ion-optical system, which we are building. Commissioning of the laboratory prototype of it will be started as soon as corresponding testing facilities providing a reasonably fast beam of neutral gas are available. This is expected to be the case, soon. Thanks to the similarities to the electronics of the NIM instrument, most of the electronics already have a high technical readiness level [38].
We anticipate the application of this next generation of spaceborne mass spectrometer in deep space missions that benefit from measuring both moderately complex and complex molecules during hypervelocity flybys. In particular, such worlds may show active volcanism or plumes. It allows for a scientific investigation of local processes and species thanks to both its mass range and mass resolution.
The analysis of complex molecules in the Solar System remains a challenging endeavor in deep space exploration. We invented a novel instrument that analyzes species present in the exosphere during hypervelocity flybys of spacecraft. This instrument incorporates features for highly accurate measurements with the goal of providing unambiguous data while expanding possible mission concepts. It thus represents the next generation of ion and neutral gas mass spectrometers designed for hypervelocity flybys. An analysis of celestial objects with this instrument will contribute to considerably enhancing the understanding of the origin and evolution of our Solar System.

Author Contributions

Conceptualization, R.G.F. and P.W.; methodology, R.G.F. and P.W.; software, R.G.F. and J.A.S.; validation, R.G.F., J.A.S. and P.W.; formal analysis, R.G.F. and J.A.S.; investigation, R.G.F., J.A.S. and P.W.; resources, R.G.F. and P.W.; data curation, R.G.F. and J.A.S.; writing—original draft preparation, R.G.F.; writing—review and editing, J.A.S. and P.W.; visualization R.G.F. and J.A.S.; supervision, R.G.F. and P.W.; project administration, R.G.F.; funding acquisition, P.W. All authors have read and agreed to the published version of the manuscript.

Funding

This research was funded by base funding of the University of Bern. The APC was funded by the University of Bern.

Institutional Review Board Statement

Not applicable.

Informed Consent Statement

Not applicable.

Data Availability Statement

Not applicable.

Acknowledgments

The authors kindly acknowledge the group’s IT service team for consultancy regarding software maintenance of the SIMION® optimization backend.

Conflicts of Interest

The authors declare no conflict of interest.

References

  1. Vorburger, A.; Wurz, P. Europa’s ice-related atmosphere: The sputter contribution. Icarus 2018, 311, 135–145. [Google Scholar] [CrossRef]
  2. Plainaki, C.; Milillo, A.; Mura, A.; Orsini, S.; Massetti, S.; Cassidy, T. The role of sputtering and radiolysis in the generation of Europa exosphere. Icarus 2012, 218, 956–966. [Google Scholar] [CrossRef]
  3. Lopes-Gautier, R.; McEwen, A.S.; Smythe, W.B.; Geissler, P.E.; Kamp, L.; Davies, A.G.; Spencer, J.R.; Keszthelyi, L.; Carlson, R.; Leader, F.E.; et al. Active Volcanism on Io: Global Distribution and Variations in Activity. Icarus 1999, 140, 243–264. [Google Scholar] [CrossRef] [Green Version]
  4. Spencer, J.R.; Stern, S.A.; Cheng, A.F.; Weaver, H.A.; Reuter, D.C.; Retherford, K.; Lunsford, A.; Moore, J.M.; Abramov, O.; Lopes, R.M.C.; et al. Io Volcanism Seen by New Horizons: A Major Eruption of the Tvashtar Volcano. Science (80) 2007, 318, 240–243. [Google Scholar] [CrossRef] [Green Version]
  5. Waite, J.H.; Combi, M.R.; Ip, W.-H.; Cravens, T.E.; McNutt, R.L.; Kasprzak, W.; Yelle, R.; Luhmann, J.; Niemann, H.; Gell, D.; et al. Cassini Ion and Neutral Mass Spectrometer: Enceladus Plume Composition and Structure. Science (80) 2006, 311, 1419–1422. [Google Scholar] [CrossRef] [Green Version]
  6. Roth, L.; Saur, J.; Retherford, K.D.; Strobel, D.F.; Feldman, P.D.; McGrath, M.A.; Nimmo, F. Transient Water Vapor at Europa’s South Pole. Science (80) 2014, 343, 171–174. [Google Scholar] [CrossRef]
  7. Krüger, H.; Krivov, A.; Grün, E. A dust cloud of Ganymede maintained by hypervelocity impacts of interplanetary micrometeoroids. Planet. Space Sci. 2000, 48, 1457–1471. [Google Scholar] [CrossRef] [Green Version]
  8. Sremčević, M.; Krivov, A.V.; Krüger, H.; Spahn, F. Impact-generated dust clouds around planetary satellites: Model Versus Galileo Data. Planet. Space Sci. 2005, 53, 625–641. [Google Scholar] [CrossRef]
  9. Miljković, K.; Hillier, J.K.; Mason, N.J.; Zarnecki, J.C. Models of dust around Europa and Ganymede. Planet. Space Sci. 2012, 70, 20–27. [Google Scholar] [CrossRef] [Green Version]
  10. De Pater, I.; Lissauer, J.J. Planetary Sciences, 2nd ed.; Cambridge University Press: Cambridge, UK, 2015; ISBN 9781107091610. [Google Scholar]
  11. Vorburger, A.; Wurz, P.; Waite, H. Chemical and Isotopic Composition Measurements on Atmospheric Probes Exploring Uranus and Neptune. Space Sci. Rev. 2020, 216, 1–31. [Google Scholar] [CrossRef]
  12. Atreya, S.K.; Crida, A.; Guillot, T.; Lunine, J.I.; Madhusudhan, N.; Mousis, O. The Origin and Evolution of Saturn, with Exoplanet Perspective. In Saturn in the 21st Century; Cambridge University Press: Cambridge, UK, 2018; pp. 5–43. ISBN 9781316227220. [Google Scholar]
  13. Atreya, S.K.; Hofstadter, M.H.; In, J.H.; Mousis, O.; Reh, K.; Wong, M.H. Deep Atmosphere Composition, Structure, Origin, and Exploration, with Particular Focus on Critical in situ Science at the Icy Giants. Space Sci. Rev. 2020, 216, 1–31. [Google Scholar] [CrossRef]
  14. Cavalié, T.; Venot, O.; Miguel, Y.; Fletcher, L.N.; Wurz, P.; Mousis, O.; Bounaceur, R.; Hue, V.; Leconte, J.; Dobrijevic, M. The Deep Composition of Uranus and Neptune from In Situ Exploration and Thermochemical Modeling. Space Sci. Rev. 2020, 216, 58. [Google Scholar] [CrossRef]
  15. Mousis, O.; Fletcher, L.N.; Lebreton, J.-P.; Wurz, P.; Cavalié, T.; Coustenis, A.; Courtin, R.; Gautier, D.; Helled, R.; Irwin, P.G.J.; et al. Scientific rationale for Saturn’s in situ exploration. Planet. Space Sci. 2014, 104, 29–47. [Google Scholar] [CrossRef] [Green Version]
  16. Lopes, R.M.C.; Kamp, L.W.; Smythe, W.D.; Mouginis-Mark, P.; Kargel, J.; Radebaugh, J.; Turtle, E.P.; Perry, J.; Williams, D.A.; Carlson, R. Lava lakes on Io: Observations of Io’s Volcanic Activity from Galileo NIMS during the 2001 Fly-Bys. Icarus 2004, 169, 140–174. [Google Scholar] [CrossRef]
  17. Thomas, N.; Bagenal, F.; Hill, T.W.; Wilson, J.K. The Io neutral clouds and plasma torus. In Jupiter. The Planet, Satellites and Magnetosphere; Cambridge University Press: Cambridge, UK, 2004; Volume 1, pp. 561–591. ISBN 0-521-81808-7. [Google Scholar]
  18. Postberg, F.; Kempf, S.; Schmidt, J.; Brilliantov, N.; Beinsen, A.; Abel, B.; Buck, U.; Srama, R. Sodium salts in E-ring ice grains from an ocean below the surface of Enceladus. Nature 2009, 459, 1098–1101. [Google Scholar] [CrossRef]
  19. Vorburger, A.; Wurz, P. Modeling of Possible Plume Mechanisms on Europa. J. Geophys. Res. Sp. Phys. 2021, 126, 1–20. [Google Scholar] [CrossRef]
  20. Postberg, F.; Khawaja, N.; Abel, B.; Choblet, G.; Glein, C.R.; Gudipati, M.S.; Henderson, B.L.; Hsu, H.-W.W.; Kempf, S.; Klenner, F.; et al. Macromolecular organic compounds from the depths of Enceladus. Nature 2018, 558, 564–568. [Google Scholar] [CrossRef]
  21. Khawaja, N.; Postberg, F.; Hillier, J.; Klenner, F.; Kempf, S.; Nölle, L.; Reviol, R.; Zou, Z.; Srama, R. Low-mass nitrogen-, oxygen-bearing, and aromatic compounds in Enceladean ice grains. Mon. Not. R. Astron. Soc. 2019, 489, 5231–5243. [Google Scholar] [CrossRef] [Green Version]
  22. MacKenzie, S.M.; Neveu, M.; Davila, A.F.; Lunine, J.I.; Cable, M.L.; Phillips-Lander, C.M.; Eigenbrode, J.L.; Waite, J.H.; Craft, K.L.; Hofgartner, J.D.; et al. Science Objectives for Flagship-Class Mission Concepts for the Search for Evidence of Life at Enceladus. Astrobiology 2022, 22, 685–712. [Google Scholar] [CrossRef]
  23. Roth, L.; Retherford, K.D.; Saur, J.; Strobel, D.F.; Feldman, P.D.; McGrath, M.A.; Nimmo, F. Orbital apocenter is not a sufficient condition for HST/STIS detection of Europa’s water vapor aurora. Proc. Natl. Acad. Sci. USA 2014, 111, E5123–E5132. [Google Scholar] [CrossRef] [Green Version]
  24. Wurz, P.; Vorburger, A.; McEwen, A.S.; Mandt, K.; Davies, A.G.; Hörst, S.; Thomas, N. Measurement of Io’s atmosphere during the IVO mission. In Proceedings of the 52nd Lunar and Planetary Science Conference 2021, Virtual, 15–19 March 2021; pp. 1–2. [Google Scholar]
  25. Wurz, P.; Vorburger, A.; Galli, A.; Tulej, M.; Thomas, N.; Alibert, Y.; Barabash, S.; Wieser, M.; Lammer, H. Measurement of the Atmospheres of Europa, Ganymede, and Callisto. In Proceedings of the European Planetary Science Congress 2014, Cascais, Portugal, 7–12 September 2014; Volume 9, pp. 1–2. [Google Scholar]
  26. Cable, M.L.; Porco, C.; Glein, C.R.; German, C.R.; MacKenzie, S.M.; Neveu, M.; Hoehler, T.M.; Hofmann, A.E.; Hendrix, A.R.; Eigenbrode, J.; et al. The Science Case for a Return to Enceladus. Planet. Sci. J. 2021, 2, 132. [Google Scholar] [CrossRef]
  27. Howell, S.M.; Pappalardo, R.T. NASA’s Europa Clipper—A Mission to a Potentially Habitable Ocean World. Nat. Commun. 2020, 11, 1311. [Google Scholar] [CrossRef]
  28. Grasset, O.; Dougherty, M.K.; Coustenis, A.; Bunce, E.J.; Erd, C.; Titov, D.; Blanc, M.; Coates, A.; Drossart, P.; Fletcher, L.N.; et al. JUpiter ICy moons Explorer (JUICE): An ESA mission to orbit Ganymede and to characterise the Jupiter system. Planet. Space Sci. 2013, 78, 1–21. [Google Scholar] [CrossRef]
  29. McEwen, A.S.; Keszthelyi, L.P.; Mandt, K.E.; IVO-Team. The IO Volcano Observer (IVO). In Proceedings of the 52nd Lunar and Planetary Science Conference 2021, Virtual, 15–19 March 2021; pp. 1–2. [Google Scholar]
  30. Srama, R.; Ahrens, T.J.; Altobelli, N.; Auer, S.; Bradley, J.G.; Burton, M.; Dikarev, V.V.; Economou, T.; Fechtig, H.; Görlich, M.; et al. The Cassini Cosmic Dust Analyzer. Space Sci. Rev. 2004, 114, 465–518. [Google Scholar] [CrossRef]
  31. Waite, J.H.; Lewis, W.S.; Kasprzak, W.T.; Anicich, V.G.; Block, B.P.; Cravens, T.E.; Fletcher, G.G.; Ip, W.-H.; Luhmann, J.G.; Mcnutt, R.L.; et al. The Cassini Ion and Neutral Mass Spectrometer (INMS) Investigation. Space Sci. Rev. 2004, 114, 113–231. [Google Scholar] [CrossRef] [Green Version]
  32. Reh, K.; Spilker, L.; Lunine, J.I.; Waite, J.H.; Cable, M.L.; Postberg, F.; Clark, K. Enceladus Life Finder: The Search for Life in a Habitable Moon. In Proceedings of the 2016 IEEE Aerospace Conference, Big Sky, MT, USA, 5–12 March 2016; pp. 1–8. [Google Scholar]
  33. Elson, L.S.; Acton, C.H.; Conner, D.L.; Semenov, B.V. Cassini SPICE Kernels V1.0, CO-S/J/E/V-SPICE-6-V1.0. In NASA Planetary Data System; NASA: Washington, DC, USA, 2005. [Google Scholar] [CrossRef]
  34. Adams, E.; Hibbard, K.; Turtle, E.; Reynolds, E.; Anderson, B.; Paranicas, C.; Rogers, G.; McAdams, J.; Roth, D.; McEwen, A.; et al. Io Volcano Observer’s (IVO) integrated approach to optimizing system design for radiation challenges. In Proceedings of the 2012 IEEE Aerospace Conference, Big Sky, MT, USA, 3–10 March 2012; pp. 1–13. [Google Scholar]
  35. Ren, Z.; Guo, M.; Cheng, Y.; Wang, Y.; Sun, W.; Zhang, H.; Dong, M.; Li, G. A review of the development and application of space miniature mass spectrometers. Vacuum 2018, 155, 108–117. [Google Scholar] [CrossRef]
  36. Arevalo, R.; Ni, Z.; Danell, R.M. Mass spectrometry and planetary exploration: A brief review and future projection. J. Mass Spectrom. 2020, 55, e4454. [Google Scholar] [CrossRef] [Green Version]
  37. Brockwell, T.G.; Meech, K.J.; Pickens, K.; Waite, J.H.; Miller, G.; Roberts, J.; Lunine, J.I.; Wilson, P. The mass spectrometer for planetary exploration (MASPEX). In Proceedings of the 2016 IEEE Aerospace Conference, Big Sky, MT, USA, 5–12 March 2016; pp. 1–17. [Google Scholar]
  38. Föhn, M.; Galli, A.; Vorburger, A.; Tulej, M.; Lasi, D.; Riedo, A.; Fausch, R.G.; Althaus, M.; Brungger, S.; Fahrer, P.; et al. Description of the Mass Spectrometer for the Jupiter Icy Moons Explorer Mission. In Proceedings of the 2021 IEEE Aerospace Conference, Big Sky, MT, USA, 6–13 March 2021; pp. 1–14. [Google Scholar]
  39. Balsiger, H.; Altwegg, K.; Bochsler, P.; Eberhardt, P.; Fischer, J.; Graf, S.; Jäckel, A.; Kopp, E.; Langer, U.; Mildner, M.; et al. Rosina—Rosetta Orbiter Spectrometer for Ion and Neutral Analysis. Space Sci. Rev. 2007, 128, 745–801. [Google Scholar] [CrossRef]
  40. Porco, C.C.; Helfenstein, P.; Thomas, P.C.; Ingersoll, A.P.; Wisdom, J.; West, R.; Neukum, G.; Denk, T.; Wagner, R.; Roatsch, T.; et al. Cassini Observes the Active South Pole of Enceladus. Science (80) 2006, 311, 1393–1401. [Google Scholar] [CrossRef] [Green Version]
  41. Waite, J.H., Jr.; Lewis, W.S.; Magee, B.A.; Lunine, J.I.; McKinnon, W.B.; Glein, C.R.; Mousis, O.; Young, D.T.; Brockwell, T.; Westlake, J.; et al. Liquid water on Enceladus from observations of ammonia and 40Ar in the plume. Nature 2009, 460, 487–490. [Google Scholar] [CrossRef]
  42. Hamzeloui, S.; Smith, J.A.; Fink, D.J.; Myers, E.G. Precision mass ratio of 3He+ to HD+. Phys. Rev. A 2017, 96, 060501. [Google Scholar] [CrossRef] [Green Version]
  43. Wallace, W.E. Mass Spectra. In NIST Chemistry WebBook, NIST Standard Reference Database Number 69; 2022. Available online: https://webbook.nist.gov/chemistry/ (accessed on 26 May 2022).
  44. Dawson, P.H. Quadrupole Mass Spectrometry and Its Applications, 1st ed.; Dawson, P.H., Ed.; Elsevier: Amsterdam, The Netherlands, 1976; ISBN 9781483165042. [Google Scholar]
  45. Teolis, B.D.; Wyrick, D.Y.; Bouquet, A.; Magee, B.A.; Waite, J.H. Plume and surface feature structure and compositional effects on Europa’s global exosphere: Preliminary Europa mission predictions. Icarus 2017, 284, 18–29. [Google Scholar] [CrossRef] [Green Version]
  46. Wurz, P.; Balogh, A.; Coffey, V.; Dichter, B.K.; Kasprzak, W.T.; Lazarus, A.J.; Lennartsson, W.; McFadden, J.P. Calibration Techniques. In Calibration of Particle Instruments in Space Physics; ESA Communications, ISSI Scientific Report; Wüest, M., Evans, D.S., von Steiger, R., Eds.; ESA Communications; Keplerlaan 1: Noordwijk, The Netherlands, 2007; pp. 117–276. [Google Scholar]
  47. Berg, J.J.; Goldstein, D.B.; Varghese, P.L.; Trafton, L.M. DSMC simulation of Europa water vapor plumes. Icarus 2016, 277, 370–380. [Google Scholar] [CrossRef]
  48. Schläppi, B.; Altwegg, K.; Balsiger, H.; Hässig, M.; Jäckel, A.; Wurz, P.; Fiethe, B.; Rubin, M.; Fuselier, S.A.; Berthelier, J.J.; et al. Influence of spacecraft outgassing on the exploration of tenuous atmospheres with in situ mass spectrometry. J. Geophys. Res. Sp. Phys. 2010, 115, 1–14. [Google Scholar] [CrossRef]
  49. Hassig, M.; Altwegg, K.; Balsiger, H.; Calmonte, U.; Jackel, A.; Schlappi, B.; Semon, T.; Wurz, P.; Berthelier, J.J.; De Keyser, J.; et al. Spacecraft outgassing, a largely underestimated phenomenon. In Proceedings of the 2011 2nd International Conference on Space Technology, Athens, Greece, 15–17 September 2011; pp. 1–4. [Google Scholar]
  50. Scherer, S.; Altwegg, K.; Balsiger, H.; Fischer, J.; Jäckel, A.; Korth, A.; Mildner, M.; Piazza, D.; Reme, H.; Wurz, P. A novel principle for an ion mirror design in time-of-flight mass spectrometry. Int. J. Mass Spectrom. 2006, 251, 73–81. [Google Scholar] [CrossRef]
  51. Wurz, P.; Abplanalp, D.; Tulej, M.; Lammer, H. A neutral gas mass spectrometer for the investigation of lunar volatiles. Planet. Space Sci. 2012, 74, 264–269. [Google Scholar] [CrossRef]
  52. Fausch, R.G.; Wurz, P.; Tulej, M.; Jost, J.; Gubler, P.; Gruber, M.; Lasi, D.; Zimmermann, C.; Gerber, T. Flight electronics of GC-mass spectrometer for investigation of volatiles in the lunar regolith. In Proceedings of the 2018 IEEE Aerospace Conference, Big Sky, MT, USA, 3–10 March 2018; pp. 1–13. [Google Scholar] [CrossRef]
  53. Hässig, M.; Libardoni, M.; Mandt, K.; Miller, G.; Blase, R. Performance evaluation of a prototype multi-bounce time-of-flight mass spectrometer in linear mode and applications in space science. Planet. Space Sci. 2015, 117, 436–443. [Google Scholar] [CrossRef]
  54. Miller, K.E.; Miller, G.P.; Franke, K.; Hoeper, P.; Waite, J.H.; Brockwell, T.; Perryman, R.S.; Dunn, G.; Hanley, J.; Magee, B.; et al. An Update on the MASPEX Instrument: New Capabilities for Planetary Chemistry and Habitability. In Proceedings of the 53rd Lunar and Planetary Science Conference, Woodlands, TX, USA, 7–11 March 2022; pp. 1–2. [Google Scholar]
  55. Nier, A.O.; Potter, W.E.; Hickman, D.R.; Mauersberger, K. The open-source neutral-mass spectrometer on Atmosphere Explorer-C, -D, and -E. Radio Sci. 1973, 8, 271–276. [Google Scholar] [CrossRef]
  56. Meyer, S.; Tulej, M.; Wurz, P. Mass spectrometry of planetary exospheres at high relative velocity: Direct Comparison of Open- and Closed-Source Measurements. Geosci. Instrum. Methods Data Syst. 2017, 6, 1–8. [Google Scholar] [CrossRef] [Green Version]
  57. Bouquet, A.; Blase, R.; Brockwell, T.; Waite, J.H. Expected effect of atomic oxygen of Europa’s exosphere on the MAss Spectrometer for Planetary EXploration. Planet. Space Sci. 2020, 188, 104918. [Google Scholar] [CrossRef]
  58. Cheng, J.-P. Bond Dissociation Energies. In CRC Handbook of Chemistry and Physics; Rumble, J.R., Ed.; CRC Press/Taylor & Francis: Boca Raton, FL, USA, 2021. [Google Scholar]
  59. Martins, Z.; Price, M.C.; Goldman, N.; Sephton, M.A.; Burchell, M.J. Shock synthesis of amino acids from impacting cometary and icy planet surface analogues. Nat. Geosci. 2013, 6, 1045–1049. [Google Scholar] [CrossRef]
  60. Sugahara, H.; Mimura, K. Peptide synthesis triggered by comet impacts: A possible method for peptide delivery to the early Earth and icy satellites. Icarus 2015, 257, 103–112. [Google Scholar] [CrossRef]
  61. Managadze, G.G.; Engel, M.H.; Getty, S.; Wurz, P.; Brinckerhoff, W.B.; Shokolov, A.G.; Sholin, G.V.; Terent’ev, S.A.; Chumikov, A.E.; Skalkin, A.S.; et al. Excess of l-alanine in amino acids synthesized in a plasma torch generated by a hypervelocity meteorite impact reproduced in the laboratory. Planet. Space Sci. 2016, 131, 70–78. [Google Scholar] [CrossRef] [PubMed] [Green Version]
  62. Jaramillo-Botero, A.; An, Q.; Theofanis, P.L.; Goddard, W.A. Large-scale molecular simulations of hypervelocity impact of materials. Procedia Eng. 2013, 58, 167–176. [Google Scholar] [CrossRef] [Green Version]
  63. Furukawa, Y.; Nakazawa, H.; Sekine, T.; Kobayashi, T.; Kakegawa, T. Nucleobase and amino acid formation through impacts of meteorites on the early ocean. Earth Planet. Sci. Lett. 2015, 429, 216–222. [Google Scholar] [CrossRef]
  64. Jaramillo-Botero, A.; Cable, M.L.; Hofmann, A.E.; Malaska, M.; Hodyss, R.; Lunine, J. Understanding Hypervelocity Sampling of Biosignatures in Space Missions. Astrobiology 2021, 21, 421–442. [Google Scholar] [CrossRef]
  65. Graf, S.; Altwegg, K.; Balsiger, H.; Jäckel, A.; Kopp, E.; Langer, U.; Luithardt, W.; Westermann, C.; Wurz, P. A cometary neutral gas simulator for gas dynamic sensor and mass spectrometer calibration. J. Geophys. Res. E Planets 2004, 109, E07S08. [Google Scholar] [CrossRef]
  66. Zhang, H.; Li, D.; Wurz, P.; Etter, A.; Cheng, Y.; Dong, C.; Huang, W. Performance of a low energy ion source with carbon nanotube electron emitters under the influence of various operating gases. Nanomaterials 2020, 10, 354. [Google Scholar] [CrossRef] [Green Version]
  67. Fausch, R.; Wurz, P.; Rohner, U.; Tulej, M. CubeSatTOF: Planetary Atmospheres Analyzed with a 1U High-Performance Time-Of-Flight Mass Spectrometer. In Proceedings of the 34th Small Satellite Conference, Logan, UT, USA, 1–6 August 2020; pp. 1–10. [Google Scholar]
  68. Fausch, R.G.; Wurz, P.; Cotting, B.; Rohner, U.; Tulej, M. Direct Measurement of Neutral Gas during Hypervelocity Planetary Flybys. IEEE Aerosp. Conf. 2022; in press. [Google Scholar]
  69. Bieler, A.; Altwegg, K.; Hofer, L.; Jäckel, A.; Riedo, A.; Sémon, T.; Wahlström, P.; Wurz, P. Optimization of mass spectrometers using the adaptive particle swarm algorithm. J. Mass Spectrom. 2011, 46, 1143–1151. [Google Scholar] [CrossRef]
  70. Wiesendanger, R.; Grimaudo, V.; Tulej, M.; Riedo, A.; Lukmanov, R.; Ligterink, N.; Fausch, R.; Shea, H.; Wurz, P. The LMS-GT instrument—A new perspective for quantification with the LIMS-TOF measurement technique. J. Anal. At. Spectrom. 2019, 34, 2061–2073. [Google Scholar] [CrossRef]
  71. Urban, J.; Afseth, N.K.; Štys, D. Fundamental definitions and confusions in mass spectrometry about mass assignment, centroiding and resolution. TrAC Trends Anal. Chem. 2014, 53, 126–136. [Google Scholar] [CrossRef] [Green Version]
  72. Wiley, W.C.; McLaren, I.H. Time-of-Flight Mass Spectrometer with Improved Resolution. Rev. Sci. Instrum. 1955, 26, 1150–1157. [Google Scholar] [CrossRef]
  73. Wieser, M.; Kalla, L.; Barabash, S.; Hedqvist, T.; Kemi, S.; Widell, O.; Abplanalp, D.; Wurz, P. The Mars Environment Analogue Platform long duration balloon flight. Adv. Space Res. 2009, 44, 308–312. [Google Scholar] [CrossRef]
  74. Abplanalp, D.; Wurz, P.; Huber, L.; Leya, I. An optimised compact electron impact ion storage source for a time-of-flight mass spectrometer. Int. J. Mass Spectrom. 2010, 294, 33–39. [Google Scholar] [CrossRef]
  75. Föhn, M.; Tulej, M.; Galli, A.; Vorburger, A.H.; Lasi, D.; Wurz, P.; Brandt, P.; Barabash, S. Development of the NIM Mass spectrometer for Exploration of Jupiter’s Icy Moons Exospheres. In Proceedings of the EGU General Assembly 2020, Online, 4–8 May 2020; p. EGU2020-2955. [Google Scholar]
  76. Abplanalp, D.; Wurz, P.; Huber, L.; Leya, I.; Kopp, E.; Rohner, U.; Wieser, M.; Kalla, L.; Barabash, S. A neutral gas mass spectrometer to measure the chemical composition of the stratosphere. Adv. Space Res. 2009, 44, 870–878. [Google Scholar] [CrossRef]
  77. Wurz, P.; Gubler, L. Impedance-matching anode for fast timing signals. Rev. Sci. Instrum. 1994, 65, 871–876. [Google Scholar] [CrossRef]
  78. Wheeler, F.W.; Pearlman, W.A. SPIHT image compression without lists. In Proceedings of the 2000 IEEE International Conference on Acoustics, Speech, and Signal Processing. Proceedings (Cat. No.00CH37100), Istanbul, Turkey, 6 August 2000; Volume 4, pp. 2047–2050. [Google Scholar]
  79. Hofer, L.; Wurz, P.; Buch, A.; Cabane, M.; Coll, P.; Coscia, D.; Gerasimov, M.; Lasi, D.; Sapgir, A.; Szopa, C.; et al. Prototype of the gas chromatograph–mass spectrometer to investigate volatile species in the lunar soil for the Luna-Resurs mission. Planet. Space Sci. 2015, 111, 126–133. [Google Scholar] [CrossRef]
  80. Perry, M.E.; Teolis, B.D.; Hurley, D.M.; Magee, B.A.; Waite, J.H.; Brockwell, T.G.; Perryman, R.S.; McNutt, R.L. Cassini INMS measurements of Enceladus plume density. Icarus 2015, 257, 139–162. [Google Scholar] [CrossRef]
  81. Teolis, B.D.; Perry, M.E.; Hansen, C.J.; Waite, J.H.; Porco, C.C.; Spencer, J.R.; Howett, C.J.A. Enceladus Plume Structure and Time Variability: Comparison of Cassini Observations. Astrobiology 2017, 17, 926–940. [Google Scholar] [CrossRef] [Green Version]
  82. Fausch, R.G.; Moeller, G.; Rothacher, M.; Martinod, N.; Trébaol, T.; Villegas, A.; Kneib, J.-P.; Corthay, F.; Joss, M.; Tièche, F.; et al. CHESS: Measuring the Dynamics of Composition and Density of Earth’s Upper Atmosphere with CubeSats. IEEE Aerosp. Conf. 2022; in press. [Google Scholar]
  83. Lasi, D.; Meyer, S.; Piazza, D.; Luthi, M.; Nentwig, A.; Gruber, M.; Brungger, S.; Gerber, M.; Braccini, S.; Tulej, M.; et al. Decisions and Trade-Offs in the Design of a Mass Spectrometer for Jupiter’s Icy Moons. In Proceedings of the 2020 IEEE Aerospace Conference, Big Sky, MT, USA, 7–14 March 2020; pp. 1–20. [Google Scholar]
  84. Lasi, D.; Tulej, M.; Meyer, S.; Luthi, M.; Galli, A.; Piazza, D.; Wurz, P.; Reggiani, D.; Xiao, H.; Marcinkowski, R.; et al. Shielding an MCP Detector for a Space-Borne Mass Spectrometer Against the Harsh Radiation Environment in Jupiter’s Magnetosphere. IEEE Trans. Nucl. Sci. 2017, 64, 605–613. [Google Scholar] [CrossRef]
  85. Tulej, M.; Meyer, S.; Lüthi, M.; Lasi, D.; Galli, A.; Desorgher, L.; Hajdas, W.; Karlsson, S.; Kalla, L.; Wurz, P.; et al. Detection efficiency of microchannel plates for e− and π− in the momentum range from 17.5 to 345 MeV/c. Rev. Sci. Instrum. 2015, 86, 083310. [Google Scholar] [CrossRef] [PubMed] [Green Version]
  86. Tulej, M.; Meyer, S.; Lüthi, M.; Lasi, D.; Galli, A.; Piazza, D.; Desorgher, L.; Reggiani, D.; Hajdas, W.; Karlsson, S.; et al. Experimental investigation of the radiation shielding efficiency of a MCP detector in the radiation environment near Jupiter’s moon Europa. Nucl. Instrum. Methods Phys. Res. Sect. B Beam Interact. Mater. Atoms. 2016, 383, 21–37. [Google Scholar] [CrossRef]
  87. Hofer, L. Development of the Gas Chromatograph-Mass Spectrometer to Investigate Volatile Species in the Lunar Soil for the Luna-Resurs Mission. Ph.D. Thesis, University of Bern, Bern, Switzerland, 2015. [Google Scholar]
  88. Sephton, M.A.; Waite, J.H.; Brockwell, T.G. Searching for life with mass spectrometry. Astron. Geophys. 2018, 59, 3.23–3.24. [Google Scholar] [CrossRef]
  89. Snodgrass, C.; Jones, G.H. The European Space Agency’s Comet Interceptor lies in wait. Nat. Commun. 2019, 10, 5418. [Google Scholar] [CrossRef] [Green Version]
  90. Thomas, N.; Cremonese, G.; Ziethe, R.; Gerber, M.; Brändli, M.; Bruno, G.; Erismann, M.; Gambicorti, L.; Gerber, T.; Ghose, K.; et al. The Colour and Stereo Surface Imaging System (CaSSIS) for the ExoMars Trace Gas Orbiter. Space Sci. Rev. 2017, 212, 1897–1944. [Google Scholar] [CrossRef] [Green Version]
Figure 1. Outline of the ion-optical system (a) and its SIMION® model (b, to scale).
Universe 08 00416 g001
Figure 2. The transmission of this instrument is 1 in a cone half-angle ω of smaller than 3°. For larger cone half-angles, the transmission decreases so that the reliable mass range has to be shortened.
Universe 08 00416 g002
Figure 3. The mass resolution of this instrument is comparable to NIM’s mass resolution for higher masses, and even better for lower masses (see text for references). This performance is sufficient for resolving, e.g., 1H2D/3He and CH4/O, and thus answering related scientific questions.
Universe 08 00416 g003
Figure 4. The OpenTOF instrument resolves 3He+ and 1H2D+ (a) and 16O+ and CH4+ (b). The mass resolution of about 1400 (FWHM) at m/z 1000 constrains the mass range of the instrument (c).
Universe 08 00416 g004
Table 1. Data processing parameters of the OpenTOF instrument in relation to the relative encounter velocities to derive data rates and spatial resolution. An orbit analog is presented, if applicable. The spatial resolutions are presented for the low-cadence mode (low-c.m.) and the high-cadence mode (high-c.m.).
ScenarioJUICE-TypeEnceladus,
Europa
Io,
Enceladus
Max. Flyby Speed
Orbit analogJUICE-typeE7-typeE5-typeN/A
Flyby speed (km/s)~5 [56]7.7 [81]18 [34,81]20
Vertical resolution ADC10-bit14-bit12-bit14-bit
Spatial resolution low-c.m. (km)57.71820
Spatial resolution high-c.m. (km)0.50.81.82
Data rates low-c.m. (kB/s)28333033
Data rates high-c.m. (kB/s)234281257281
Table 2. Performance parameters of the instrument in comparison to available information of NIM/JUICE and MASPEX/Europa Clipper. Values for OpenTOF represent the findings of this study.
ParameterMASPEXNIM [25,38]OpenTOF
Velocity range with acceptable fragmentation, or no fragmentation, due to HVI0–~5 km/s [57]0–5 km/s0–20 km/s
Velocity range with severe HVI-induced fragmentationany [57]anyN/A
Mass range1–1500 [37]1–10001–1000
Max. mass resolution m/Δm (FHWM)up to ~35,000 [54]up to 1100up to 1500
Need for scanning to achieve mass resolutionyes [37]nono
Time to assess full mass spectrumnot known100 ms100 ms
Sensitivity~10−4 A/mbar~10−4 A/mbar~10−4 A/mbar
Characteristic length>400 mm [88]250 mm250 mm
Power consumptionunknown11 W11 W
Publisher’s Note: MDPI stays neutral with regard to jurisdictional claims in published maps and institutional affiliations.

