
The Past and Future of Mid-Infrared Studies of AGN


Abstract
1. Introduction
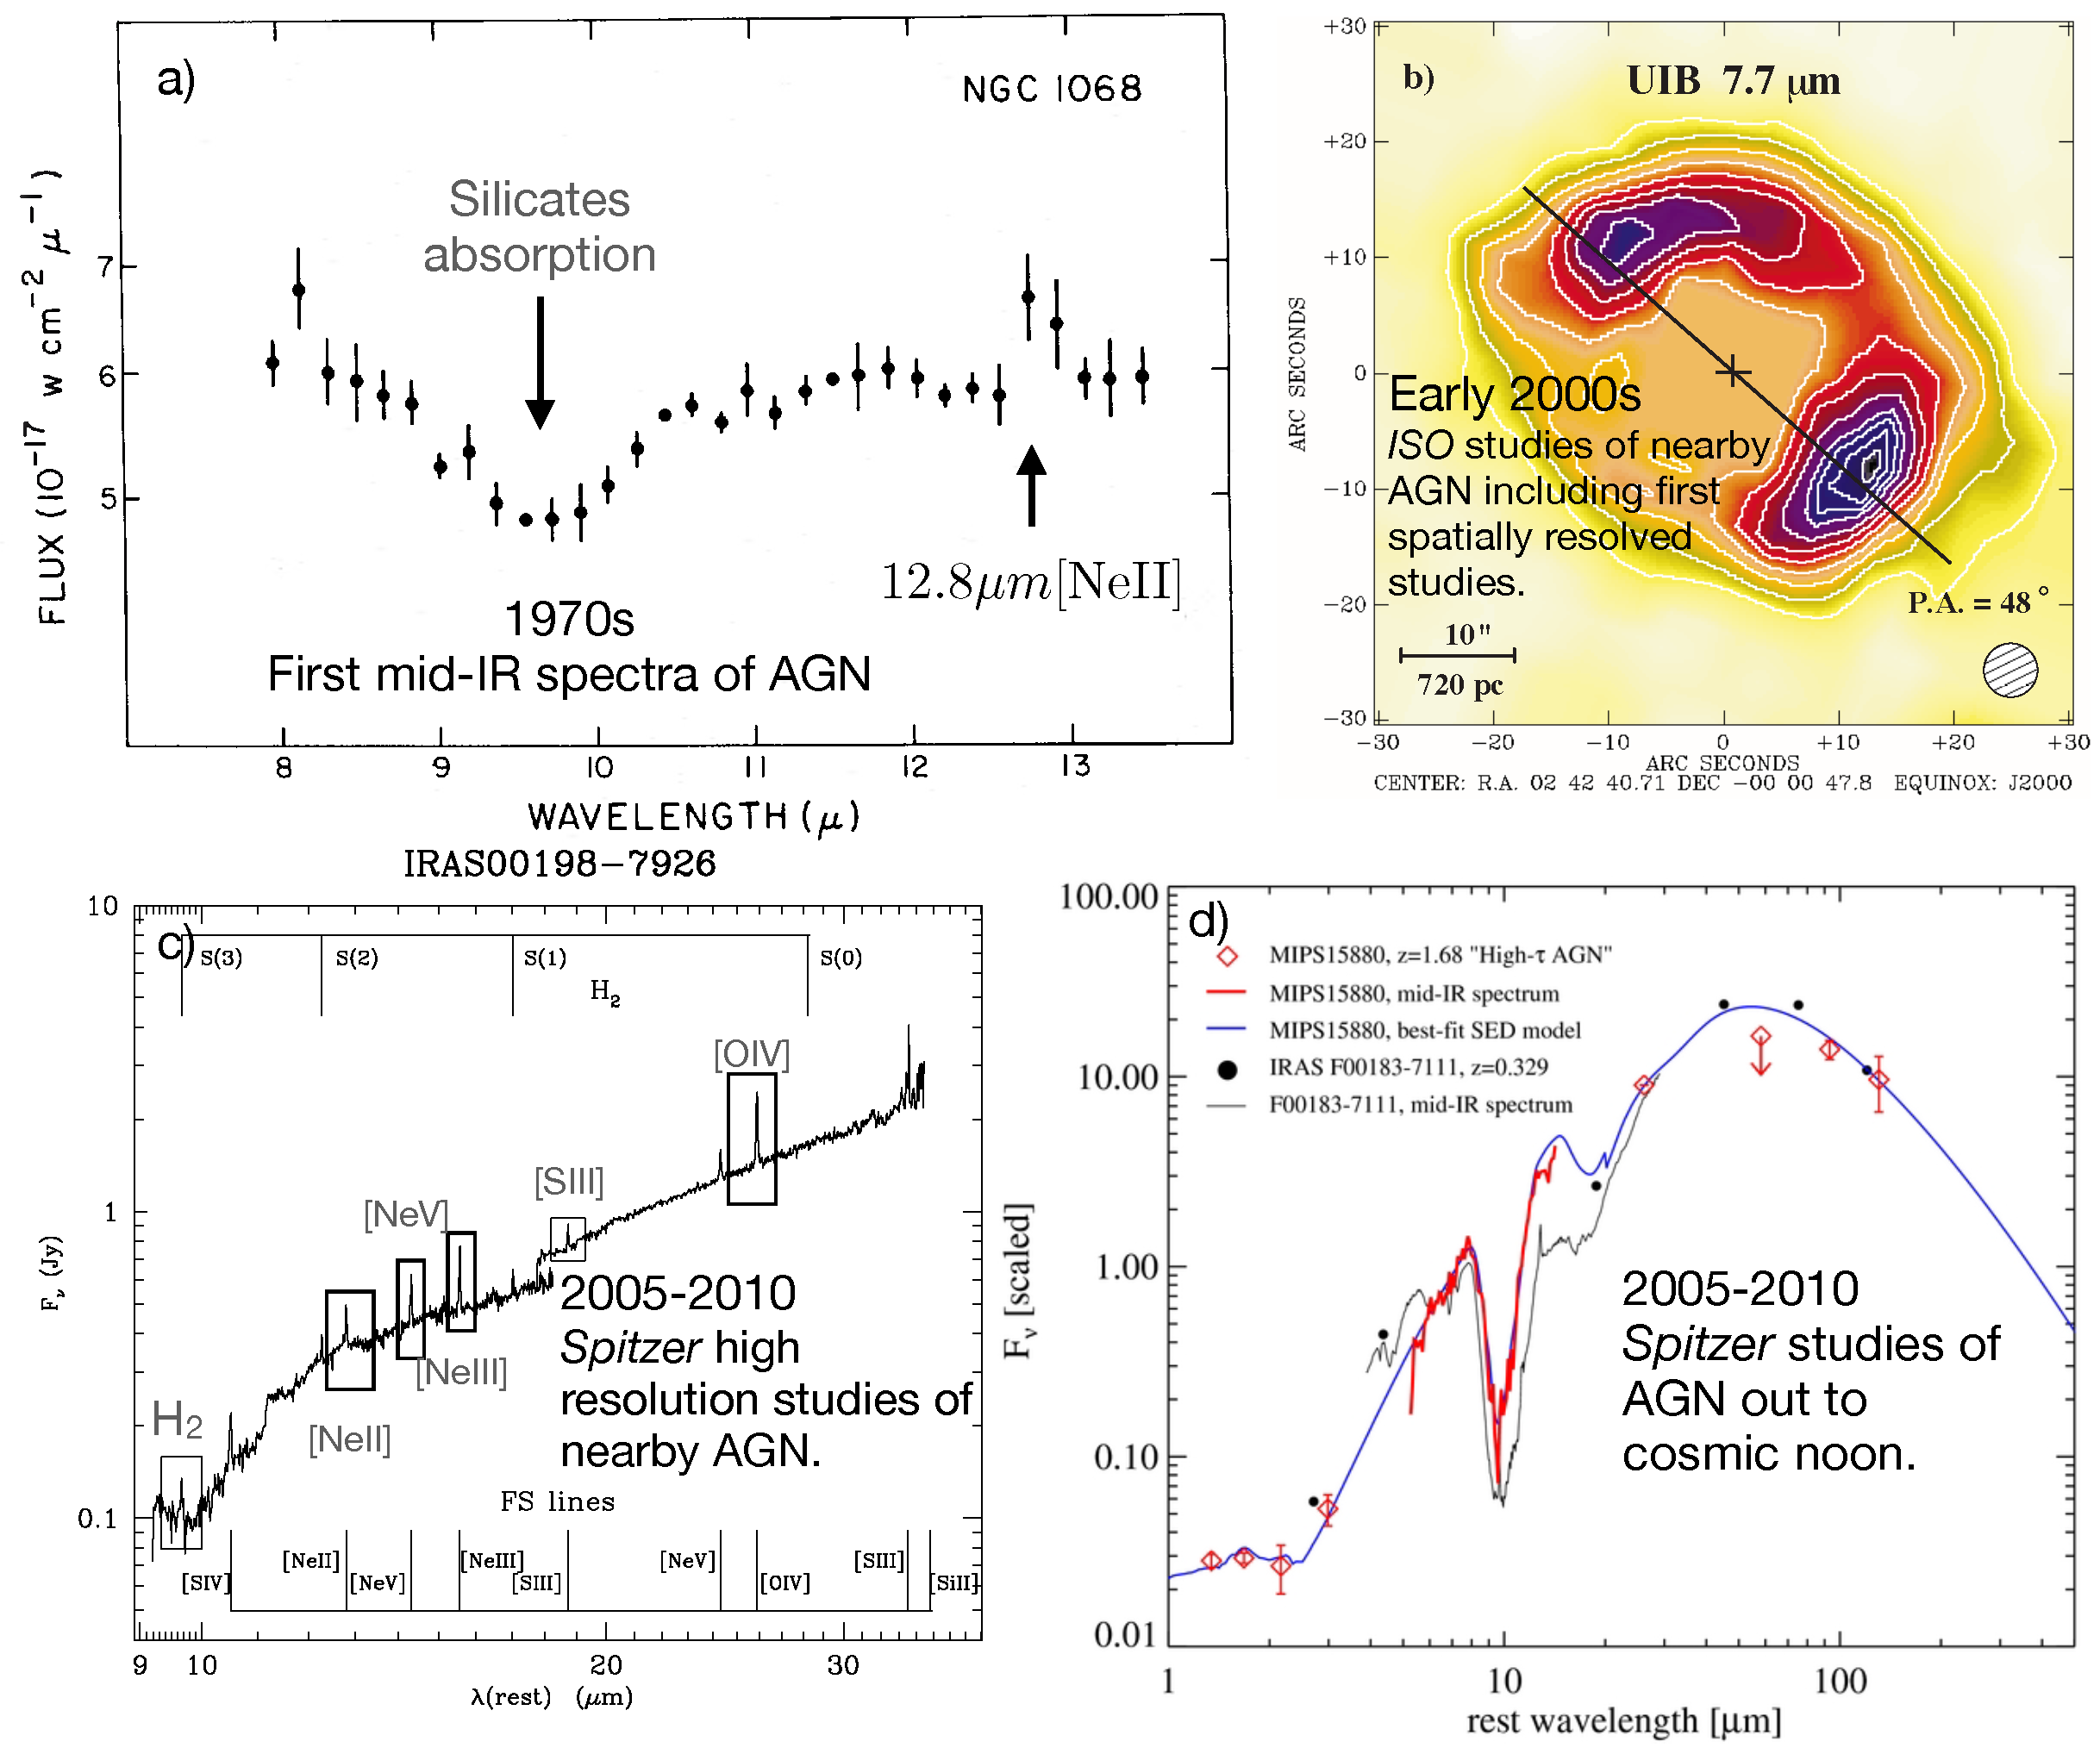
2. A Brief History
3. Observed Characteristics and Mid-IR AGN Demographics
3.1. The Observed AGN Mid-IR Emission
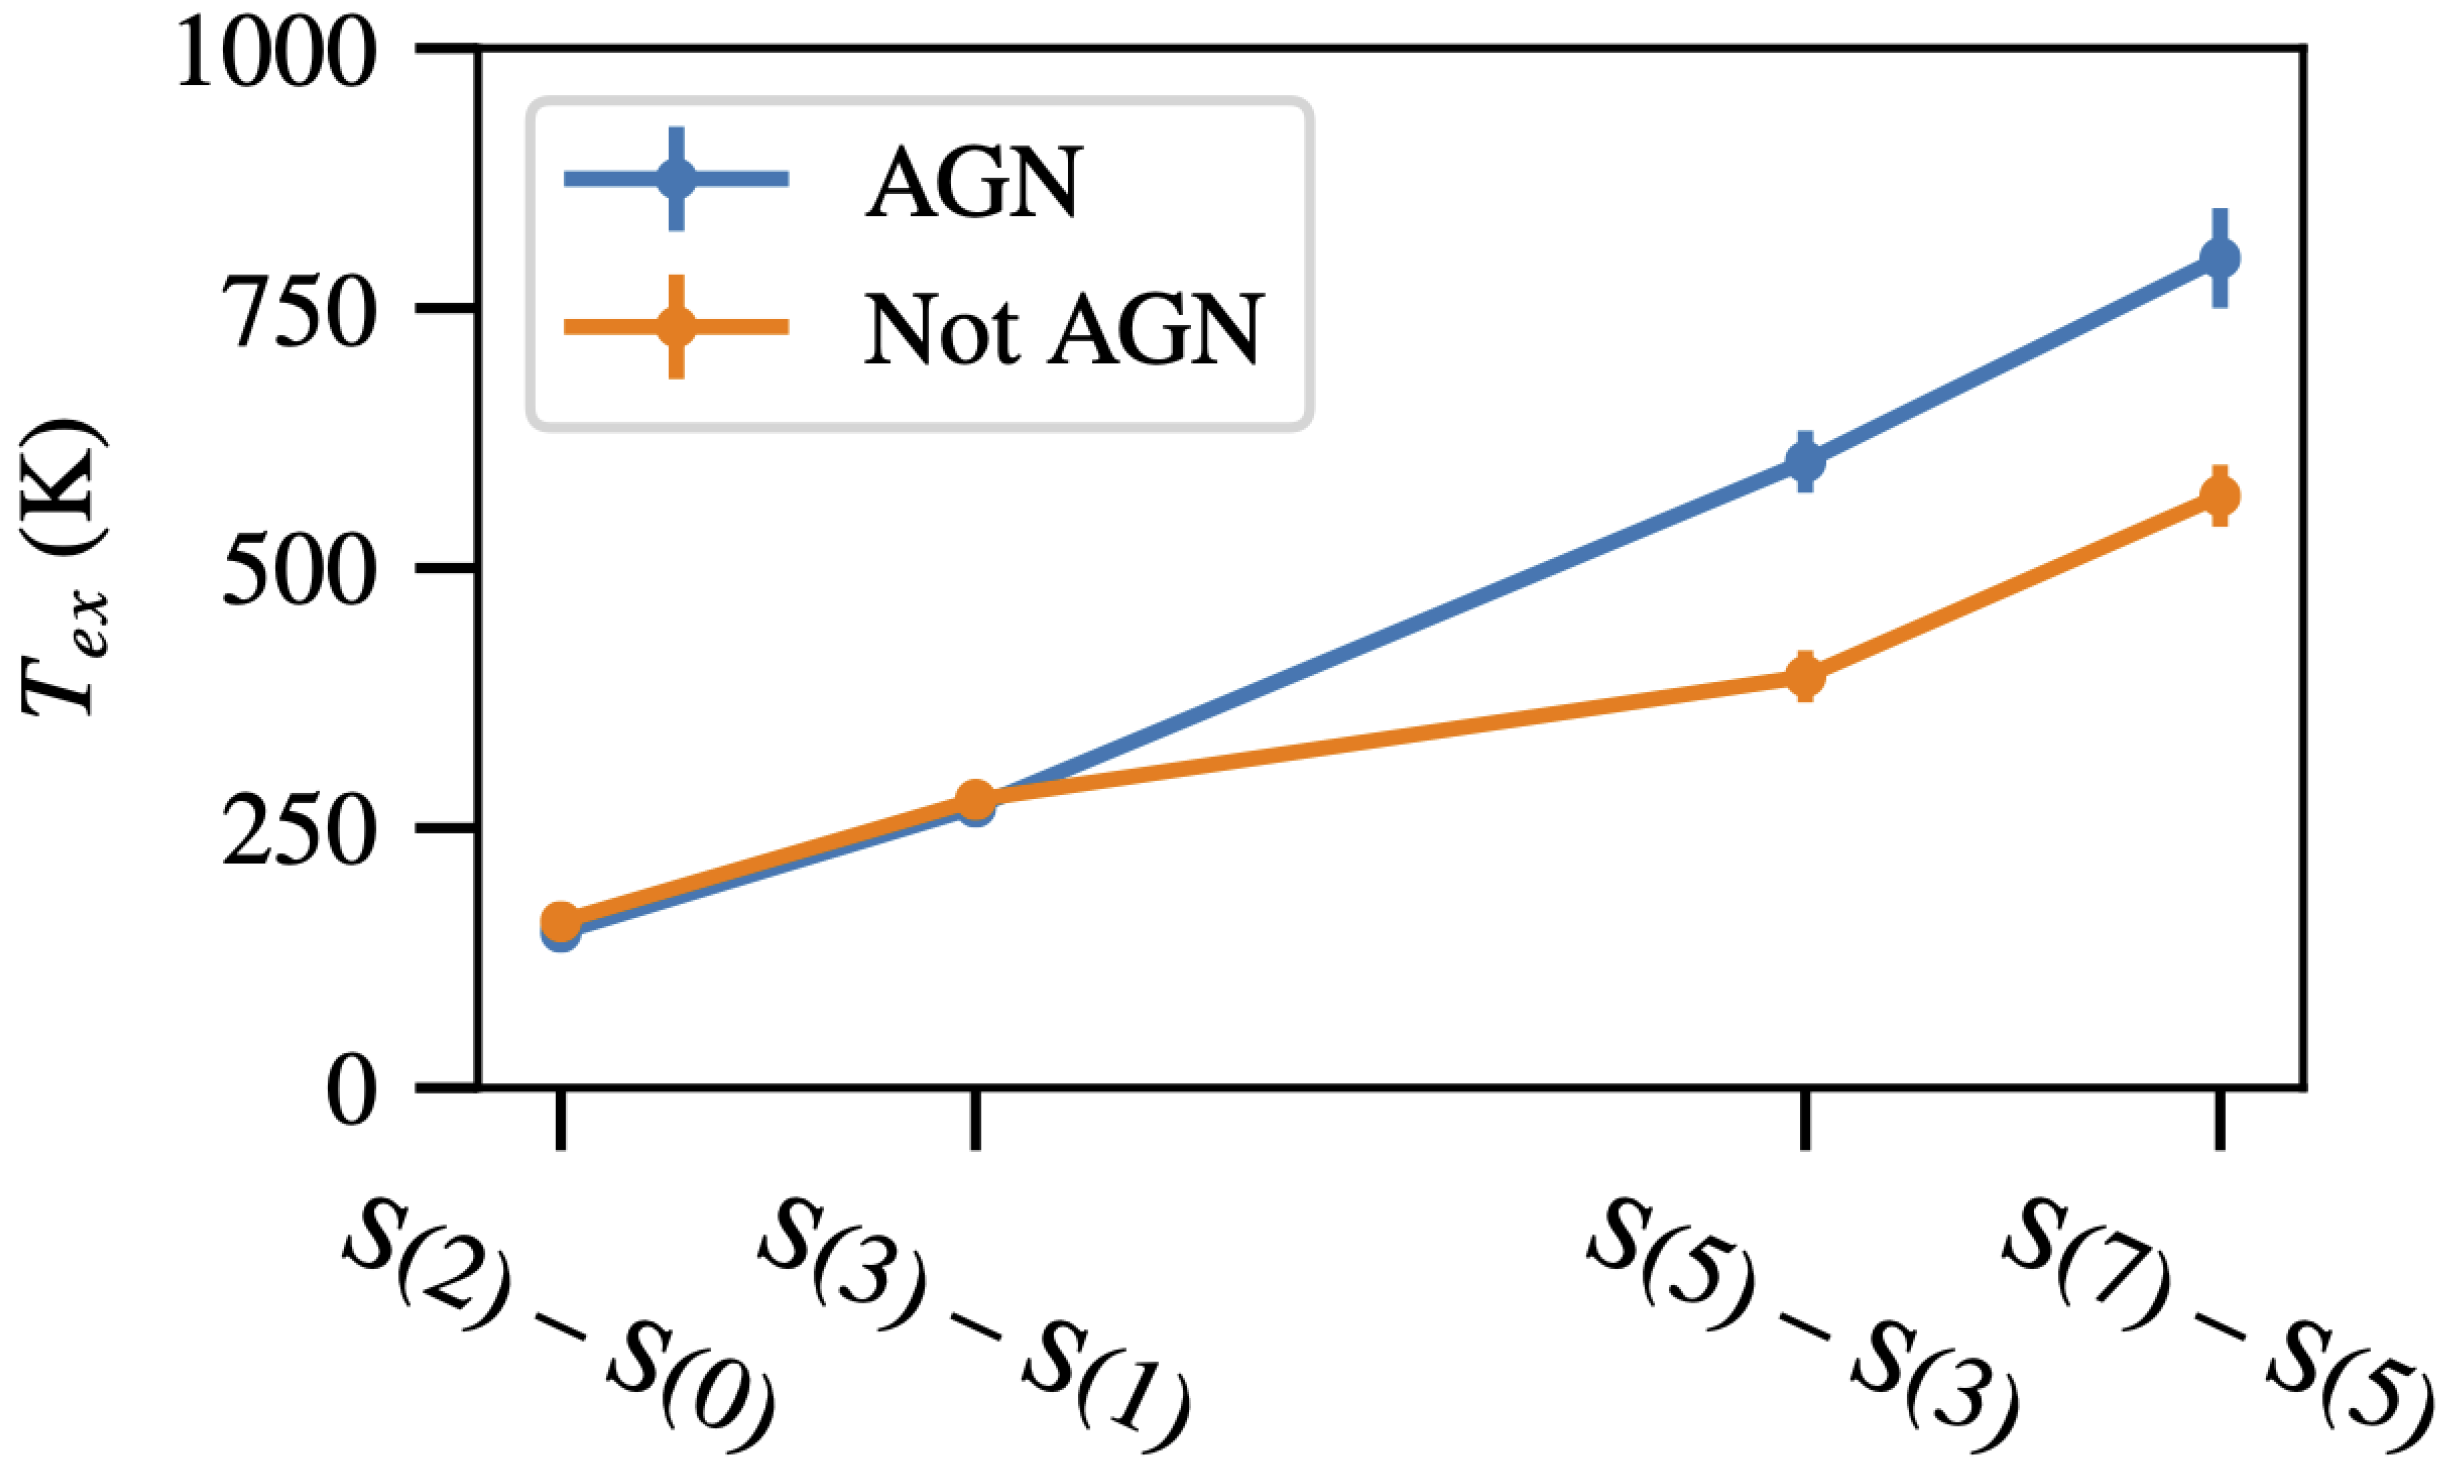
3.2. Fine Structure Mid-IR Lines
3.3. Mid-IR AGN Selection: Implications for AGN Demographics
3.3.1. Mid-IR AGN Selection Techniques
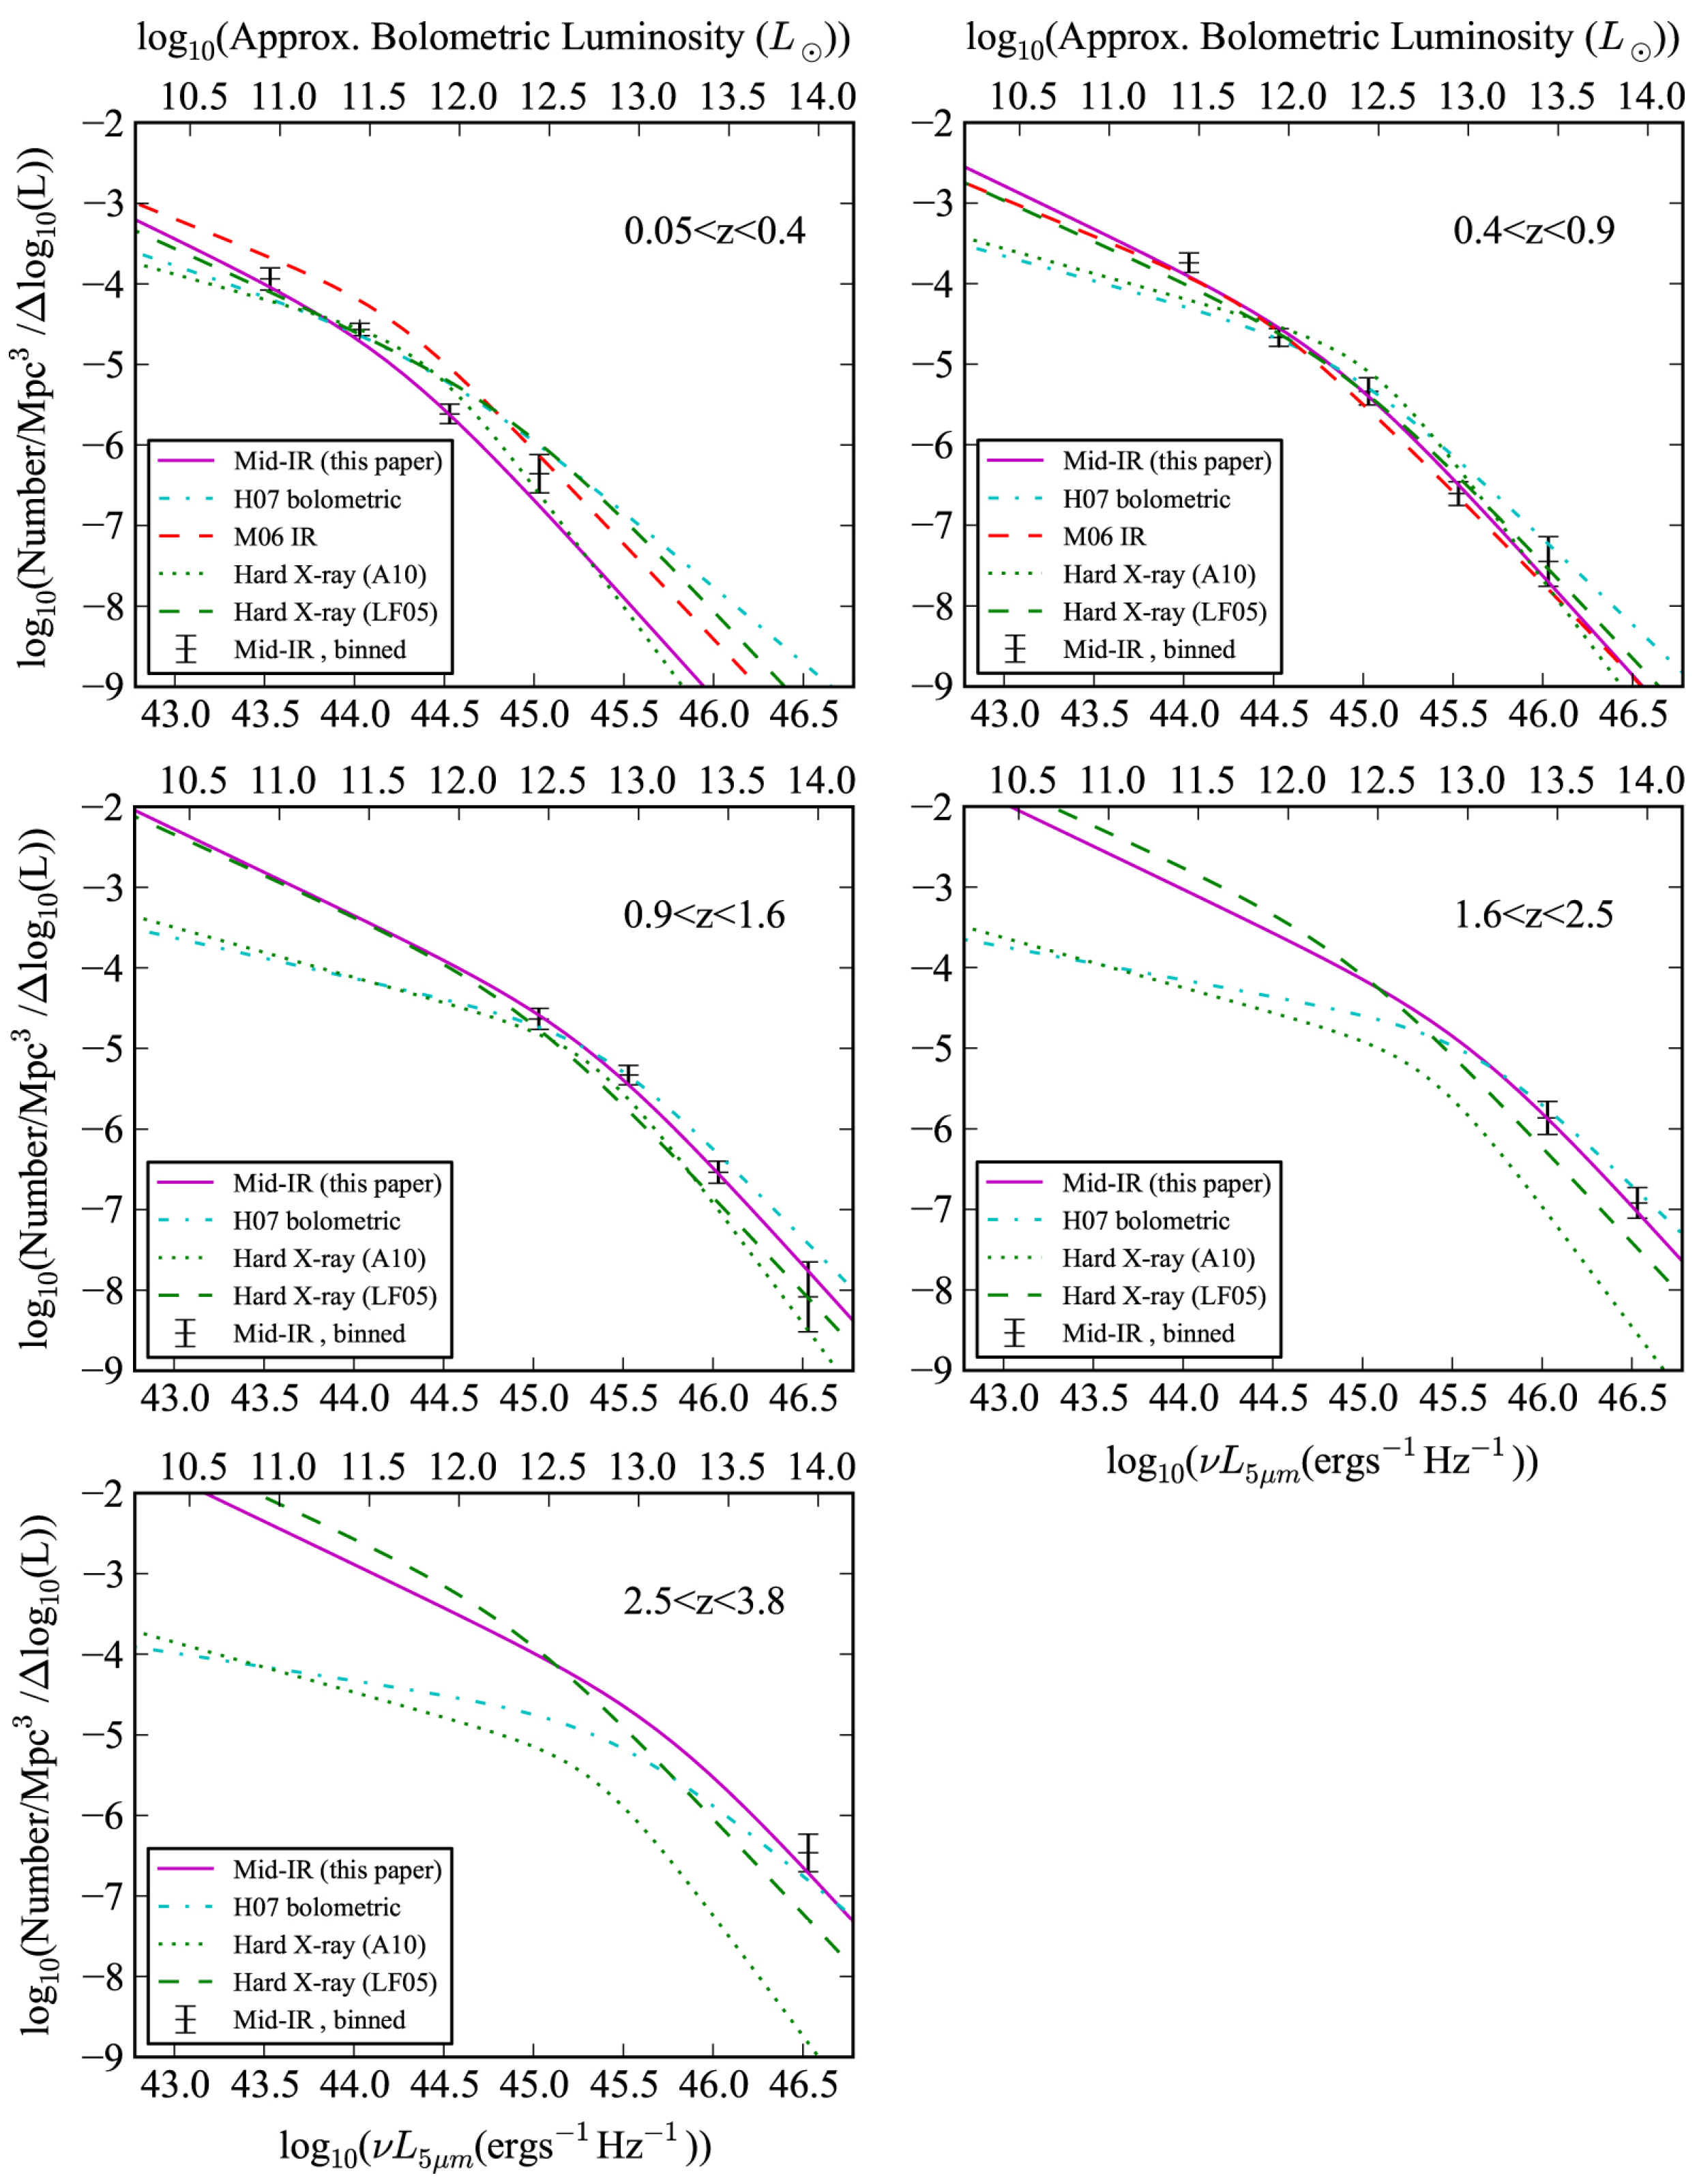
3.3.2. Mid-IR Luminosity Functions
3.3.3. Cosmic Black Hole Accretion Rate Density
3.3.4. Mid-IR Selection of AGN in Low-Mass Systems
4. Constraints on the Physical Properties of the AGN
4.1. Constraints on Black Hole Accretion Rate and Mass
4.2. Spatially Resolved Mid-IR Imaging: Our Evolving View of the Obscuring ‘Torus’
4.3. Mid-IR Variability as a Probe of the Obscuring Dust Structures
5. Impact of AGN on the Host Galaxy and Galaxy-BH Co-Evolution
5.1. Gas Properties around AGN
5.2. Dust Properties around AGN
5.3. Disentangling Star-Formation from AGN-Powered Dust Emission: A Key to AGN-Galaxy Co-Evolution Studies
6. Future Prospects
6.1. Overview Mid-IR Spectrographs
6.2. AGN Studies with JWST
6.2.1. MIRI Spectroscopy
6.2.2. MIRI Imaging
6.3. Mid-IR Diagnostics of AGN over Cosmic Time
7. Summary
Author Contributions
Funding
Institutional Review Board Statement
Informed Consent Statement
Data Availability Statement
Acknowledgments
Conflicts of Interest
Abbreviations
| AGN | Active Galactic Nuclei |
| BHAR | Black Hole Accretion Rate |
| BHARD | Black Hole Accretion Rate Density |
| EW | Equivalent Width |
| IFU | Integral Field Unit |
| ISM | Interstellar Medium |
| JWST | James Webb Space Telescope |
| MIRI | Mid-InfraRed Instrument (on JWST) |
| PAH | Polycyclic Aromatic Hydrocarbons |
| PDR | Photodissociation Region or Photon-Dominated Region |
| SED | Spectral Energy Distribution |
| SFR | Star Formation Rate |
| SFRD | Star Formation Rate Density |
| SLED | Spectral Line Energy Distribution |
| SMBH | Super Massive Black Hole |
| XDR | X-ray Dominated Region |
| 1 | See also Lacy and Sajina [18] for a recent review of AGN studies with Spitzer. |
| 2 | At the time, these features were designated UIB or Unidentified Infrared Bands. |
| 3 | Quantified by , the ratio of the fluxes at respectively 15 m to 5 m. |
| 4 | http://ideos.astro.cornell.edu/, accessed on 3 June 2022. |
| 5 | This is also called the Eddington ratio and can be written as . The Eddington luminosity, , is a function of the black hole mass only. |
| 6 | https://jwst-docs.stsci.edu/jwst-mid-infrared-instrument, accessed on 3 June 2022. |
References
- Magorrian, J.; Tremaine, S.; Richstone, D.; Bender, R.; Bower, G.; Dressler, A.; Faber, S.M.; Gebhardt, K.; Green, R.; Grillmair, C.; et al. The Demography of Massive Dark Objects in Galaxy Centers. Astron. J. 1998, 115, 2285–2305. [Google Scholar] [CrossRef]
- Gültekin, K.; Richstone, D.O.; Gebhardt, K.; Lauer, T.R.; Tremaine, S.; Aller, M.C.; Bender, R.; Dressler, A.; Faber, S.M.; Filippenko, A.V.; et al. The M-σ and M-L Relations in Galactic Bulges, and Determinations of Their Intrinsic Scatter. Astrophys. J. 2009, 698, 198–221. [Google Scholar] [CrossRef]
- Madau, P.; Dickinson, M. Cosmic Star-Formation History. Annu. Rev. Aston. Astrophys. 2014, 52, 415–486. [Google Scholar] [CrossRef]
- Heckman, T.M.; Best, P.N. The Coevolution of Galaxies and Supermassive Black Holes: Insights from Surveys of the Contemporary Universe. Ann. Rev. Astron. Astrophys. 2014, 52, 589–660. [Google Scholar] [CrossRef]
- Padovani, P.; Alexander, D.M.; Assef, R.J.; De Marco, B.; Giommi, P.; Hickox, R.C.; Richards, G.T.; Smolčić, V.; Hatziminaoglou, E.; Mainieri, V.; et al. Active galactic nuclei: What’s in a name? Astron. Astrophys. Rev. 2017, 25, 2. [Google Scholar] [CrossRef]
- Netzer, H. Revisiting the Unified Model of Active Galactic Nuclei. Ann. Rev. Astron. Astrophys. 2015, 53, 365–408. [Google Scholar] [CrossRef]
- Hopkins, P.F.; Hernquist, L.; Cox, T.J.; Kereš, D. A Cosmological Framework for the Co-Evolution of Quasars, Supermassive Black Holes, and Elliptical Galaxies. I. Galaxy Mergers and Quasar Activity. Astrophys. J. Suppl. 2008, 175, 356–389. [Google Scholar] [CrossRef]
- Sajina, A.; Yan, L.; Fadda, D.; Dasyra, K.; Huynh, M. Spitzer- and Herschel-based Spectral Energy Distributions of 24 μm Bright z ~ 0.3–3.0 Starbursts and Obscured Quasars. Astrophys. J. 2012, 757, 13. [Google Scholar] [CrossRef]
- Kirkpatrick, A.; Pope, A.; Alexander, D.M.; Charmandaris, V.; Daddi, E.; Dickinson, M.; Elbaz, D.; Gabor, J.; Hwang, H.S.; Ivison, R.; et al. GOODS-Herschel: Impact of Active Galactic Nuclei and Star Formation Activity on Infrared Spectral Energy Distributions at High Redshift. Astrophys. J. 2012, 759, 139. [Google Scholar] [CrossRef]
- Kirkpatrick, A.; Pope, A.; Sajina, A.; Roebuck, E.; Yan, L.; Armus, L.; Díaz-Santos, T.; Stierwalt, S. The Role of Star Formation and an AGN in Dust Heating of z = 0.3–2.8 Galaxies. I. Evolution with Redshift and Luminosity. Astrophys. J. 2015, 814, 9. [Google Scholar] [CrossRef]
- Zamojski, M.; Yan, L.; Dasyra, K.; Sajina, A.; Surace, J.; Heckman, T.; Helou, G. HST/NICMOS Imaging of Bright High-redshift 24 μm Selected Galaxies: Merging Properties. Astrophys. J. 2011, 730, 125. [Google Scholar] [CrossRef]
- Kocevski, D.D.; Brightman, M.; Nandra, K.; Koekemoer, A.M.; Salvato, M.; Aird, J.; Bell, E.F.; Hsu, L.T.; Kartaltepe, J.S.; Koo, D.C.; et al. Are Compton-thick AGNs the Missing Link between Mergers and Black Hole Growth? Astrophys. J. 2015, 814, 104. [Google Scholar] [CrossRef]
- Treister, E.; Schawinski, K.; Urry, C.M.; Simmons, B.D. Major Galaxy Mergers Only Trigger the Most Luminous Active Galactic Nuclei. Astrophys. J. Lett. 2012, 758, L39. [Google Scholar] [CrossRef]
- Hickox, R.C.; Alexander, D.M. Obscured Active Galactic Nuclei. Ann. Rev. Astron. Astrophys. 2018, 56, 625–671. [Google Scholar] [CrossRef]
- Kormendy, J.; Ho, L.C. Coevolution (Or Not) of Supermassive Black Holes and Host Galaxies. Ann. Rev. Astron. Astrophys. 2013, 51, 511–653. [Google Scholar] [CrossRef]
- Lambrides, E.L.; Chiaberge, M.; Heckman, T.; Kirkpatrick, A.; Meyer, E.T.; Petric, A.; Hall, K.; Long, A.; Watts, D.J.; Gilli, R.; et al. Lower-luminosity Obscured AGN Host Galaxies Are Not Predominantly in Major-merging Systems at Cosmic Noon. Astrophys. J. 2021, 919, 129. [Google Scholar] [CrossRef]
- Gilli, R.; Comastri, A.; Hasinger, G. The synthesis of the cosmic X-ray background in the Chandra and XMM-Newton era. Astron. Astrophys. 2007, 463, 79–96. [Google Scholar] [CrossRef]
- Lacy, M.; Sajina, A. Active galactic nuclei as seen by the Spitzer Space Telescope. Nat. Astron. 2020, 4, 352–363. [Google Scholar] [CrossRef]
- Runburg, J.; Farrah, D.; Sajina, A.; Lacy, M.; Lidua, J.; Hatziminaoglou, E.; Brandt, W.N.; Chen, C.T.J.; Nyland, K.; Shirley, R.; et al. Consistent Analysis of the AGN LF in X-Ray and MIR in the XMM-LSS Field. Astrophys. J. 2022, 924, 133. [Google Scholar] [CrossRef]
- Lacy, M.; Storrie-Lombardi, L.J.; Sajina, A.; Appleton, P.N.; Armus, L.; Chapman, S.C.; Choi, P.I.; Fadda, D.; Fang, F.; Frayer, D.T.; et al. Obscured and Unobscured Active Galactic Nuclei in the Spitzer Space Telescope First Look Survey. Astrophys. J. Suppl. 2004, 154, 166–169. [Google Scholar] [CrossRef]
- Stern, D.; Eisenhardt, P.; Gorjian, V.; Kochanek, C.S.; Caldwell, N.; Eisenstein, D.; Brodwin, M.; Brown, M.J.I.; Cool, R.; Dey, A.; et al. Mid-Infrared Selection of Active Galaxies. Astrophys. J. 2005, 631, 163–168. [Google Scholar] [CrossRef]
- Donley, J.L.; Rieke, G.H.; Pérez-González, P.G.; Rigby, J.R.; Alonso-Herrero, A. Spitzer Power-Law Active Galactic Nucleus Candidates in the Chandra Deep Field-North. Astrophys. J. 2007, 660, 167–190. [Google Scholar] [CrossRef][Green Version]
- Dey, A.; Soifer, B.T.; Desai, V.; Brand, K.; Le Floc’h, E.; Brown, M.J.I.; Jannuzi, B.T.; Armus, L.; Bussmann, S.; Brodwin, M.; et al. A Significant Population of Very Luminous Dust-Obscured Galaxies at Redshift z ∼ 2. Astrophys. J. 2008, 677, 943–956. [Google Scholar] [CrossRef]
- Assef, R.J.; Eisenhardt, P.R.M.; Stern, D.; Tsai, C.W.; Wu, J.; Wylezalek, D.; Blain, A.W.; Bridge, C.R.; Donoso, E.; Gonzales, A.; et al. Half of the Most Luminous Quasars May Be Obscured: Investigating the Nature of WISE-Selected Hot Dust-Obscured Galaxies. Astrophys. J. 2015, 804, 27. [Google Scholar] [CrossRef]
- Packham, C.; Radomski, J.T.; Roche, P.F.; Aitken, D.K.; Perlman, E.; Alonso-Herrero, A.; Colina, L.; Telesco, C.M. The Extended Mid-Infrared Structure of the Circinus Galaxy. Astrophys. J. Lett. 2005, 618, L17–L20. [Google Scholar] [CrossRef]
- Roche, P.F.; Packham, C.; Telesco, C.M.; Radomski, J.T.; Alonso-Herrero, A.; Aitken, D.K.; Colina, L.; Perlman, E. Mid-infrared, spatially resolved spectroscopy of the nucleus of the Circinus galaxy. Mon. Not. R. Astron. Soc. 2006, 367, 1689–1698. [Google Scholar] [CrossRef]
- Hönig, S.F.; Kishimoto, M.; Gandhi, P.; Smette, A.; Asmus, D.; Duschl, W.; Polletta, M.; Weigelt, G. The dusty heart of nearby active galaxies. I. High-spatial resolution mid-IR spectro-photometry of Seyfert galaxies. Astron. Astrophys. 2010, 515, A23. [Google Scholar] [CrossRef]
- Alonso-Herrero, A.; Poulton, R.; Roche, P.F.; Hernán-Caballero, A.; Aretxaga, I.; Martínez-Paredes, M.; Ramos Almeida, C.; Pereira-Santaella, M.; Díaz-Santos, T.; Levenson, N.A.; et al. The complex evolutionary paths of local infrared bright galaxies: A high-angular resolution mid-infrared view. Mon. Not. R. Astron. Soc. 2016, 463, 2405–2424. [Google Scholar] [CrossRef]
- Lyu, J.; Rieke, G.H.; Smith, P.S. Mid-IR Variability and Dust Reverberation Mapping of Low-z Quasars. I. Data, Methods, and Basic Results. Astrophys. J. 2019, 886, 33. [Google Scholar] [CrossRef]
- Juneau, S.; Goulding, A.D.; Banfield, J.; Bianchi, S.; Duc, P.A.; Ho, I.T.; Dopita, M.A.; Scharwächter, J.; Bauer, F.E.; Groves, B.; et al. The Black Hole-Galaxy Connection: Interplay between Feedback, Obscuration, and Host Galaxy Substructure. Astrophys. J. 2022, 925, 203. [Google Scholar] [CrossRef]
- Kessler, M.F.; Steinz, J.A.; Anderegg, M.E.; Clavel, J.; Drechsel, G.; Estaria, P.; Faelker, J.; Riedinger, J.R.; Robson, A.; Taylor, B.G.; et al. The Infrared Space Observatory (ISO) mission. Astron. Astrophys. 1996, 315, L27–L31. [Google Scholar] [CrossRef]
- Werner, M.W.; Roellig, T.L.; Low, F.J.; Rieke, G.H.; Rieke, M.; Hoffmann, W.F.; Young, E.; Houck, J.R.; Brandl, B.; Fazio, G.G.; et al. The Spitzer Space Telescope Mission. Astrophys. J. Suppl. 2004, 154, 1–9. [Google Scholar] [CrossRef]
- Wright, E.L.; Eisenhardt, P.R.M.; Mainzer, A.K.; Ressler, M.E.; Cutri, R.M.; Jarrett, T.; Kirkpatrick, J.D.; Padgett, D.; McMillan, R.S.; Skrutskie, M.; et al. The Wide-field Infrared Survey Explorer (WISE): Mission Description and Initial On-orbit Performance. Astron. J. 2010, 140, 1868–1881. [Google Scholar] [CrossRef]
- Leinert, C.; Graser, U.; Przygodda, F.; Waters, L.B.F.M.; Perrin, G.; Jaffe, W.; Lopez, B.; Bakker, E.J.; Böhm, A.; Chesneau, O.; et al. MIDI—The 10 μm instrument on the VLTI. Astrophys. Space Sci. 2003, 286, 73–83. [Google Scholar] [CrossRef]
- Lopez, B.; Lagarde, S.; Petrov, R.G.; Jaffe, W.; Antonelli, P.; Allouche, F.; Berio, P.; Matter, A.; Meilland, A.; Millour, F.; et al. MATISSE, the VLTI mid-infrared imaging spectro-interferometer. Astron. Astrophys. 2022, 659, A192. [Google Scholar] [CrossRef]
- Rieke, G.H.; Wright, G.S.; Böker, T.; Bouwman, J.; Colina, L.; Glasse, A.; Gordon, K.D.; Greene, T.P.; Güdel, M.; Henning, T.; et al. The Mid-Infrared Instrument for the James Webb Space Telescope, I: Introduction. Publ. Astron. Soc. Pac. 2015, 127, 584. [Google Scholar] [CrossRef]
- Rogalski, A. History of infrared detectors. Opto-Electron. Rev. 2012, 20, 279–308. [Google Scholar] [CrossRef]
- Low, F.J.; Johnson, H.L. The Spectrum of 3c 273. Astrophys. J. 1965, 141, 336. [Google Scholar] [CrossRef]
- Low, J.; Kleinmann, D.E. Proceedings of the Conference on Seyfert Galaxies and Related Objects: 17. Infrared Observations of Seyfert Galaxies, Quasistellar Sources, and Planetary Nebulae. Astron. J. 1968, 73, 868. [Google Scholar] [CrossRef]
- Rees, M.J.; Silk, J.I.; Werner, M.W.; Wickramasinghe, N.C. Infrared Radiation from Dust in Seyfert Galaxies. Nature 1969, 223, 788–791. [Google Scholar] [CrossRef]
- Rieke, G.H.; Low, F.J. Infrared Photometry of Extragalactic Sources. Astrophys. J. Lett. 1972, 176, L95. [Google Scholar] [CrossRef]
- Rieke, G.H.; Low, F.J. Variability of Extragalactic Sources at 10 Microns. Astrophys. J. Lett. 1972, 177, L115. [Google Scholar] [CrossRef]
- Gillett, F.C.; Kleinmann, D.E.; Wright, E.L.; Capps, R.W. Observations of M82 and NGC 253 at 8–13 microns. Astrophys. J. Lett. 1975, 198, L65–L68. [Google Scholar] [CrossRef]
- Kleinmann, D.E.; Gillett, F.C.; Wright, E.L. 8–13 Micron Spectrophotometry of NGC 1068. Astrophys. J. 1976, 208, 42–46. [Google Scholar] [CrossRef]
- Lebofsky, M.J.; Rieke, G.H. Extinction in infrared-emitting galactic nuclei. Astrophys. J. 1979, 229, 111–117. [Google Scholar] [CrossRef]
- Russell, R.W.; Soifer, B.T.; Merrill, K.M. Observations of the unidentified 3.3 micrometer emission feature in nebulae. Astrophys. J. 1977, 213, 66–70. [Google Scholar] [CrossRef]
- Russell, R.W.; Soifer, B.T.; Willner, S.P. The 4 to 8 micron spectrum of NGC 7027. Astrophys. J. Lett. 1977, 217, L149. [Google Scholar] [CrossRef]
- Neugebauer, G.; Habing, H.J.; van Duinen, R.; Aumann, H.H.; Baud, B.; Beichman, C.A.; Beintema, D.A.; Boggess, N.; Clegg, P.E.; de Jong, T.; et al. The Infrared Astronomical Satellite (IRAS) mission. Astrophys. J. Lett. 1984, 278, L1–L6. [Google Scholar] [CrossRef]
- Gehrz, R.D.; Roellig, T.L.; Werner, M.W.; Fazio, G.G.; Houck, J.R.; Low, F.J.; Rieke, G.H.; Soifer, B.T.; Levine, D.A.; Romana, E.A. The NASA Spitzer Space Telescope. Rev. Sci. Instrum. 2007, 78, 11302. [Google Scholar] [CrossRef]
- Le Floc’h, E.; Mirabel, I.F.; Laurent, O.; Charmandaris, V.; Gallais, P.; Sauvage, M.; Vigroux, L.; Cesarsky, C. Mid-Infrared observations of NGC 1068 with the Infrared Space Observatory. Astron. Astrophys. 2001, 367, 487–497. [Google Scholar] [CrossRef][Green Version]
- Tommasin, S.; Spinoglio, L.; Malkan, M.A.; Smith, H.; González-Alfonso, E.; Charmandaris, V. Spitzer IRS High-Resolution Spectroscopy of the 12 μm Seyfert Galaxies. I. First Results. Astrophys. J. 2008, 676, 836–856. [Google Scholar] [CrossRef]
- Yan, L.; Sajina, A.; Fadda, D.; Choi, P.; Armus, L.; Helou, G.; Teplitz, H.; Frayer, D.; Surace, J. Spitzer Mid-Infrared Spectroscopy of Infrared Luminous Galaxies at z ~2. I. The Spectra. Astrophys. J. 2007, 658, 778–793. [Google Scholar] [CrossRef]
- Sajina, A.; Yan, L.; Armus, L.; Choi, P.; Fadda, D.; Helou, G.; Spoon, H. Spitzer Mid-Infrared Spectroscopy of Infrared Luminous Galaxies at z~2. II. Diagnostics. Astrophys. J. 2007, 664, 713–737. [Google Scholar] [CrossRef]
- Pope, A.; Bussmann, R.S.; Dey, A.; Meger, N.; Alexander, D.M.; Brodwin, M.; Chary, R.R.; Dickinson, M.E.; Frayer, D.T.; Greve, T.R.; et al. The Nature of Faint Spitzer-selected Dust-obscured Galaxies. Astrophys. J. 2008, 689, 127–133. [Google Scholar] [CrossRef]
- Dasyra, K.M.; Ho, L.C.; Armus, L.; Ogle, P.; Helou, G.; Peterson, B.M.; Lutz, D.; Netzer, H.; Sturm, E. High-Ionization Mid-Infrared Lines as Black Hole Mass and Bolometric Luminosity Indicators in Active Galactic Nuclei. Astrophys. J. Lett. 2008, 674, L9. [Google Scholar] [CrossRef]
- Martínez-Sansigre, A.; Lacy, M.; Sajina, A.; Rawlings, S. Mid-Infrared Spectroscopy of High-Redshift Obscured Quasars. Astrophys. J. 2008, 674, 676–685. [Google Scholar] [CrossRef][Green Version]
- Seymour, N.; Ogle, P.; De Breuck, C.; Fazio, G.G.; Galametz, A.; Haas, M.; Lacy, M.; Sajina, A.; Stern, D.; Willner, S.P.; et al. Mid-Infrared Spectra of High-Redshift (z > 2) Radio Galaxies. Astrophys. J. Lett. 2008, 681, L1. [Google Scholar] [CrossRef]
- Fadda, D.; Yan, L.; Lagache, G.; Sajina, A.; Lutz, D.; Wuyts, S.; Frayer, D.T.; Marcillac, D.; Le Floc’h, E.; Caputi, K.; et al. Ultra-deep Mid-infrared Spectroscopy of Luminous Infrared Galaxies at z ~ 1 and z ~ 2. Astrophys. J. 2010, 719, 425–450. [Google Scholar] [CrossRef]
- Genzel, R.; Lutz, D.; Sturm, E.; Egami, E.; Kunze, D.; Moorwood, A.F.M.; Rigopoulou, D.; Spoon, H.W.W.; Sternberg, A.; Tacconi-Garman, L.E.; et al. What Powers Ultraluminous IRAS Galaxies? Astrophys. J. 1998, 498, 579–605. [Google Scholar] [CrossRef]
- Sturm, E.; Lutz, D.; Tran, D.; Feuchtgruber, H.; Genzel, R.; Kunze, D.; Moorwood, A.F.M.; Thornley, M.D. ISO-SWS spectra of galaxies: Continuum and features. Astron. Astrophys. 2000, 358, 481–493. [Google Scholar]
- Brandl, B.R.; Bernard-Salas, J.; Spoon, H.W.W.; Devost, D.; Sloan, G.C.; Guilles, S.; Wu, Y.; Houck, J.R.; Weedman, D.W.; Armus, L.; et al. The Mid-Infrared Properties of Starburst Galaxies from Spitzer-IRS Spectroscopy. Astrophys. J. 2006, 653, 1129–1144. [Google Scholar] [CrossRef]
- Shipley, H.V.; Papovich, C.; Rieke, G.H.; Brown, M.J.I.; Moustakas, J. A New Star Formation Rate Calibration from Polycyclic Aromatic Hydrocarbon Emission Features and Application to High-redshift Galaxies. Astrophys. J. 2016, 818, 60. [Google Scholar] [CrossRef]
- Hernán-Caballero, A.; Pérez-Fournon, I.; Hatziminaoglou, E.; Afonso-Luis, A.; Rowan-Robinson, M.; Rigopoulou, D.; Farrah, D.; Lonsdale, C.J.; Babbedge, T.; Clements, D.; et al. Mid-infrared spectroscopy of infrared-luminous galaxies at z ~ 0.5–3. Mon. Not. R. Astron. Soc. 2009, 395, 1695–1722. [Google Scholar] [CrossRef][Green Version]
- Hernán-Caballero, A.; Hatziminaoglou, E. An atlas of mid-infrared spectra of star-forming and active galaxies. Mon. Not. R. Astron. Soc. 2011, 414, 500–511. [Google Scholar] [CrossRef]
- Esquej, P.; Alonso-Herrero, A.; González-Martín, O.; Hönig, S.F.; Hernán-Caballero, A.; Roche, P.; Ramos Almeida, C.; Mason, R.E.; Díaz-Santos, T.; Levenson, N.A.; et al. Nuclear Star Formation Activity and Black Hole Accretion in Nearby Seyfert Galaxies. Astrophys. J. 2014, 780, 86. [Google Scholar] [CrossRef]
- Alonso-Herrero, A.; Ramos Almeida, C.; Esquej, P.; Roche, P.F.; Hernán-Caballero, A.; Hönig, S.F.; González-Martín, O.; Aretxaga, I.; Mason, R.E.; Packham, C.; et al. Nuclear 11.3 μm PAH emission in local active galactic nuclei. Mon. Not. R. Astron. Soc. 2014, 443, 2766–2782. [Google Scholar] [CrossRef]
- Inami, H.; Armus, L.; Charmandaris, V.; Groves, B.; Kewley, L.; Petric, A.; Stierwalt, S.; Díaz-Santos, T.; Surace, J.; Rich, J.; et al. Mid-infrared Atomic Fine-structure Emission-line Spectra of Luminous Infrared Galaxies: Spitzer/IRS Spectra of the GOALS Sample. Astrophys. J. 2013, 777, 156. [Google Scholar] [CrossRef]
- Armus, L.; Charmandaris, V.; Bernard-Salas, J.; Spoon, H.W.W.; Marshall, J.A.; Higdon, S.J.U.; Desai, V.; Teplitz, H.I.; Hao, L.; Devost, D.; et al. Observations of Ultraluminous Infrared Galaxies with the Infrared Spectrograph on the Spitzer Space Telescope. II. The IRAS Bright Galaxy Sample. Astrophys. J. 2007, 656, 148–167. [Google Scholar] [CrossRef]
- Lambrides, E.L.; Petric, A.O.; Tchernyshyov, K.; Zakamska, N.L.; Watts, D.J. Mid-infrared spectroscopic evidence for AGN heating warm molecular gas. Mon. Not. R. Astron. Soc. 2019, 487, 1823–1843. [Google Scholar] [CrossRef]
- Pier, E.A.; Krolik, J.H. Infrared Spectra of Obscuring Dust Tori around Active Galactic Nuclei. I. Calculational Method and Basic Trends. Astrophys. J. 1992, 401, 99. [Google Scholar] [CrossRef]
- Nenkova, M.; Ivezić, Ž.; Elitzur, M. DUSTY: A Publicly Available Code for Modeling Dust Emission. In Thermal Emission Spectroscopy and Analysis of Dust, Disks, and Regoliths; Sitko, M.L., Sprague, A.L., Lynch, D.K., Eds.; Astronomical Society of the Pacific Conference Series; Astronomical Society of the Pacific: San Francisco, CA, USA, 2000; Volume 196, pp. 77–82. [Google Scholar]
- Siebenmorgen, R.; Haas, M.; Krügel, E.; Schulz, B. Discovery of 10 μm silicate emission in quasars. Evidence of the AGN unification scheme. Astron. Astrophys. 2005, 436, L5–L8. [Google Scholar] [CrossRef]
- Hao, L.; Spoon, H.W.W.; Sloan, G.C.; Marshall, J.A.; Armus, L.; Tielens, A.G.G.M.; Sargent, B.; van Bemmel, I.M.; Charmandaris, V.; Weedman, D.W.; et al. The Detection of Silicate Emission from Quasars at 10 and 18 Microns. Astrophys. J. Lett. 2005, 625, L75–L78. [Google Scholar] [CrossRef]
- Veilleux, S.; Rupke, D.S.N.; Kim, D.C.; Genzel, R.; Sturm, E.; Lutz, D.; Contursi, A.; Schweitzer, M.; Tacconi, L.J.; Netzer, H.; et al. Spitzer Quasar and Ulirg Evolution Study (QUEST). IV. Comparison of 1 Jy Ultraluminous Infrared Galaxies with Palomar-Green Quasars. Astrophys. J. Suppl. 2009, 182, 628–666. [Google Scholar] [CrossRef]
- Spoon, H.W.W.; Hernán-Caballero, A.; Rupke, D.; Waters, L.B.F.M.; Lebouteiller, V.; Tielens, A.G.G.M.; Loredo, T.; Su, Y.; Viola, V. The Infrared Database of Extragalactic Observables from Spitzer. II. The Database and Diagnostic Power of Crystalline Silicate Features in Galaxy Spectra. Astrophys. J. Suppl. 2022, 259, 37. [Google Scholar] [CrossRef]
- Sajina, A.; Yan, L.; Lacy, M.; Huynh, M. Discovery of Radio Jets in z ~2 Ultraluminous Infrared Galaxies with Deep 9.7 μm Silicate Absorption. Astrophys. J. Lett. 2007, 667, L17–L20. [Google Scholar] [CrossRef][Green Version]
- Marshall, J.A.; Elitzur, M.; Armus, L.; Diaz-Santos, T.; Charmandaris, V. The Nature of Deeply Buried Ultraluminous Infrared Galaxies: A Unified Model for Highly Obscured Dusty Galaxy Emission. Astrophys. J. 2018, 858, 59. [Google Scholar] [CrossRef]
- Snyder, G.F.; Hayward, C.C.; Sajina, A.; Jonsson, P.; Cox, T.J.; Hernquist, L.; Hopkins, P.F.; Yan, L. Modeling Mid-infrared Diagnostics of Obscured Quasars and Starbursts. Astrophys. J. 2013, 768, 168. [Google Scholar] [CrossRef]
- Laurent, O.; Mirabel, I.F.; Charmandaris, V.; Gallais, P.; Madden, S.C.; Sauvage, M.; Vigroux, L.; Cesarsky, C. Mid-infrared diagnostics to distinguish AGNs from starbursts. Astron. Astrophys. 2000, 359, 887–899. [Google Scholar]
- Spoon, H.W.W.; Marshall, J.A.; Houck, J.R.; Elitzur, M.; Hao, L.; Armus, L.; Brandl, B.R.; Charmandaris, V. Mid-Infrared Galaxy Classification Based on Silicate Obscuration and PAH Equivalent Width. Astrophys. J. Lett. 2007, 654, L49–L52. [Google Scholar] [CrossRef]
- Spinoglio, L.; Malkan, M.A. Infrared Line Diagnostics of Active Galactic Nuclei. Astrophys. J. 1992, 399, 504. [Google Scholar] [CrossRef]
- Gorjian, V.; Cleary, K.; Werner, M.W.; Lawrence, C.R. A Relation between the Mid-Infrared [Ne V] 14.3 μm and [Ne III] 15.6 μm Lines in Active Galactic Nuclei. Astrophys. J. Lett. 2007, 655, L73–L76. [Google Scholar] [CrossRef][Green Version]
- Fernández-Ontiveros, J.A.; Pérez-Montero, E.; Vílchez, J.M.; Amorín, R.; Spinoglio, L. Measuring chemical abundances with infrared nebular lines: HII-CHI-MISTRY-IR. Astron. Astrophys. 2021, 652, A23. [Google Scholar] [CrossRef]
- Kewley, L.J.; Nicholls, D.C.; Sutherland, R.S. Understanding Galaxy Evolution Through Emission Lines. Ann. Rev. Astron. Astrophys. 2019, 57, 511–570. [Google Scholar] [CrossRef]
- Spinoglio, L.; Alonso-Herrero, A.; Armus, L.; Baes, M.; Bernard-Salas, J.; Bianchi, S.; Bocchio, M.; Bolatto, A.; Bradford, C.; Braine, J.; et al. Galaxy Evolution Studies with the SPace IR Telescope for Cosmology and Astrophysics (SPICA): The Power of IR Spectroscopy. Publ. Astron. Soc. Aust. 2017, 34, e057. [Google Scholar] [CrossRef]
- Rush, B.; Malkan, M.A.; Spinoglio, L. The Extended 12 Micron Galaxy Sample. Astrophys. J. Suppl. 1993, 89, 1. [Google Scholar] [CrossRef][Green Version]
- Haas, M.; Siebenmorgen, R.; Leipski, C.; Ott, S.; Cunow, B.; Meusinger, H.; Müller, S.A.H.; Chini, R.; Schartel, N. Mid-infrared selection of AGN. Astron. Astrophys. 2004, 419, L49–L53. [Google Scholar] [CrossRef]
- Sajina, A.; Lacy, M.; Scott, D. Simulating the Spitzer Mid-Infrared Color-Color Diagrams. Astrophys. J. 2005, 621, 256–268. [Google Scholar] [CrossRef]
- Alonso-Herrero, A.; Pérez-González, P.G.; Alexander, D.M.; Rieke, G.H.; Rigopoulou, D.; Le Floc’h, E.; Barmby, P.; Papovich, C.; Rigby, J.R.; Bauer, F.E.; et al. Infrared Power-Law Galaxies in the Chandra Deep Field-South: Active Galactic Nuclei and Ultraluminous Infrared Galaxies. Astrophys. J. 2006, 640, 167–184. [Google Scholar] [CrossRef]
- Donley, J.L.; Koekemoer, A.M.; Brusa, M.; Capak, P.; Cardamone, C.N.; Civano, F.; Ilbert, O.; Impey, C.D.; Kartaltepe, J.S.; Miyaji, T.; et al. Identifying Luminous Active Galactic Nuclei in Deep Surveys: Revised IRAC Selection Criteria. Astrophys. J. 2012, 748, 142. [Google Scholar] [CrossRef]
- Mateos, S.; Alonso-Herrero, A.; Carrera, F.J.; Blain, A.; Watson, M.G.; Barcons, X.; Braito, V.; Severgnini, P.; Donley, J.L.; Stern, D. Using the Bright Ultrahard XMM-Newton survey to define an IR selection of luminous AGN based on WISE colours. Mon. Not. R. Astron. Soc. 2012, 426, 3271–3281. [Google Scholar] [CrossRef]
- Stern, D.; Assef, R.J.; Benford, D.J.; Blain, A.; Cutri, R.; Dey, A.; Eisenhardt, P.; Griffith, R.L.; Jarrett, T.H.; Lake, S.; et al. Mid-infrared Selection of Active Galactic Nuclei with the Wide-Field Infrared Survey Explorer. I. Characterizing WISE-selected Active Galactic Nuclei in COSMOS. Astrophys. J. 2012, 753, 30. [Google Scholar] [CrossRef]
- Assef, R.J.; Stern, D.; Noirot, G.; Jun, H.D.; Cutri, R.M.; Eisenhardt, P.R.M. The WISE AGN Catalog. Astrophys. J. Suppl. 2018, 234, 23. [Google Scholar] [CrossRef]
- Kirkpatrick, A.; Alberts, S.; Pope, A.; Barro, G.; Bonato, M.; Kocevski, D.D.; Pérez-González, P.; Rieke, G.H.; Rodríguez-Muñoz, L.; Sajina, A.; et al. The AGN-Star Formation Connection: Future Prospects with JWST. Astrophys. J. 2017, 849, 111. [Google Scholar] [CrossRef]
- Scoville, N.; Murchikova, L.; Walter, F.; Vlahakis, C.; Koda, J.; Vanden Bout, P.; Barnes, J.; Hernquist, L.; Sheth, K.; Yun, M.; et al. ALMA Resolves the Nuclear Disks of Arp 220. Astrophys. J. 2017, 836, 66. [Google Scholar] [CrossRef]
- Alexander, D.M.; Chary, R.R.; Pope, A.; Bauer, F.E.; Brandt, W.N.; Daddi, E.; Dickinson, M.; Elbaz, D.; Reddy, N.A. Reliable Identification of Compton-thick Quasars at z ≈ 2: Spitzer Mid-Infrared Spectroscopy of HDF-oMD49. Astrophys. J. 2008, 687, 835–847. [Google Scholar] [CrossRef]
- Bauer, F.E.; Yan, L.; Sajina, A.; Alexander, D.M. X-ray Constraints on the Active Galactic Nuclei Properties in Spitzer-Infrared Spectrograph Identified z ~2 Ultraluminous Infrared Galaxies. Astrophys. J. 2010, 710, 212–226. [Google Scholar] [CrossRef]
- Cutri, R.M.; Nelson, B.O.; Francis, P.J.; Smith, P.S. The 2MASS Red AGN Survey. In IAU Colloq. 184: AGN Surveys; Green, R.F., Khachikian, E.Y., Sanders, D.B., Eds.; Astronomical Society of the Pacific Conference Series; Cambridge University Press: Cambridge, UK, 2002; Volume 284, p. 127. [Google Scholar]
- Glikman, E.; Gregg, M.D.; Lacy, M.; Helfand, D.J.; Becker, R.H.; White, R.L. FIRST-2Mass Sources below the APM Detection Threshold: A Population of Highly Reddened Quasars. Astrophys. J. 2004, 607, 60–67. [Google Scholar] [CrossRef]
- Matute, I.; La Franca, F.; Pozzi, F.; Gruppioni, C.; Lari, C.; Zamorani, G. Active galactic nuclei in the mid-IR. Evolution and contribution to the cosmic infrared background. Astron. Astrophys. 2006, 451, 443–456. [Google Scholar] [CrossRef]
- Lacy, M.; Ridgway, S.E.; Sajina, A.; Petric, A.O.; Gates, E.L.; Urrutia, T.; Storrie-Lombardi, L.J. The Spitzer Mid-infrared AGN Survey. II. The Demographics and Cosmic Evolution of the AGN Population. Astrophys. J. 2015, 802, 102. [Google Scholar] [CrossRef]
- Glikman, E.; Lacy, M.; LaMassa, S.; Stern, D.; Djorgovski, S.G.; Graham, M.J.; Urrutia, T.; Lovdal, L.; Crnogorcevic, M.; Daniels-Koch, H.; et al. Luminous WISE-selected Obscured, Unobscured, and Red Quasars in Stripe 82. Astrophys. J. 2018, 861, 37. [Google Scholar] [CrossRef]
- Han, Y.; Dai, B.; Wang, B.; Zhang, F.; Han, Z. Evolution of the luminosity function and obscuration of active galactic nuclei: Comparison between X-ray and infrared. Mon. Not. R. Astron. Soc. 2012. [Google Scholar] [CrossRef]
- Hopkins, P.F.; Richards, G.T.; Hernquist, L. An Observational Determination of the Bolometric Quasar Luminosity Function. Astrophys. J. 2007, 654, 731–753. [Google Scholar] [CrossRef]
- La Franca, F.; Fiore, F.; Comastri, A.; Perola, G.C.; Sacchi, N.; Brusa, M.; Cocchia, F.; Feruglio, C.; Matt, G.; Vignali, C.; et al. The HELLAS2XMM Survey. VII. The Hard X-Ray Luminosity Function of AGNs up to z = 4: More Absorbed AGNs at Low Luminosities and High Redshifts. Astrophys. J. 2005, 635, 864–879. [Google Scholar] [CrossRef]
- Aird, J.; Nandra, K.; Laird, E.S.; Georgakakis, A.; Ashby, M.L.N.; Barmby, P.; Coil, A.L.; Huang, J.S.; Koekemoer, A.M.; Steidel, C.C.; et al. The evolution of the hard X-ray luminosity function of AGN. Mon. Not. R. Astron. Soc. 2010, 401, 2531–2551. [Google Scholar] [CrossRef]
- Zavala, J.A.; Casey, C.M.; Manning, S.M.; Aravena, M.; Bethermin, M.; Caputi, K.I.; Clements, D.L.; Cunha, E.d.; Drew, P.; Finkelstein, S.L.; et al. The Evolution of the IR Luminosity Function and Dust-obscured Star Formation over the Past 13 Billion Years. Astrophys. J. 2021, 909, 165. [Google Scholar] [CrossRef]
- Satyapal, S.; Kamal, L.; Cann, J.M.; Secrest, N.J.; Abel, N.P. The Diagnostic Potential of JWST in Characterizing Elusive AGNs. Astrophys. J. 2021, 906, 35. [Google Scholar] [CrossRef]
- Greene, J.E. Low-mass black holes as the remnants of primordial black hole formation. Nat. Commun. 2012, 3, 1304. [Google Scholar] [CrossRef]
- Smethurst, R.J.; Simmons, B.D.; Coil, A.; Lintott, C.J.; Keel, W.; Masters, K.L.; Glikman, E.; Leung, G.C.K.; Shanahan, J.; Garland, I.L. Kiloparsec-scale AGN outflows and feedback in merger-free galaxies. Mon. Not. R. Astron. Soc. 2021, 507, 3985–3997. [Google Scholar] [CrossRef]
- Roussel, H.; Helou, G.; Smith, J.D.; Draine, B.T.; Hollenbach, D.J.; Moustakas, J.; Spoon, H.W.; Kennicutt, R.C.; Rieke, G.H.; Walter, F.; et al. The Opaque Nascent Starburst in NGC 1377: Spitzer SINGS Observations. Astrophys. J. 2006, 646, 841–857. [Google Scholar] [CrossRef]
- Engelbracht, C.W.; Rieke, G.H.; Gordon, K.D.; Smith, J.D.T.; Werner, M.W.; Moustakas, J.; Willmer, C.N.A.; Vanzi, L. Metallicity Effects on Dust Properties in Starbursting Galaxies. Astrophys. J. 2008, 678, 804–827. [Google Scholar] [CrossRef]
- Groves, B.A.; Heckman, T.M.; Kauffmann, G. Emission-line diagnostics of low-metallicity active galactic nuclei. Mon. Not. R. Astron. Soc. 2006, 371, 1559–1569. [Google Scholar] [CrossRef]
- Sartori, L.F.; Schawinski, K.; Treister, E.; Trakhtenbrot, B.; Koss, M.; Shirazi, M.; Oh, K. The search for active black holes in nearby low-mass galaxies using optical and mid-IR data. Mon. Not. R. Astron. Soc. 2015, 454, 3722–3742. [Google Scholar] [CrossRef]
- Hainline, K.N.; Reines, A.E.; Greene, J.E.; Stern, D. Mid-infrared Colors of Dwarf Galaxies: Young Starbursts Mimicking Active Galactic Nuclei. Astrophys. J. 2016, 832, 119. [Google Scholar] [CrossRef]
- Jarrett, T.H.; Cohen, M.; Masci, F.; Wright, E.; Stern, D.; Benford, D.; Blain, A.; Carey, S.; Cutri, R.M.; Eisenhardt, P.; et al. The Spitzer-WISE Survey of the Ecliptic Poles. Astrophys. J. 2011, 735, 112. [Google Scholar] [CrossRef]
- Satyapal, S.; Vega, D.; Dudik, R.P.; Abel, N.P.; Heckman, T. Spitzer Uncovers Active Galactic Nuclei Missed by Optical Surveys in Seven Late-Type Galaxies. Astrophys. J. 2008, 677, 926–942. [Google Scholar] [CrossRef]
- Richardson, C.T.; Simpson, C.; Polimera, M.S.; Kannappan, S.J.; Bellovary, J.M.; Greene, C.; Jenkins, S. Optical and JWST Mid-IR Emission Line Diagnostics for Simultaneous IMBH and Stellar Excitation in z 0 Dwarf Galaxies. Astrophys. J. 2022, 927, 165. [Google Scholar] [CrossRef]
- Secrest, N.J.; Satyapal, S. A Low Incidence of Mid-infrared Variability in Dwarf Galaxies. Astrophys. J. 2020, 900, 56. [Google Scholar] [CrossRef]
- Komossa, S. Tidal disruption of stars by supermassive black holes: Status of observations. J. High Energy Astrophys. 2015, 7, 148–157. [Google Scholar] [CrossRef]
- Jiang, N.; Wang, T.; Yan, L.; Xiao, T.; Yang, C.; Dou, L.; Wang, H.; Cutri, R.; Mainzer, A. Mid-infrared Flare of TDE Candidate PS16dtm: Dust Echo and Implications for the Spectral Evolution. Astrophys. J. 2017, 850, 63. [Google Scholar] [CrossRef]
- Dou, L.; Wang, T.; Yan, L.; Jiang, N.; Yang, C.; Cutri, R.M.; Mainzer, A.; Peng, B. Discovery of a Mid-infrared Echo from the TDE Candidate in the Nucleus of ULIRG F01004-2237. Astrophys. J. Lett. 2017, 841, L8. [Google Scholar] [CrossRef]
- Richards, G.T.; Lacy, M.; Storrie-Lombardi, L.J.; Hall, P.B.; Gallagher, S.C.; Hines, D.C.; Fan, X.; Papovich, C.; Vanden Berk, D.E.; Trammell, G.B.; et al. Spectral Energy Distributions and Multiwavelength Selection of Type 1 Quasars. Astrophys. J. Suppl. 2006, 166, 470–497. [Google Scholar] [CrossRef]
- Shen, X.; Hopkins, P.F.; Faucher-Giguère, C.A.; Alexander, D.M.; Richards, G.T.; Ross, N.P.; Hickox, R.C. The bolometric quasar luminosity function at z = 0–7. Mon. Not. R. Astron. Soc. 2020, 495, 3252–3275. [Google Scholar] [CrossRef]
- Trump, J.R.; Impey, C.D.; Kelly, B.C.; Civano, F.; Gabor, J.M.; Diamond-Stanic, A.M.; Merloni, A.; Urry, C.M.; Hao, H.; Jahnke, K.; et al. Accretion Rate and the Physical Nature of Unobscured Active Galaxies. Astrophys. J. 2011, 733, 60. [Google Scholar] [CrossRef]
- Lyu, J.; Rieke, G.H.; Shi, Y. Dust-deficient Palomar-Green Quasars and the Diversity of AGN Intrinsic IR Emission. Astrophys. J. 2017, 835, 257. [Google Scholar] [CrossRef]
- Ogle, P.; Whysong, D.; Antonucci, R. Spitzer Reveals Hidden Quasar Nuclei in Some Powerful FR II Radio Galaxies. Astrophys. J. 2006, 647, 161–171. [Google Scholar] [CrossRef]
- Ferrarese, L.; Merritt, D. A Fundamental Relation between Supermassive Black Holes and Their Host Galaxies. Astrophys. J. Lett. 2000, 539, L9–L12. [Google Scholar] [CrossRef]
- Greene, J.E.; Ho, L.C. A Comparison of Stellar and Gaseous Kinematics in the Nuclei of Active Galaxies. Astrophys. J. 2005, 627, 721–732. [Google Scholar] [CrossRef]
- García-Burillo, S.; Combes, F.; Ramos Almeida, C.; Usero, A.; Alonso-Herrero, A.; Hunt, L.K.; Rouan, D.; Aalto, S.; Querejeta, M.; Viti, S.; et al. ALMA images the many faces of the <ASTROBJ>NGC 1068</ASTROBJ> torus and its surroundings. Astron. Astrophys. 2019, 632, A61. [Google Scholar] [CrossRef]
- Jaffe, W.; Meisenheimer, K.; Röttgering, H.J.A.; Leinert, C.; Richichi, A.; Chesneau, O.; Fraix-Burnet, D.; Glazenborg-Kluttig, A.; Granato, G.L.; Graser, U.; et al. The central dusty torus in the active nucleus of NGC 1068. Nature 2004, 429, 47–49. [Google Scholar] [CrossRef]
- Combes, F.; García-Burillo, S.; Audibert, A.; Hunt, L.; Eckart, A.; Aalto, S.; Casasola, V.; Boone, F.; Krips, M.; Viti, S.; et al. ALMA observations of molecular tori around massive black holes. Astron. Astrophys. 2019, 623, A79. [Google Scholar] [CrossRef]
- García-Burillo, S.; Alonso-Herrero, A.; Ramos Almeida, C.; González-Martín, O.; Combes, F.; Usero, A.; Hönig, S.; Querejeta, M.; Hicks, E.K.S.; Hunt, L.K.; et al. The Galaxy Activity, Torus and Outflow Survey (GATOS) I. ALMA images of dusty molecular tori in Seyfert galaxies. arXiv e-Prints 2021, arXiv:2104.10227. [Google Scholar]
- Lutz, D.; Maiolino, R.; Spoon, H.W.W.; Moorwood, A.F.M. The relation between AGN hard X-ray emission and mid-infrared continuum from ISO spectra: Scatter and unification aspects. Astron. Astrophys. 2004, 418, 465–473. [Google Scholar] [CrossRef]
- Sheng, Z.; Wang, T.; Jiang, N.; Yang, C.; Yan, L.; Dou, L.; Peng, B. Mid-infrared Variability of Changing-look AGNs. Astrophys. J. Lett. 2017, 846, L7. [Google Scholar] [CrossRef]
- Lyu, B.; Wu, Q.; Yan, Z.; Yu, W.; Liu, H. WISE View of Changing-look Active Galactic Nuclei: Evidence for a Transitional Stage of AGNs. Astrophys. J. 2022, 927, 227. [Google Scholar] [CrossRef]
- Stalevski, M.; Tristram, K.R.W.; Asmus, D. Dissecting the active galactic nucleus in Circinus-II. A thin dusty disc and a polar outflow on parsec scales. Mon. Not. R. Astron. Soc. 2019, 484, 3334–3355. [Google Scholar] [CrossRef]
- Isbell, J.W.; Meisenheimer, K.; Pott, J.U.; Stalevski, M.; Tristram, K.R.W.; Sanchez-Bermudez, J.; Hofmann, K.H.; Gámez Rosas, V.; Jaffe, W.; Burtscher, L.; et al. The dusty heart of Circinus: I. Imaging the circumnuclear dust in N-band. arXiv e-Prints 2022, arXiv:2205.01575. [Google Scholar]
- Asmus, D.; Hönig, S.F.; Gandhi, P. The Subarcsecond Mid-infrared View of Local Active Galactic Nuclei. III. Polar Dust Emission. Astrophys. J. 2016, 822, 109. [Google Scholar] [CrossRef]
- Asmus, D. New evidence for the ubiquity of prominent polar dust emission in AGN on tens of parsec scales. Mon. Not. R. Astron. Soc. 2019, 489, 2177–2188. [Google Scholar] [CrossRef]
- Alonso-Herrero, A.; García-Burillo, S.; Hönig, S.F.; García-Bernete, I.; Ramos Almeida, C.; González-Martín, O.; López-Rodríguez, E.; Boorman, P.G.; Bunker, A.J.; Burtscher, L.; et al. The Galaxy Activity, Torus, and Outflow Survey (GATOS). II. Torus and polar dust emission in nearby Seyfert galaxies. Astron. Astrophys. 2021, 652, A99. [Google Scholar] [CrossRef]
- Veilleux, S.; Meléndez, M.; Sturm, E.; Gracia-Carpio, J.; Fischer, J.; González-Alfonso, E.; Contursi, A.; Lutz, D.; Poglitsch, A.; Davies, R.; et al. Fast Molecular Outflows in Luminous Galaxy Mergers: Evidence for Quasar Feedback from Herschel. Astrophys. J. 2013, 776, 27. [Google Scholar] [CrossRef]
- Cicone, C.; Maiolino, R.; Sturm, E.; Graciá-Carpio, J.; Feruglio, C.; Neri, R.; Aalto, S.; Davies, R.; Fiore, F.; Fischer, J.; et al. Massive molecular outflows and evidence for AGN feedback from CO observations. Astron. Astrophys. 2014, 562, A21. [Google Scholar] [CrossRef]
- Leftley, J.H.; Hönig, S.F.; Asmus, D.; Tristram, K.R.W.; Gandhi, P.; Kishimoto, M.; Venanzi, M.; Williamson, D.J. Parsec-scale Dusty Winds in Active Galactic Nuclei: Evidence for Radiation Pressure Driving. Astrophys. J. 2019, 886, 55. [Google Scholar] [CrossRef]
- Veilleux, S.; Maiolino, R.; Bolatto, A.D.; Aalto, S. Cool outflows in galaxies and their implications. Astron. Astrophys. Rev. 2020, 28, 2. [Google Scholar] [CrossRef]
- Prieto, A.; Nadolny, J.; Fernández-Ontiveros, J.A.; Mezcua, M. Dust in the central parsecs of unobscured AGN: More challenges to the torus. arXiv e-Prints 2021, arXiv:2106.07753. [Google Scholar] [CrossRef]
- Imanishi, M.; Nakanishi, K.; Izumi, T.; Wada, K. ALMA Reveals an Inhomogeneous Compact Rotating Dense Molecular Torus at the NGC 1068 Nucleus. Astrophys. J. Lett. 2018, 853, L25. [Google Scholar] [CrossRef]
- García-González, J.; Alonso-Herrero, A.; Pérez-González, P.G.; Hernán-Caballero, A.; Sarajedini, V.L.; Villar, V. Selection of AGN candidates in the GOODS-South Field through Spitzer/MIPS 24 μm variability. Mon. Not. R. Astron. Soc. 2015, 446, 3199–3223. [Google Scholar] [CrossRef][Green Version]
- Polimera, M.; Sarajedini, V.; Ashby, M.L.N.; Willner, S.P.; Fazio, G.G. Morphologies of mid-IR variability-selected AGN host galaxies. Mon. Not. R. Astron. Soc. 2018, 476, 1111–1119. [Google Scholar] [CrossRef]
- Peterson, B.M. Reverberation Mapping of Active Galactic Nuclei. Publ. Astron. Soc. Pac. 1993, 105, 247. [Google Scholar] [CrossRef]
- Peterson, B.M.; Ferrarese, L.; Gilbert, K.M.; Kaspi, S.; Malkan, M.A.; Maoz, D.; Merritt, D.; Netzer, H.; Onken, C.A.; Pogge, R.W.; et al. Central Masses and Broad-Line Region Sizes of Active Galactic Nuclei. II. A Homogeneous Analysis of a Large Reverberation-Mapping Database. Astrophys. J. 2004, 613, 682–699. [Google Scholar] [CrossRef]
- Kozłowski, S.; Kochanek, C.S.; Ashby, M.L.N.; Assef, R.J.; Brodwin, M.; Eisenhardt, P.R.; Jannuzi, B.T.; Stern, D. Quasar Variability in the Mid-Infrared. Astrophys. J. 2016, 817, 119. [Google Scholar] [CrossRef]
- Matsuoka, K.; Nagao, T.; Maiolino, R.; Marconi, A.; Taniguchi, Y. Chemical evolution of high-redshift radio galaxies. Astron. Astrophys. 2009, 503, 721–730. [Google Scholar] [CrossRef]
- Matsuoka, K.; Nagao, T.; Marconi, A.; Maiolino, R.; Mannucci, F.; Cresci, G.; Terao, K.; Ikeda, H. The mass-metallicity relation of high-z type-2 active galactic nuclei. Astron. Astrophys. 2018, 616, L4. [Google Scholar] [CrossRef]
- Thomas, A.D.; Kewley, L.J.; Dopita, M.A.; Groves, B.A.; Hopkins, A.M.; Sutherland, R.S. The Mass-Metallicity Relation of Local Active Galaxies. Astrophys. J. 2019, 874, 100. [Google Scholar] [CrossRef]
- Valiante, R.; Schneider, R.; Salvadori, S.; Bianchi, S. The origin of the dust in high-redshift quasars: The case of SDSS J1148+5251. Mon. Not. R. Astron. Soc. 2011, 416, 1916–1935. [Google Scholar] [CrossRef]
- Nagao, T.; Maiolino, R.; Marconi, A.; Matsuhara, H. Metallicity diagnostics with infrared fine-structure lines. Astron. Astrophys. 2011, 526, A149. [Google Scholar] [CrossRef]
- Valentino, F.; Daddi, E.; Puglisi, A.; Magdis, G.E.; Kokorev, V.; Liu, D.; Madden, S.C.; Gómez-Guijarro, C.; Lee, M.Y.; Cortzen, I.; et al. The effect of active galactic nuclei on the cold interstellar medium in distant star-forming galaxies. Astron. Astrophys. 2021, 654, A165. [Google Scholar] [CrossRef]
- Circosta, C.; Mainieri, V.; Lamperti, I.; Padovani, P.; Bischetti, M.; Harrison, C.M.; Kakkad, D.; Zanella, A.; Vietri, G.; Lanzuisi, G.; et al. SUPER. IV. CO(J = 3-2) properties of active galactic nucleus hosts at cosmic noon revealed by ALMA. Astron. Astrophys. 2021, 646, A96. [Google Scholar] [CrossRef]
- Mashian, N.; Sturm, E.; Sternberg, A.; Janssen, A.; Hailey-Dunsheath, S.; Fischer, J.; Contursi, A.; González-Alfonso, E.; Graciá-Carpio, J.; Poglitsch, A.; et al. High-J CO Sleds in Nearby Infrared Bright Galaxies Observed By Herschel/PACS. Astrophys. J. 2015, 802, 81. [Google Scholar] [CrossRef]
- van der Werf, P.P.; Isaak, K.G.; Meijerink, R.; Spaans, M.; Rykala, A.; Fulton, T.; Loenen, A.F.; Walter, F.; Weiß, A.; Armus, L.; et al. Black hole accretion and star formation as drivers of gas excitation and chemistry in Markarian 231. Astron. Astrophys. 2010, 518, L42. [Google Scholar] [CrossRef]
- Maloney, P.R.; Hollenbach, D.J.; Tielens, A.G.G.M. X-Ray–irradiated Molecular Gas. I. Physical Processes and General Results. Astrophys. J. 1996, 466, 561. [Google Scholar] [CrossRef]
- Smith, J.D.T.; Draine, B.T.; Dale, D.A.; Moustakas, J.; Kennicutt, R.C., Jr.; Helou, G.; Armus, L.; Roussel, H.; Sheth, K.; Bendo, G.J.; et al. The Mid-Infrared Spectrum of Star-forming Galaxies: Global Properties of Polycyclic Aromatic Hydrocarbon Emission. Astrophys. J. 2007, 656, 770–791. [Google Scholar] [CrossRef]
- García-Bernete, I.; Rigopoulou, D.; Alonso-Herrero, A.; Pereira-Santaella, M.; Roche, P.F.; Kerkeni, B. Polycyclic aromatic hydrocarbons in Seyfert and star-forming galaxies. Mon. Not. R. Astron. Soc. 2022, 509, 4256–4275. [Google Scholar] [CrossRef]
- Lyu, J.; Hao, L.; Li, A. Dust in Active Galactic Nuclei: Anomalous Silicate to Optical Extinction Ratios? Astrophys. J. Lett. 2014, 792, L9. [Google Scholar] [CrossRef]
- Shao, Z.; Jiang, B.W.; Li, A. On the Optical-to-silicate Extinction Ratio as a Probe of the Dust Size in Active Galactic Nuclei. Astrophys. J. 2017, 840, 27. [Google Scholar] [CrossRef]
- Xie, Y.; Li, A.; Hao, L. Silicate Dust in Active Galactic Nuclei. Astrophys. J. Suppl. 2017, 228, 6. [Google Scholar] [CrossRef]
- Hatziminaoglou, E.; Hernán-Caballero, A.; Feltre, A.; Piñol Ferrer, N. A Complete Census of Silicate Features in the Mid-infrared Spectra of Active Galaxies. Astrophys. J. 2015, 803, 110. [Google Scholar] [CrossRef]
- Spoon, H.W.W.; Armus, L.; Cami, J.; Tielens, A.G.G.M.; Chiar, J.E.; Peeters, E.; Keane, J.V.; Charmandaris, V.; Appleton, P.N.; Teplitz, H.I.; et al. Fire and Ice: Spitzer Infrared Spectrograph (IRS) Mid-Infrared Spectroscopy of IRAS F00183-7111. Astrophys. J. Suppl. 2004, 154, 184–187. [Google Scholar] [CrossRef]
- Sajina, A.; Spoon, H.; Yan, L.; Imanishi, M.; Fadda, D.; Elitzur, M. Detections of Water Ice, Hydrocarbons, and 3.3 μm PAH in z ~ 2 ULIRGs. Astrophys. J. 2009, 703, 270–284. [Google Scholar] [CrossRef]
- Imanishi, M.; Nakagawa, T.; Ohyama, Y.; Shirahata, M.; Wada, T.; Onaka, T.; Oi, N. Systematic Infrared 2.5–5 μm Spectroscopy of Nearby Ultraluminous Infrared Galaxies with AKARI. Publ. Astron. Soc. Jpn. 2008, 60, S489. [Google Scholar] [CrossRef]
- Matsuhara, H.; Wada, T.; Matsuura, S.; Nakagawa, T.; Kawada, M.; Ohyama, Y.; Pearson, C.P.; Oyabu, S.; Takagi, T.; Serjeant, S.; et al. Deep Extragalactic Surveys around the Ecliptic Poles with AKARI (ASTRO-F). Publ. Astron. Soc. Jpn. 2006, 58, 673–694. [Google Scholar] [CrossRef]
- Tsuchikawa, T.; Kaneda, H.; Oyabu, S.; Kokusho, T.; Kobayashi, H.; Yamagishi, M.; Toba, Y. A systematic study of silicate absorption features in heavily obscured AGNs observed by Spitzer/IRS. Astron. Astrophys. 2021, 651, A117. [Google Scholar] [CrossRef]
- Wang, S.; Li, A.; Jiang, B.W. Very Large Interstellar Grains as Evidenced by the Mid-infrared Extinction. Astrophys. J. 2015, 811, 38. [Google Scholar] [CrossRef]
- Lo Faro, B.; Buat, V.; Roehlly, Y.; Alvarez-Marquez, J.; Burgarella, D.; Silva, L.; Efstathiou, A. Characterizing the UV-to-NIR shape of the dust attenuation curve of IR luminous galaxies up to z ∼ 2. Mon. Not. R. Astron. Soc. 2017, 472, 1372–1391. [Google Scholar] [CrossRef]
- Roebuck, E.; Sajina, A.; Hayward, C.C.; Martis, N.; Marchesini, D.; Krefting, N.; Pope, A. Simulations Find Our Accounting of Dust-obscured Star Formation May Be Incomplete. Astrophys. J. 2019, 881, 18. [Google Scholar] [CrossRef]
- Mullaney, J.R.; Alexander, D.M.; Goulding, A.D.; Hickox, R.C. Defining the intrinsic AGN infrared spectral energy distribution and measuring its contribution to the infrared output of composite galaxies. Mon. Not. R. Astron. Soc. 2011, 414, 1082–1110. [Google Scholar] [CrossRef]
- Lyu, J.; Rieke, G.H. The Intrinsic Far-infrared Continua of Type-1 Quasars. Astrophys. J. 2017, 841, 76. [Google Scholar] [CrossRef]
- Bernhard, E.; Tadhunter, C.; Mullaney, J.R.; Grimmett, L.P.; Rosario, D.J.; Alexander, D.M. The post-Herschel view of intrinsic AGN emission: Constructing templates for galaxy and AGN emission at IR wavelengths. Mon. Not. R. Astron. Soc. 2021, 503, 2598–2621. [Google Scholar] [CrossRef]
- Roebuck, E.; Sajina, A.; Hayward, C.C.; Pope, A.; Kirkpatrick, A.; Hernquist, L.; Yan, L. The Role of Star Formation and AGN in Dust Heating of z = 0.3–2.8 Galaxies-II. Informing IR AGN Fraction Estimates through Simulations. Astrophys. J. 2016, 833, 60. [Google Scholar] [CrossRef]
- McKinney, J.; Hayward, C.C.; Rosenthal, L.J.; Martínez-Galarza, J.R.; Pope, A.; Sajina, A.; Smith, H.A. Dust-enshrouded AGNs Can Dominate Host-galaxy-scale Cold Dust Emission. Astrophys. J. 2021, 921, 55. [Google Scholar] [CrossRef]
- Lacy, M.; Sajina, A.; Petric, A.O.; Seymour, N.; Canalizo, G.; Ridgway, S.E.; Armus, L.; Storrie-Lombardi, L.J. Large Amounts of Optically Obscured Star Formation in the Host Galaxies of Some Type 2 Quasars. Astrophys. J. Lett. 2007, 669, L61–L64. [Google Scholar] [CrossRef]
- Goulding, A.D.; Alexander, D.M.; Bauer, F.E.; Forman, W.R.; Hickox, R.C.; Jones, C.; Mullaney, J.R.; Trichas, M. Deep Silicate Absorption Features in Compton-thick Active Galactic Nuclei Predominantly Arise due to Dust in the Host Galaxy. Astrophys. J. 2012, 755, 5. [Google Scholar] [CrossRef]
- Symeonidis, M.; Giblin, B.M.; Page, M.J.; Pearson, C.; Bendo, G.; Seymour, N.; Oliver, S.J. AGN are cooler than you think: The intrinsic far-IR emission from QSOs. Mon. Not. R. Astron. Soc. 2016, 459, 257–276. [Google Scholar] [CrossRef]
- Herter, T.L.; Adams, J.D.; De Buizer, J.M.; Gull, G.E.; Schoenwald, J.; Henderson, C.P.; Keller, L.D.; Nikola, T.; Stacey, G.; Vacca, W.D. First Science Observations with SOFIA/FORCAST: The FORCAST Mid-infrared Camera. Astrophys. J. Lett. 2012, 749, L18. [Google Scholar] [CrossRef]
- Kamizuka, T.; Miyata, T.; Sako, S.; Ohsawa, R.; Asano, K.; Uchiyama, M.S.; Mori, T.; Yoshida, Y.; Tachibana, K.; Michifuji, T.; et al. The University of Tokyo Atacama Observatory 6.5m telescope: On-sky performance evaluations of the mid-infrared instrument MIMIZUKU on the Subaru telescope. In Proceedings of the Ground-Based and Airborne Instrumentation for Astronomy VIII, Online, 13 December 2020; Volume 11447, p. 114475X. [Google Scholar] [CrossRef]
- Jansen, R.A.; Windhorst, R.A. The James Webb Space Telescope North Ecliptic Pole Time-domain Field. I. Field Selection of a JWST Community Field for Time-domain Studies. Publ. Astron. Soc. Pac. 2018, 130, 124001. [Google Scholar] [CrossRef]
- Lutz, D.; Sturm, E.; Genzel, R.; Moorwood, A.F.M.; Alexander, T.; Netzer, H.; Sternberg, A. ISO-SWS Spectroscopy of NGC 1068. Astrophys. J. 2000, 536, 697–709. [Google Scholar] [CrossRef][Green Version]
- Pope, A.; Armus, L.; Murphy, E.; Aalto, S.; Alexander, D.; Appleton, P.; Barger, A.; Bradford, M.; Capak, P.; Casey, C.; et al. Simultaneous Measurements of Star Formation and Supermassive Black Hole Growth in Galaxies. Bull. Am. Astron. Soc. 2019, 51, 330. [Google Scholar]
- Lin, K.W.; Pope, A.; Kirkpatrick, A. Hunting for Active Galactic Nuclei in JWST/MIRI Imaging. In American Astronomical Society Meeting Abstracts #231; American Astronomical Society: Washington, DC, USA, 2018; Volume 231, p. 250.17. [Google Scholar]
- Vito, F.; Brandt, W.N.; Yang, G.; Gilli, R.; Luo, B.; Vignali, C.; Xue, Y.Q.; Comastri, A.; Koekemoer, A.M.; Lehmer, B.D.; et al. High-redshift AGN in the Chandra Deep Fields: The obscured fraction and space density of the sub-L* population. Mon. Not. R. Astron. Soc. 2018, 473, 2378–2406. [Google Scholar] [CrossRef]
- Meixner, M.; Cooray, A.; Leisawitz, D.; Staguhn, J.; Armus, L.; Battersby, C.; Bauer, J.; Bergin, E.; Bradford, C.M.; Ennico-Smith, K.; et al. Origins Space Telescope Mission Concept Study Report. arXiv e-Prints 2019, arXiv:1912.06213. [Google Scholar]
- Glenn, J.; Bradford, C.M.; Rosolowsky, E.; Amini, R.; Alatalo, K.; Armus, L.; Benson, A.J.; Chang, T.C.; Darling, J.; Day, P.K.; et al. Galaxy Evolution Probe. J. Astron. Telesc. Instrum. Syst. 2021, 7, 34004. [Google Scholar] [CrossRef]


Publisher’s Note: MDPI stays neutral with regard to jurisdictional claims in published maps and institutional affiliations. |
© 2022 by the authors. Licensee MDPI, Basel, Switzerland. This article is an open access article distributed under the terms and conditions of the Creative Commons Attribution (CC BY) license (https://creativecommons.org/licenses/by/4.0/).
Share and Cite
Sajina, A.; Lacy, M.; Pope, A. The Past and Future of Mid-Infrared Studies of AGN. Universe 2022, 8, 356. https://doi.org/10.3390/universe8070356
Sajina A, Lacy M, Pope A. The Past and Future of Mid-Infrared Studies of AGN. Universe. 2022; 8(7):356. https://doi.org/10.3390/universe8070356
Chicago/Turabian StyleSajina, Anna, Mark Lacy, and Alexandra Pope. 2022. "The Past and Future of Mid-Infrared Studies of AGN" Universe 8, no. 7: 356. https://doi.org/10.3390/universe8070356
APA StyleSajina, A., Lacy, M., & Pope, A. (2022). The Past and Future of Mid-Infrared Studies of AGN. Universe, 8(7), 356. https://doi.org/10.3390/universe8070356