Article

Long-Term Studies of Cyg X-3 High-Mass X-ray Binary

by
Vera G. Sinitsyna
* and
Vera Yu. Sinitsyna
P.N. Lebedev Physical Institute, Russian Academy of Science, 119991 Moscow, Russia
*
Author to whom correspondence should be addressed.
Universe 2022, 8(2), 57; https://doi.org/10.3390/universe8020057
Submission received: 15 November 2021 / Revised: 8 January 2022 / Accepted: 11 January 2022 / Published: 18 January 2022

Abstract

:
Cyg X-3 is the famous binary system containing a black hole that is actively studied through a wide range of the electromagnetic spectrum, from radio wavelengths to ultra-high-energy gamma-rays, but still not well-understood. The Cyg X-3 focusing investigations obtained from the long-term observations at 800 GeV–100 TeV energies with the SHALON telescope are presented. The modulation of the γ -ray emission detected in these studies with an orbital period of 4.8 h was found, proving the identity of the observed object with Cyg X-3. The comparison of light curves in the wide energy range from radio to very high energy γ -rays, folded on the Cyg X-3 orbital period, revealed the differences in the modulation amplitude and phase shifts. The studies of Cyg X-3 activity at very-high energies, including information about TeV and MeV-GeV flare and quenched states and the relationship between the ones in the entire wide energy range, are presented. The modulation of TeV γ -ray flux with orbit along with the high luminosity of the companion star of Cyg X-3 and the close orbit of binary leads to an efficient generation of the part of γ -ray emission in the inverse Compton scattering. The correlation of TeV fluxes with the flaring activity of Cyg X-3 at X-ray and radio ranges could be related to processes of powerful mass ejections from the central regions around the black hole.

1. Introduction

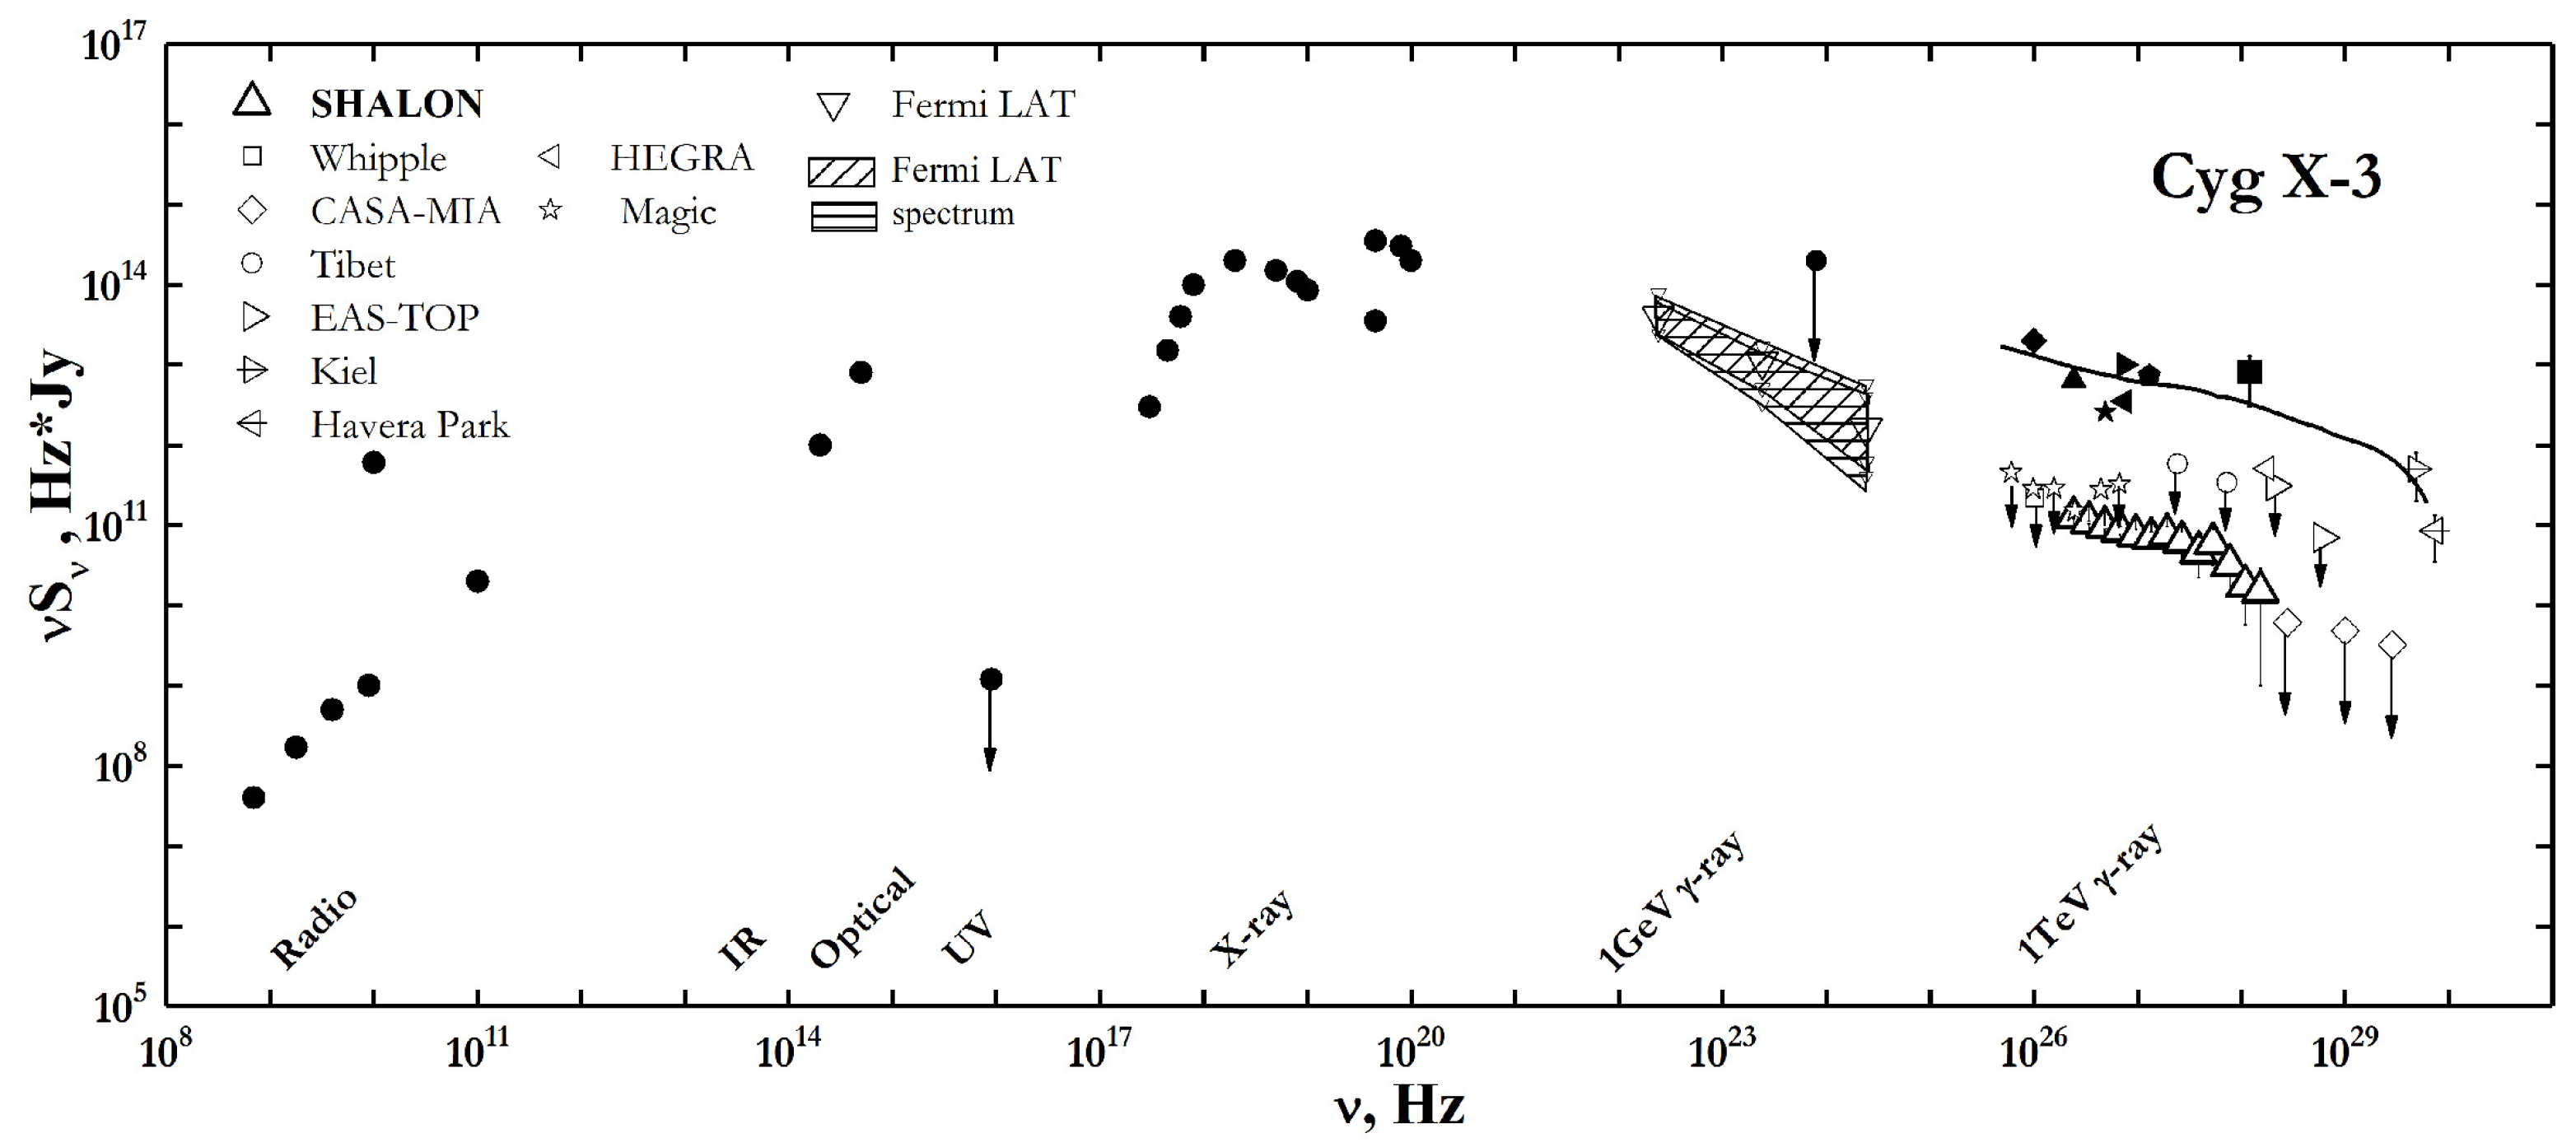
High-mass X-ray binaries (HMXB) are binary systems formed by a compact object that orbits an early-type star or, in rare cases, Wolf-Rayet star companion. HMXBs are bright X-ray sources those high-energy emission is caused by the accretion processes in a binary system. Multi-wavelength studies of the different samples of HMXBs contribute to the understanding of the physical processes forming observed phenomena in these powerful objects. Cygnus X-3 (Cyg X-3) is an X-ray binary discovered more than 50 years ago in 1966 [1]. Since then, Cyg X-3 has been intensively studied across a wide range of the electromagnetic spectrum from radio wavelength up to ultrahigh-energy gamma-ray emission (Figure 1, [2,3]).
Cyg X-3 belongs to high-mass X-ray binary systems composed of a Wolf–Rayet star [4] and a compact object which may be a black hole and the only one of this type located in our Galaxy [5]. The nature of that compact object [6] is still a matter of debate, but a black hole is favored based on the X-ray and radio emission properties [7,8,9,10,11,12]. Cyg X-3 is located in the Galactic plane at a distance of ∼7 kpc [13]. The X-ray and infrared emission of Cyg X-3 are modulated with a 4.8-h period which is supposed to be related to the emission scattering by the wind from the Wolf–Rayet companion star during the orbital motion of the compact object. Comparing the X-ray and infrared modulation depth, the last one is considerably smaller, which may indicate [14,15] the origin of the infrared emission as well as its variation due to the heating of the entire system when the compact object passes through the dense wind from the Wolf–Rayet star [15].
Cyg X-3 is the brightest X-ray binary system at the radio wavelength. It is characterized by giant radio outbursts and exhibits relativistic jets during these flaring events, making Cyg X-3 a microquasar-type object. Flares with the intensity increase by two or three orders of magnitude at a few day’s time scales are detected. Giant outbursts were first detected in 1972 [16], and further observations provided numerous evidence for such flares [17,18,19] that are continuously recorded. The Cyg X-3 radio flaring activity exhibits a pattern of correlation and anti-correlation with the X-ray emission of different energies [20,21,22]. For example, in [20], it was demonstrated that major radio flares occur during periods of high fluxes of soft X-ray emission. In this case, an anti-correlation of the radio flux with the hard X-ray intensity at 20 keV–2 MeV is detected during the quiescent radio states. But it changes to a significant correlation of radio with the fluxes of hard X-rays at the times of major radio flaring activity [21]. Also, an overall anti-correlation between soft and hard X-ray intensities is found [10,21].
The radio emission modulation was detected first in the early data [23] with a period value similar to that detected for X-rays, but no such modulations were confirmed in later studies [24]. Recently, the modulation of radio emission with the orbital period was found in the 22-year studies of 15-GHz radio observations of Cyg X-3 by the Ryle and AMI telescopes [25] with a low amplitude of modulation depending on the states in X-ray and radio energies. The weak radio emission variation along with the period of the orbital motion may imply that it is not affected by the scattering in the Wolf–Rayet star wind or jets moving beyond the system are the source of the bulk of the emission and located away from the scattering region.
High-energy gamma-ray emission of Cyg X-3 was discovered in the Fermi-LAT satellite experiment at energies 100 MeV–100 GeV [26] and in the AGILE experiment in the range of 100 MeV–3 GeV [27]. The modulation of the high-energy emission from Cyg X-3 with orbital period, but almost in antiphase with the light curve viewed in X-rays, and the significant flux increases during the radio flares were detected in the Fermi-LAT observations [26]. The modulation of high-energy emission from Cyg X-3 and the correlation of the gamma-ray fluxes with the low-energy flaring activity bound the size and location of the regions where the gamma-rays of 100 MeV–100 GeV energies are generated [26,28].
Cygnus X-3 has also been proposed to be an emitter of ultra-high-energy gamma-rays. It became one of the first application targets for astronomy with an air shower array [29]. The attempts to search for TeV gamma-ray emission from Cyg X-3 were first made in the mid-1970s and continued until the mid-1980s (see the references in [2]). The observation data came simultaneously from the Kiel [30], and Havera Park [31] air shower arrays were of high importance. These two experiments reported a huge flux of gamma-ray emission at ultra-high energies (Figure 1). Furthermore, the gamma-ray emission origin models for this object to fit the archive experimental data at high and ultra-high energies (see the curve in Figure 1, line) were built. As a result, based on the early ultra-high-energy data, Cyg X-3 was proposed to be one of the most powerful sources of charged cosmic-ray particles with energies up to 10 17 eV in the Galaxy [2]. Following observations with Tibet, HEGRA, CYGNUS, EAS-TOP, and CASA-MIA arrays of Cyg X-3 place only upper limits very far below, up to 100 times less, the initially reported fluxes [32] (see Figure 1). But despite that, the activity in air shower arrays has led first to the study of cosmic ray physics of the knee [33] and further up to the EeV energy astronomy, highly impacted the interests to the gamma-ray astronomy with Cherenkov technique, neutrino astronomy and stimulated the creation of many new detectors and arrays for the very high energy cosmic rays and astroparticle physics.
Here, we describe both the long-term multi-wavelength studies of the Cyg X-3 and results of more than twenty-year-long observations of this binary system at very high energies using the SHALON mirror Cherenkov telescope (Figure 2, Figure 3, Figure 4, Figure 5, Figure 6, Figure 7 and Figure 8). These Cyg X-3 centering investigations of the Cygnus Region revealed a number of very high energy gamma-ray sources of different nature like Cyg X-3, γ Cygni SNR, V1589 Cyg, TeV 2032+4130. Cyg X-3 focusing studies considering the possible impact of the neighboring sources provide the strong detection of TeV gamma-rays from this source and finding the Cyg X-3 characteristics at very high energy and their connection with ones at radio, X-ray, and MeV-GeV energy range. Also, an experimental approach to revealing the gamma-ray generation mechanisms and formation dynamics of active regions and jets based on the correlation of the data in a wide energy range, from radio wavelength to TeV-energy gamma-rays in this unique high-mass X-ray binary system is discussed.

2. Multiwavelength Observations

Investigation of the Cyg X-3 emission and its possible origin involve broadband long-term observation data from radio- to high energies listed below, including the information about flux correlations and connections in flux variations on the different time scales.

2.1. Radio Observations

The Arcminute Microkelvin Imager-Large Array (AMI-LA) at the Mullard Radio Astronomy Observatory in the UK consists of eight 12.8 m Cassegrain antennas spaced as a two-dimensional array, with a baseline of ∼128 m [34]. It covers the range of 13.9–18.2 GHz. AMI-LA monitored Cyg X-31 regularly except the period between 19 June 2006 and 26 May 2008, because of the Ryle Radio Telescope upgrade to the AMI-LA. Here, we used the 15 GHz data of AMI-LA from 1995 to cover the radio wavelengths behavior of Cyg X-3. Also, The 11.2 GHz Cyg X-3 data of the RATAN-600 radio telescope of the Special Astrophysical Observatory of the Russian Academy of Science located in Nizhnij Arkhyz, Russia, are used in the gap of the AMI-LA light curve.

2.2. X-ray Observations

All-sky Monitor (ASM) aboard the RXTE satellite [35] consists of three wide-angle shadow cameras equipped with proportional counters with a total collecting area of 90 square cm and a spatial resolution of 3 × 15 . ASM had been regularly observing bright X-ray sources, including Cyg X-3, since 1996 February 22 up to 2012 and coved soft X-ray bands of 1.5–12 keV2.
Monitor of All-sky X-ray Image (MAXI) aboard the International Space Station [36] consists of two types of highly-sensitive X-ray detectors, the Gas Slit Camera (GSC) and the Solid-state Slit Camera (SSC), covering the energy range of 2 to 30 keV and 0.5 to 12 keV respectively. MAXI operating since August 2009, and here the light curve data3 in the energy range of 2–4 keV are presented.
The Burst And Transient Source Experiment (BATSE) [37] for the Compton Gamma Ray Observatory, those Large Area Detectors are composed of sodium iodide NaI(Tl) crystals and sensitive to the low-energy gamma-rays of ∼20–2000 keV. It operated between April 1991 and May 2000, and the light curve data4 are used in Figure 5.
Swift Observatory in space, consisting of three instruments for the primary aim of multi-wavelength studies of the gamma-ray bursts in the optical, ultraviolet, soft, and hard X-ray energy ranges, has been operating since 2005. Swift Burst Alert Telescope (BAT) [38] is a wide-FOV of 100 × 60 degrees (or 1.4 sr), a coded-aperture instrument with a CdZnTe detector plane operating over the 15–150 keV energy range with a point-spread function of ∼22 arcmins. The Swift BAT Cyg X-3 light curve data5 are presented in Figure 6.

2.3. High Energy Observations by Fermi-LAT

The space-based gamma-ray detector Large Area Telescope (LAT) on board of Fermi satellite is a pair conversion instrument sensitive to photons in the energy range from 20 MeV to more than 300 GeV. The LAT has a large effective area of about 9000 cm 2 (at 10 GeV ) and a field of view of ∼2.4 sr. The containment radius is Θ 68 = 3.5 for E > 100 MeV and Θ 68 = 0.15 for E >10 GeV. The detector description is given in [39]. Fermi-LAT was launched in August of 2008 and has collected the entire sky survey, including the long-term data about Cyg X-3. The spectral energy distributions of Cyg X-3 averaged over the different periods of activity from Fermi-LAT observation of 10-year catalog are presented in Figure 8. The Fermi-LAT GeV gamma-ray data of Cyg X-3 observations from6 were used to obtain the 30-day-binned fluxes for the light curve in the wide energy range (Figure 6).

3. Cyg X-3 Characteristics at Very High Energies
The SHALON telescope systems are high-altitude imaging Cherenkov telescopes for the 800 GeV–100 TeV gamma-ray astronomy [40,41,42,43]. SHALON telescopes are located in the Tien-Shan mountains at an altitude of 3340 m above sea level. This site has an optical quality of atmosphere optimal for observing Cherenkov light of extensive air showers. Telescopes are placed in an individual observatory building to prevent the destructive effects of precipitation, pollution, and illumination on the systems of the telescopes. The optical reflector of a SHALON telescope is a tessellated structure consisting of 38 identical spherical mirrors characterized with >96% reflectivity, composing a total reflecting area of 11.2 m 2 .The accuracy of the mirror surface is 5 λ , which defines by a point spot dispersion ( λ = 500 nm) and dispersion of focal length of ≤1% [44]. A dish-frame has a ∼0.1% deviation from the sphericity in operation conditions [40]. An imaging camera placed at the focus of the reflector consists of 144FEU-85 photomultiplier tubes in a close-packed square arrangement and has a large field of view of >8 . This type of PMTs has demonstrated the sustainability and stability of characteristics in temperatures ranging from 20 to + 40 . Each module of PMT is equipped with an equal divider with amplification on the two last dynodes [45] to provide the gain, enhancing the linearity of the PMT range and the dynamic range ∼10 4 . A set of metal conic-to-square light concentrators is mounted in front of the PMTs to increase the light-collection efficiency and block the off-axis light. After the camera triggers due to the exceeding a discriminator threshold in any of four-PMT-set, a 75 ns length of each PMT signal is digitized with a custom-built analog-to-digital convertor [46]. The converter has the following characteristics: the 12-bit resolution, the 2.5 V full-scale range, the channel width of ∼0.5 mV, the pixel noise of < 0.5 mV. Here the pedestal noise is measured as the dispersion of the pedestal value of a single cell.
Analyzing the angular and lateral distributions of the recorded and digitized shower Cherenkov light is first based on the calculation of the optimized Hillas parameters [47] defined as moments of a 2-dimensional shower image like α , D i s t a n c e and ratio of L e n g t h , W i d t h parameters. Additionally, to characterize the shape of recorded images and specify their type, the I n t 0, and I n t 1 high-efficiency parameters used the difference of Cherenkov photon fluxes within the small angles <1 around shower axis with ones within the large angles of >2 for the gamma and hadron showers are applied. The choice of optimal analysis cuts is shown in [43]. The imaging analysis of the data in SHALON experiment is based on the reconstruction of the shower characteristics and direction for each individual event. The candidates for gamma-ray showers from all of the events recorded in observation were selected using the above cuts on the parameters of image shape applied simultaneously. The method of the gamma-ray shower selection used in the SHALON experiment allows rejecting 99.93% of the background cosmic-ray showers.
In our experiment, all data are taken using the simultaneous source and background tracking mode, optimal for observations of a gamma-ray source. The source is positioned at the center of the field of view during observations in this mode. The large camera field of view of >8 allows for both on-source observations and simultaneous estimation of the background caused by cosmic rays. The number of background events in the signal region is estimated using several regions positioned at a ∼1.0 –1.5 degree offset from the source region and distributed symmetrically with respect to its location. This technique is of high observation efficiency as the source, and cosmic ray background observation conditions like thickness and other atmosphere parameters remain the same for the on-source and background data. Also, the large field of view provides a broader choice of the background regions and excludes an influence of the studying source, especially in the case of an extended object.
The Cherenkov telescope performance, observation methods of data taking, data analysis including the selection criteria, etc., is summarized by its angular resolution and sensitivity to the gamma-ray flux. The accuracy of the determination of the coordinates of the source of the individual gamma-ray shower in SHALON experiment is ∼0.07 [42], and it is increased by a factor of ∼10 after the additional joint shower processing [42,48] using deconvolution algorithm [49]. The telescope’s sensitivity is defined as the minimum flux of gamma-rays for a statistically significant detection. Here, the minimum flux of gamma-rays for the 50 h of observation of a point-like source in SHALON experiment at a confidence level of 5 σ calculated according to formula 17 in the paper [50] is estimated. Thus, the telescope sensitivity to detect a point-like source at an of 5 σ for 50 h of observation is determined with an integral flux of 2.1 × 10 13 cm 2 s 1 at the energy of 1 TeV (for details see [42,43,45,51]).
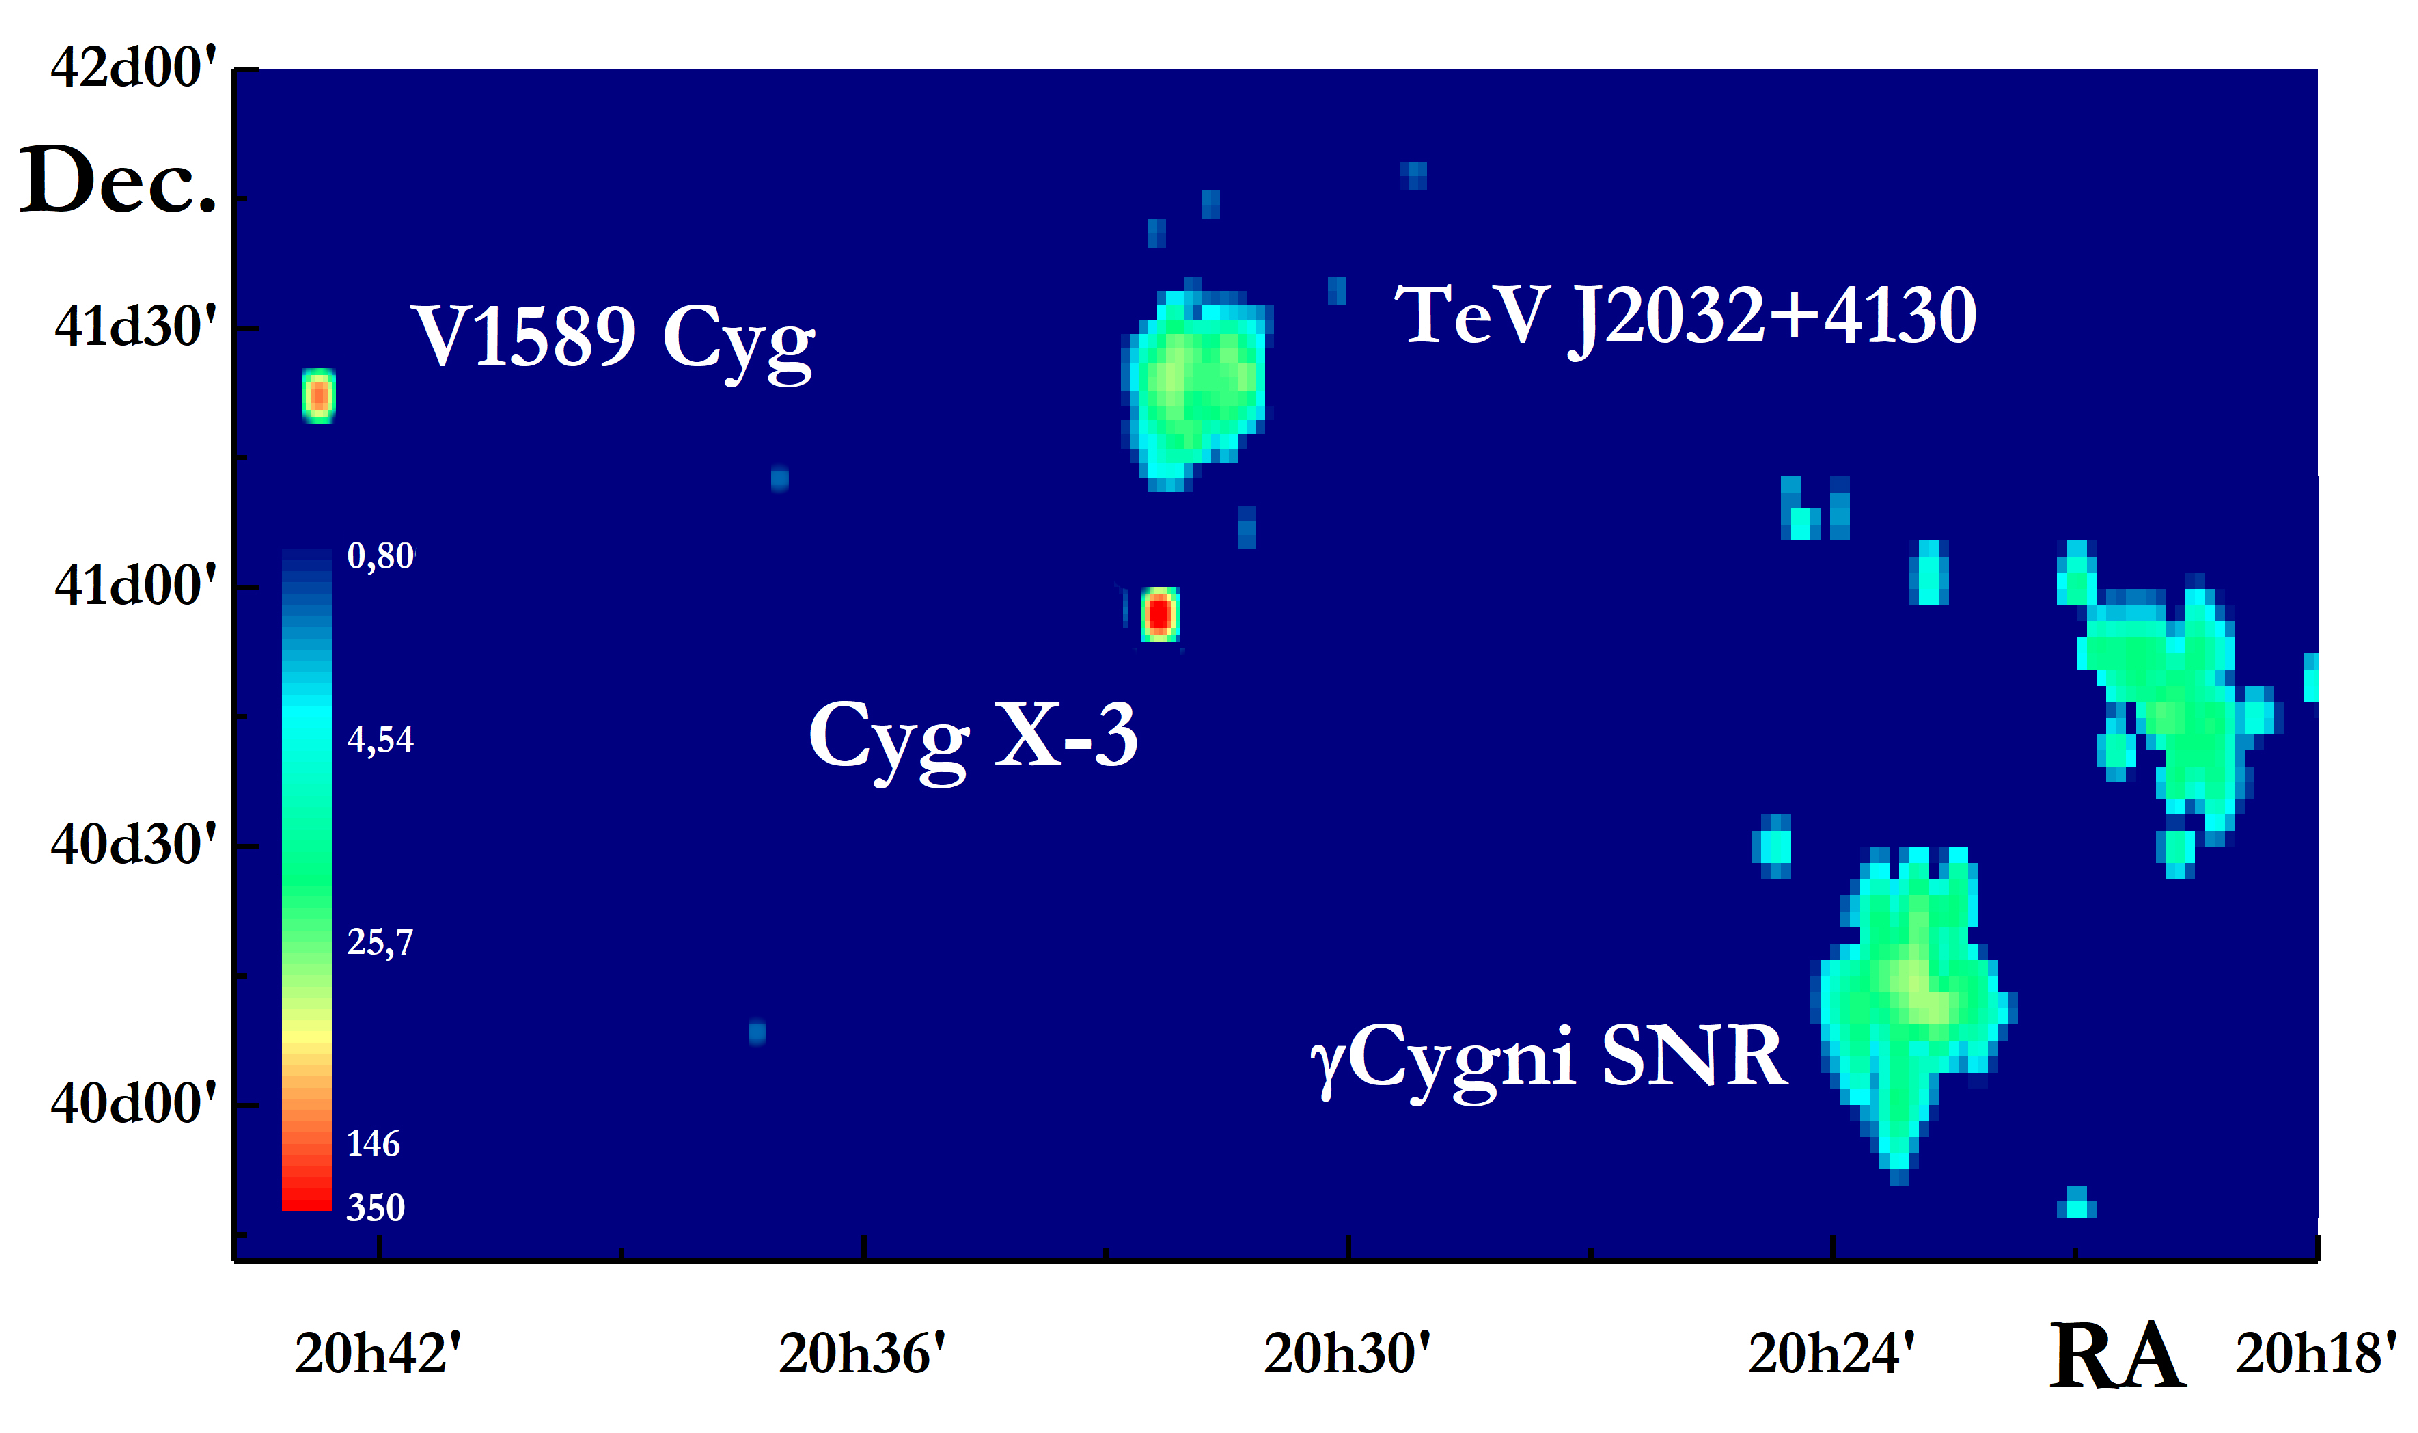
Under the SHALON program of long-term studies of active galactic sources at TeV energies [41,52], observations of the Cyg X-3 binary system were started in 1995. The data were taken in the clear moonless nights at zenith angles between 3 and 34 . SHALON observations yield the detection of TeV gamma-ray emission from Cyg X-3 [48,53,54]. Since 1995 Cyg X-3 and its surroundings have been intensively studied by SHALON telescope (see Figure 2 and [51,54,55,56]). Cyg X-3 is connected with the Cygnus Region, which is host to a large number of sources of the different types. Among them are γ Cygni SNR, V1589 Cyg, TeV 2032 + 4130. Figure 2 shows the emission map of Cygnus Region in the units of the excess signal in the logarithmic scale. A possible mixing of the events from the mentioned sources to the signal from Cyg X-3 was studied with the checking event by event analysis of the angular distance and the reconstructed shower direction. It was found that 3.9% of showers were recognized as originating from objects other than Cyg X-3, and the properties of the Cyg X-3 emission were then investigated with the clear shower set.
Figure 2. Emission map of the Cyg X-3 centering region viewed by SHALON.
Universe 08 00057 g002
The source of variable gamma-ray emission at an energy range from 800 GeV up to 100 TeV was detected by the SHALON telescope. This source was identified with Cyg X-3 binary system based on its location and the orbital period. Also, the flares and periods of both high and low fluxes were detected. Cyg X-3 average integral flux of very-high-energy gamma-rays is found to be a value of I ( E > 800 GeV ) = ( 6.8 ± 0.4 ) × 10 13 cm 2 s 1 . Gamma-ray emission was detected at energies above 800 GeV at a 34.1 σ level [50] for the 312 h of observation. The differential Cyg X-3 spectrum between 800 GeV and 100 TeV in the overall observation period can be fitted with d F / d E = ( 6.6 ± 0.5 ) × 10 13 × E 2.04 ± 0.09 × e x p ( E / ( 72 ± 8 ) TeV ) cm 2 s 1 TeV 1 with χ 2 / D o F = 1.35 (with D o F = 10 ). The upper limits on the Cyg X-3 emission in the energy range from 0.2 to <3 TeV were obtained by VERITAS [57] and Magic [58] experiments for 44 and ∼56 h, respectively. In Figure 3, left (▲), differential spectrum of gamma-ray emission from Cyg X-3 by SHALON together with upper limits from VERITAS and Magic observations in the energy range from ∼1 to 100 TeV are presented.
Figure 3. left: Differential spectrum of gamma-ray emission from Cyg X-3 by SHALON (▴); right: The differential spectra of very-high energy γ -rays from Cyg X-3 in different intervals of orbital modulation. The lines represent the fit to each spectrum.
Universe 08 00057 g003

3.1. Orbital Modulation

The most remarkable Cyg X-3 light curve feature is a 4.8-h pseudo-sinusoidal modulation, which is believed to be due to the orbital modulation of the binary system. So, an analysis was performed to search for the 4.8-h orbital period of Cyg X-3 and identify the gamma-ray source detected in our experiment with Cyg X-3. The evolution of Cyg X-3 orbit has been well studied. The ephemerides of 4.8 modulation of this source are obtained over a long period of observations starting from 1970 [59,60,61,62,63]. Here we use the parabolic ephemerides from [61,62]. The values of an orbital period of 0.1996843 days and the minimum X-ray flux epoch JD 2454857.193 [62] as a zero phase were used for the testing of observation data of Cyg X-3 for on periodicity. In [60,63,64,65] it was shown that the period of Cyg X-3 increases slowly, if the ephemerides in the quadratic form are used, the value of the period derivative is 6.48 × 10 10 [60,63,64]. It means that the Cyg X-3 period changes at the time scale of 1.18 × 10 6 yr 1 . As a result, we folded > 800 GeV gamma-rays collected within the entire time of observations with the given period of the source of 0.1996843 days into the two-period-length light curve with a ∼19-min time bin. The correction of gamma-ray arrival time for the Earth’s orbital motion was applied. Also, as the observation time of Cyg X-3 for an individual interval of the folded light curve varies significantly, each event was weighted corresponding to the observation time in this interval. The resulting TeV emission light curve has a quasi-sinusoidal shape similar to one obtained from various low-energy observations and a 4.79143 h period, which is the attribute of the emission modulation with the orbital period of the binary system Cyg X-3 (Figure 4 and [48]).
The amplitude of orbital modulation and a possible shift in phase at the different energy ranges can point to the location of the emission region and trace an emission origin through the entire electromagnetic spectrum from radio wavelengths up the very high energy gamma-rays.
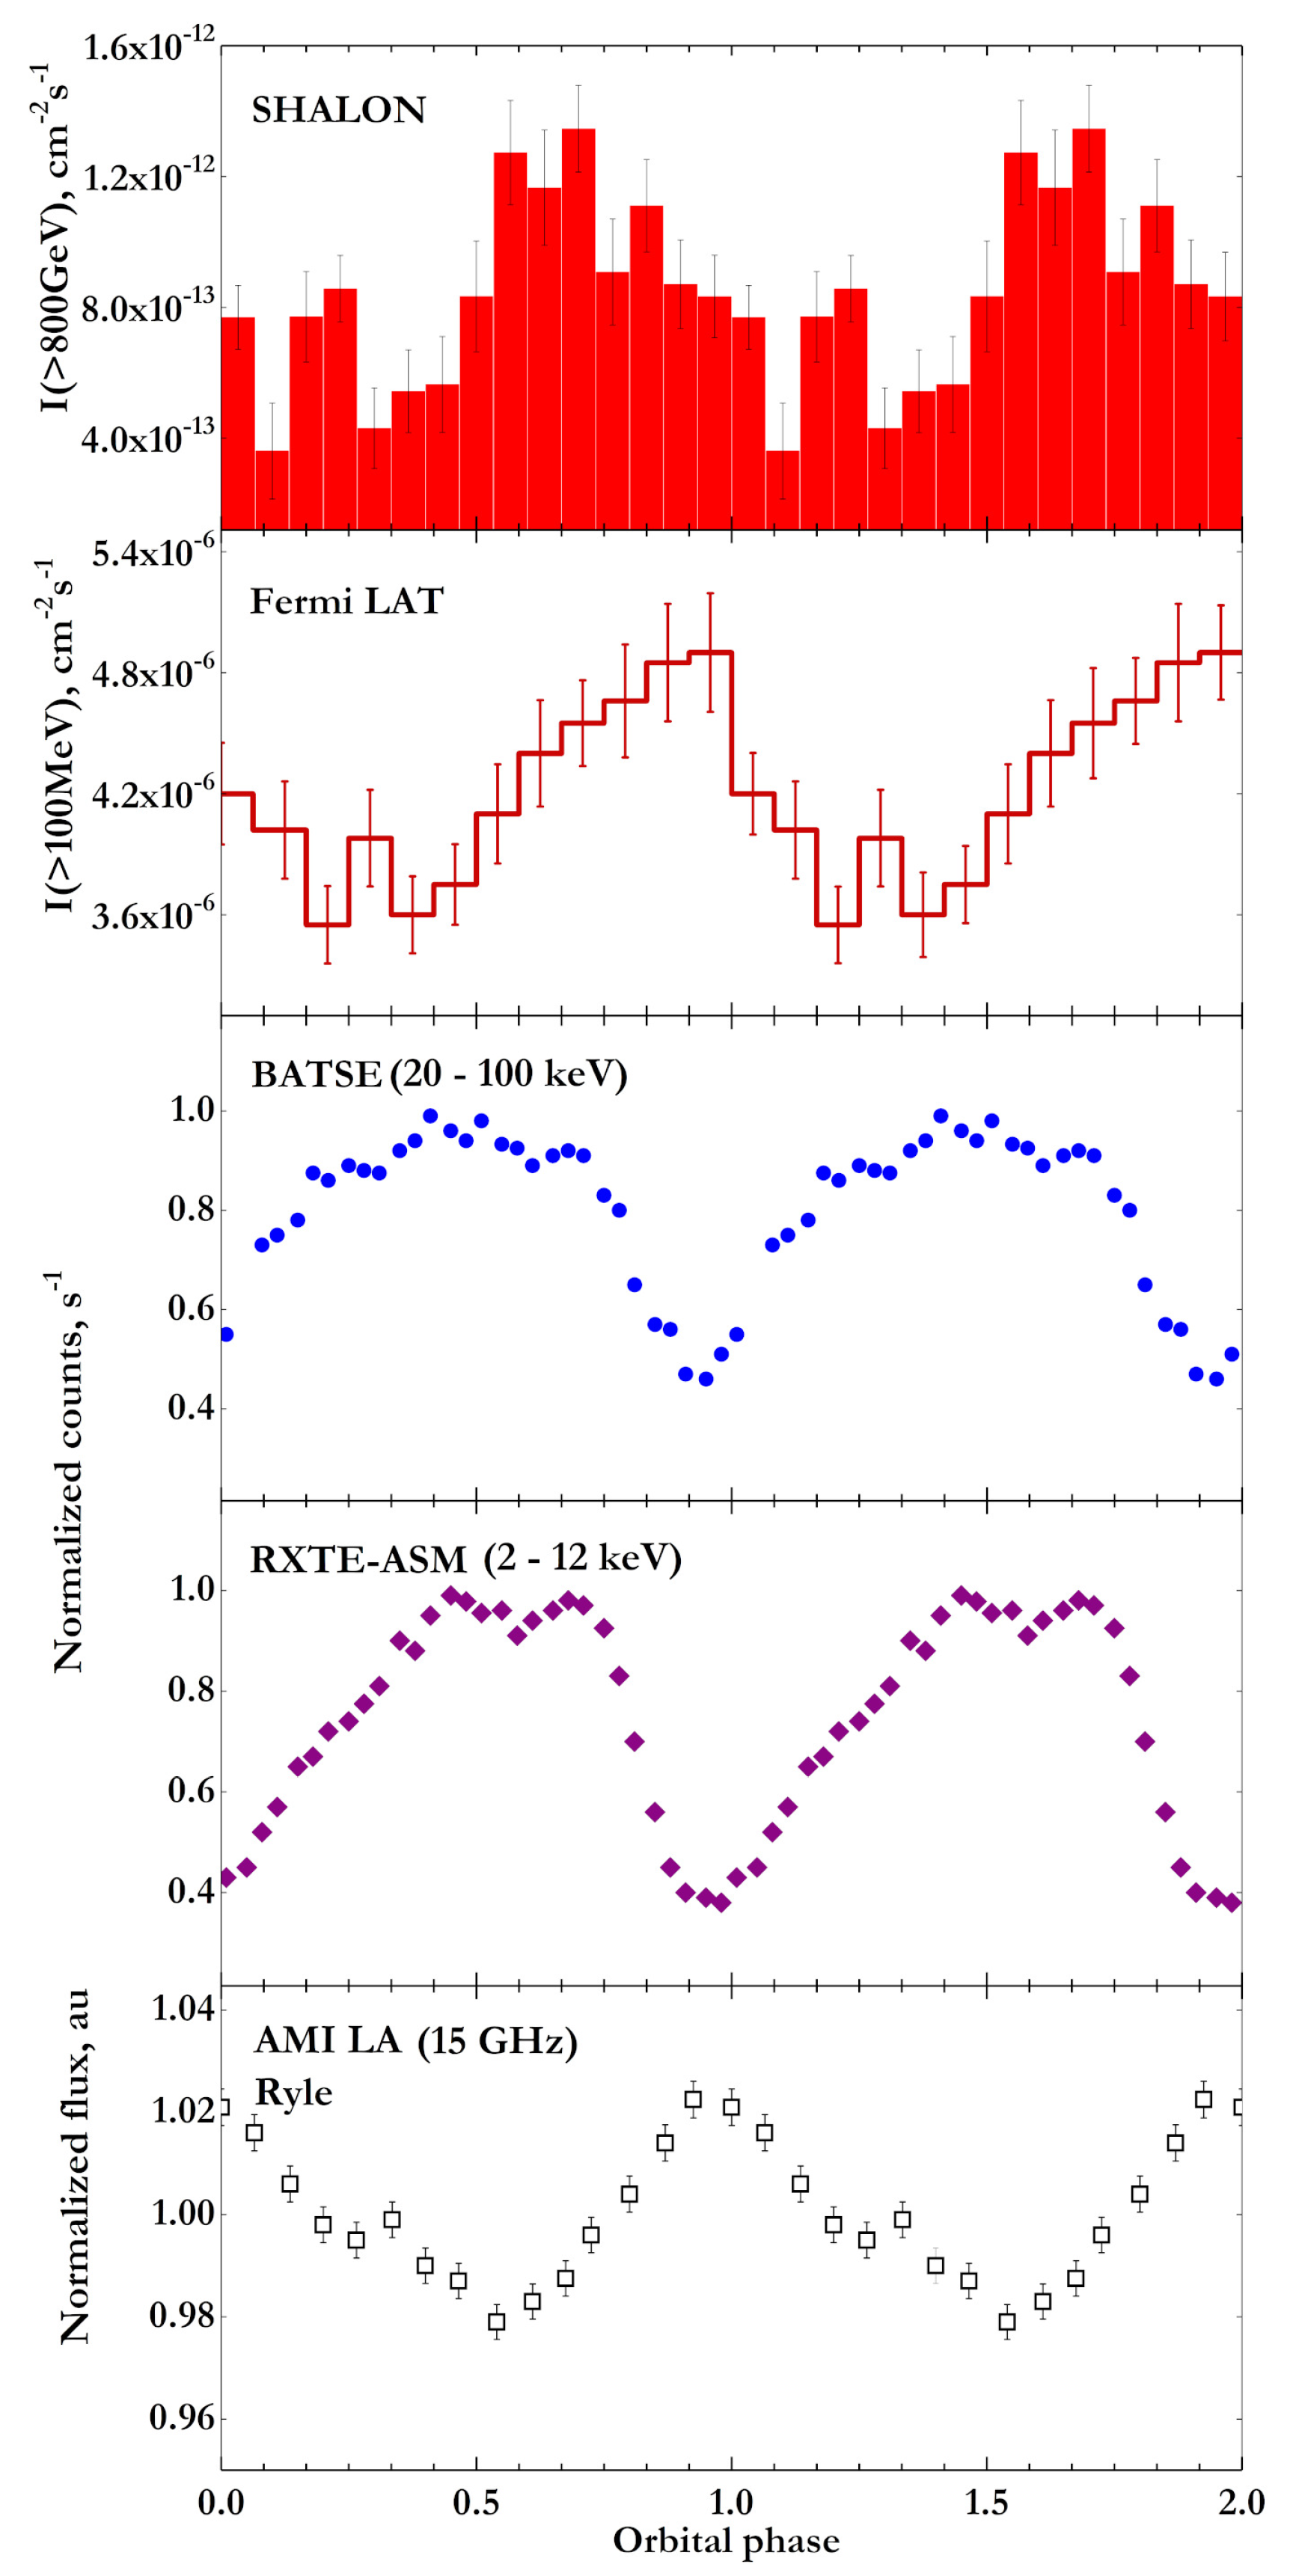
Figure 4. The light curve of Cyg X-3 folded with the orbital period of 4.8 h by SHALON (red area) compared with other data (see text).
Universe 08 00057 g004
We compared the SHALON light curve at 800 GeV–100 TeV (red area in Figure 4) folded on the orbital period to the folded 100 MeV–100 GeV light curves from the Fermi-LAT observations during the active periods of Cyg X-3 (red line) [26] and to ones 20–100 keV hard X-rays from BATSE monitoring of the source during 1991–2000 (blue points), as well as to 2–12 keV soft X-rays from RXTE-ASM 1996–2002 years observations (violet points). The modulation amplitude at 800 GeV–100 TeV energies is found to be ∼65%, which is comparable with one at hard and soft X-rays. Whereas 100 MeV–100 GeV light curve has an amplitude of ∼25%, though it depends on the Cyg X-3 state, and the value of ∼70% is calculated [25] for the strong flares. Recently, the modulation of radio emission with the orbital period was found in the studies of 22 years of 15-GHz radio observations of Cyg X-3 by the Ryle and AMI telescopes [25]. It depends on the state of Cyg X-3, which is defined by a relation of radio and X-rays emission characteristics and varies from 2.5 to 10%. The amplitude of modulation estimated from data averaged over all observation periods is ∼4%.
In Figure 4, the TeV gamma-ray light curve folded on the orbital period is presented together with ones from observations in MeV-GeV energies, soft and hard X-rays, as well as radio data for the entire 22-year period of studies.
All listed light curves have a similar shape, but ones of high and very high energies have a peculiar peak in the region of the global minimum corresponding to phases of ∼0.3 for Fermi-LAT [26] data and ∼0.2 SHALON [48]. Also, it was found that the different energy light curves are shifted in phase. For example, there is an apparent shift of the phase of flux modulation minimum from the SHALON data at ∼0.2 relative to the X-ray one. So, SHALON flux minimum trials the X-ray minimum by the mentioned value, but, in turn, it leads to the flux minimum measured by Fermi-LAT by ∼0.15. The soft X-ray light curve from the XTE/ASM observation at (2–12 keV) is delayed relative to the light curve of hard X-ray at (44–30 keV) from OSSE data by ∼20 min [66]. Further, a minor time delay of about ( 5.5 ± 8.6 ) min between the X-ray light curves at 40–100 keV by ISGRI and 15–40 keV by IBIS was reported [67], but it is within the measurement error limits.
The gamma-ray spectrum, especially if it is varied with the orbital phase, is an essential tool for probing the mechanisms of emission production in the source. For further studies, differential spectra for three intervals of orbital phase as inferior conjunction, the additional maximum, and superior conjunction were extracted (see Figure 3, right and [48]) and then fitted as the following:
( 1.2 ± 0.10 ) × 10 12 × E γ 2.05 ± 0.10 e x p ( E γ / E c u t )
Here E c u t = 20 ± 3 TeV and the values of χ 2 and D o F are χ 2 / D o F = 0.87 , D o F = 9 .
( 0.51 ± 0.09 ) × 10 12 × E γ 1.83 ± 0.12
where χ 2 / D o F = 1.24 , D o F = 7 .
( 0.35 ± 0.08 ) × 10 12 × E γ 1.65 ± 0.11 e x p ( E γ / E c u t )
with E c u t = 14.5 ± 2.8 TeV values χ 2 / D o F = 0.86 , D o F = 5 are found.
Fitted by a power law with an exponential cutoff spectrum (Equation (1)) corresponds to the orbital phase intervals of 0.0 ϕ < 0.05 and 0.45 ϕ 1.0 with the highest flux near the inferior conjunction. The peculiarity near superior conjunction corresponding to the additional flux maximum in the global minimum of the light curve at the phase interval 0.12 ϕ < 0.25 has a spectrum that is well fitted by hard power-law (Equation (2)) at the energies from 800 GeV to 100 TeV. A hard power-law with an exponential cutoff (Equation (3)) describes the emission spectrum from orbital phase intervals 0.05 ϕ < 0.12 and 0.25 ϕ < 0.45 with the minimum flux near superior conjunction.

3.2. Cyg X-3 Flaring Activity

The remarkable relationship between radio flaring activity connecting with the formation of the jet-like structures and both soft and hard X-ray states is known as a feature of the Cyg X-3 binary [20,21]. Namely, the radio emission was found to be correlated with the hard X-ray emission depending on the state of the source: the anti-correlation is observed in the quiescent state. But during the major flaring and quenched radio states, the correlation with hard X-ray emission is detected. Also, the radio emission is correlated with soft X-rays if low fluxes (see [24]). Generally, the soft and hard X-ray fluxes of Cyg X-3 are anti-correlated [7,68]. Based on the observed correlation radio/X-ray properties of Cyg X-3, its states were defined in [10,11].
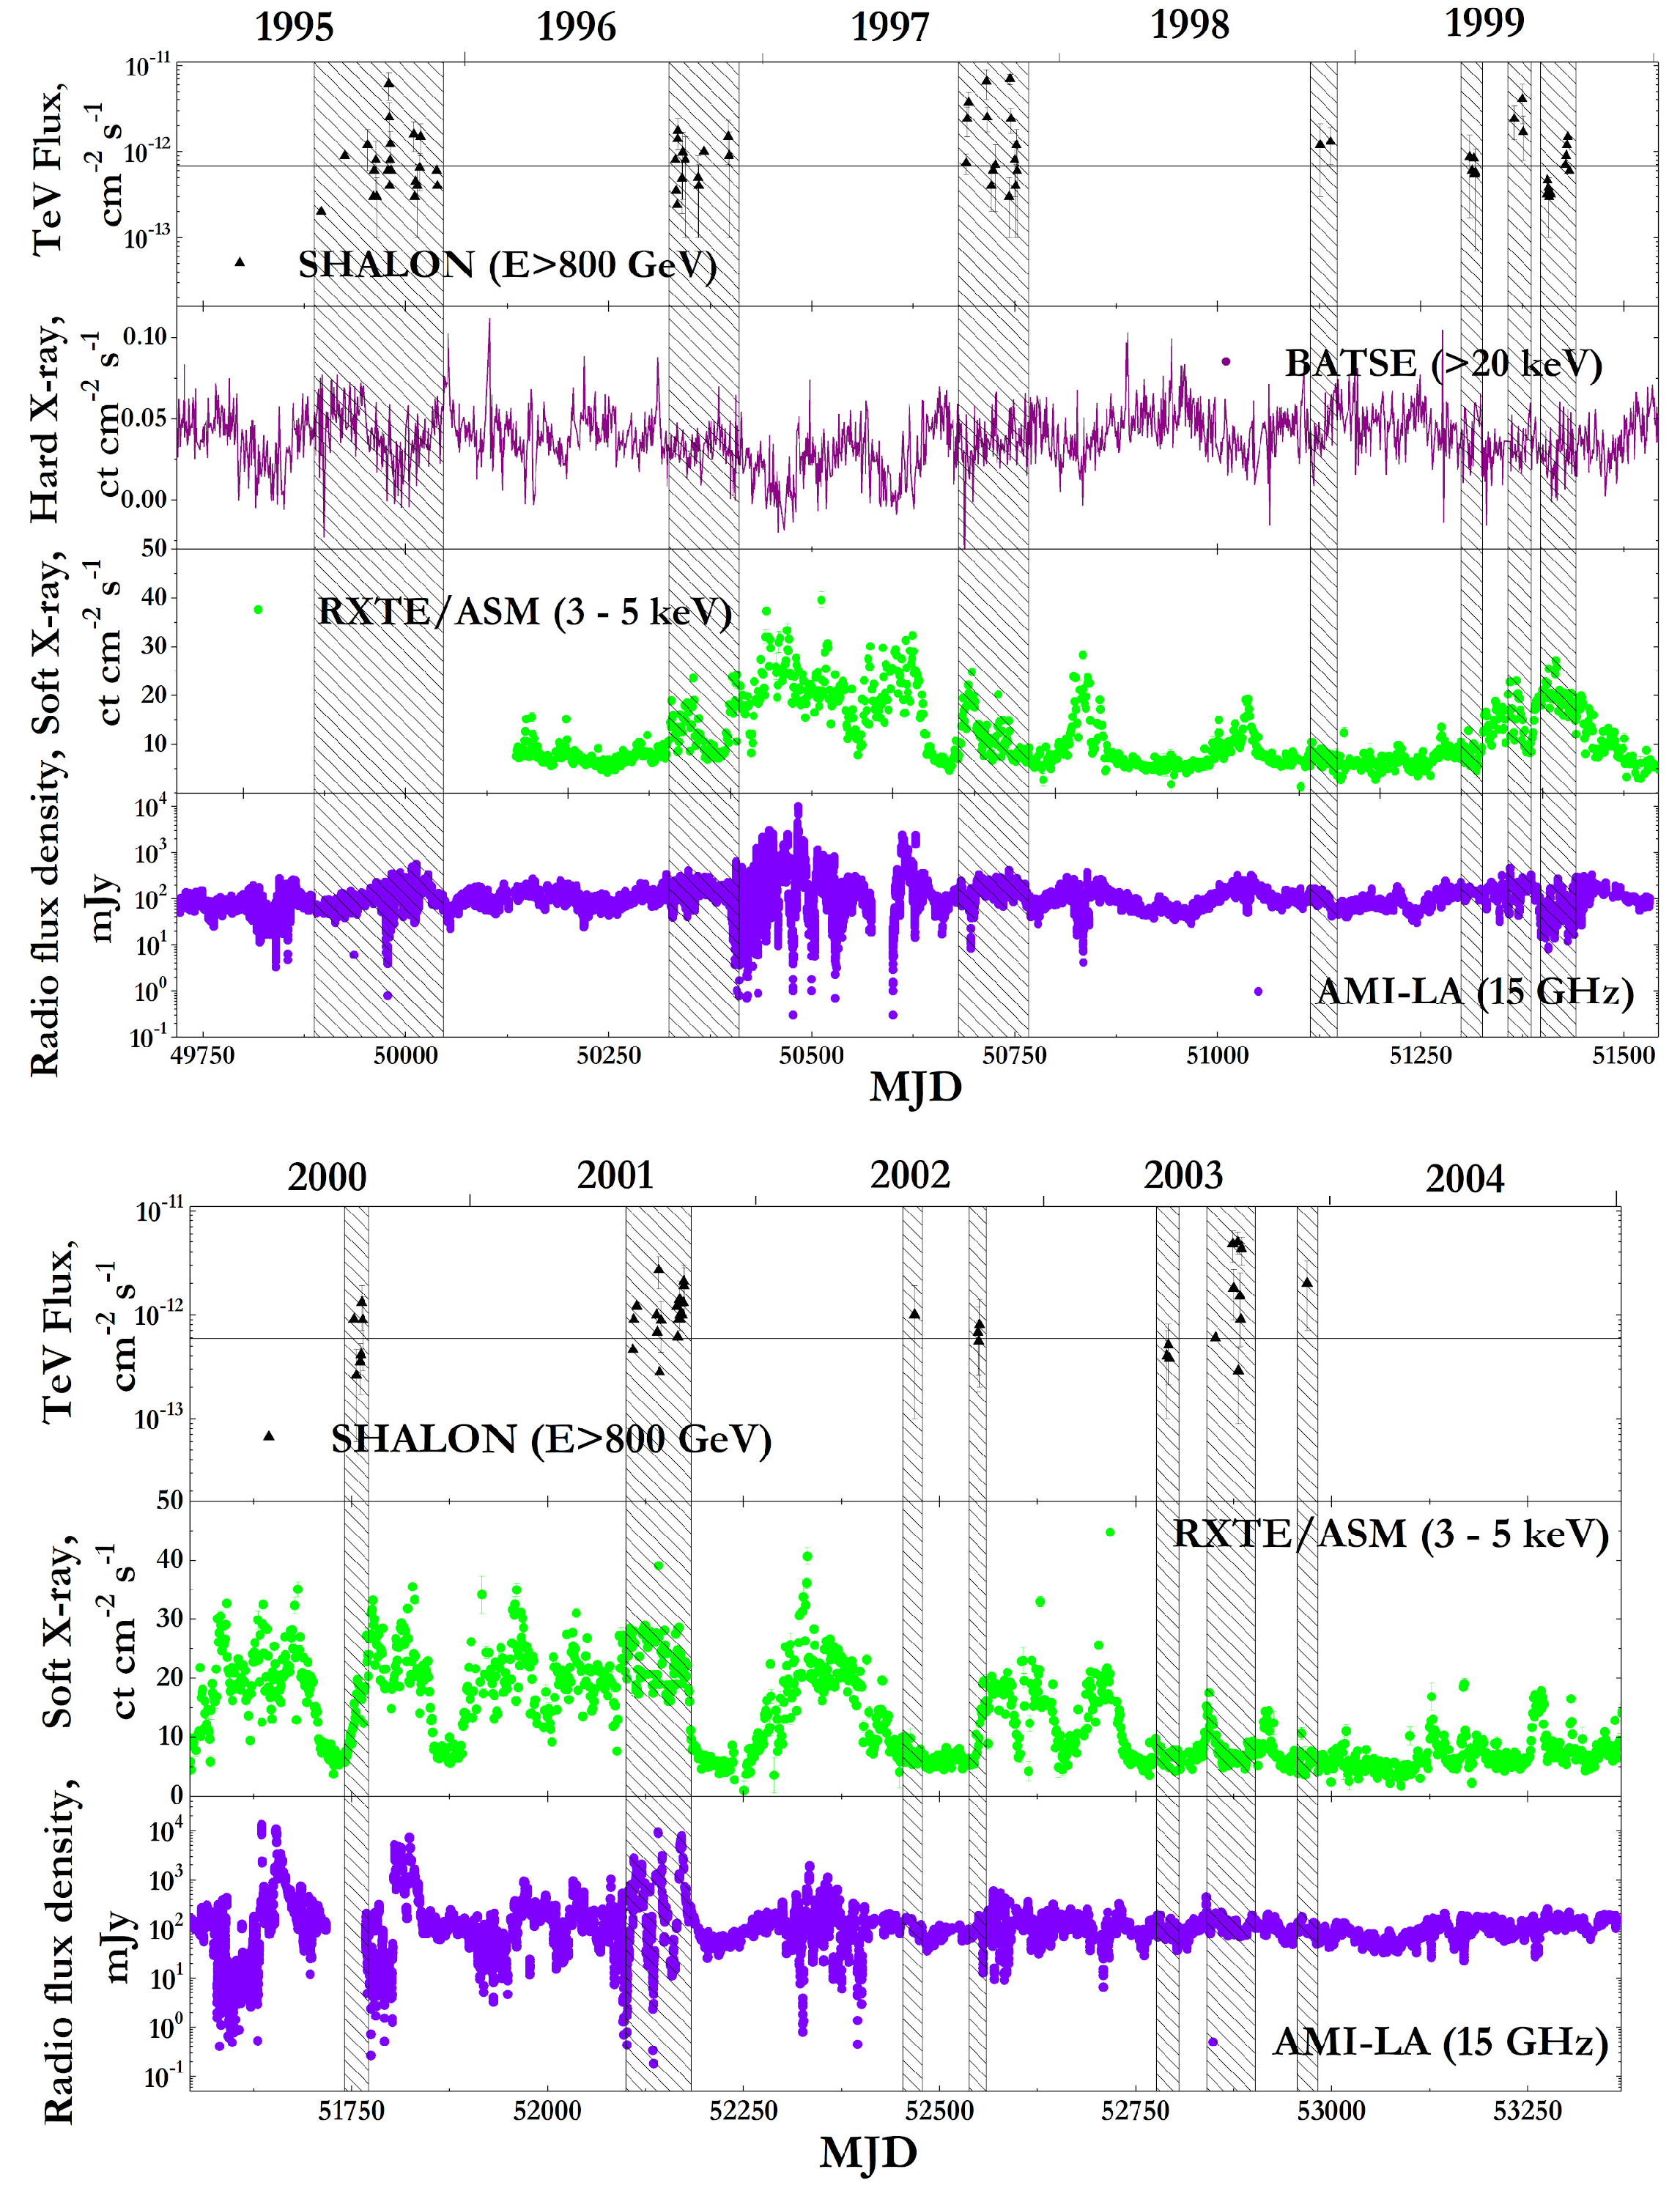
During the long-term investigations of Cyg X-3 at TeV energy range ( E > 800 GeV) with the SHALON, low- and high-intensity periods, and flares, were found and covered different object states in radio, soft and hard X-rays, and MeV-GeV energies. The radio, soft and hard X-ray light curves are used together with those from the SHALON observations at TeV energies and at MeV-GeV range from the Fermi-LAT first to characterize the source states and demonstrate the correlation of different energy ranges’ signal. In Figure 5 and Figure 6 the light curve data from the wide energy range are collected.
Figure 5. Light curve of Cyg X-3 in a wide energy range: radio 15 GHz (RT/AMI), soft X-rays at 3–5 keV (RXTE/ASM), hard X-rays at 20–2000 keV (BATSE), and very high energies 800 GeV–100 TeV (SHALON). The data over the period 1995–2004 are presented.
Universe 08 00057 g005
There were extensive X-ray coverages of Cyg X-3 from 1995 to 2015 by RXTE/ASM at 3–5 keV, MAXI at 2–5 keV, Swift/BAT at 15–50 keV, and BATSE at 40–70 keV as well broad radio data from RT/AMI and OVRO at 15 GHz and RATAN at 2.15, 4.8, 11.2 GHz that were taken simultaneously with the SHALON observations at 800 GeV–100 TeV (see the black triangles in the upper part of Figure 5 and Figure 6; the points without any indication of the errors are upper limits). Also, Cyg X-3 light curve from the Fermi-LAT at 100 MeV–100 GeV is available from the year 2008. We use light curves of the source from the radio and (soft and hard) X-rays, MeV–GeV, and TeV energies, as shown in Figure 5 and Figure 6 to distinguish the states and relationships between all mentioned above data. As a result, it was found that the flares and low- and high-intensity periods detected by the SHALON at >800 GeV are taking place in a particular correspondence between the radio and X-ray activity.
For example, TeV gamma-ray flux increases were recorded in the periods of low radio flux densities when falling to ∼10–20 mJy, but 4–7 days before their rise to the values of ∼300–600 mJy, the radio states referred to a minor flare (see 1995 MJD 49979, 1996 MJD 50397, 1997 MJD 50693). In the soft X-rays, high activity was detected at the same time. A very high energy flare of 2009 at MJD 55092 was also observed during the high activity in soft X-rays and during the period of flux densities of 14 mJy in the radio range. The radio flare did not follow this gamma-ray flare of 2009, but the flux density rose to a quiescent state level of ∼120 mJy.
Figure 6. Light curve of Cyg X-3 in a wide energy range: radio 15 GHz (RT/AMI), 11.2 GHz (RATAN-600), soft X rays at 3–5 keV (RXTE/ASM) and 2–4 keV (MAXI), hard X rays at 15–50 keV (Swift BAT), high energies >100 MeV (Fermi LAT), and very high energies 800 GeV–100 TeV (SHALON). The data over the period 2005–2015 are presented.
Universe 08 00057 g006
The increases of TeV gamma-ray emission were also detected within the 1–7 days before the so-called major flare whose flux density of 1000–9000 mJy value during the periods of high soft X-ray fluxes, but low activity at hard X-rays (see dates of 2001 MJD 52142, MJD 52172, 2006 MJD 53937 and 2009 MJD 54988). The high values of TeV gamma-ray fluxes are recorded during the intervals of high activity in soft X-rays but low fluxes of hard X-rays within 2–6 days after minor radio flares (see Figure 5: 1995, 1997, 1999). The TeV gamma-ray intensity rise lasts from one to four days, and decay was detected to be about one day if the flare was recorded entirely with both the rise and the fall.
The notable Cyg X-3 light curve feature is that the very high energy low-intensity periods happen during the low activity in the radio and soft X-rays. In contrast, the intensity of hard X-rays is high (see Figure 5 and Figure 6: 1998, 2002, 2005, 2012).
So the periods of low intensity and flares detected in long-term observations of Cyg X-3 with the SHALON at energies > 800 GeV were found to occur with a striking to the eye correlation/anti-correlation between the radio and X-ray emission. To confirm the existence of these correlations/anti-correlations, we extracted the two states at energies > 0.8 TeV, namely: LTeV—low integral fluxes with I L T e V (>0.8 TeV) < 4.5 × 10 13 cm 2 s 1 and HTeV–high gamma-ray fluxes with I H T e V (>0.8 TeV) > 1.5 × 10 12 cm 2 s 1 . Also, the values of soft X-ray fluxes (RXTE/ASM from 1996 and MAXI from 2012)—SXR, and hard X-ray fluxes (Swift-BAT from 2005)—HXR corresponding in time with the SHALON data at TeV energies were extracted. A correlation between the fluxes of TeV-energy gamma-rays and the soft X-rays (RXTE/ASM from 1996 and MAXI from 2012) is traced over the all period of the SHALON long-term observations using Spearman correlation coefficient r s = 0.8 ± 0.1 and p = 1.7 × 10 5 . In contrast, there is an anti-correlation of a flux of TeV gamma-rays with one of the hard X-rays (Swift BAT from 2005) at the level of r s = 0.75 ± 0.15 with p = 2.2 × 10 6 . The correlation of the >800 GeV gamma-ray fluxes of HTeV value with the radio emission during flares with a flux density of >300 mJy (the data from the RT/AMI observations from 1995) was calculated as a function of the time shift d T . The maximum value of r s = 0.87 and p = 7.2 × 10 3 is achieved with dT = 7 ± 2 days. The paper [25] reported a similar delay within the 10 days of radio emission from high-energy gamma-rays from Fermi LAT observations.
The changes in TeV gamma-ray spectra depending on the activity of Cyg X-3 are found. For example, the emission at energies > 800 GeV of the low-intensity periods of the 2005 and 2012 years occurred when the soft X-ray fluxes are low, and in the radio band flux densities are of (∼ 50–90 mJy) so-called a quiescent state, but hard X-ray fluxes are high. The TeV-energy emission in the years 2005 and 2012 is characterized by a soft power-law spectrum with an index Γ d i f f 2.5 (see Figure 7).
Figure 7. Differential spectra of the gamma-ray emission from Cyg X-3: low-intensity periods of the 2005 and 2012 years and during the flux increases and decrease of the 2009.
Universe 08 00057 g007
The illustration of the Cyg X-3 behavior in TeV energies in the year 2009 from the flare to decrease is presented in Figure 7 right and Figure 8. Here, the Cyg X-3 emission characteristics changes in 2009 are traced from the flare (Figure 8, red circles), which occurred when it was the high state period in the soft X-rays, the hard X-ray fluxes are low and 8 days before the major radio flare. In the Fermi-LAT data at energies of >100 MeV, a flux increase was also detected. The September rise in intensity of TeV gamma-rays (Figure 8, blue squares) occurred during the decrease of radio flux densities to ∼10 mJy value at the period of low radio activity when the soft X-ray fluxes fall but the intensity in the hard X-ray is growing. The follow-up decrease of TeV gamma-ray emission intensity is characterized by the spectrum in Figure 8 (violet diamonds). It was detected during the quiescent in radio and a low state in soft X-rays but high hard X-ray fluxes.
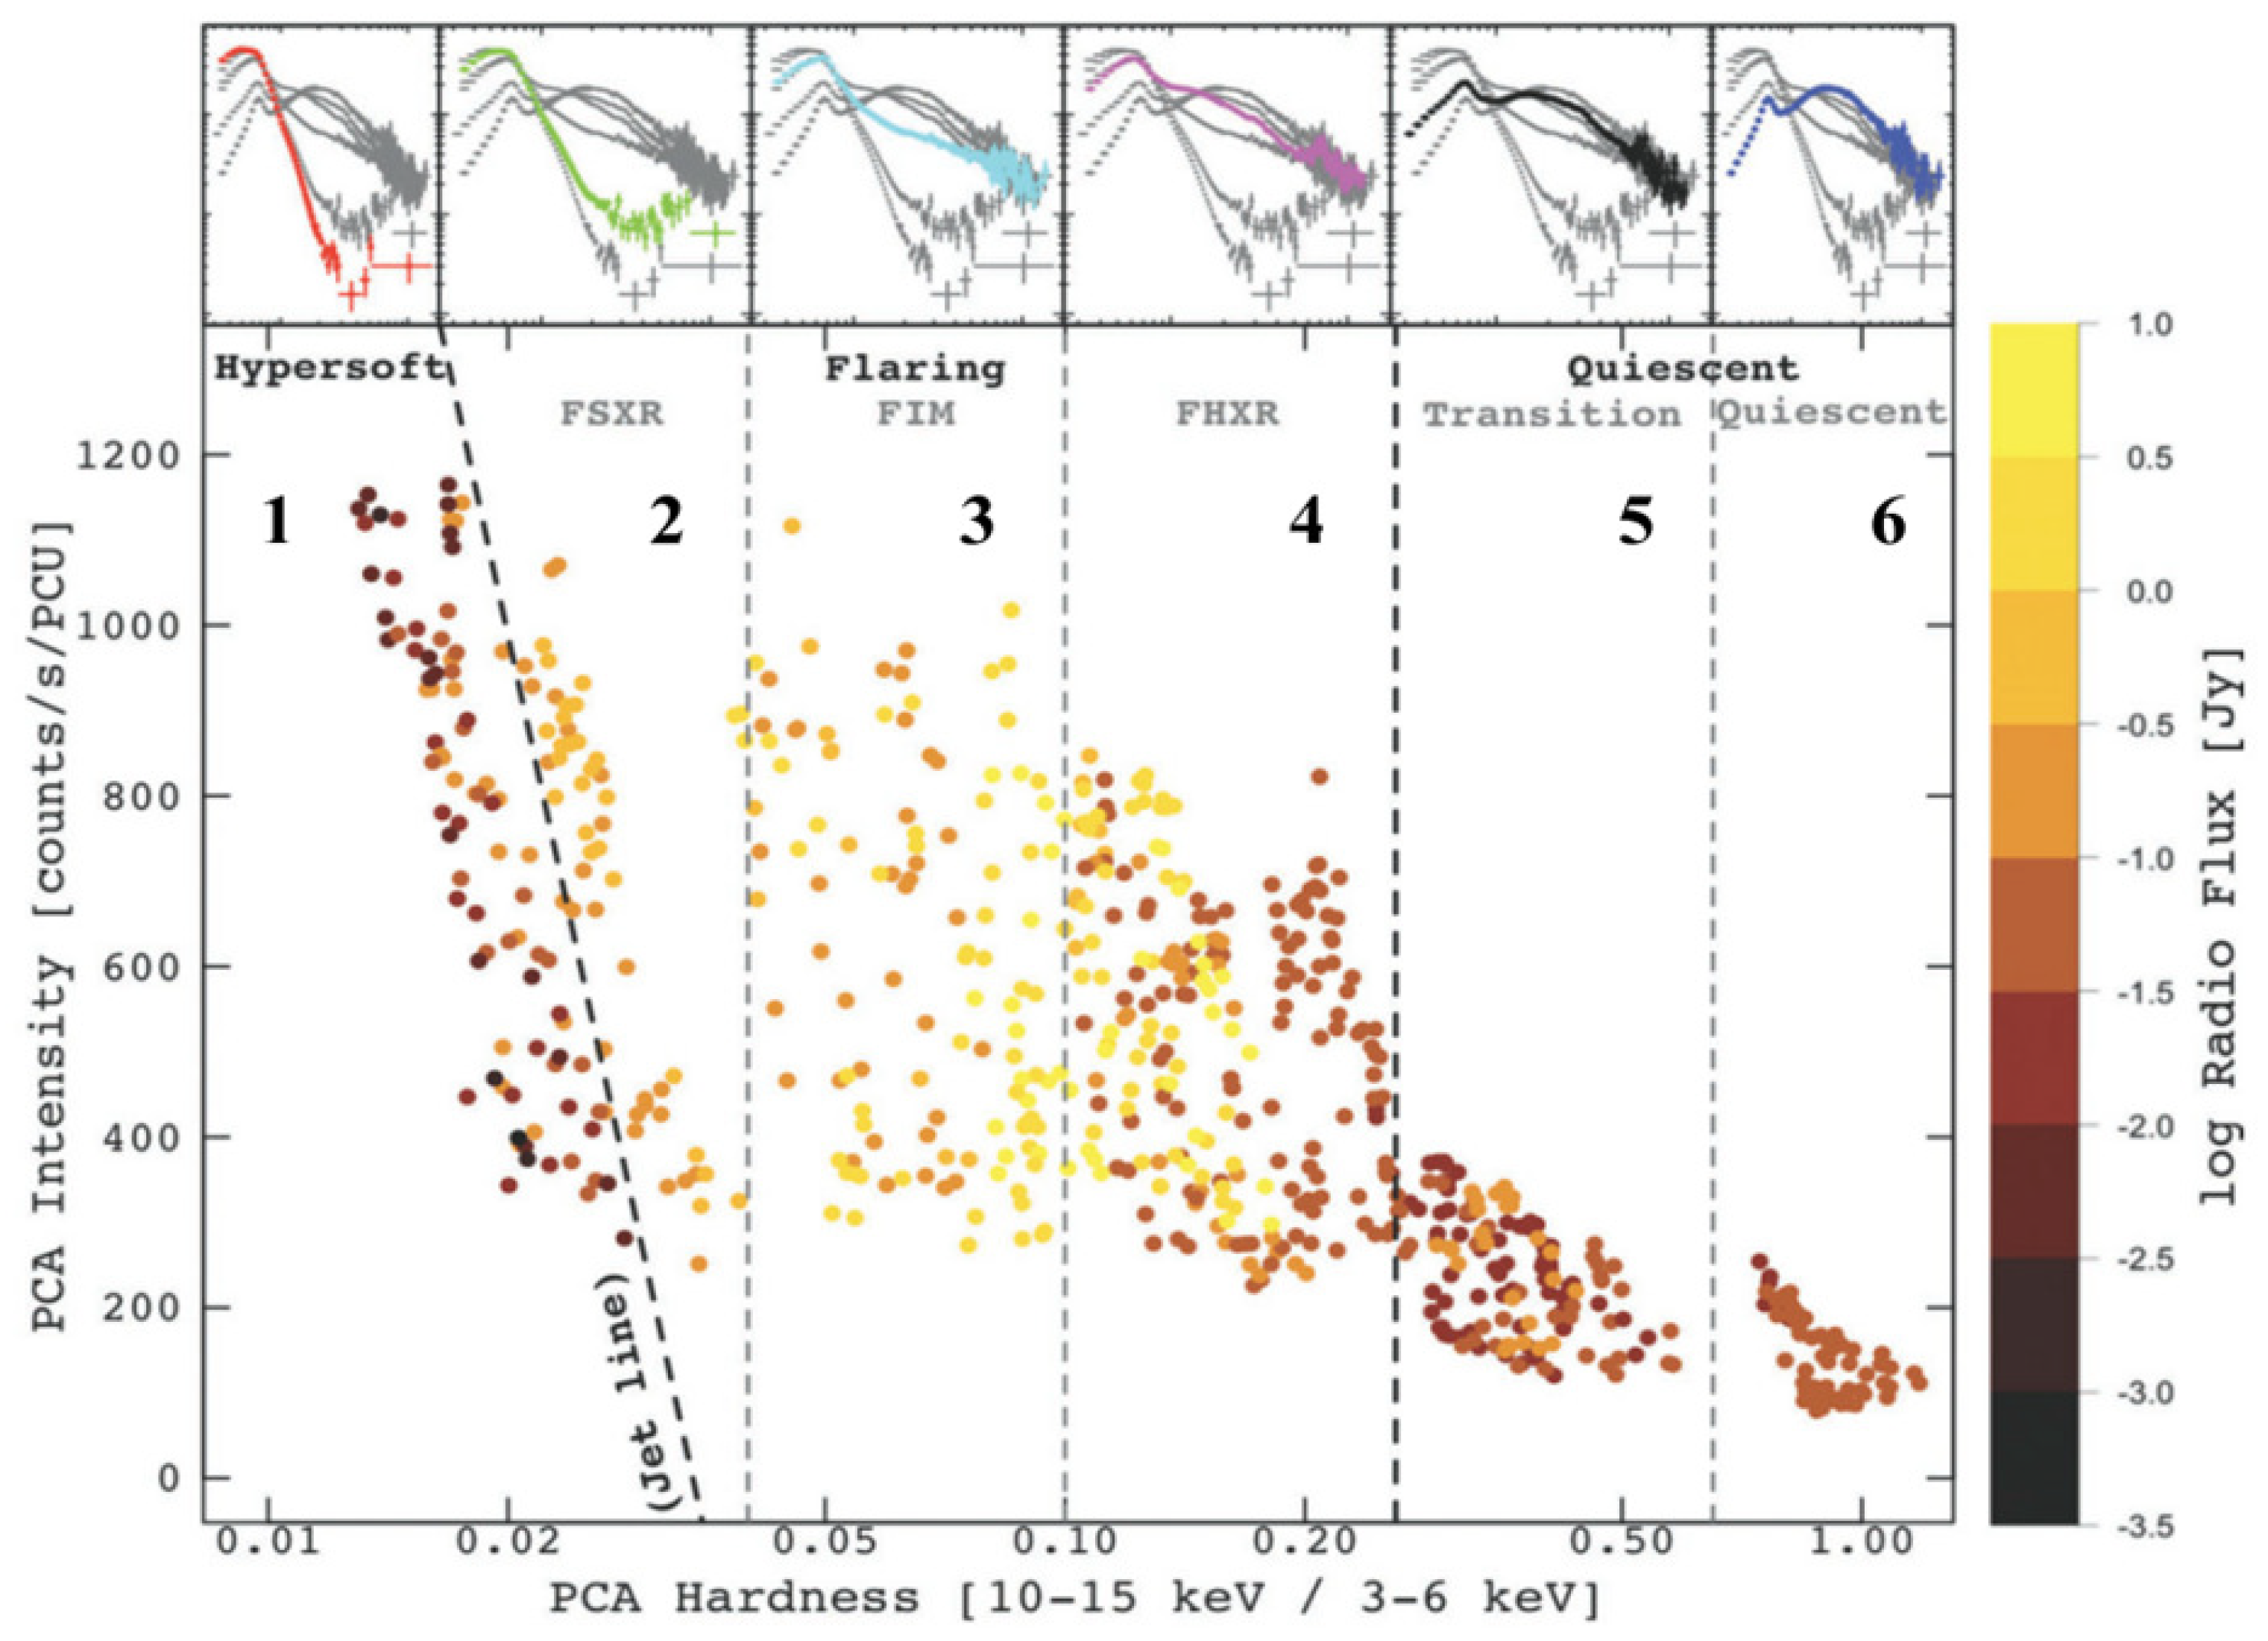
The Cyg X-3 behavior in the X-ray energy range and the radio band were analyzed in paper [11] using RXTE data and Ryle, GBI, and RATAN-600 observations. Depending on the ratio of the intensities in soft and hard X-rays, the spectral characteristics in the whole X-ray energy range, and information about radio flux densities, six states are revealed (see Figure 9 adopted from Figure 3 of [11]).
Figure 8. Spectral energy distribution of the γ -ray emission from Cyg X-3 during the flux increases and decrease in 2009 compared with Fermi LAT fluxes refer to different states (see text).
Universe 08 00057 g008
Figure 9. Diagram of states adopted from Figure 3 of [11]: The behavior of Cyg X-3 in the radio (Ryle, GBI, RATAN-600) and X-ray (RXTE) bands were analized and six states, depending on the ratio of the intensities in these ranges and the spectral characteristics in the X-ray energy band were revealed.
Universe 08 00057 g009
According to the diagram of the Cyg X-3 states, the flare observed at very high energies from Cyg X-3 in May 2009 with a soft power-law spectrum as well as Fermi-LAT fluxes refer to region 1 in Figure 9 from [11] corresponding to the hypersoft state and transition to region 2 of soft state. Fermi-LAT data for the soft states is presented in Figure 8 with filled squares, and day flares are the filled circles [25]. Detected in September 2009 gamma-ray emission of high intensity characterized by the hard power-law spectrum corresponds to the region 4 and the boundary of the transition to region 5 on the diagram in Figure 9. The decrease of TeV energy emission intensity with a hard spectrum observed in the leftover autumn of 2009 corresponds to region 5 on the diagram. Fermi-LAT data corresponding to this hard state is shown in Figure 8 with the open diamonds. High-level TeV fluxes, which are detected near the major radio flares periods and during the transitions from the high state in soft X-ray, attribute to region 2 or transit to 3 regions. The low-intensity periods of 2005 and 2012 at very high energies refer to region 6 of the diagram as the radio and soft X-ray fluxes are low, but the high hard X-rays were detected. As a result, the information about the intensity and spectral characteristics of very high energy emission from Cyg X-3 can adjunct the diagram of the radio—X-ray states [11].

4. Results and Discussion on the Origin of TeV Emission from Cyg X-3

In the course of more than 20-year-long studies of Cyg X-3 in the energy range from 800 GeV to 100 TeV the variable very high energy gamma-ray emission was detected corresponding to the different low energy states for this object. A series of flares from Cyg X-3 and its low-level fluxes at more than 800 GeV correlate with the X-ray and radio energy range activity. The modulation of the TeV-energy gamma-ray emission with the orbital period of Cyg X-3 was found, and energy spectra retrieved for different phase intervals have a different spectral shape.
The generation of the detected very-high-energy gamma rays requires both the presence of particles accelerated up to ultra-high energies, and a dense enough matter. Cyg X-3 belongs to the accreting binary system with a relativistic jet, so an acceleration of the particles could occur both directly inside and along the jet that develops up to parsec-scale distances. In addition, particle acceleration on shocks produced by the jet’s interaction with the ambient matter may be the gamma-ray emission and cosmic rays origin scenarios [69]. Currently, the origin of primary particles responsible for the TeV-energy gamma-ray generation in the accreting binary system of both leptonic and hadronic scenarios is debated.
In our observations, the Cyg X-3 flaring activity at more than 0.8 TeV energies was found to be within 6–8 days to minor and major radio flares. The radio and gamma-ray flares’ reported delay indicates that the radio emission originates from about ∼150 mas away from the system, unlike the gamma-rays. Indeed, the radio emission during the flares is detected at distances of a few tens of milliarcseconds from the central compact object further out of the jet and a jet propagation velocities up to 0.6–0.8 s [22,70]. Also, the TeV gamma-ray emission modulation with orbital period and its amplitude suggest that the emitting region is smaller than the orbit size and is estimated as (2–3) × 10 11 cm [26,71]. The correlation of the flaring activity at TeV energies with the flares of Cyg X-3 at radio band, as well as the delay, observed between the flares in these energies, together with gamma-ray flares occurring at hypersoft and transition from the hypersoft to soft and further to hard states (regions 1-2-3 of Figure 9), may point to the switching on of the processes of powerful mass ejections from the central regions around the black hole.
The inverse Compton scattering of photons from the Wolf–Rayet companion star and associated wind by electrons of ultra-high-energies has been considered a natural candidate to explain the very high energy emission. The gamma-ray flux modulation is directly produced in the case of inverse Compton scattering origin due to the orbital motion of the binary system. Photons from the Wolf–Rayet star, backscattered to an observer, form the maximum of the light curve at the orbital phases with corresponding companion star position (Figure 4). As it was found that the observed very high energy emission is mostly connected with the radio flares, the ultra-high-energy electrons are supposed to be located in relativistic jets. Cyg X-3 microquasar has unique characteristics that are a tight orbit, strong companion star wind of ∼1000 km s 1 velocity, a high density reaching 10 13 cm 3 [26]. Also, a unique feature that is related to the mentioned above is the very high companion star luminosity of about 10 39 erg s 1 . It was shown in [72], that such a high luminosity accompanied with a tight orbit leads to an efficient generation of gamma-ray emission through the inverse Compton scattering in Cyg X-3.
Meanwhile, the combination of the above characteristics of the orbit and star wind could drive the hadronic mechanism of very high energy gamma-ray emission production if cosmic rays are also accelerated in the source and then interact with nuclei in the stellar wind. The detection of gamma-ray emission in the interval of orbital phases of the light curve corresponding to the additional flux maximum in the global minimum, Figure 4 in the wide energy range, from 800 GeV to 100 TeV, with a hard power-law spectrum shape points to the hadronic origin of the detected photons, and a primary proton spectrum may extend to ∼10 15 eV [73]. An acceleration of the particles may probably occur due to the jet interaction with the matter of the Wolf–Rayet star wind during the components of the binary system eclipse the central object partially. The multi-wavelength studies of Cyg X-3 revealing the correlation and relationships of radiation activities in the entire energy range from the radio up to the very high energy gamma-rays can provide essential information on the particle production and acceleration mechanism in the microquasars.

Author Contributions

The authors (V.G.S. and V.Y.S.) contributed equally. All authors have read and agreed to the published version of the manuscript.

Funding

This research was funded by Russian Academy of Science in the framework of support of long-term studies.

Conflicts of Interest

The authors declare no conflict of interest. The funders had no role in the design of the study; in the collection, analyses, or interpretation of data; in the writing of the manuscript, or in the decision to publish the results.

Notes

1
http://www.mrao.cam.ac.uk/~guy/cx3/, accessed on 26 September 2017.
2
http://xte.mit.edu/asmlc/srcs/cygx3.html, accessed on 16 September 2021.
3
4
5
6

References

  1. Giacconi, R.; Gorenstein, P.; Gursky, H.; Walter, J.R. An X-ray survey of the Cygnus Region. Astrophys. J. 1967, 148, L119. [Google Scholar] [CrossRef]
  2. Hillas, A.M. Is Cygnus X-3 a monoenergetic 1017 eV accelerator? Nature 1984, 312, 50. [Google Scholar] [CrossRef]
  3. Cordova, F.A.-D. Cygnus X-3 and the Case for Simultaneous Multifrequency Observations. Los Alamos Sci. 1986, 13, 38. [Google Scholar]
  4. van Kerkwijk, M.H.; Charles, P.A.; Geballe, T.R.; King, D.L.; Miley, G.K.; Molnar, L.A.; van den Heuvel, E.P.J.; van der Klis, M.; van Paradijs, J. Infrared helium emission lines from Cygnus X-3 suggesting a Wolf-Rayet star companion. Nature 1992, 355, 703. [Google Scholar] [CrossRef] [Green Version]
  5. van den Heuvel, E.P.J. High-Mass X-ray Binaries: Progenitors of double compact objects. In Proceedings of the International Astronomical Union Symposium Nr. 346, Vienna, Austria, 27–31 August 2018. [Google Scholar]
  6. Cherepashchuk, A.M.; Moffat, A.F.J. Cygnus X-3 as a benchmark for fundamental properties of Wolf-Rayet stars. Astrophys. J. 1994, 454, L53. [Google Scholar] [CrossRef]
  7. Hjalmarsdotter, L.; Zdziarski, A.A.; Larsson, S.; Beckmann, V.; McCollough, M.; Hannikainen, D.C.; Vilhu, O. Spectral variability in Cygnus X-3. MNRAS 2008, 384, 278. [Google Scholar] [CrossRef] [Green Version]
  8. Hjalmarsdotter, L.; Zdziarski, A.A.; Szostek, A.; Hannikainen, D.C. Spectral variability in Cygnus X-3. MNRAS 2009, 392, 251. [Google Scholar] [CrossRef] [Green Version]
  9. Szostek, A.; Zdziarski, A.A. Effects of the stellar wind on X-ray spectra of Cygnus X-3. MNRAS 2008, 386, 593. [Google Scholar] [CrossRef] [Green Version]
  10. Szostek, A.; Zdziarski, A.A.; McCollough, M.L. A classification of the X-ray and radio states of Cyg X-3 and their long-term correlations. MNRAS 2008, 388, 1001. [Google Scholar] [CrossRef] [Green Version]
  11. Koljonen, K.I.I.; Hannikainen, D.C.; McCollough, M.L.; Pooley, G.G.; Trushkin, S.A. The hardness–intensity diagram of Cygnus X-3: Revisiting the radio/X-ray states. MNRAS 2010, 406, 307. [Google Scholar] [CrossRef] [Green Version]
  12. Koljonen, K.I.I.; Maccarone, T.; McCollough, M.L.; Gurwell, M.; Trushkin, S.A.; Pooley, G.G.; Piano, G.; Tavani, M. The hypersoft state of Cygnus X–3-A key to jet quenching in X-ray binaries? Astron. Astrophys. 2018, 612, A27. [Google Scholar] [CrossRef] [Green Version]
  13. Ling, Z.; Zhang, S.N.; Tang, S. Determining the distance of Cyg X-3 with its X-ray dust scattering halo. Astrophys. J. 2009, 695, 1111. [Google Scholar] [CrossRef] [Green Version]
  14. Fender, R.P.; Bell-Burnell, S.J.; Williams, P.M.; Webster, A.S. Flaring and quiescent infrared behaviour of Cygnus X-3. MNRAS 1996, 283, 798. [Google Scholar] [CrossRef] [Green Version]
  15. Apparao, K.M.V. Flaring and modulation of infrared radiation from the X-ray source Cygnus X-3. Astron. Astrophys. 1997, 328, 595. [Google Scholar]
  16. Gregory, P.C.; Kronberg, P.P.; Seaquist, E.R.; Hughes, V.A.; Woodsworth, A.; Viner, M.R.; Retallack, D. Discovery of giant radio outburst from Cygnus X-3. Nature 1972, 239, 440. [Google Scholar] [CrossRef]
  17. Waltman, E.B.; Fiedler, R.L.; Johnston, K.J.; Ghigo, F.D. The quiescent level of Cygnus X-3 at 2.25 and 8.3 GHz: 1988-1992. Astron. J. 1994, 108, 179. [Google Scholar] [CrossRef]
  18. Waltman, E.B.; Ghigo, F.D.; Johnston, K.J.; Foster, R.S.; Fiedler, R.L.; Spencer, J.H. The evolution of outbursts in Cygnus X-3 at 2.25 and 8.3 GHz. Astron. J. 1995, 110, 290. [Google Scholar] [CrossRef]
  19. Trushkin, S.A.; Nizhelskij, N.A.; Tsybulev, P.G.; Zhekanis, G.V. The giant radio flare of Cygnus X-3 in September 2016. arXiv 2016, arXiv:1612.00634. [Google Scholar]
  20. Watanabe, H.; Kitamoto, S.; Miyamoto, S.; Fielder, R.L.; Waltman, E.B.; Johnston, K.J.; Ghigo, F.D. Correlation between X-ray intensity and radio outbursts of Cygnus X-3. Astrophys. J. 1994, 433, 350. [Google Scholar] [CrossRef]
  21. McCollough, M.L.; Robinson, C.R.; Zhang, S.N.; Harmon, B.A.; Hjellming, R.M.; Waltman, E.B.; Foster, R.S.; Ghigo, F.D.; Briggs, M.S.; Pendleton, G.N. Discovery of correlated behavior between the hard X-ray and the radio bands in Cygnus X-3. Astrophys. J. 1999, 517, 951. [Google Scholar] [CrossRef] [Green Version]
  22. Tudose, V.; Miller-Jones, J.C.A.; Fender, R.P.; Paragi, Z.; Sakari, C.; Szostek, A.; Garrett, M.A.; Dhawan, V.; Rushton, A.; Spencer, R.E. Probing the behaviour of the X-ray binary Cygnus X-3 with very long baseline radio interferometry. MNRAS 2010, 401, 890. [Google Scholar] [CrossRef] [Green Version]
  23. Molnar, L.A.; Reid, M.J.; Grindlay, J.E. Low-level radio flares from Cygnus X-3. Nature 1984, 310, 662. [Google Scholar] [CrossRef]
  24. Hjalmarsdotter, L.; Hannikainen, D.; Vilhui, O.; Zdziarski, A.A.; Trushkin, S.; McCollough, M.; Pooley, G.; Hakala, P.; Paizis, A. Cygnus X-3 in the INTEGRAL era Based on observations with INTEGRAL, an ESA project with instruments and science data center funded by ESA and member states (especially the PI countries: Denmark, France, Germany, Italy, Switzerland, and Spain), the Czech Republic, and Poland and with the participation of Russia and the US. Chin. J. Astron. Astrophys. Suppl. 2003, 3, 425. [Google Scholar]
  25. Zdziarski, A.A.; Malyshev, D.; Dubus, G.; Pooley, G.G.; Johnson, T.; Frankowski, A.; De Marco, B.; Chernyakova, M.; Rao, A.R. A comprehensive study of high-energy gamma-ray and radio emission from Cyg X-3. MNRAS 2018, 479, 4339. [Google Scholar] [CrossRef]
  26. Fermi LAT Collaboration; Abdo, A.A.; Ackermann, M.; Ajello, M.; Axelsson, M.; Baldini, L.; Ballet, J.; Barbiellini, G.; Bastieri, D.; Baughman, B.M.; et al. Modulated high-energy gamma-ray emission from the microquasar Cygnus X-3. Science 2009, 326, 1512. [Google Scholar]
  27. Tavani, M.; Bulgarelli, A.; Piano, G.; Sabatini, S.; Striani, E.; Evangelista, Y.; Trois, A.; Pooley, G.; Trushkin, S.; Nizhelskij, N.A.; et al. Extreme particle acceleration in the microquasar Cygnus X-3. Nature 2009, 462, 620. [Google Scholar] [CrossRef] [PubMed] [Green Version]
  28. Dubus, G.; Cerutti, B.; Henri, G. The relativistic jet of Cygnus X-3 in gamma-rays. MNRAS 2010, 404, L55. [Google Scholar] [CrossRef] [Green Version]
  29. Cocconi, G. Proceedings of the VI International Cosmic Ray Conference (ICRC VI), Moscow, Russia, 6–11 July 1960; Volume 2, p. 309.
  30. Samorski, M.; Stamm, W. Detection of 2×10¹⁵ to 2×10¹⁶ eV gamma-rays from Cygnus X-3. Astrophys. J. 1983, 268, L17. [Google Scholar] [CrossRef]
  31. Lloyd-Evans, J.; Coy, R.N.; Lambert, A.; Lapikens, J.; Patel, M.; Reid, R.J.O.; Watson, A.A. Observation of γ-rays > 1015 eV from Cygnus X-3. Nature 1983, 305, 784. [Google Scholar] [CrossRef]
  32. Borione, A.; Chantell, M.C.; Covault, C.E.; Cronin, J.W.; Fick, B.E.; Fowler, J.W.; Fortson, L.F.; Gibbs, K.G.; Green, K.D.; Newport, B.J.; et al. High statistics search for ultrahigh energy γ-ray emission from Cygnus X-3 and Hercules X-1. Phys. Rev. D 1997, 55, 1714. [Google Scholar] [CrossRef] [Green Version]
  33. Cronin, J.W. Gamma-ray astronomy by the air shower technique: Performance and perspectives. Nuovo Cimento C 1996, 19, 847. [Google Scholar] [CrossRef]
  34. Zwart, J.T.L.; Barker, R.W.; Biddulph, P.; Bly, D.; Boysen, R.C.; Brown, A.R.; Clementson, C.; Crofts, M.; Culverhouse, T.L.; Czeres, J.; et al. The arcminute microkelvin imager. MNRAS 2008, 391, 1545. [Google Scholar] [CrossRef] [Green Version]
  35. Levine, A.M.; Bradt, H.; Cui, W.; Jernigan, J.G.; Morgan, E.H.; Remillard, R.; Shirey, R.E.; Smith, D.A. First results from the all-sky monitor on the rossi X-ray timing explorer. Astrophys. J. Lett. 1996, 469, L33. [Google Scholar] [CrossRef]
  36. Matsuoka, M.; Kawasaki, K.; Ueno, S.; Tomida, H.; Kohama, M.; Suzuki, M.; Adachi, Y.; Ishikawa, M.; Mihara, T.; Sugizaki, M.; et al. The MAXI mission on the ISS: Science and instruments for monitoring all-sky X-ray images. PASJ 2009, 61, 999. [Google Scholar] [CrossRef]
  37. Fishman, G.J.; Meegan, C.A.; Wilson, R.B.; Paciesas, W.S.; Parnell, T.A.; Austin, R.W.; Rehage, J.R.; Matteson, J.L.; Teegarden, B.J.; Cline, T.L.; et al. BATSE: The Burst and Transient Source Experiment on the gamma-ray observatory. In Proceedings of the Gamma Ray Observatory Science Workshop, Greenbelt, MD, USA, 10–12 April 1989; Johnson, W.N., Ed.; Goddard: Greenbelt, MD, USA, 1989; pp. 2–39. [Google Scholar]
  38. Krimm, H.A.; Holland, S.T.; Corbet, R.H.D.; Pearlman, A.B.; Romano, P.; Kennea, J.A.; Bloom, J.S.; Barthelmy, S.D.; Baumgartner, W.H.; Cummings, J.R.; et al. The Swift/BAT hard X-ray transient monitor. Astrophys. J. Supp. 2013, 209, 14. [Google Scholar] [CrossRef] [Green Version]
  39. Atwood, W.B.; Abdo, A.A.; Ackermann, M.; Althouse, W.; Anderson, B.; Axelsson, M.; Baldini, L.; Ballet, J.; Band, D.L.; Barbiellini, G.; et al. The large area telescope on the Fermi gamma-ray space telescope mission. Astrophys. J. 2009, 697, 1071. [Google Scholar] [CrossRef] [Green Version]
  40. Nikolsky, S.I.; Sinitsyna, V.G. Investigation of gamma-sources by mirror telescope. In Proceedings of the Int. Workshop of Very Hight Energy Gamma-ray Astronomy, Crimea, Russia, 17–21 April 1989; Stepanian, A.A., Fegan, D.J., Cawley, W.F., Eds.; p. 11. [Google Scholar]
  41. Sinitsyna, V.G. Searches for gamma-quanta from local sources by a wide-angle imaging telescope. Nuovo Cimento C 1996, 19, 965. [Google Scholar] [CrossRef]
  42. Sinitsyna, V.G.; Sinitsyna, V.Y. Emission from the galaxy NGC 1275 at high and very high energies and its origin. Astron. Lett. 2014, 40, 91. [Google Scholar] [CrossRef] [Green Version]
  43. Sinitsyna, V.G.; Sinitsyna, V.Y.; Borisov, S.S.; Klimov, A.I.; Mirzafatikhov, R.M.; Moseiko, N.I. Very high energy astrophysics with the SHALON Cherenkov telescopes. Nucl. Instrum. Methods Phys. Res. A 2020, 952, 161775. [Google Scholar] [CrossRef]
  44. Sinitsyna, V.G.; Arsov, T.P.; Alaverdyan, A.Y.; Borisov, S.S.; Galitskov, A.N.; Ivanov, I.A.; Kasparov, G.M.; Klevalin, V.A.; Malisko, A.A.; Musin, F.M.; et al. Stereoscopic Cherenkov Telescope System Shalon Alatoo. In Proceedings of the 27th International Cosmic Ray Conference (ICRC27), Hamburg, Germany, 7–15 August 2001; Schlickeiser, R., Ed.; Copernicus: Hamburg, Germany; Volume OG 2.5, pp. 2798–2801. [Google Scholar]
  45. Sinitsyna, V.G. SHALON. In Proceedings of the International Workshop, Towards a Major Atmospheric Cherenkov Detector V, Kruger Park, South Africa, 8–11 August 1997; De Jager, O., Ed.; Westprint: Potchefstroom, South Africa, 1997; pp. 190–195. [Google Scholar]
  46. Moseiko, N.I.; Klimov, A.I.; Sinitsyna, V.G.; Sinitsyna, V.Y.; Balygin, K.A.; Borisov, S.S.; Kirichenko, A.M.; Mirzafatikhov, R.M.; Ostashev, I.E. An analog-to-digital converter and intelligent controller for use in a DAQ system processing PMT signals from very high energy astrophysics experiments. Nucl. Instrum. Methods Phys. Res. A 2020, 952, 161755. [Google Scholar] [CrossRef]
  47. Hillas, A.M. Cerenkov light images of EAS produced by primary gamma. In Proceedings of the 19th International Cosmic Ray Conference (ICRC19), La Jolla, CA, USA, 11–23 August 1985; NASA, Goddard Space Flight Center: Greenbelt, MD, USA, 1985; Volume 3, pp. 445–448. [Google Scholar]
  48. Sinitsyna, V.G.; Sinitsyna, V.Y. Very High Energy Emission from the Binary System Cyg X-3. Astron. Lett. 2018, 44, 162. [Google Scholar] [CrossRef]
  49. Goncharskii, A.V.; Cherepashchuk, A.M.; Yagola, A.G. Ill-Posed Problems in Astrophysics; Nauka, Fizmatlit: Moscow, Russia, 1985. [Google Scholar]
  50. Li, T.-P.; Ma, Y.-Q. Analysis methods for results in gamma-ray astronomy. Astrophys. J. Astrophys. J. 1983, 272, 317. [Google Scholar] [CrossRef]
  51. Sinitsyna, V.G.; Sinitsyna, V.Y.; Borisov, S.S.; Ivanov, I.A.; Klimov, A.I.; Mirzafatikhov, R.M.; Moseiko, N.I. Shell-type supernova remnants as sources of cosmic rays. Adv. Space Res. 2018, 62, 2845. [Google Scholar] [CrossRef]
  52. Sinitsyna, V.G. Intensity TeV gamma-rays Crab Nebula and Markarian-421 by SHALON-detected. In Proceedings of the Workshop on Towards a Major Atmospheric Cherenkov Detector—IV, Padova, Italy, 11–13 September 1995; Cresti, M., Ed.; University of Padova: Padova, Italy, 1995; p. 133. [Google Scholar]
  53. Sinitsyna, V.G. Spectrum High Energy Gamma-Quanta from Cygnus X-3. In Proceedings of the 16th European Cosmic Ray Symposium, Alcala de Henares, Spain, 20–25 July 1998; Medina, J., Ed.; Universidad de Alcalá: Alcalá de Henares, Spain, 1998; p. 383. [Google Scholar]
  54. Sinitsyna, V.G.; Sinitsyna, V.Y. Long-term studies of the Cygnus Region and its objects: Cyg X-3 and γCygni SNR. J. Phys. Conf. Ser. 2016, 718, 052040. [Google Scholar] [CrossRef] [Green Version]
  55. Sinitsyna, V.G.; Sinitsyna, V.Y. Long-term observations of the Cyg X-3 and γCygni SNR at ultrahigh energies by SHALON mirror Cherenkov telescopes. Bull. Lebedev Phys. Inst. 2013, 40, 113. [Google Scholar] [CrossRef]
  56. Sinitsyna, V.G.; Sinitsyna, V.Y.; Stozhkov, Y.I. Red dwarfs as sources of cosmic rays and detection of TeV gamma-rays from these stars. Adv. Space Res. 2019, 64, 2585–2594. [Google Scholar] [CrossRef]
  57. Archambault, S.; Beilicke, M.; Benbow, W.; Berger, K.; Bird, R.; Bouvier, A.; Buckley, J.H.; Bugaev, V.; Byrum, K.; Cerruti, M.; et al. VERITAS observations of the microquasar Cygnus X-3. Astrophys. J. 2013, 779, 150. [Google Scholar] [CrossRef] [Green Version]
  58. Aleksić, J.; Antonelli, L.A.; Antoranz, P.; Backes, M.; Baixeras, C.; Barrio, J.A.; Bastieri, D.; González, J.B.; Bednarek, W.; Berdyugin, A.; et al. Magic Constraints on γ-ray Emission from Cygnus X-3. Astrophys. J. 2010, 721, 843. [Google Scholar] [CrossRef]
  59. Parsignault, D.R.; Schreier, E.; Grindlay, J.; Gurskyet, H. On the stability of the period of Cygnus X-3. Astrophys. J. 1976, 209, L73. [Google Scholar] [CrossRef]
  60. van der Klis, M.; Bonnet-Bidaud, J.M. The X-ray ephemeris of Cygnus X-3. Astron. Astrophys. 1989, 214, 203. [Google Scholar]
  61. Kitamoto, S.; Hirano, A.; Kawashima, K.; Miyamoto, S.; Nagase, F.; White, N.E.; Smale, A.P.; Soong, Y.; Matsuoka, M.; Kawai, N.; et al. Orbital Period Changes of Cygnus X-3. Astron. Soc. Jpn. 1995, 47, 233. [Google Scholar]
  62. van Kerkwijk, M.H.; Geballe, T.R.; King, D.L.; van Der Klis, M.; van Paradijs, J. The Wolf-Rayet counterpart of Cygnus X-3. Astron. Astrophys. 1996, 314, 521. [Google Scholar]
  63. Singh, N.S.; Naik, S.; Paul, B.; Agrawal, P.C.; Rao, A.R.; Singh, K.Y. New measurements of orbital period change in Cygnus X-3. Astron. Astrophys. 2002, 392, 161. [Google Scholar] [CrossRef]
  64. Manzo, G.; Molteni, D.; Robba, N.R. Evidence of a Continuous Change in the Period of Cygnus X-3. Astron. Astrophys. 1978, 70, 317. [Google Scholar]
  65. Elsner, R.F.; Ghosh, P.; Darbro, W.; Weisskopf, M.C.; Sutherland, P.G.; Grindlay, J.E. Observations of Cygnus X-3 with the Einstein/HEAO 2/X-ray Observatory The period derivative and the asymmetric X-ray light curve. Astrophys. J. 1980, 239, 335. [Google Scholar] [CrossRef]
  66. Matz, S.M. The orbital ephemeris and X-ray light curve of Cyg X-3. In Proceedings of the the 4th Compton Symposium, Williamsburg, VA, USA, 28–30 April 1997; Dermer, C.D., Strickman, M.S., Kurfess, J.D., Eds.; Volume 410, pp. 808–812. [Google Scholar]
  67. Goldoni, P.; Bonnet-Bidaud, J.M.; Falanga, M.; Goldwurm, A. First results of IBIS/ISGRI Cygnus X-3 monitoring during INTEGRAL PV phase. Astron. Astrophys. 2003, 411, L399. [Google Scholar] [CrossRef]
  68. Choudhury, M.; Rao, A.R.; Vadawale, S.V.; Ishwara-Chandra, C.H.; Jain, A.K. Disk-jet connection in Cygnus X-3. Astron. Astrophys. 2002, 383, L35. [Google Scholar] [CrossRef] [Green Version]
  69. Heinz, S.; Sunyaev, R. Cosmic rays from microquasars: A narrow component to the CR spectrum? Astron. Astrophys. 2002, 390, 751. [Google Scholar] [CrossRef]
  70. Mioduszewski, A.J.; Rupen, M.P.; Hjellming, R.M.; Pooley, G.G.; Waltman, E.B. A one-sided highly relativistic jet from Cygnus X-3. Astrophys. J. 2001, 553, 766. [Google Scholar] [CrossRef]
  71. Vilhu, O.; Hakala, P.; Hannikainen, D.C.; McCollough, M.; Koljonen, K. Orbital modulation of X-ray emission lines in Cygnus X-3. Astron. Astrophys. 2009, 501, 679. [Google Scholar] [CrossRef] [Green Version]
  72. Zdziarski, A.A.; Sikora, M.; Dubus, G.; Yuan, F.; Cerutti, B.; Ogorzałek, A. The gamma-ray emitting region of the jet in Cyg X-3. MNRAS 2012, 421, 2956. [Google Scholar] [CrossRef] [Green Version]
  73. Sahakyan, N.; Piano, G.; Tavani, M. Hadronic gamma-ray and neutrino emission from Cygnus X-3. Astrophys. J. 2014, 780, 29. [Google Scholar] [CrossRef] [Green Version]
Figure 1. Spectral energy distribution of Cyg X-3 emission from modern and archival observations. (The black solid signs and the curve at TeV energies are the archival data and the model from [2]).
Universe 08 00057 g001
Publisher’s Note: MDPI stays neutral with regard to jurisdictional claims in published maps and institutional affiliations.