Article

An Unsupervised Machine Learning Method for Electron–Proton Discrimination of the DAMPE Experiment

1
Key Laboratory of Dark Matter and Space Astronomy, Purple Mountain Observatory, Chinese Academy of Sciences, Nanjing 210023, China
2
School of Astronomy and Space Science, University of Science and Technology of China, Hefei 230026, China
*
Authors to whom correspondence should be addressed.
Universe 2022, 8(11), 570; https://doi.org/10.3390/universe8110570
Submission received: 19 September 2022 / Revised: 14 October 2022 / Accepted: 21 October 2022 / Published: 30 October 2022
(This article belongs to the Special Issue Advances in Astrophysics and Cosmology – in Memory of Prof. Tan Lu)

Abstract

:
Galactic cosmic rays are mostly made up of energetic nuclei, with less than 1 % of electrons (and positrons). Precise measurement of the electron and positron component requires a very efficient method to reject the nuclei background, mainly protons. In this work, we develop an unsupervised machine learning method to identify electrons and positrons from cosmic ray protons for the Dark Matter Particle Explorer (DAMPE) experiment. Compared with the supervised learning method used in the DAMPE experiment, this unsupervised method relies solely on real data except for the background estimation process. As a result, it could effectively reduce the uncertainties from simulations. For three energy ranges of electrons and positrons, 80–128 GeV, 350–700 GeV, and 2–5 TeV, the residual background fractions in the electron sample are found to be about (0.45 ± 0.02)%, (0.52 ± 0.04)%, and (10.55 ± 1.80)%, and the background rejection power is about (6.21 ± 0.03) × 10 4 , (9.03 ± 0.05) × 10 4 , and (3.06 ± 0.32) × 10 4 , respectively. This method gives a higher background rejection power in all energy ranges than the traditional morphological parameterization method and reaches comparable background rejection performance compared with supervised machine learning methods.

1. Introduction

Electrons1 in cosmic rays (CR) are important probe of nearby CR accelerators due to their short propagation distances in the Milky Way [1,2]. They are also widely used to search for new physics, such as the particle dark matter [3,4]. The abundance of CR electrons above GeV is significantly lower, by a factor of 10 3 10 2 , than that of CR protons. Therefore, it is challenging to precisely measure the spectrum of electrons. Currently, the best measurements of the electron and/or positron spectra come from space (or balloon) direct detection experiments, including the magnetic spectrometers and imaging calorimeters [5,6,7,8,9,10,11,12]. The ground-based atmospheric imaging Cherenkov telescope arrays also tried to measure the total electron plus positron spectra to higher energies, which, however, are subject to large systematic uncertainties [13,14,15,16]. The spectra of electrons were measured up to a few TeV, experiencing a softening around a few GeV, a hardening around 50 GeV, and a softening around 0.9 TeV [2]. Those spectral features help establish a three-component origin model of electrons and positrons, including primary electrons from CR acceleration sources, secondary electrons and positrons from inelastic interactions between CR nuclei and the interstellar medium, and additional electrons and positrons relevant to the high-energy excesses [2].
The DArk Matter Particle Explorer (DAMPE) is a space high-energy charged CR and gamma-ray detector optimized for precision detection of electrons with a very high energy resolution and background rejection [17,18]. DAMPE is a calorimetric-type instrument, which consists of four sub-detectors. The Plastic Scintillator Detector (PSD; [19]) on the top is used to measure the particle charge up to Z = 28 , and serves as an anti-coincidence detector for γ rays. The charge resolution of PSD was found to be about 0.137 (full width at half maximum) for Z = 1 [20]. The Silicon Tungsten tracKer-converter (STK) is designed for the trajectory measurement [21]. It can also measure the particle charge for Z < 8 . The Bi 4 Ge 3 O 12 (BGO; [22]) calorimeter plays a crucial role in the energy measurement and the electron–proton discrimination. The total thickness of the BGO calorimeter of DAMPE reaches ∼32 radiation lengths and thus enables the calorimeter to contain electromagnetic showers without remarkable leakage below ∼10 TeV, which ensures a very high energy resolution (better than 1.5 % for E > 10 GeV) and a high electron–proton discrimination capability. The NeUtron Detector (NUD; [23]) at the bottom provides a further electron–proton separation via the detection of secondary neutrons produced by interactions in the calorimeter. All the detectors have operated stably in space since the launch of DAMPE in December, 2015 [24,25]. Important progress in measuring the electron and CR nuclear spectra has been achieved [11,26,27,28,29].
One of the most important elements for precise measurements of the electron spectrum is to “suppress” the proton background. For a calorimeter detector, this can be achieved by means of the shower morphology differences between hadronic showers and electromagnetic showers. Typically, an electromagnetic shower spreads less with a more regular morphology than a hadronic shower with similar deposited energy. In Ref. [11], a two-parameter representation of the shower morphology was developed, i.e., the lateral spread and the longitudinal development. This method can effectively suppress the proton background2, resulting in the level of background for electron energies a few percent below TeV. However, for E > TeV, the background increases quickly for this traditional method. An optimization of the electron–proton discrimination is necessary (e.g., [30,31]).
The Principal Component Analysis (PCA) is one of the most commonly used machine learning methods for dimensionality reduction and feature extraction [32,33,34,35]. The working principle of PCA is to express the original data in a new data space. Compared to other machine learning methods, PCA is an unsupervised machine learning and thus does not rely on simulated data. Therefore, it may avoid potential biases from models of simulation. The disadvantage of the PCA method is that the limited data statistics at high energies may result in relatively large statistical uncertainties.
This work develops an algorithm to separate electrons from protons using the PCA method. In Section 2, we introduce the basic principle of the PCA method. In Section 3, we present the detailed algorithm to separate electrons from protons applicable to the DAMPE experiment. Section 4 gives the results of our method. Finally, we conclude this work in Section 5.

2. The PCA Method

Generally speaking, the PCA method corresponds to a transform in a high-dimensional (not necessarily orthogonal) parameter space through a rotation matrix to find a new coordinate system, in which the variances of the data along the major axes of the new coordinate are the largest. Larger variance means that the data are more discrete and discriminative. Finding the coordinate axes corresponding to the maximum variance is equivalent to determining the eigenvectors corresponding to the maximum eigenvalues of the covariance matrix of the original data. The commonly used method to solve the eigenvalues of the covariance matrix is the Singular Value Decomposition method [36,37,38].
In our analysis, we characterize the shower morphology as the energy deposition ratio and the hit dispersion (see Section 3 for more details) in each BGO layer. A vector space is formed by the linear combination of these variables, which are then transformed into a new space through a linear transformation. In the new vector space, the first several principal components retain most of the variance of the data sample. In this work, we keep only the first three components and ignore the others. In summary, our analysis consists of 5 steps:
(1)
Selecting the data with good reconstruction.
(2)
Constructing characteristic variables carrying shower morphology information.
(3)
Finding the eigenvector and transformation matrix.
(4)
Transforming the original data into the new space and finding the first three principal components.
(5)
Rotating the previous three-dimensional space to obtain the final component to discriminate electrons from protons.

3. Electron-Proton Separation

3.1. Data Selection

Six years of DAMPE flight data are used in this analysis. The instrument dead time after trigger, the on-orbit calibration time, and the time when the satellite passes through the South Atlantic Anomaly region are excluded. We first apply a pre-selection procedure to select events with an accurate track reconstruction and a good shower containment in the BGO calorimeter. This procedure consists of a few specific conditions as follows:
  • The events should meet the High Energy Trigger (HET) [11] condition to ensure a good shower development at the beginning of the BGO caloriment.
  • The radial spread of the shower development, defined as the Root Mean Square (RMS) of the distances between the hit BGO bars and the shower axis, RMS r = j = 1 N E j × D j 2 / E total , should be smaller than 40 mm. The E j is energy deposited in j-th BGO bar, and D j is the distance between the corresponding BGO bar and track of the particle. This cut could eliminate a large fraction of nuclei because the hadronic shower is typically wider than the electromagnetic one.
  • The max energy bar of the BGO should not be on the edge of the detector.
  • The max energy ratio of each layer, e.g., the ratio of the max energy of a single BGO bar over the total energy of that layer, should be less than 0.35. The cut can eliminate those particles coming from the side of the detector.
  • The reconstructed track should pass through the top and bottom surfaces of the BGO.
  • Events with PSD charge should be smaller than 2 to remove heavy nuclei.
We show the efficiency of these pre-selection conditions in Figure 1. The results are obtained from the Monte Carlo (MC) simulation for an isotropic source distribution with 1 m radius and E 1 spectrum. The spectrum is then re-weighted to E 2.7 for protons and E 3.1 for electrons. We see that the pre-selection procedure can be able to suppress protons by a factor of 10∼ 10 3 , mainly due to the HET requirement. Furthermore, since the CR proton spectrum is approximately proportional to E 2.7 , the different energy deposition fractions in the calorimeter of protons (30∼ 50 % ) and electrons (>90%) would contribute to the suppression factor by about 3∼7 for a given reconstructed energy window [39].

3.2. Construction of Characteristic Variables

The BGO calorimeter is composed of 14 layers, and each layer consists of 22 BGO crystals placed in a hodoscopic configuration [22]. With the hit information from those 308 BGO crystals, we characterize the shower morphology from longitudinal and lateral views, respectively. The longitudinal shower development is characterized by the energy ratio in each BGO layer, F i = E i / E total , where E i is the deposited energy of the i-th layer and E total is the total deposited energy in the calorimeter. The lateral spread, on the other hand, is described by the RMS of the energy deposits in each layer,
RMS i = j = 1 22 E i j × ( d i j d i cog ) 2 j = 1 22 E i j , i = 0 , , 13 ,
where E i j is the deposited energy of the j-th bar in the i-th layer, d i j d i cog is the distance from the j-th bar in the i-th layer to the “center of gravity” of the i-th layer, defined as
d i cog = j = 1 22 E i j × d i j E i .
Based on these 28 basic variables, Fi and RMSi, we further construct higher-order variables to achieve a better particle discrimination. The simplest way is to randomly weight RMSi and Fi to form a new set of variables and to search for optimal weighting coefficients. We define the new variables as
RMS i = RMS i × ( cos θ ) γ × α i F i = F i × β i ,
where θ is the angle between the reconstructed incident direction and the vertical direction of an event, and α i , β i , γ are random numbers between 0 and 1, which will be determined by the PCA.

3.3. Finding the Principal Components

The major task of the PCA analysis is to find the optimal weighting coefficients of the variables, i.e., α i , β i and γ . We first generate tens of millions of random sets of weighting parameters. For a set of random weights, there is a new vector { RMS i , F i } for an event. Then, a covariance matrix can be obtained for a data sample. The direction of the first principal component is the direction of the eigenvector corresponding to the largest eigenvalue of the covariance matrix. Mathematically, this is to solve the eigenvectors and eigenvalues of the covariance matrix. The eigenvectors, placed in descending order of eigenvalues, form the transformation matrix. Multiplied by this transformation matrix, the vector { RMS i , F i } is transformed to a new one { X , Y , Z , } , which gives the principal components in descending order of their capabilities to distinguish particles. We find the transformation matrix using the python package sci-kit (https://scikit-learn.org/, accessed on 20 September 2022) and calculate the proton rejection power. The optimal condition is to ensure that the ratio between the peak of the distribution of electron candidates and the valley is as large as possible.
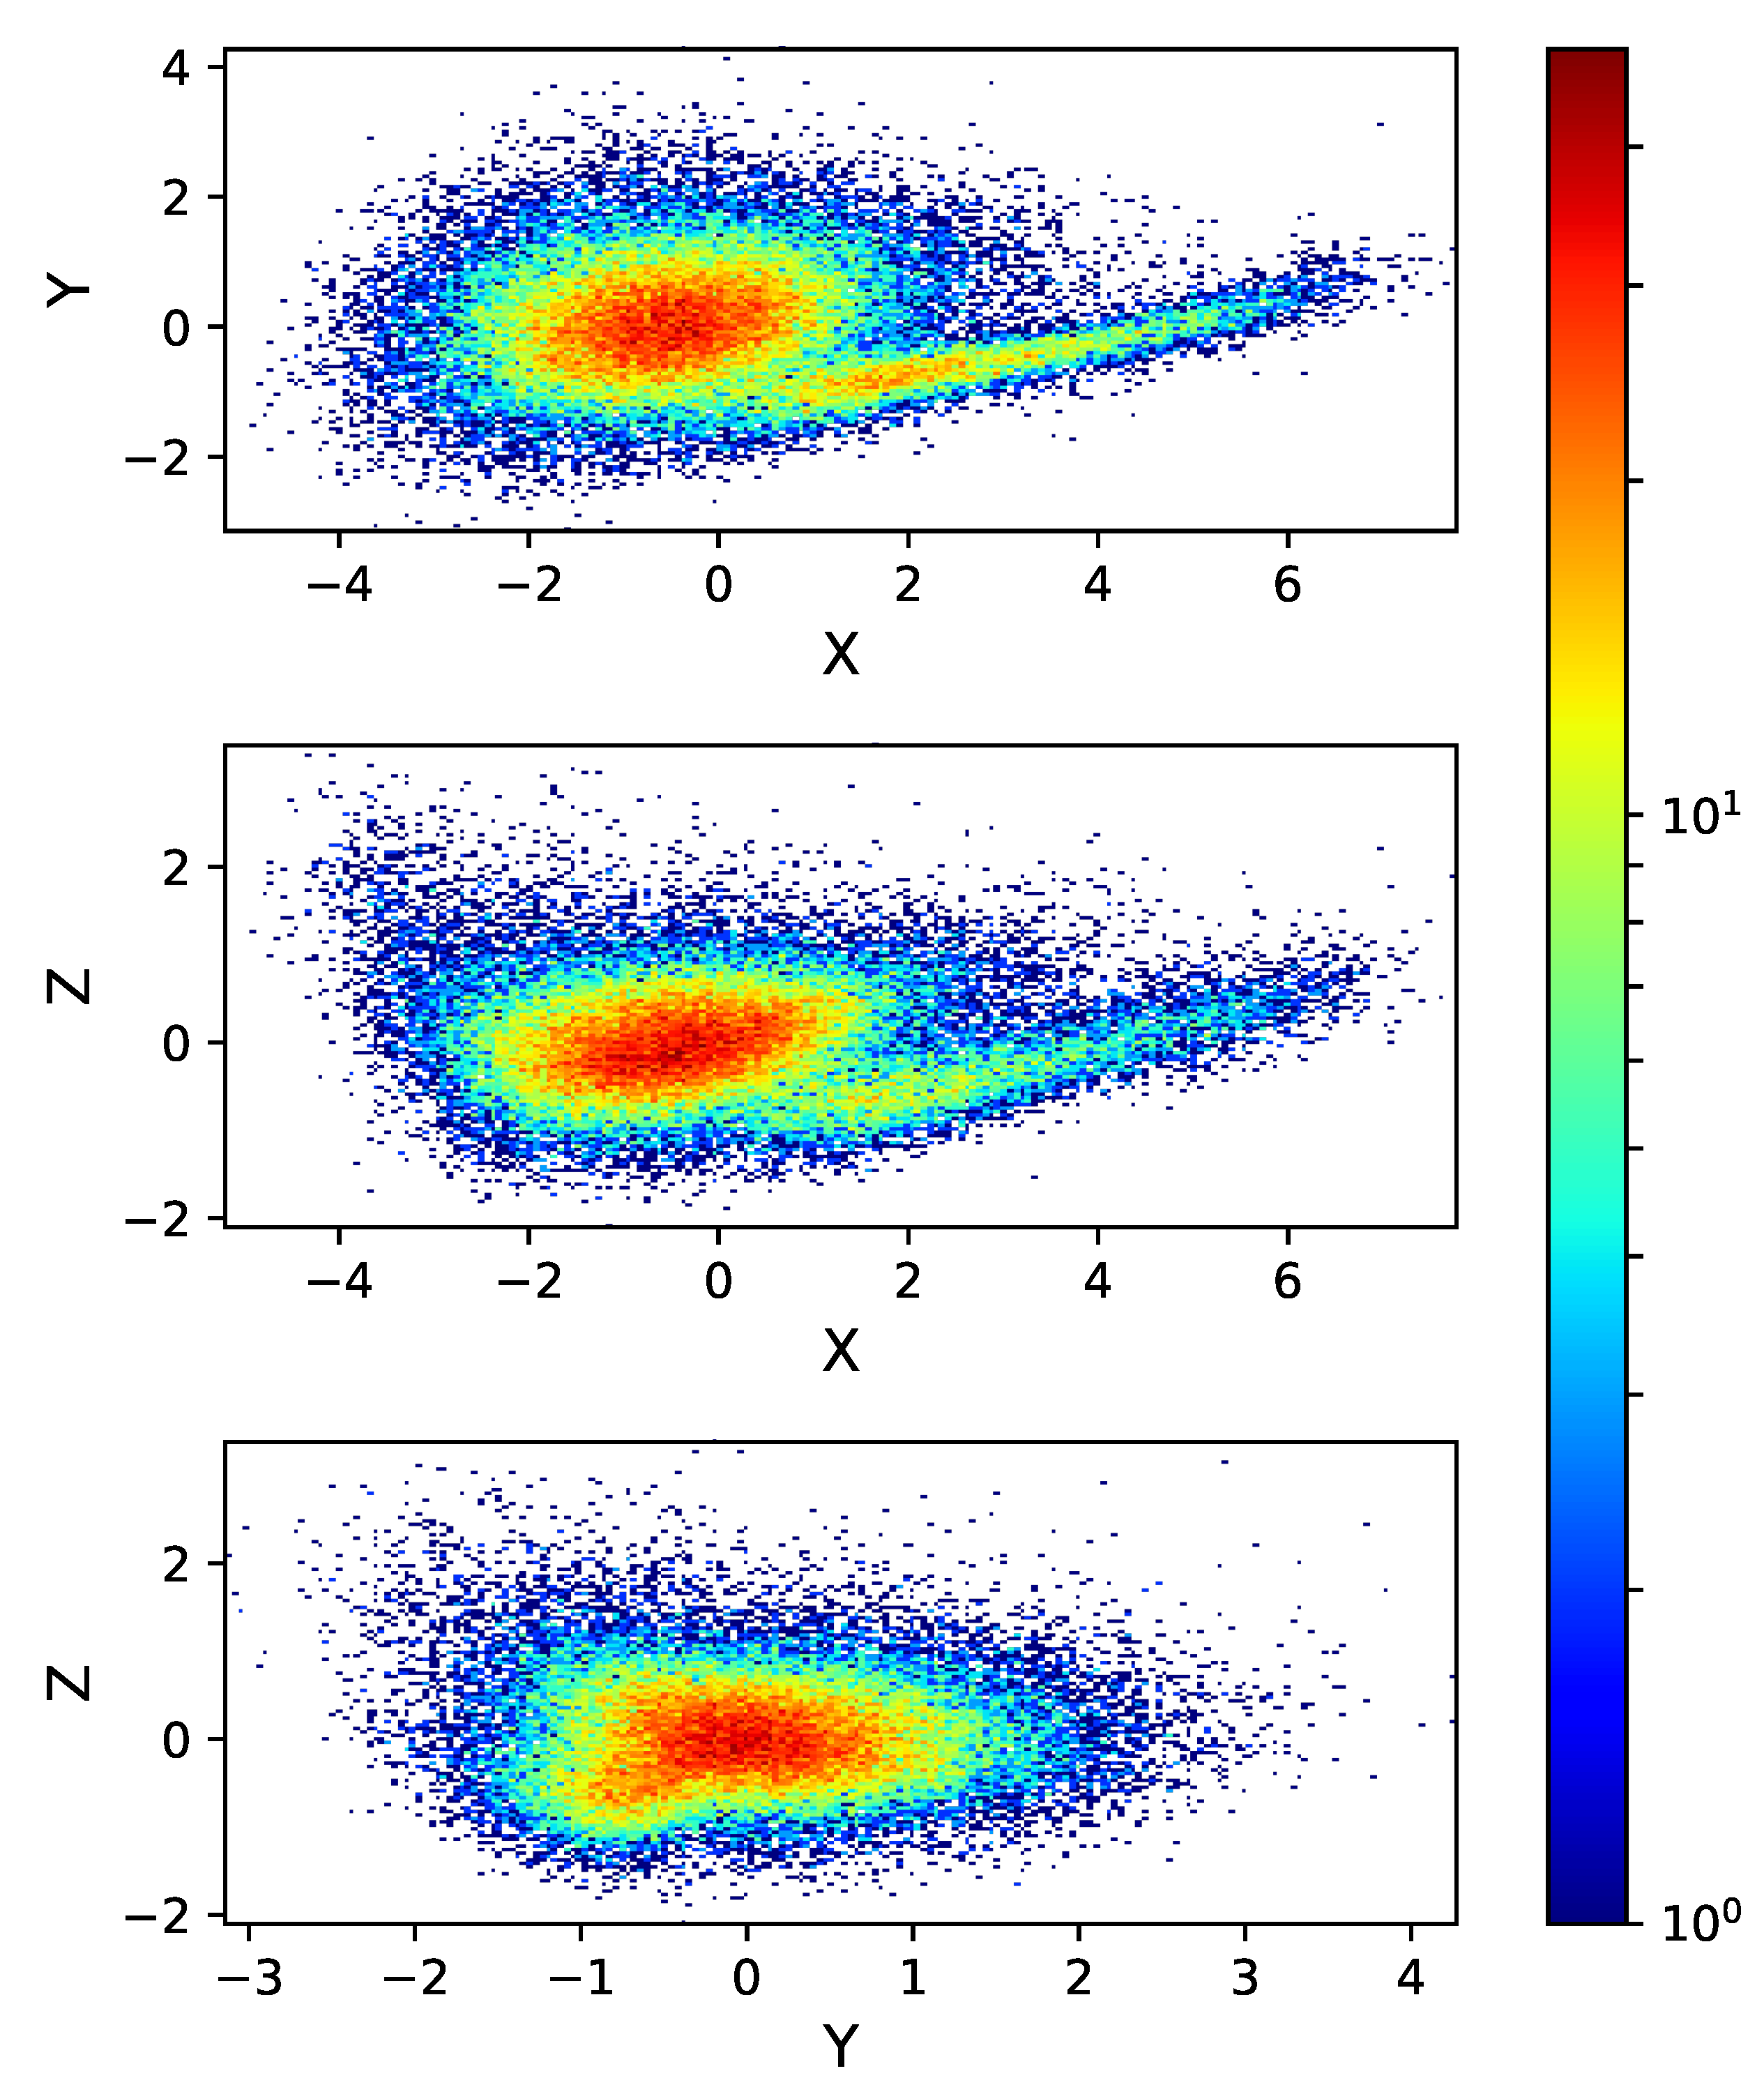
The output of the PCA is a vector group with an orthogonal rank reduction. The first principal component with the largest variance, however, may not be able to effectively distinguish electrons from protons by itself. We therefore keep the first three principal components. For simplicity, we choose the energy range of 350.0–700.0 GeV for illustration in this section. The scattering plots of the first three most informative dimensions of the PCA components for reconstructed energies of 350.0–700.0 GeV are shown in Figure 2. We use X, Y, and Z to illustrate the first, second, and third principal components. It shows that the X component gives the relative better discrimination power of the electrons and protons. For the Z component, the two groups of events are almost indistinguishable. The corresponding parameters found for reconstructed energy of 350.0–700.0 GeV are shown in Table 1.
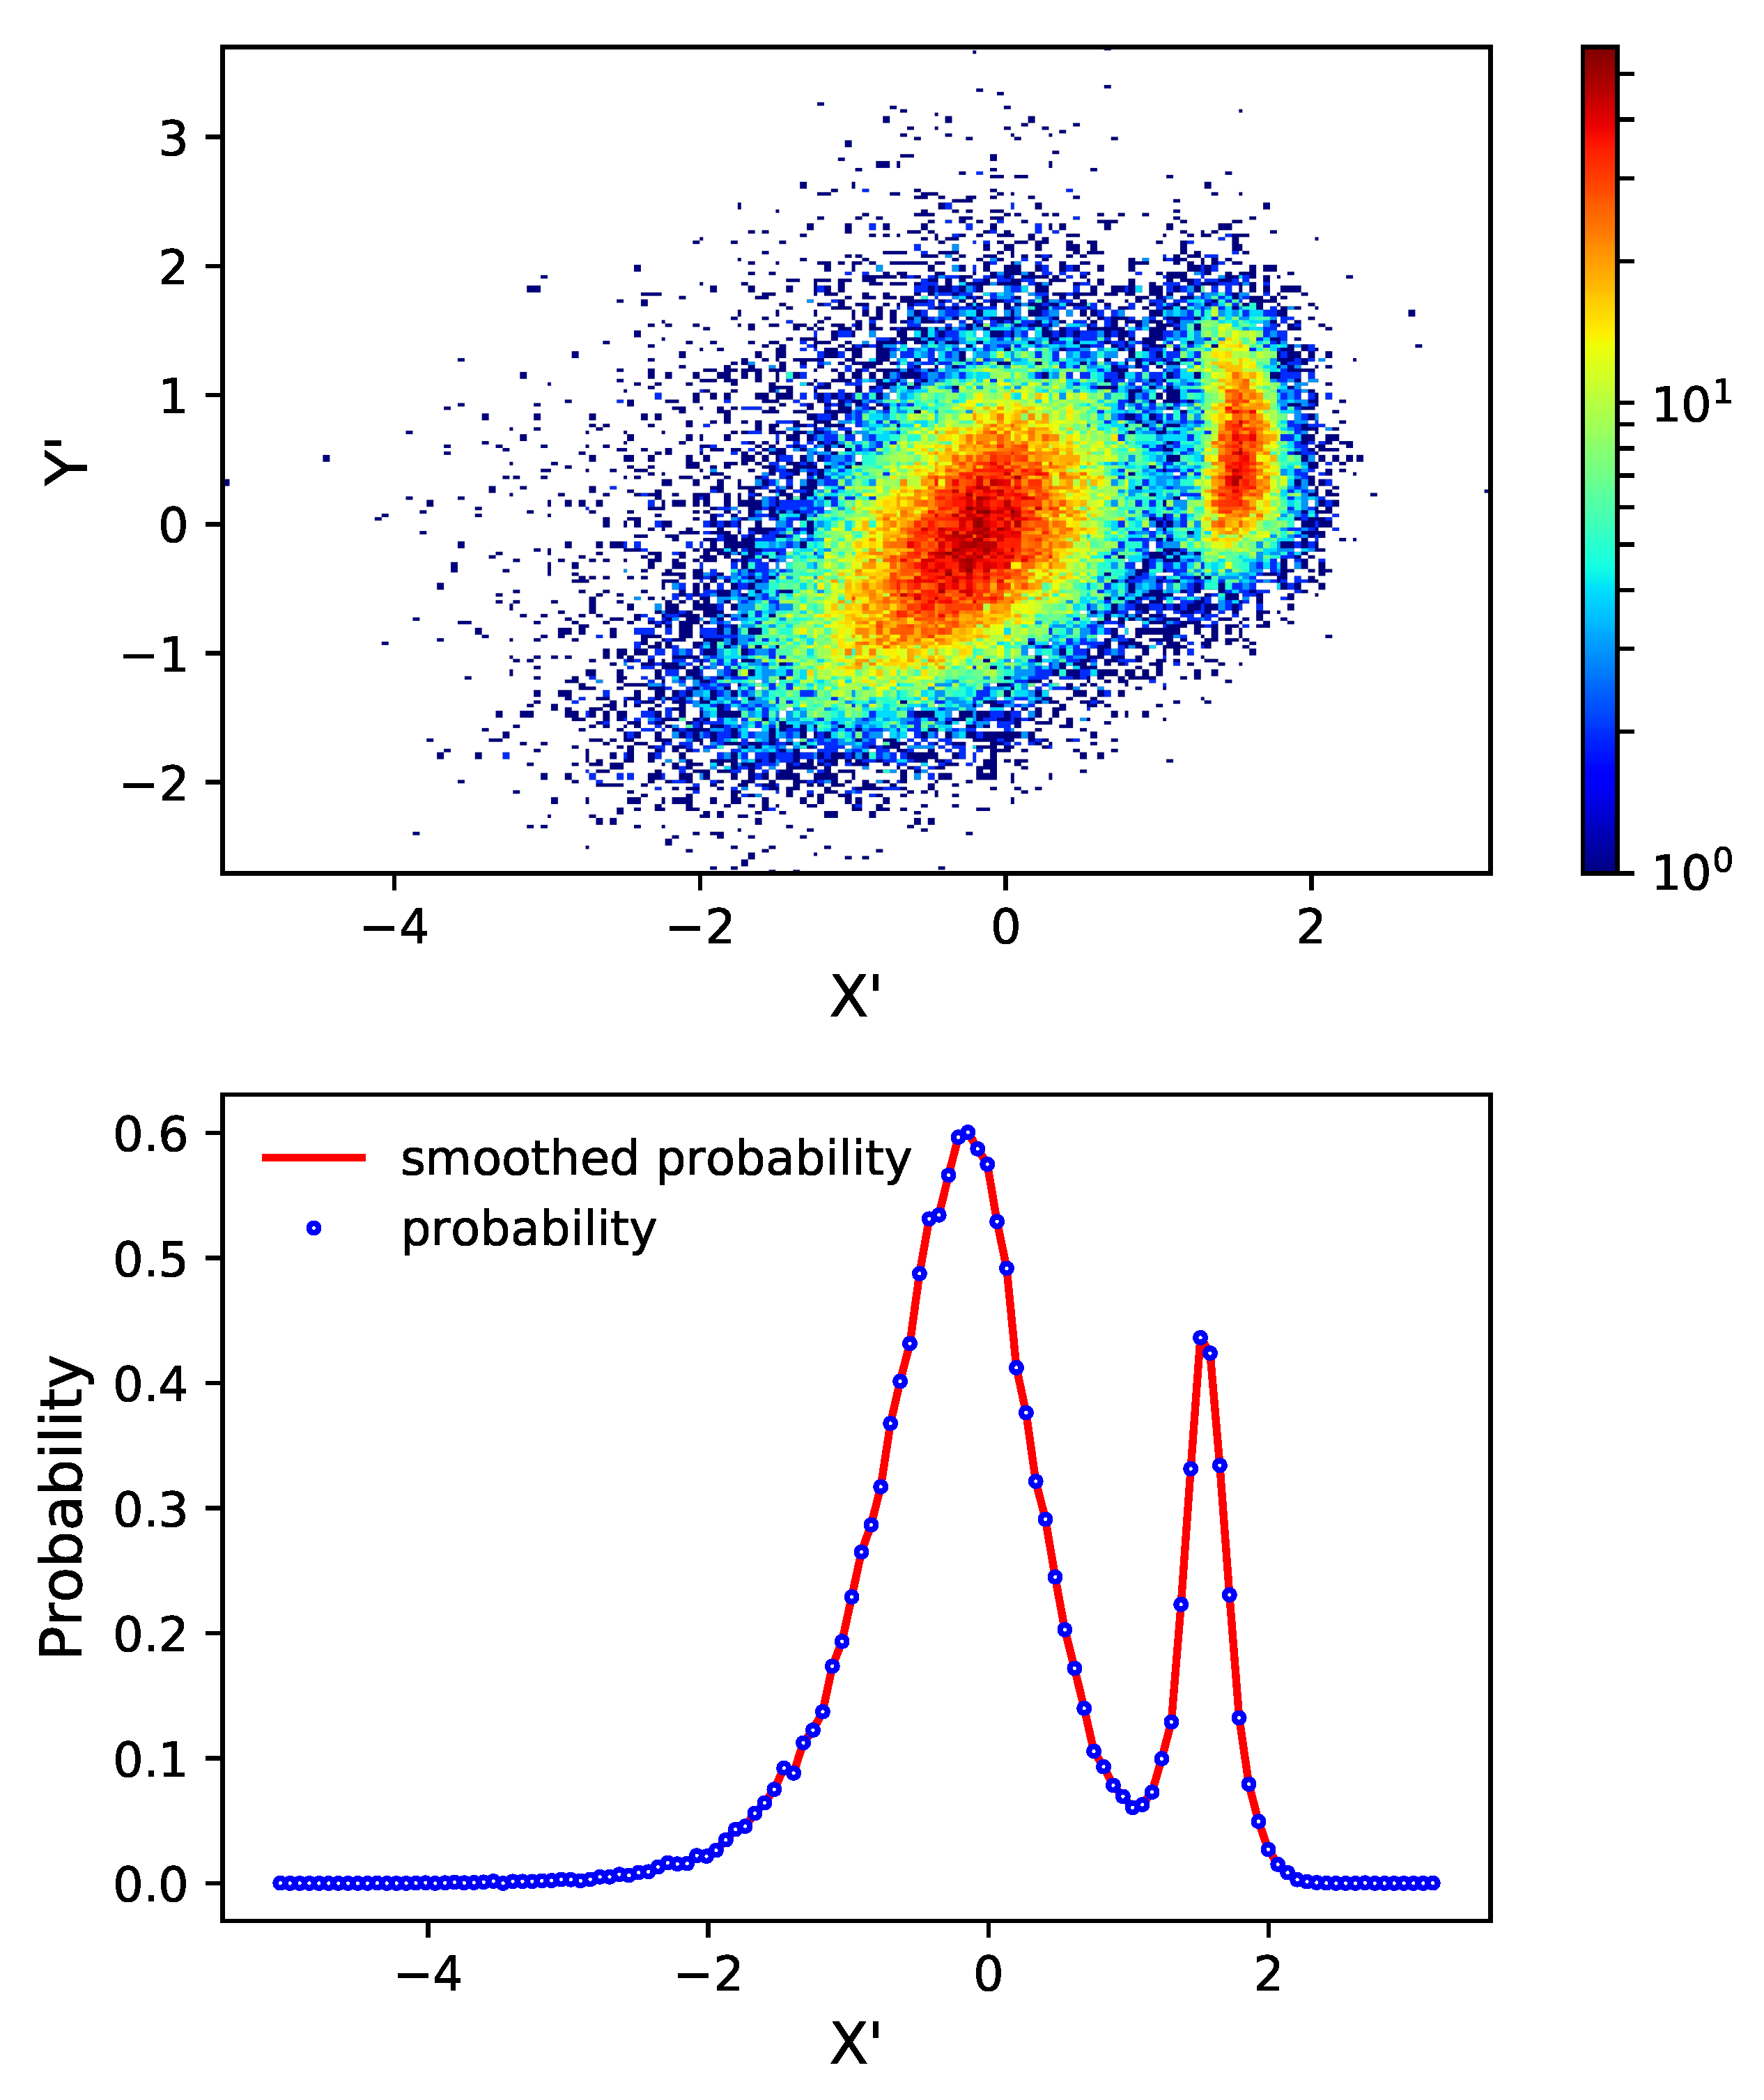
For the convenience of use of the PCA results, we further rotate the vector space of the first three components to find a new principal direction, which distinguishes electrons from protons most effectively. This is equivalent to seeking a rotation from ( X , Y , Z ) to a new set of basis ( X , Y , Z ), such that the single X is enough to discriminate electrons from protons well. After a proper rotation, we obtain a clearer separation of electrons and protons using the new variable X , as shown in Figure 3.

4. Results

Using the PCA method, we reduce the 28-dimensional parameter space to three major principal components to form a new vector space. The three-dimensional vector space is then further rotated to form a new principal axis, which separates the electrons from protons most effectively. In order to estimate the performance of the electron–proton discrimination, we use the MC simulation samples of electrons and protons as templates to fit the flight data. Note that the transformation matrix is obtained directly from the flight data, which makes our method distinct from the supervised machine learning.
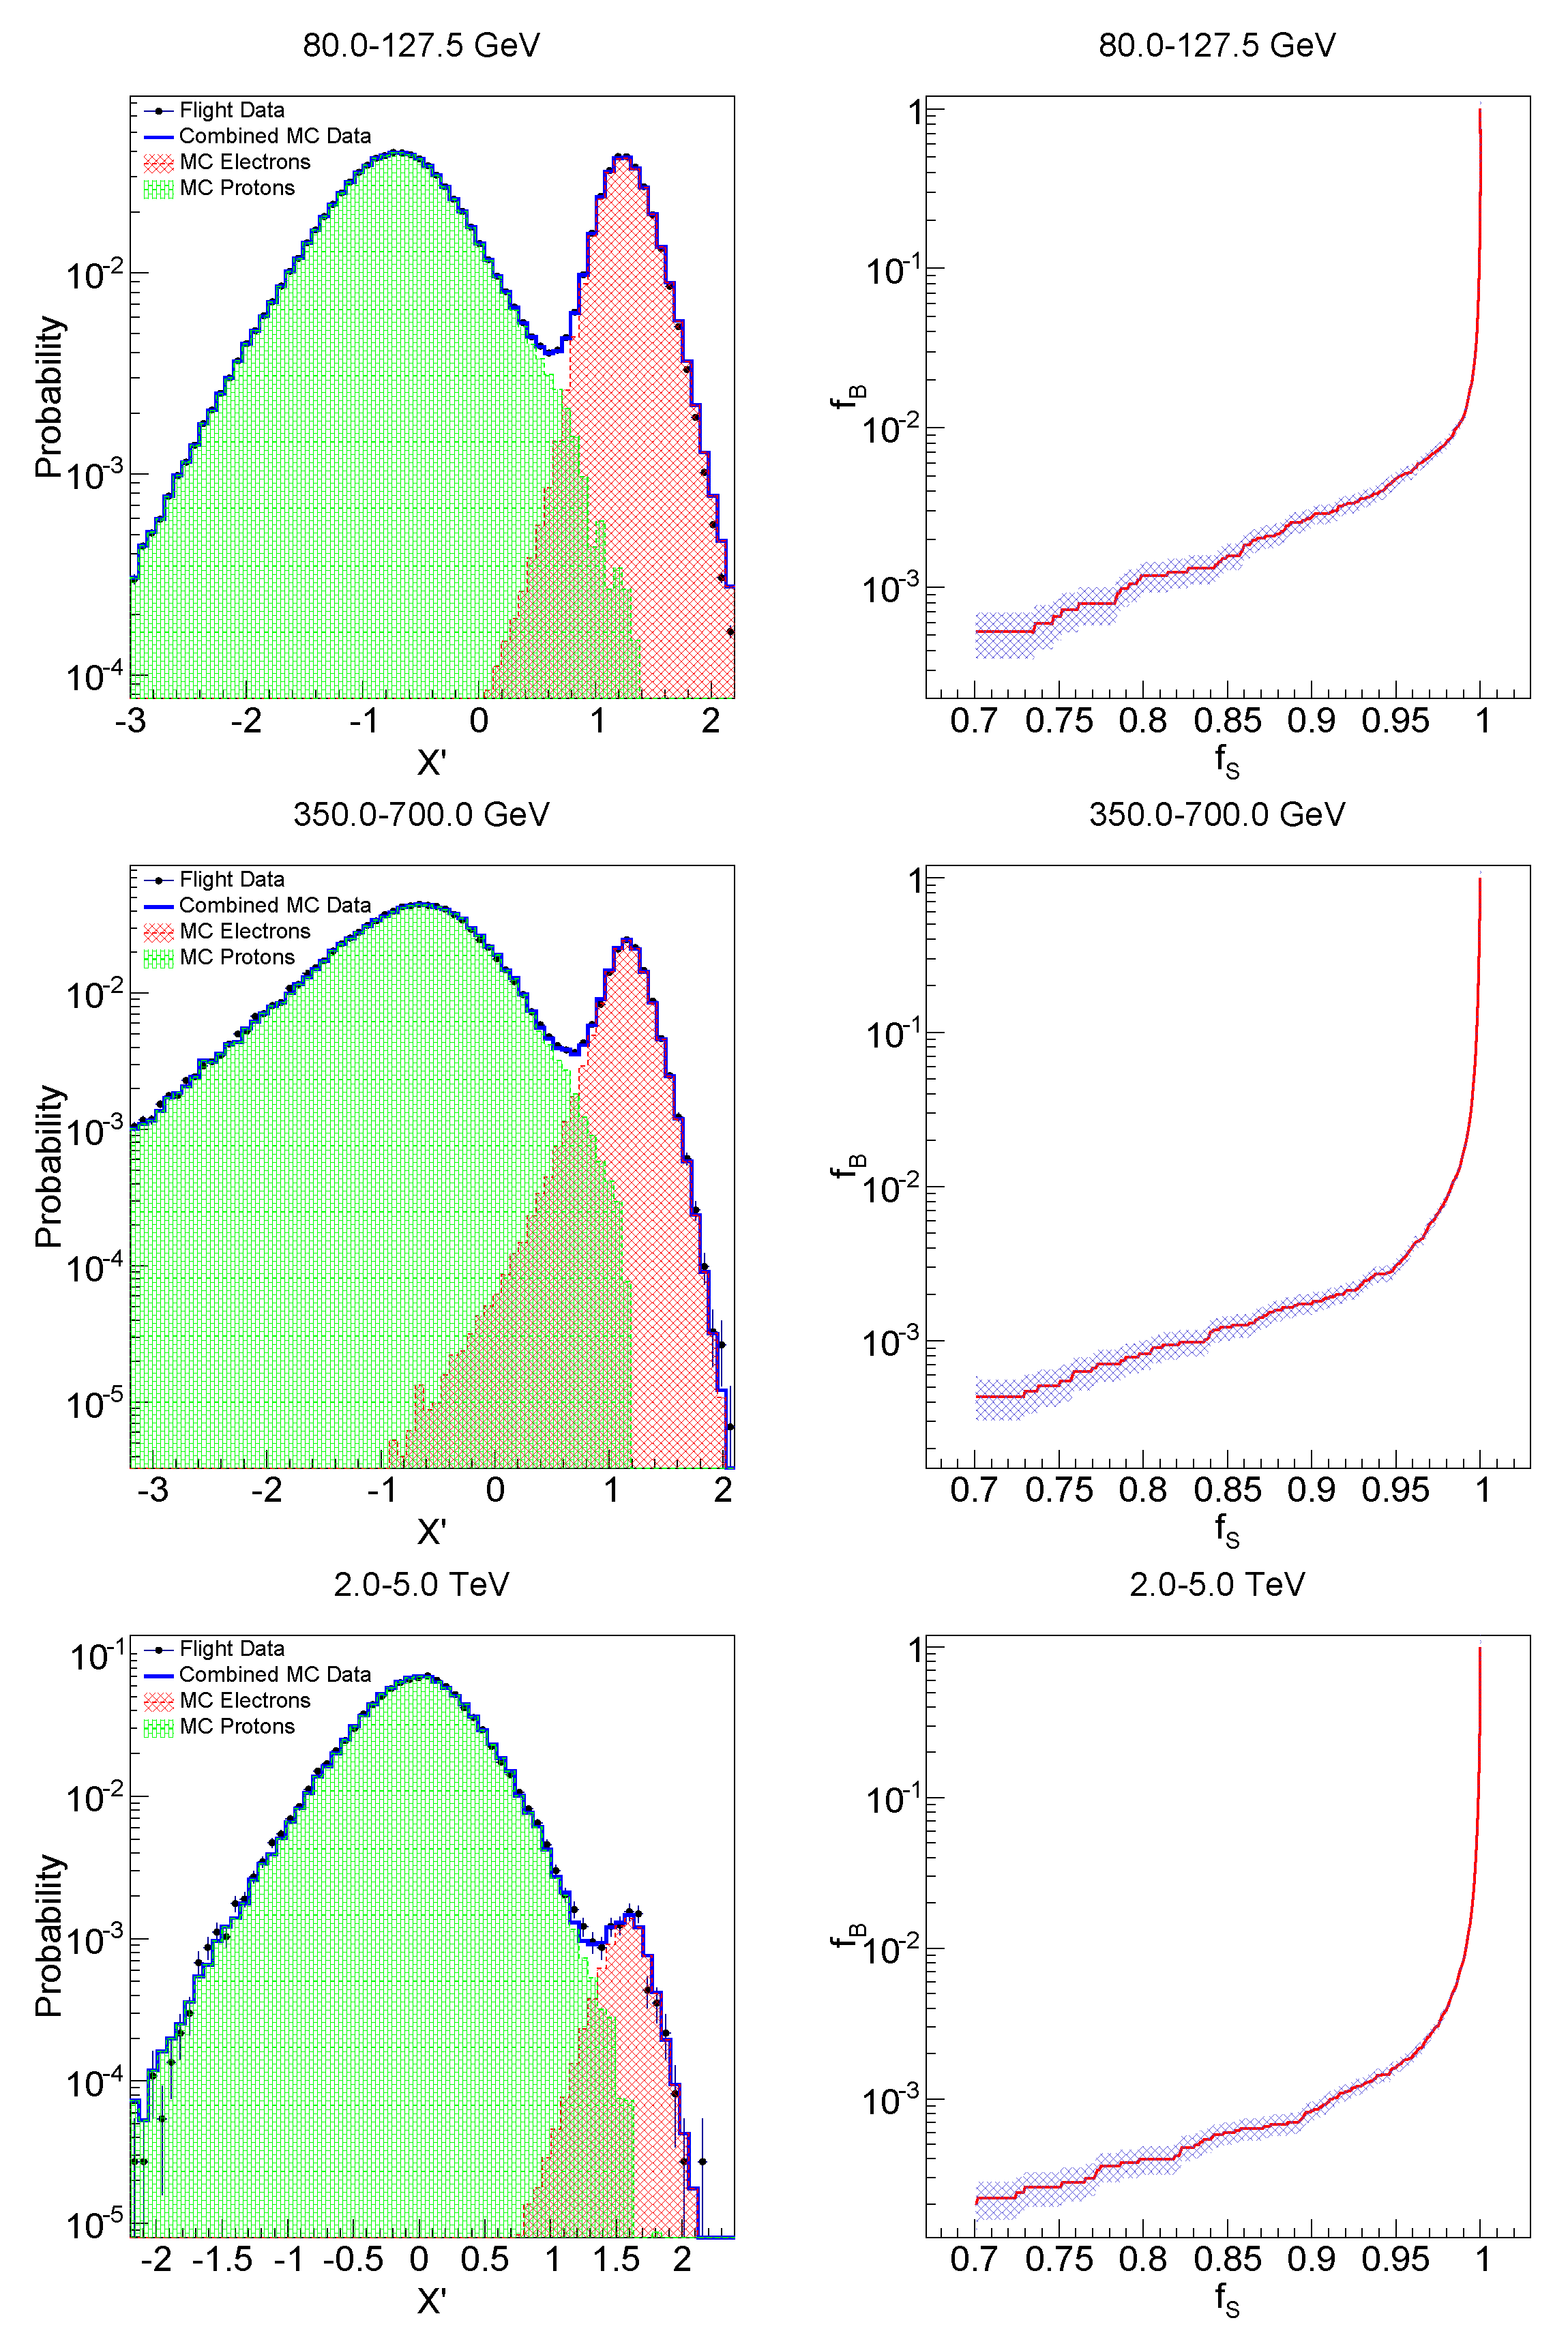
Specifically, we choose three typical reconstructed energy ranges, representing low, middle and high energies, to show the distribution and background estimation. Comparisons between the simulation and flight data are shown in the left panels of Figure 4 for the three energy bands. The right panels of Figure 4 show the relative efficiencies of protons ( f B ) and electrons ( f S ) for different cuts of the X . From the template fitting results, we can estimate the residual background fractions given signal efficiencies. If we set 90% electron efficiency, the proton contamination is found to be (0.45 ± 0.02)%, (0.52 ± 0.04)%, and (10.55 ± 1.80)% for reconstructed energies 80.0–127.5 GeV, 350.0–700.0 GeV, and 2.0–5.0 TeV, respectively.
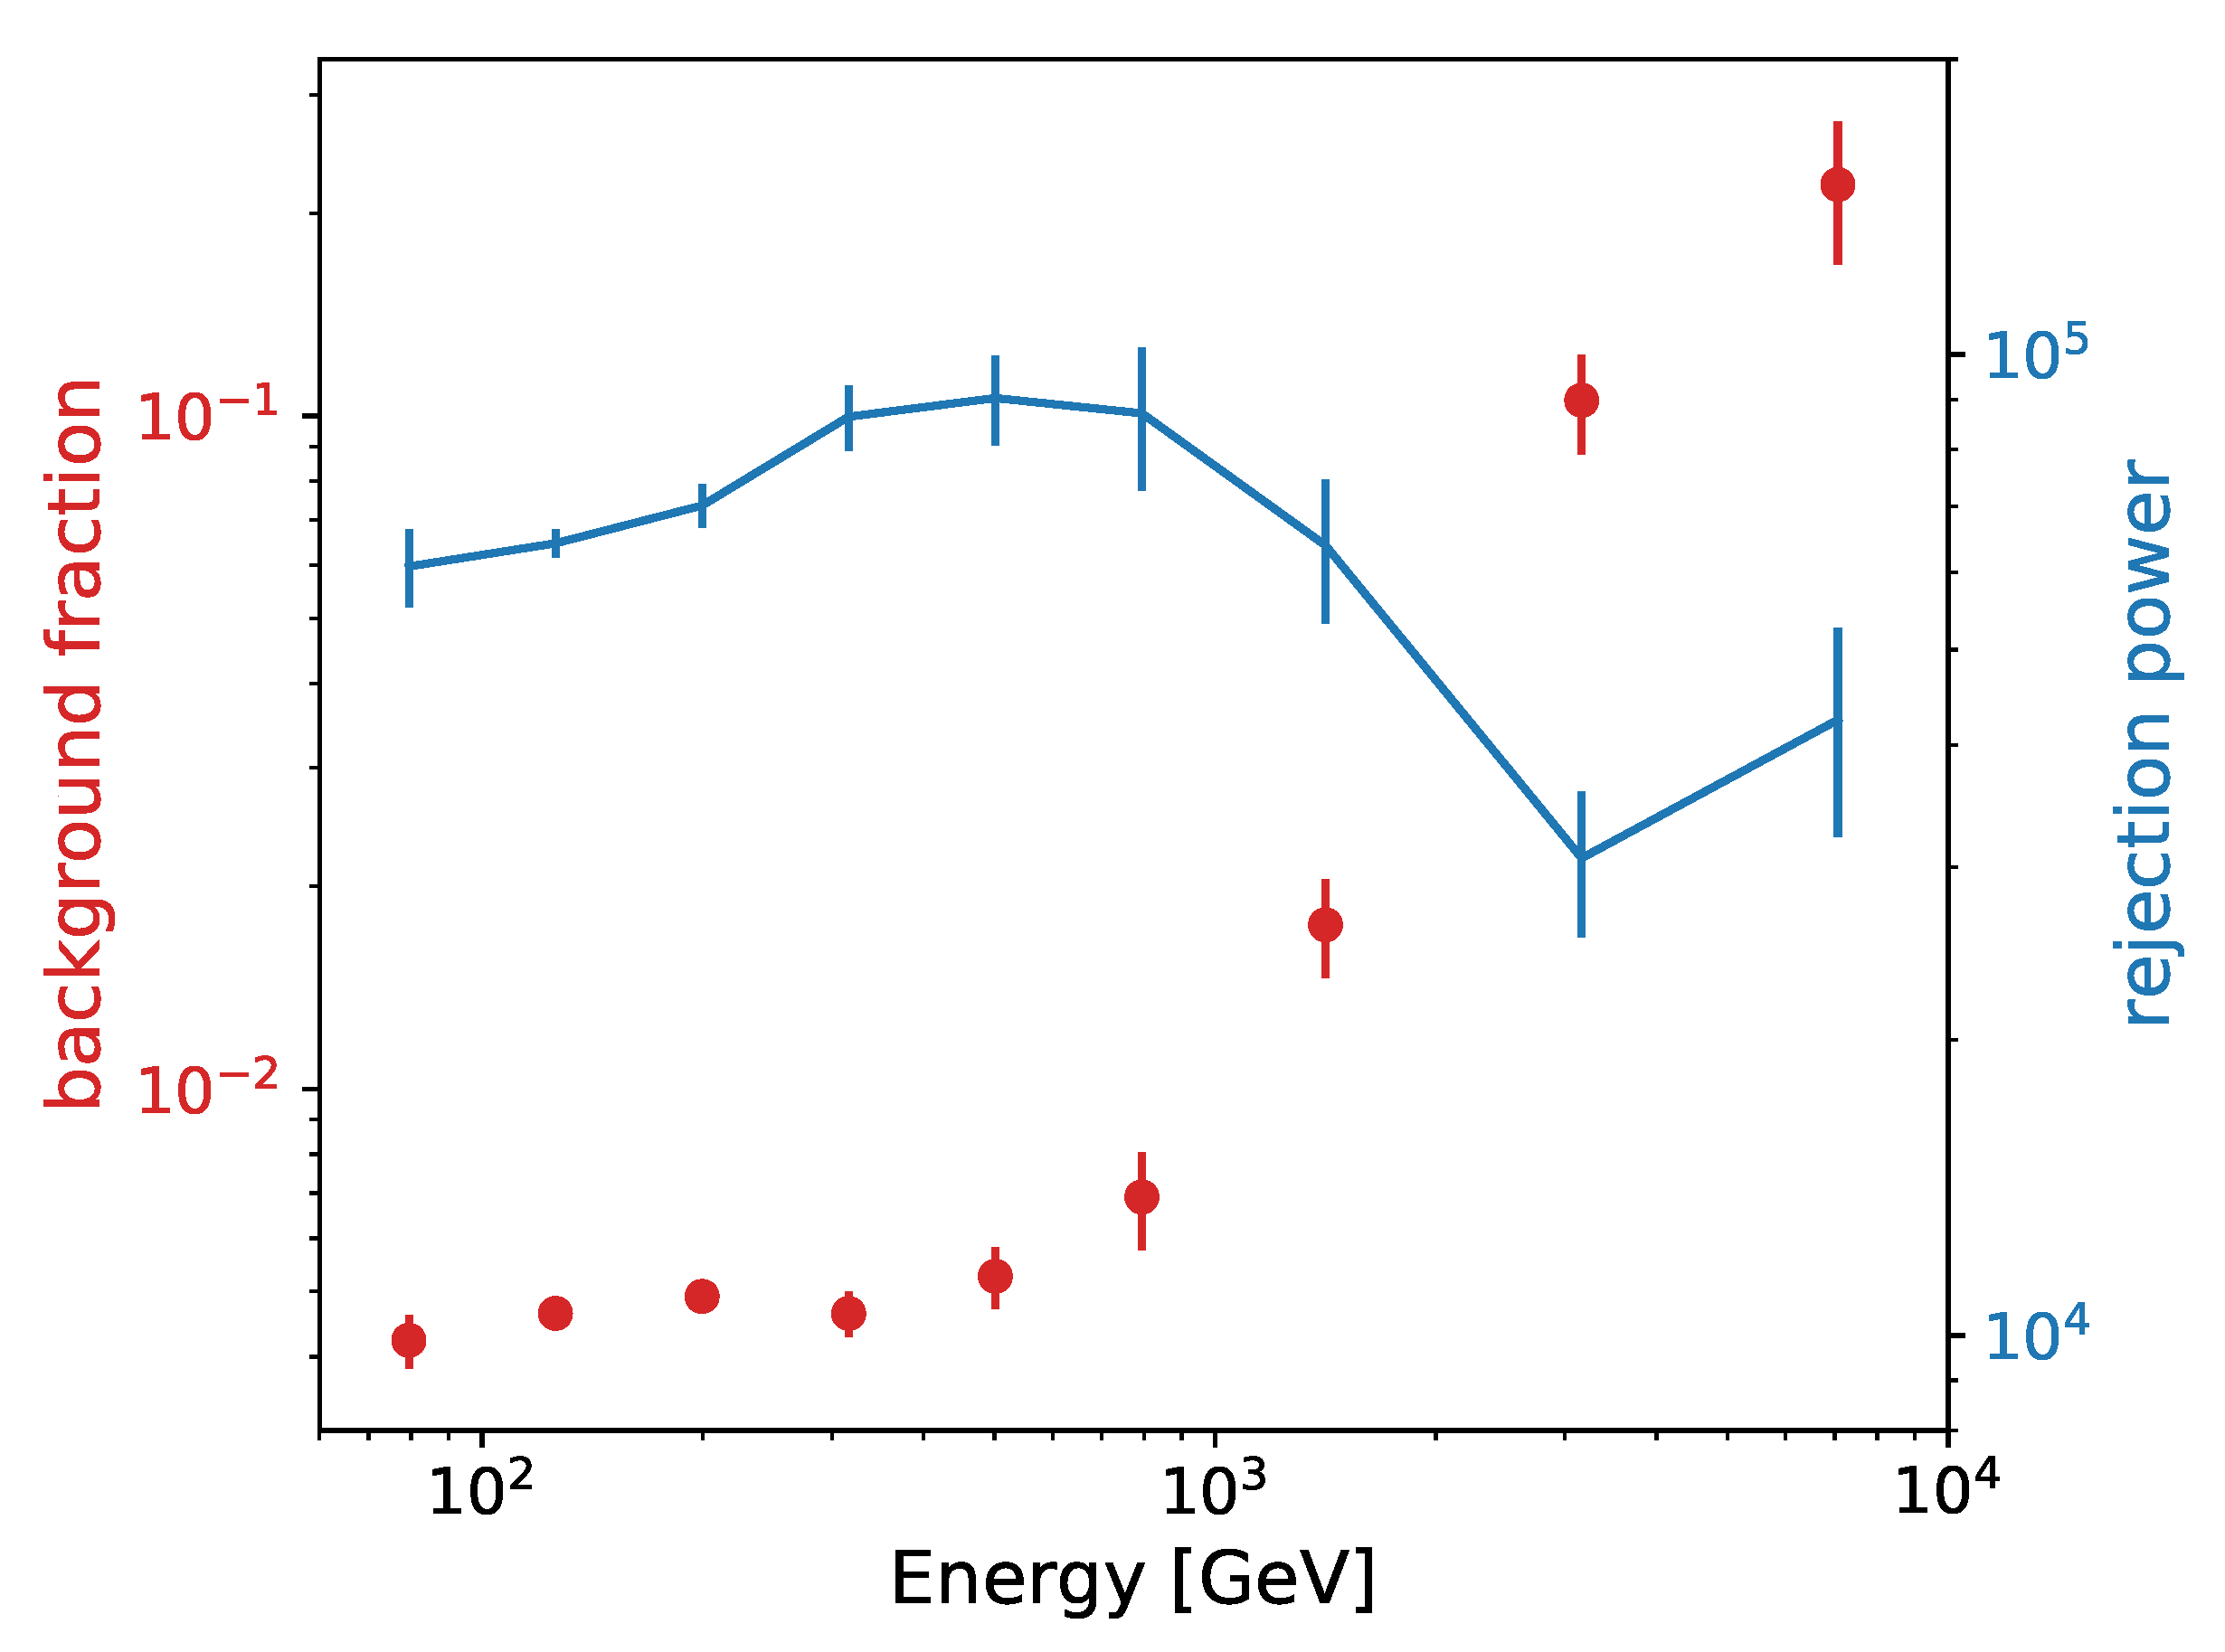
The background fraction of protons as a function of reconstructed event energy is shown in Figure 5 (left axis). And for the highest energy range of a few TeVs, it is still well controlled in our method while keeping a relatively high electron efficiency. As a comparison, the electron efficiency decreases significantly above TeV in order to suppress the proton background to a level of (10∼20)% when using the traditional method [11].
Finally, we obtain the rejection power of protons of the PCA algorithm. The proton rejection power is defined as Q = f p 1 × ϕ p / ϕ e , where f p is the residual proton fraction in the electron sample, and ϕ p and ϕ e are the primary fluxes of protons and electrons. The rejection power is calculated with the reconstructed energy for selected samples and with the primary energy for primary fluxes, respectively. Note that the reconstructed energy corresponds to the primary energy for electrons with a tiny dispersion of ∼1%. For the proton and electron fluxes, we use the fitting results as ϕ p ( E ) = 7.58 × 10 5 ( E / TeV ) 2.772 [ 1 + ( E / 0.48 TeV ) 5 ] 0.173 / 5 GeV 1 m 2 s 1 sr 1 [26], and ϕ e ( E ) = 1.62 × 10 4 ( E / 0.1 TeV ) 3.09 [ 1 + ( E / 0.91 TeV ) 8.3 ] 0.1 GeV 1 m 2 s 1 sr 1 [11]. The proton rejection power as a function of reconstructed event energy is shown in Figure 5 (right axis). For the selected three energy bands in Figure 4, the proton rejection power is ( 6.21 ± 0.03 ) × 10 4 , ( 9.03 ± 0.05 ) × 10 4 , and ( 3.06 ± 0.32 ) × 10 4 .

5. Conclusions

The machine learning methods are more and more widely used in astroparticle physics. Significant improvements have been achieved in the efficiency and accuracy of particular problems such as classifications, pattern recognitions, and nonlinear inverting problems. Supervised machine learning relies on training, which is based on the simulation data. The advantage is that it is not limited by the statistics of the real data, and a very good training of the model can be achieved. However, this method requires a good match between simulation data and real data. As a consequence, the training results are highly model-dependent. Unsupervised machine learning, on the other hand, avoids such a model dependence but is subjected to statistical uncertainties of the experimental data.
Using an unsupervised machine learning method, the PCA, we discriminate electrons from protons for the DAMPE experiment. We use the six-year flight data of DAMPE to search for effective parameters to distinguish those particles. We find that the PCA method performs well in the electron identification. The residual proton contamination fraction is estimated to be ( 0.45 ± 0.02 ) % , ( 0.52 ± 0.04 ) % , and ( 10.55 ± 1.80 ) % for electron energies of 80.0–127.5 GeV, 350.0–700.0 GeV, and 2.0–5.0 TeV. Compared with the traditional method used in Ref. [11], the PCA method improves the whole energy range. For the same electron efficiency, the proton background from the PCA method is lower by a factor of two to three. Compared with the supervised machine learning method, our approach has a comparable background suppression ability [30].

Author Contributions

Conceptualization, X.L. and M.C.; software, M.C. and Z.X.; investigation, Z.X., X.L., M.C., C.Y., W.J. and W.L.; writing—original draft preparation, Z.X.; writing—review and editing, M.C., X.L., C.Y. and Q.Y.; visualization, Z.X. and Q.Y.; supervision, Q.Y.; project administration, X.L. All authors have read and agreed to the published version of the manuscript.

Funding

This work is supported by the National Natural Science Foundation of China (Nos. 12173099, 11903084, 12220101003), the Chinese Academy of Sciences (CAS) Project for Young Scientists in Basic Research (No. YSBR-061), the Scientific Instrument Developing Project of the Chinese Academy of Sciences (No. GJJSTD20210009), the Youth Innovation Promotion Association CAS, and the Natural Science Foundation of Jiangsu Province (No. BK20201107).

Institutional Review Board Statement

Not applicable.

Informed Consent Statement

Not applicable.

Data Availability Statement

Not applicable.

Acknowledgments

This work uses data recorded by the DAMPE mission, which was funded by the strategic priority science and technology projects in space science of the Chinese Academy of Sciences.

Conflicts of Interest

The authors declare no conflict of interest.

Abbreviations

The following abbreviations are used in this manuscript:
DAMPEDark Matter Particle Explorer
CRCosmic Rays
PSDPlastic Scintillator Detector
STKSilicon Tungsten tracKer-converter
BGO Bi 4 Ge 3 O 12
NUDNeUtron Detector
PCAPrincipal Component Analysis
MCMonte Carlo
HETHigh Energy Trigger
RMSRoot Mean Square

Notes

1
(Throughout this paper, we use electrons to represent electrons and positrons without discriminating them unless specified otherwise.)
2
(note that heavier nuclei can be highly suppressed by the charge measurement, leaving protons as the main background)

References

  1. Atoyan, A.M.; Aharonian, F.A.; Völk, H.J. Electrons and positrons in the galactic cosmic rays. Phys. Rev. D 1995, 52, 3265–3275. [Google Scholar] [CrossRef] [PubMed] [Green Version]
  2. Yuan, Q.; Feng, L. Dark Matter Particle Explorer observations of high-energy cosmic ray electrons plus positrons and their physical implications. Sci. China Phys. Mech. Astron. 2018, 61, 101002. [Google Scholar] [CrossRef] [Green Version]
  3. Feng, J.L. Dark Matter Candidates from Particle Physics and Methods of Detection. Annu. Rev. Astron. Astrophys. 2010, 48, 495–545. [Google Scholar] [CrossRef] [Green Version]
  4. Bertone, G.; Hooper, D.; Silk, J. Particle dark matter: Evidence, candidates and constraints. Phys. Rept. 2005, 405, 279–390. [Google Scholar] [CrossRef] [Green Version]
  5. DuVernois, M.A.; Barwick, S.W.; Beatty, J.J.; Bhattacharyya, A.; Bower, C.R.; Chaput, C.J.; Coutu, S.; de Nolfo, G.A.; Lowder, D.M.; McKee, S.; et al. Cosmic-Ray Electrons and Positrons from 1 to 100 GeV: Measurements with HEAT and Their Interpretation. Astrophys. J. 2001, 559, 296–303. [Google Scholar] [CrossRef] [Green Version]
  6. Torii, S.; Tamura, T.; Tateyama, N.; Yoshida, K.; Nishimura, J.; Yamagami, T.; Murakami, H.; Kobayashi, T.; Komori, Y.; Kasahara, K.; et al. The Energy Spectrum of Cosmic-Ray Electrons from 10 to 100 GeV Observed with a Highly Granulated Imaging Calorimeter. Astrophys. J. 2001, 559, 973–984. [Google Scholar] [CrossRef] [Green Version]
  7. Chang, J.; Adams, J.H.; Ahn, H.S.; Bashindzhagyan, G.L.; Christl, M.; Ganel, O.; Guzik, T.G.; Isbert, J.; Kim, K.C.; Kuznetsov, E.N.; et al. An excess of cosmic ray electrons at energies of 300–800 GeV. Nature 2008, 456, 362–365. [Google Scholar] [CrossRef]
  8. Aguilar, M.; Aisa, D.; Alpat, B.; Alvino, A.; Ambrosi, G.; Andeen, K.; Arruda, L.; Attig, N.; Azzarello, P.; Bachlechner, A.; et al. Precision Measurement of the (e++e) Flux in Primary Cosmic Rays from 0.5 GeV to 1 TeV with the Alpha Magnetic Spectrometer on the International Space Station. Phys. Rev. Lett. 2014, 113, 221102. [Google Scholar] [CrossRef] [Green Version]
  9. Cummings, A.C.; Stone, E.C.; Heikkila, B.C.; Lal, N.; Webber, W.R.; Jóhannesson, G.; Moskalenko, I.V.; Orlando, E.; Porter, T.A. Galactic Cosmic Rays in the Local Interstellar Medium: Voyager 1 Observations and Model Results. Astrophys. J. 2016, 831, 18. [Google Scholar] [CrossRef] [Green Version]
  10. Abdollahi, S.; Ackermann, M.; Ajello, M.; Atwood, W.B.; Baldini, L.; Barbiellini, G.; Bastieri, D.; Bellazzini, R.; Bloom, E.D.; Bonino, R.; et al. Cosmic-ray electron-positron spectrum from 7 GeV to 2 TeV with the Fermi Large Area Telescope. Phys. Rev. D 2017, 95, 082007. [Google Scholar] [CrossRef]
  11. Ambrosi, G.; An, Q.; Asfandiyarov, R.; Azzarello, P.; Bernardini, P.; Bertucci, B.; Cai, M.S.; Chang, J.; Chen, D.Y.; Chen, H.F.; et al. Direct detection of a break in the teraelectronvolt cosmic-ray spectrum of electrons and positrons. Nature 2017, 552, 63–66. [Google Scholar] [CrossRef] [Green Version]
  12. Adriani, O.; Akaike, Y.; Asano, K.; Asaoka, Y.; Bagliesi, M.G.; Bigongiari, G.; Binns, W.R.; Bonechi, S.; Bongi, M.; Brogi, P.; et al. Energy Spectrum of Cosmic-Ray Electron and Positron from 10 GeV to 3 TeV Observed with the Calorimetric Electron Telescope on the International Space Station. Phys. Rev. Lett. 2017, 119, 181101. [Google Scholar] [CrossRef] [PubMed] [Green Version]
  13. Aharonian, F.; Akhperjanian, A.G.; Barres de Almeida, U.; Bazer-Bachi, A.R.; Becherini, Y.; Behera, B.; Benbow, W.; Bernlöhr, K.; Boisson, C.; Bochow, A.; et al. Energy Spectrum of Cosmic-Ray Electrons at TeV Energies. Phys. Rev. Lett. 2008, 101, 261104. [Google Scholar] [CrossRef] [Green Version]
  14. Aharonian, F.; Akhperjanian, A.G.; Anton, G.; Barres de Almeida, U.; Bazer-Bachi, A.R.; Becherini, Y.; Behera, B.; Bernlöhr, K.; Bochow, A.; Boisson, C.; et al. Probing the ATIC peak in the cosmic-ray electron spectrum with H.E.S.S. Astron. Astrophys. 2009, 508, 561–564. [Google Scholar] [CrossRef]
  15. Borla Tridon, D. Measurement of the cosmic electron spectrum with the MAGIC telescopes. Int. Cosm. Ray Conf. 2011, 6, 47. [Google Scholar] [CrossRef]
  16. Staszak, D. A Cosmic-ray Electron Spectrum with VERITAS. Int. Cosm. Ray Conf. 2015, 34, 411. [Google Scholar]
  17. Chang, J. Dark Matter Particle Explorer: The First Chinese Cosmic Ray and Hard Gamma-ray Detector in Space. Chin. J. Space Sci. 2014, 34, 550. [Google Scholar] [CrossRef]
  18. Chang, J.; Ambrosi, G.; An, Q.; Asfandiyarov, R.; Azzarello, P.; Bernardini, P.; Bertucci, B.; Cai, M.S.; Caragiulo, M.; Chen, D.Y.; et al. The DArk Matter Particle Explorer mission. Astropart. Phys. 2017, 95, 6–24. [Google Scholar] [CrossRef] [Green Version]
  19. Yu, Y.; Sun, Z.; Su, H.; Yang, Y.; Liu, J.; Kong, J.; Xiao, G.; Ma, X.; Zhou, Y.; Zhao, H.; et al. The plastic scintillator detector for DAMPE. Astropart. Phys. 2017, 94, 1–10. [Google Scholar] [CrossRef] [Green Version]
  20. Dong, T.; Zhang, Y.; Ma, P.; Zhang, Y.; Bernardini, P.; Ding, M.; Guo, D.; Lei, S.; Li, X.; De Mitri, I.; et al. Charge measurement of cosmic ray nuclei with the plastic scintillator detector of DAMPE. Astropart. Phys. 2019, 105, 31–36. [Google Scholar] [CrossRef] [Green Version]
  21. Azzarello, P.; Ambrosi, G.; Asfandiyarov, R.; Bernardini, P.; Bertucci, B.; Bolognini, A.; Cadoux, F.; Caprai, M.; De Mitri, I.; Domenjoz, M.; et al. The DAMPE silicon-tungsten tracker. Nucl. Instrum. Methods Phys. Res. A 2016, 831, 378–384. [Google Scholar] [CrossRef]
  22. Zhang, Z.; Zhang, Y.; Dong, J.; Wen, S.; Feng, C.; Wang, C.; Wei, Y.; Wang, X.; Xu, Z.; Liu, S. Design of a high dynamic range photomultiplier base board for the BGO ECAL of DAMPE. Nucl. Instrum. Methods Phys. Res. A 2015, 780, 21–26. [Google Scholar] [CrossRef]
  23. He, M.; Ma, T.; Chang, J.; Zhang, Y.; Huang, Y.Y.; Zang, J.J.; Wu, J.; Dong, T.K. GEANT4 Simulation of Neutron Detector for DAMPE. Acta Astron. Sin. 2016, 57, 1–8. [Google Scholar]
  24. Tykhonov, A.; Ambrosi, G.; Asfandiyarov, R.; Azzarello, P.; Bernardini, P.; Bertucci, B.; Bolognini, A.; Cadoux, F.; D’Amone, A.; De Benedittis, A.; et al. In-flight performance of the DAMPE silicon tracker. Nucl. Instrum. Methods Phys. Res. A 2019, 924, 309–315. [Google Scholar] [CrossRef] [Green Version]
  25. Ambrosi, G.; An, Q.; Asfandiyarov, R.; Azzarello, P.; Bernardini, P.; Cai, M.S.; Caragiulo, M.; Chang, J.; Chen, D.Y.; Chen, H.F.; et al. The on-orbit calibration of DArk Matter Particle Explorer. Astropart. Phys. 2019, 106, 18–34. [Google Scholar] [CrossRef] [Green Version]
  26. An, Q.; Asfandiyarov, R.; Azzarello, P.; Bernardini, P.; Bi, X.J.; Cai, M.S.; Chang, J. Measurement of the cosmic ray proton spectrum from 40 GeV to 100 TeV with the DAMPE satellite. Sci. Adv. 2019, 5, eaax3793. [Google Scholar] [CrossRef] [Green Version]
  27. Alemanno, F.; An, Q.; Azzarello, P.; Barbato, F.C.T.; Bernardini, P.; Bi, X.J.; Cai, M.S.; Catanzani, E.; Chang, J.; Chen, D.Y.; et al. Measurement of the Cosmic Ray Helium Energy Spectrum from 70 GeV to 80 TeV with the DAMPE Space Mission. Phys. Rev. Lett. 2021, 126, 201102. [Google Scholar] [CrossRef]
  28. Alemanno, F.; An, Q.; Azzarello, P.; Barbato, F.C.T.; Bernardini, P.; Bi, X.; Cai, M.; Casilli, E.; Catanzani, E.; Chang, J.; et al. Observations of Forbush Decreases of Cosmic-Ray Electrons and Positrons with the Dark Matter Particle Explorer. Astrophys. J. Lett. 2021, 920, L43. [Google Scholar] [CrossRef]
  29. Alemanno, F.; An, Q.; Azzarello, P.; Carla Tiziana Barbato, F.; Bernardini, P.; Bi, X.J.; Cai, M.S.; Casilli, E.; Catanzani, E.; Chang, J.; et al. Search for gamma-ray spectral lines with the DArk Matter Particle Explorer. Sci. Bull. 2022, 67, 679–684. [Google Scholar] [CrossRef]
  30. Droz, D.; Tykhonov, A.; Wu, X.; Alemanno, F.; Ambrosi, G.; Catanzani, E.; Santo, M.D.; Kyratzis, D.; Zimmer, S. A neural network classifier for electron identification on the DAMPE experiment. J. Instrum. 2021, 16, P07036. [Google Scholar] [CrossRef]
  31. Zhao, H.; Peng, W.X.; Wang, H.Y.; Qiao, R.; Guo, D.Y.; Xiao, H.; Wang, Z.M. A machine learning method to separate cosmic ray electrons from protons from 10 to 100 GeV using DAMPE data. Res. Astron. Astrophys. 2018, 18, 071. [Google Scholar] [CrossRef] [Green Version]
  32. Francis, P.J.; Wills, B.J. Introduction to Principal Components Analysis. In Quasars and Cosmology; Astronomical Society of the Pacific Conference Series; Ferland, G., Baldwin, J., Eds.; World Scientific Publishing: Singapore, 1999; Volume 162, p. 363. [Google Scholar]
  33. James, G.M.; Hastie, T.J.; Sugar, C.A. Principal component models for sparse functional data. Biometrika 2000, 87, 587–602. [Google Scholar] [CrossRef]
  34. Schölkopf, B.; Smola, A.; Müller, K.R. Nonlinear Component Analysis as a Kernel Eigenvalue Problem. Neural Comput. 1998, 10, 1299–1319. [Google Scholar] [CrossRef] [Green Version]
  35. Ulfarsson, M.O.; Solo, V. Sparse Variable PCA Using Geodesic Steepest Descent. IEEE Trans. Signal Process. 2008, 56, 5823–5832. [Google Scholar] [CrossRef]
  36. Halko, N.; Martinsson, P.G.; Tropp, J.A. Finding Structure with Randomness: Probabilistic Algorithms for Constructing Approximate Matrix Decompositions. SIAM Rev. 2011, 53, 217–288. [Google Scholar] [CrossRef]
  37. Martinsson, P.G.; Rokhlin, V.; Tygert, M. A randomized algorithm for the decomposition of matrices. Appl. Comput. Harmon. Anal. 2011, 30, 47–68. [Google Scholar] [CrossRef] [Green Version]
  38. Minka, T.P. Automatic Choice of Dimensionality for PCA, Advances in Neural Information Processing Systems. 2001, pp. 598–604. Available online: https://proceedings.neurips.cc/paper/2000/file/7503cfacd12053d309b6bed5c89de212-Paper.pdf (accessed on 29 September 2022).
  39. Yue, C.; Zang, J.J.; Dong, T.K.; Li, X.; Zhang, Z.Y.; Zimmer, S.; Jiang, W.; Zhang, Y.L.; Wei, D.M. A parameterized energy correction method for electromagnetic showers in BGO-ECAL of DAMPE. Nucl. Instrum. Methods Phys. Res. A 2017, 851, 11–16. [Google Scholar] [CrossRef]
Figure 1. The pre-selection acceptance of electrons and protons.
Universe 08 00570 g001
Figure 2. The scattering plots of the first three principal components in the 350.0–700.0 GeV reconstructed energy range.
Universe 08 00570 g002
Figure 3. The distribution of the X , Y in the 350.0–700.0 GeV reconstructed energy range.
Universe 08 00570 g003
Figure 4. Left: The distributions of the rotated first principal component of the flight data and fitting results of the MC templates (left panels). Right: The residual background fractions versus signal efficiencies.
Universe 08 00570 g004
Figure 5. The background fraction is shown by red points (left axis) and a rejection power of protons by blue points with a line (right axis).
Universe 08 00570 g005
Table 1. The parameters found in the energy range of 350 to 700 GeV by the PCA method.
α β γ
0.35390.4676
0.94511.535
0.95511.723
1.29740.2088
0.069810.06027
1.0540.7731
1.9460.5759
0.84070.076820.3755
1.2801.109
1.4141.695
1.5090.2808
1.9870.4533
1.8901.241
0.75331.745
Publisher’s Note: MDPI stays neutral with regard to jurisdictional claims in published maps and institutional affiliations.