Abstract
Binary systems that host a massive star and a non-accreting pulsar can be powerful non-thermal emitters. The relativistic pulsar wind and the non-relativistic stellar outflows interact along the orbit, producing ultrarelativistic particles that radiate from radio to gamma rays. To properly characterize the physics of these sources, and better understand their emission and impact on the environment, careful modeling of the outflow interactions, spanning a broad range of spatial and temporal scales, is needed. Full three-dimensional approaches are very computationally expensive, but simpler approximate approaches, while still realistic at the semi-quantitative level, are available. We present here the results of calculations done with a quasi three-dimensional scheme to compute the evolution of the interacting flows in a region spanning in size up to a thousand times the size of the binary. In particular, we analyze for the first time the role of different eccentricities in the large scale evolution of the shocked flows. We find that the higher the eccentricity, the closer the flows behave like a one-side outflow, which becomes rather collimated for eccentricity values 0.75. The simulations also unveil that the pulsar and the stellar winds become fully mixed within the grid for low eccentricity systems, presenting a more stochastic behavior at large scales than in the highly eccentric systems.
1. Introduction
Binary systems hosting a massive star and a non-accreting pulsar, or pulsar high-mass binaries (PHMB), can be powerful sources of gamma rays. The objects of this kind capable of gamma-ray emission pertain to the wider class of gamma-ray binaries, in which most of the non-stellar radiation is released in the gamma-ray energy range, see, e.g., [1,2,3] for these and related sources. The radiation is produced through the interaction of a relativistic pulsar wind and the outflows ejected by the star: massive stars produce strong non-relativistic winds of supersonic nature and, in cases of very fast stellar rotation, quasi-Keplerian equatorial disks (or decretion disks) that flow outwards at subsonic speeds. These outflows interact with the pulsar wind and, later, on interstellar matter in a process in which ultrarelativistic particles are accelerated and produce emission from radio to gamma rays, see, e.g., [4,5,6,7,8,9,10,11,12,13,14,15].
The pulsar wind-stellar outflow interactions are complex, and different regions that can influence each other are relevant when trying to understand the evolution of the shocked flows. Even the associated radiation and its reprocessing can feedback on the flow dynamics, making the whole physical system highly non-linear. At small scales, there is the region right between the star and the pulsar in which flows are stopped and shocked by colliding against each other. After the collision, the flows become subsonic and hot, and start moving symmetrically sideways while pressure gradients lead to their reacceleration, getting supersonic again. This picture is roughly similar in both sides of the contact discontinuity separating the stellar and the pulsar shocked flows. Later on, the respective evolution of the flows largely differs due, for instance, to very different wind momentum rates and initial velocities, plus orbital effects.
Due to the large momentum rate of stellar winds, the stellar wind confines the pulsar wind, which bends over the pulsar. Shocked winds form an approximately axisymmetric curved structure that becomes conical further away from the binary. On those larger scales, if orbital motion were neglected, the shocked winds would move ballistically and form a conical shell made of shocked pulsar wind, surrounded by another shell of shocked stellar wind. The half-opening angle of the conical contact discontinuity would converge to a value that can be derived from the pulsar-to-stellar wind momentum rate ratio [16]:
where is pulsar spin-down luminosity, and are the stellar mass-loss rate and wind speed, respectively. Following [16,17], the contact discontinuity of the cone-like structure has an approximate opening angle of
However, orbital motion is to be included in the colliding-wind picture, which makes a Coriolis force appear, a force that affects differently the pulsar and the stellar outflows due to the large relative velocity and density contrast. This differential Coriolis effect makes the stellar wind push on the shocked pulsar wind against the orbital rotation sense, creating a strong deflection of the interaction structure in that direction, and triggering a strong lateral shock in the shocked pulsar wind. As the two shocked flows have very different densities and velocities, they are prone to the occurrence of strong instabilities, such as Rayleigh–Taylor, Kelvin–Helmholtz, and Richtmyer–Meshkov, in the contact discontinuity [18]. Thus, as the flows move, the outflow contact surface gets partially disrupted, stellar wind mixes with the shocked pulsar wind, and the latter develops strong turbulence and decelerates. The result is that the shocked flow structure shape becomes a one-arm spiral that fills much of the volume and is expected to disrupt after a few turns.
Between the apex of the interaction structure, located at the two-shocked flow stagnation point [19], and the starting point of the Coriolis shock, on the leading edge of the interaction structure, the shocked pulsar wind gets compressed and thus heated by the Coriolis force-related lateral pressure of the stellar wind. This can weaken the mentioned shocked flow reacceleration caused by pressure gradients. On the other hand, in the trailing edge of that interaction structure, the shocked pulsar wind quickly expands and accelerates through rarefaction waves.
The presence of decretion disks can significantly alter the geometry of the interaction structure, which must develop now embedded in a much more complex circumstellar environment. Nevertheless, the disk is rather massive and marginally bounded to the star, so part of the material may not even escape the binary. In addition, the accumulated disk mass can be in fact just comparable to that of the stellar wind. Thus, on large scales, the shocked flow dynamics are likely dominated by the pulsar and the stellar wind, the disk and radiation processes can be important for flow dynamics on small and middle scales. Assuming then that the disk is mostly relevant closer to the binary, and neglecting the role of the magnetic field, the system eccentricity may turn out to be as important as to describe the evolution of the shocked flows on large scales. In particular, Refs. [20,21] show that for very high eccentricities the shocked pulsar wind becomes strongly focused along the periastron-apastron direction, as it gets deflected by the stellar wind in that direction for most of the orbit. To date, however, an exploration of how different eccentricity values affect the large-scale shocked flow structure is missing, mainly, at which eccentricities one-sided outflows form.
In this work, we perform a numerical study of how the shocked flows from PHMB evolve and propagate, up to large distances from the binary for different eccentricities. Our major goal is to find for which orbit eccentricity the mentioned one-sided outflow forms. The study is carried out using the quasi three-dimensional (3D) calculation scheme developed by [22], used to study PSR B1259-63, and HESS J0632+057 [20,21]. The advantage of this method, which employs spherical coordinates, is that it focuses on the orbital plane, but sacrifices resolution for zenital angles far from that plane. Furthermore, the shocked flow geometry just outside the binary turns out to be amenable to be simplified such that the colliding-wind apex region does not need to be modeled, which allows a computationally much cheaper resolution. All this largely reduces the cost of the simulations, allowing one to probe a large region surrounding the binary. The accuracy of the method is appropriate at a semi-quantitative level, as shown by comparison with results obtained using full 3D calculations encompassing overlapping regions [18].
2. Numerical Model
Quasi-3D simulations of PHMB wind–wind collisions with different orbit eccentricities were performed using the PLUTO code (http://plutocode.ph.unito.it/index.html) [23]. PLUTO is a modular Godunov-type code entirely written in C and intended mainly for astrophysical applications and high Mach number flows in multiple spatial dimensions. Spatial parabolic interpolation, a third order Runge–Kutta approximation in time, and an HLLC Riemann solver were used [24]. The simulations were performed on the CFCA XC30 cluster of the National Astronomical Observatory of Japan (NAOJ). To reduce computing costs, the flow was approximated by a simple equation of state enough for our purposes: that of an ideal relativistic gas with adiabatic index . We adopted spherical coordinates , with 768 cells in both the radial and the azimuthal directions. To reduce the computation costs, we took only three cells in the zenital direction. The domain size was taken to be , and . We set , with a being the semi-major axis of the orbit, and e its eccentricity; thus, the scales captured by the simulations are larger than a few times the orbital separation distance at periastron. The computational grid was made logarithmic in the radial direction, that is, cells grow with a constant aspect ratio. Our treatment of the -direction allows a reasonably realistic characterization of the orbital plane physics on scales beyond the pulsar, where the interaction structure expansion becomes approximately linear with distance, although a more quantitative account would require a complete 3D treatment, see [20,21,22].
In the quasi-3D calculation scheme adopted here the injected pulsar wind has a half-opening angle , which depends on the momentum rate relation, which is set to , an intermediate value for this parameter, to restrict the degrees of freedom of the problem. This -value corresponds to radians, so the computational domain was divided into two non-equal parts. The first one, in which , was filled by a radial stellar wind with velocity value km s. The second part, in which , was filled by a radial pulsar wind with Lorentz factor . Despite this Lorentz factor being just moderately relativistic, the calculations are enough relativistic for our purposes because internal energy density already plays a significant inertial role, see [18,25]. The winds were assumed to be highly supersonic at injection, with Mach numbers and for the stellar and the pulsar wind, respectively, where “s” refers to the sound speed. For simplicity, any wind azimuthal velocity component, coming for instance from object rotation and angular momentum conservation, was neglected in our calculations as its value would be well below and c. Also, as discussed in Section 1, we neglected the role of a decretion disk, although more quantitative studies should include it.
The initial pulsar position is at the left of the computational domain, which means that the simulated pulsar wind cone is also initially directed to the left, which corresponds to the periastron-apastron direction. The adopted orbital period is days, and the stellar masses are M and M for the star and the pulsar, respectively, so from Kepler’s third law the corresponding orbital semi-major axis is cm. During the simulation, the -intervals within which the pulsar and the stellar winds are injected rotate along the orbit with the pace and sense of the corresponding orbital velocity. The studied cases have orbit eccentricities , 0.25, 0.5 and 0.75. Simulations with even larger e-values can be found in [20,21,22]. These e-values are characteristic of the different known high-mass gamma-ray binaries, although we note that a pulsar has been confirmed to be present only in PSR B1259−63 and PSR J2032+4127, e.g., [26,27]. On the other hand, the simulated orbital period is significantly shorter than those of HESS J0632+057, PSR B1259−63, and PSR J2032+4127. This was done as previous studies already explored cases with long periods [20,21,22]. It is worth noting that the asymmetry of the interaction structure on large scales should not depend significantly on because what characterizes this asymmetry is the relative change with of the shocked pulsar wind energy rate along the orbit, which is independent of . We note that a potential component of the stellar wind would affect the angular distribution of the flow, but since this component will become negligible at .
3. Results
Maps of the density distributions and the velocity vector fields in the orbital plane are presented in Figure 1 for the different eccentricities studied. Regardless of the eccentricity, the spiral structure starts to disrupt after one orbital turn, and after 2–3 orbital turns, spiral structure disruption leaves a more or less uniform medium with randomly located density and velocity irregularities. In particular, the velocity field shows spiral motion in the first turns and, farther away from the system, it mostly shows a radial outflow. Asymmetry of the interaction structure on the orbital plane starts to become significant for . In the case of , the effect becomes extreme, with the density (velocity) in the periastron-apastron direction being much smaller (larger) than in the other directions. For , this effect is also present, but not so strong. A fluid property used to track fluid motion–the tracer behavior, shown in Figure 2, is similar to that of the density, and one can see there as well that the spiral structure disappears after 2–3 orbital turns regardless of eccentricity. The higher the e-value, the more prominent the pulsar wind becomes in the periastron-apastron direction. The pressure spatial distribution is presented in Figure 3, showing the same trends as density and tracer. In addition, pressure shows a smooth drop after spiral structure disruption. As for density and tracer, the main difference between cases with low and high eccentricities is that pressure falls anisotropically, its decrease being slightly shallower in the periastron-apastron direction when e is large enough.
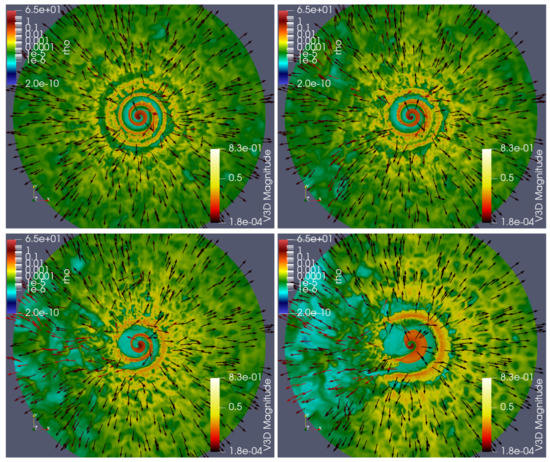
Figure 1.
Maps for the whole computational domain of the logarithm of the density distribution on the orbital plane by color, with colored arrows representing the velocity field, for different eccentricities: (top-left panel); (top-right panel); (bottom-left panel); and (bottom-right panel). The radius of the circular grid region shown is , and units of the legend scales are cm. The periastron-apastron direction is to the left.
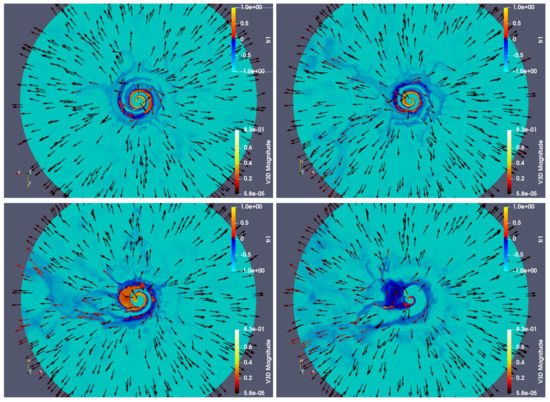
Figure 2.
The same as in Figure 1 but for tracer, where 1 and −1 correspond to the injected pulsar and stellar winds, respectively.
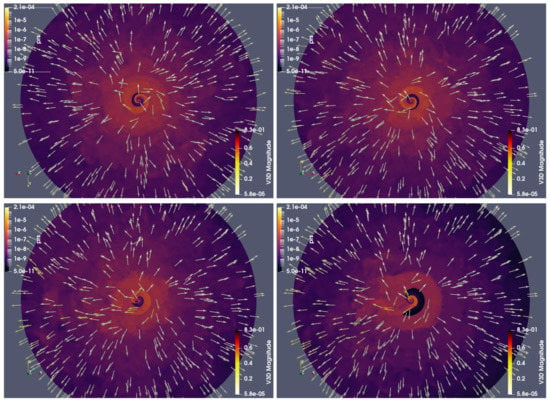
Figure 3.
The same as in Figure 1 but for pressure.
We averaged, weighting in mass, the radial velocity and the Mach number in three -ranges, or sectors: s1, with ; s2, with ; and s3, with . We also performed the mass-weighted average of the radial velocity in R, where . The mass-weighted value, averaged over a certain R- or -range, was calculated as
and
respectively, where is density, q the value being averaged, and the corresponding sector.
The radial distributions of averaged over s1, s2, and s3, at simulation time are presented in Figure 4. We note that time in this work is given in simulation units, which are s and are implicit. The figure includes the case for s1 at as well to illustrate short-term variability on top of the longer term behavior. Independently of the eccentricity, there are strong spatial variations in the radial velocity up to that are related to the spiral interaction structure. Beyond , there is a gradual acceleration of the flow, which is at that point already made of a mixture of pulsar and stellar winds. This acceleration is equally prominent for all sectors when , although the higher the eccentricity, the stronger the acceleration becomes for s1, around the periastron-apastron direction, and weaker for s2 and s3. This is also seen in Figure 5, which displays the dependence of the sector-averaged with e at . In general, the acceleration slows down at depending on e, which is expected as the flow becomes highly supersonic. In Figure 6, the radial distribution of averaged Mach number is also shown. At smaller radii, , large variations of this quantity are related to the spiral structure, whereas at larger radii the flow averaged Mach number approaches (being still strongly variable for high e). Despite the shallower drop of pressure in s1 shown above (see Figure 5), grows faster in that direction because more energy is invested in the flow motion whereas the average density is lower.
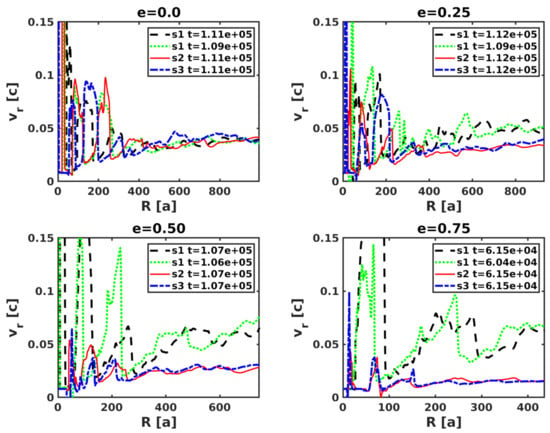
Figure 4.
Radial velocity, averaged over sectors s1, s2 and s3, versus R and different orbital eccentricities: (left top panel); (right-top panel); (left-bottom panel); and (right-bottom panel). An additional curve for the s1 case at a slightly earlier time, is also shown to illustrate the quick variability of the flow properties on top of its longer term behavior.
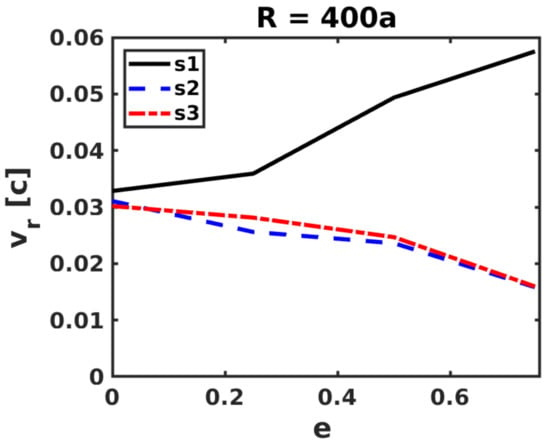
Figure 5.
Radial velocity, averaged over sectors s1, s2 and s3 at , versus orbital eccentricity.
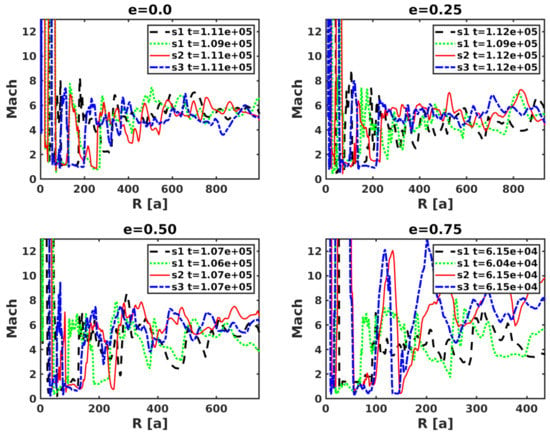
Figure 6.
The same as in Figure 4 but for Mach number.
To illustrate the temporal evolution of the system, color maps of sector-averaged radial velocity and Mach number in the R (y-axis) versus T (x-axis) plane are presented in Figure 7 and Figure 8, respectively. These maps show two different color regions that indicate the transition at from a spiral structure to a more homogeneous, mixed, outflow at larger radii. This effect is very prominent in all directions for low eccentricities, both in averaged and Mach number, whereas for high eccentricities the same effect is much more prominent in s1 (around the periastron-apastron direction) than in s2 and s3 for , whereas for the Mach number the opposite happens, although less dramatically. The slower increase in the s1-averaged Mach number for high e-values is related to the presence of shocks that reheat the flow. The contrast of shocked flow behavior depending on e is also illustrated in Figure 9, which shows the whole -averaged in sector s1 versus T at for different eccentricities. The velocity jump grows with eccentricity and became more pronounced for .
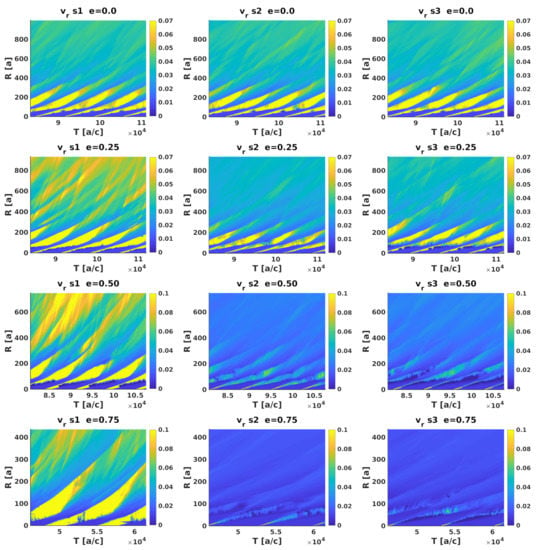
Figure 7.
Color map of (in light speed units), averaged over sectors s1, s2 and s3, in the R (y-axis) versus T (x-axis) plane. Rows from top to bottom correspond to 0, 0.25, 0.5, and 0.75, and columns from left to right to s1, s2, and s3.
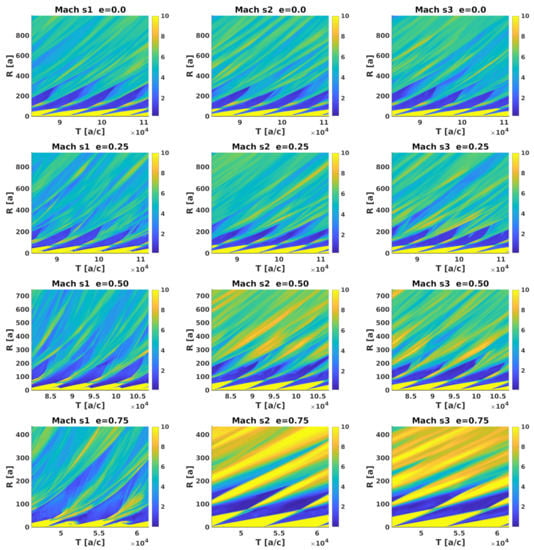
Figure 8.
The same as in Figure 7 but for Mach number.
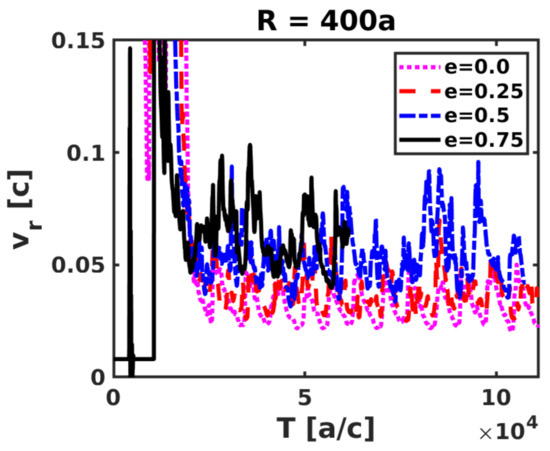
Figure 9.
Radial velocity, averaged over s1, versus T at for different eccentricities.
The radial velocity, averaged over R in the interval , versus is shown in Figure 10. The radial velocity is also color mapped on the (y-axis) versus T (x-axis) plane in Figure 11. Consistent with previous figures, one sees that the low e cases present a quasi-isotropic flow with significant stochastic behavior on top of the longer term behavior, whereas high e-cases show faster flows concentrate around the periastron-apastron direction ().
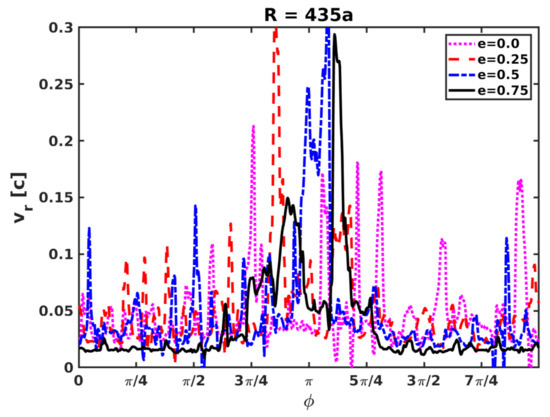
Figure 10.
Radial velocity, averaged over R in the interval , versus for different eccentricities.
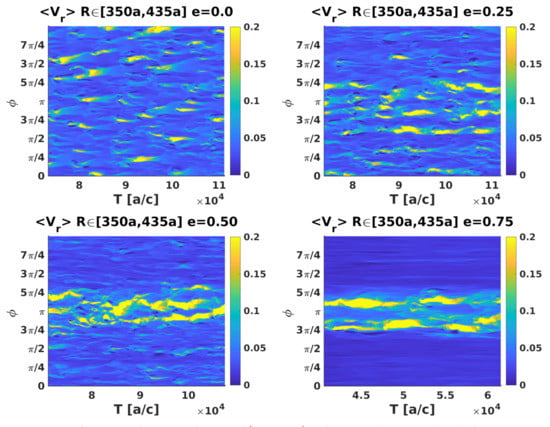
Figure 11.
Map of , averaged over R in the interval , in the (y-axis) versus T (x-axis) plane, at , for different eccentricities: (left-top panel); (right-top panel); (left-bottom panel); and (right-bottom panel).
4. Summary and Discussion
In this article, we have presented a detailed analysis of the results obtained by the simulation of colliding pulsar and stellar winds. For the first time, cases with different eccentricities are systematically explored, so the impact of this prediction can be assessed. The further development of these models should impact the studies of very powerful sources such as HMPB or microquasars [28,29,30,31]. We note that the first simulation of a jet-stellar wind interaction in a microquasar along a full orbit has been already done in [32].
The evolution of the shocked pulsar and stellar winds was studied analytically in [33]. The mixed-wind eventual velocity away (expel) from the binary can be estimated as:
where , and our numerical results, (see Figure 4), confirm this prediction.
In our numerical calculations, we find that the shocked flow structure on large scales is a slowly accelerating, supersonic mixture of shocked stellar and pulsar winds, with an approximately isotropic propagation in . We note that the simulations could not properly probe the expansion in due to low resolution, although 3D simulations by [18] suggest that on scales the shocked structure can become wider in that direction than conical expansion predicts because of internal energy confinement. The present work also shows that this mixed supersonic wind is very clumpy in density and velocity, so particle acceleration may easily occur in such an environment.
Our results are fully consistent with those obtained by [20,22], who showed for the first time the dramatic impact that eccentricity can have on the evolution of the shocked flows on large scales (non-thermal processes were discussed in Barkov and Bosch-Ramon [21]). In addition to that, the present work also characterizes the eccentricity of a transition between an approximately isotropic supersonic wind, made of shocked stellar and pulsar wind (for small e), and a sort of two-component structure, one fast, light and collimated, directed along the periastron-apastron direction, and the other slow, dense and broad, directed elsewhere (for high e). In particular, we find that the transition is somewhere between and 0.75, probably close to the latter.
As mentioned in Section 2, our results should not be sensitive to the orbital period on large scales. This implies that at a semi-quantitative level, our predictions can be extrapolated to wider systems. However, higher accuracy in the estimate of the eccentricity associated to a structure geometry transition requires fully 3D calculations. On the other hand, the magnetic field could also play an important role in the evolution of the shocked flows, and should be included in future stages of this research. Moreover, future numerical work should tackle the issue of how the shocked mixed flows interact with the interstellar medium, both in the low e, see [34] for analytical predictions, and the high e regimes. Finally, the consequences of the eccentricity dependence of the shocked flow evolution with respect to non-thermal emission should be studied in more detail than what has been done so far.
Author Contributions
M.V.B. performed the numerical simulation and data analysis. V.B.-R. and M.V.B. worked on the text of the manuscript. All authors have read and agreed to the published version of the manuscript.
Funding
V.B.-R. acknowledges financial support by the State Agency for Research of the Spanish Ministry of Science and Innovation under grant PID2019-105510GB-C31 and through the ”Unit of Excellence María de Maeztu 2020-2023” award to the Institute of Cosmos Sciences (CEX2019-000918-M), and by the Catalan DEC grant 2017 SGR 643.
Data Availability Statement
The original data and its analysis can be requested by email.
Acknowledgments
V.B.-R. is Correspondent Researcher of CONICET, Argentina, at the IAR. The simulations were performed on the CFCA XC30 cluster of the National Astronomical Observatory of Japan.
Conflicts of Interest
The authors declare no conflict of interest.
References
- Dubus, G. Gamma-ray binaries and related systems. Astron. Astrophys. Rev. 2013, 21, 64. [Google Scholar] [CrossRef]
- Paredes, J.M.; Bordas, P. Phenomenology of gamma-ray emitting binaries. arXiv 2019, arXiv:1902.09898. [Google Scholar] [CrossRef]
- Paredes, J.M.; Bordas, P. Broad-band Emission from Gamma-ray Binaries. arXiv 2019, arXiv:1901.03624. [Google Scholar]
- Tavani, M.; Arons, J. Theory of High-Energy Emission from the Pulsar/Be Star System PSR 1259-63. I. Radiation Mechanisms and Interaction Geometry. Astrophys. J. 1997, 477, 439–464. [Google Scholar] [CrossRef]
- Sierpowska, A.; Bednarek, W. γ-rays from cascades in close massive binaries containing energetic pulsars. Mon. Not. R. Astron. Soc. 2005, 356, 711–726. [Google Scholar] [CrossRef][Green Version]
- Dubus, G. Gamma-ray binaries: Pulsars in disguise? Astron. Astrophys. 2006, 456, 801–817. [Google Scholar] [CrossRef]
- Neronov, A.; Chernyakova, M. Radio-to-TeV γ-ray emission from PSR B1259 63. Astrophys. Space Sci. 2007, 309, 253–259. [Google Scholar] [CrossRef]
- Khangulyan, D.; Hnatic, S.; Aharonian, F.; Bogovalov, S. TeV light curve of PSR B1259-63/SS2883. Mon. Not. R. Astron. Soc. 2007, 380, 320–330. [Google Scholar] [CrossRef][Green Version]
- Kong, S.W.; Cheng, K.S.; Huang, Y.F. Modeling the Multiwavelength Light Curves of PSR B1259-63/LS 2883. II. The Effects of Anisotropic Pulsar Wind and Doppler Boosting. Astrophys. J. 2012, 753, 127. [Google Scholar] [CrossRef][Green Version]
- Zabalza, V.; Bosch-Ramon, V.; Aharonian, F.; Khangulyan, D. Unraveling the high-energy emission components of gamma-ray binaries. Astron. Astrophys. 2013, 551, A17. [Google Scholar] [CrossRef]
- Dubus, G.; Lamberts, A.; Fromang, S. Modelling the high-energy emission from gamma-ray binaries using numerical relativistic hydrodynamics. Astron. Astrophys. 2015, 581, A27. [Google Scholar] [CrossRef]
- Molina, E.; Bosch-Ramon, V. A dynamical and radiation semi-analytical model of pulsar-star colliding winds along the orbit: Application to LS 5039. Astron. Astrophys. 2020, 641, A84. [Google Scholar] [CrossRef]
- Huber, D.; Kissmann, R.; Reimer, O. Relativistic fluid modelling of gamma-ray binaries. II. Application to LS 5039. Astron. Astrophys. 2021, 649, A71. [Google Scholar] [CrossRef]
- Lyutikov, M.; Barkov, M.V.; Giannios, D. FRB Periodicity: Mild Pulsars in Tight O/B-star Binaries. Astrophys. J. Lett. 2020, 893, L39. [Google Scholar] [CrossRef]
- Khangulyan, D.; Barkov, M.V.; Popov, S.B. High-frequency radio synchrotron maser emission from relativistic shocks. arXiv 2021, arXiv:2106.09858. [Google Scholar]
- Bogovalov, S.V.; Khangulyan, D.V.; Koldoba, A.V.; Ustyugova, G.V.; Aharonian, F.A. Modelling interaction of relativistic and non-relativistic winds in binary system PSR B1259-63/SS2883—I. Hydrodynamical limit. Mon. Not. R. Astron. Soc. 2008, 387, 63–72. [Google Scholar] [CrossRef]
- Eichler, D.; Usov, V. Particle Acceleration and Nonthermal Radio Emission in Binaries of Early-Type Stars. Astrophys. J. 1993, 402, 271. [Google Scholar] [CrossRef]
- Bosch-Ramon, V.; Barkov, M.V.; Perucho, M. Orbital evolution of colliding star and pulsar winds in 2D and 3D: Effects of dimensionality, EoS, resolution, and grid size. Astron. Astrophys. 2015, 577, A89. [Google Scholar] [CrossRef]
- Bogovalov, S.V.; Khangulyan, D.; Koldoba, A.V.; Ustyugova, G.V.; Aharonian, F.A. Modelling the interaction between relativistic and non-relativistic winds in the binary system PSR B1259-63/SS2883—II. Impact of the magnetization and anisotropy of the pulsar wind. Mon. Not. R. Astron. Soc. 2012, 419, 3426–3432. [Google Scholar] [CrossRef][Green Version]
- Bosch-Ramon, V.; Barkov, M.V.; Mignone, A.; Bordas, P. HESS J0632+057: Hydrodynamics and non-thermal emission. Mon. Not. R. Astron. Soc. 2017, 471, L150–L154. [Google Scholar] [CrossRef]
- Barkov, M.V.; Bosch-Ramon, V. A hydrodynamics-informed, radiation model for HESS J0632 + 057 from radio to gamma-rays. Mon. Not. R. Astron. Soc. 2018, 479, 1320–1326. [Google Scholar] [CrossRef]
- Barkov, M.V.; Bosch-Ramon, V. The origin of the X-ray-emitting object moving away from PSR B1259-63. Mon. Not. R. Astron. Soc. 2016, 456, L64–L68. [Google Scholar] [CrossRef]
- Mignone, A.; Bodo, G.; Massaglia, S.; Matsakos, T.; Tesileanu, O.; Zanni, C.; Ferrari, A. PLUTO: A Numerical Code for Computational Astrophysics. Astrophys. J. Suppl. Ser. 2007, 170, 228–242. [Google Scholar] [CrossRef]
- Li, S. An HLLC Riemann solver for magneto-hydrodynamics. J. Comput. Phys. 2005, 203, 344–357. [Google Scholar] [CrossRef]
- Bosch-Ramon, V.; Barkov, M.V.; Khangulyan, D.; Perucho, M. Simulations of stellar/pulsar-wind interaction along one full orbit. Astron. Astrophys. 2012, 544, A59. [Google Scholar] [CrossRef]
- Aharonian, F.; Akhperjanian, A.G.; Aye, K.M.; Bazer-Bachi, A.R.; Beilicke, M.; Benbow, W.; Berge, D.; Berghaus, P.; Bernlöhr, K.; Boisson, C.; et al. Discovery of the binary pulsar PSR B1259-63 in very-high-energy gamma rays around periastron with HESS. Astron. Astrophys. 2005, 442, 1–10. [Google Scholar] [CrossRef]
- Lyne, A.G.; Stappers, B.W.; Keith, M.J.; Ray, P.S.; Kerr, M.; Camilo, F.; Johnson, T.J. The binary nature of PSR J2032+4127. Mon. Not. R. Astron. Soc. 2015, 451, 581–587. [Google Scholar] [CrossRef]
- Dubus, G.; Cerutti, B.; Henri, G. The relativistic jet of Cygnus X-3 in gamma-rays. Mon. Not. R. Astron. Soc. 2010, 404, L55–L59. [Google Scholar] [CrossRef]
- Zdziarski, A.A.; Malyshev, D.; Dubus, G.; Pooley, G.G.; Johnson, T.; Frankowski, A.; De Marco, B.; Chernyakova, M.; Rao, A.R. A comprehensive study of high-energy gamma-ray and radio emission from Cyg X-3. Mon. Not. R. Astron. Soc. 2018, 479, 4399–4415. [Google Scholar] [CrossRef]
- Sinitsyna, V.G.; Sinitsyna, V.Y. Cyg X 3: A gamma ray binary. Astron. Nachrichten 2021, 342, 337–341. [Google Scholar] [CrossRef]
- Massi, M.; Chernyakova, M.; Kraus, A.; Malyshev, D.; Jaron, F.; Kiehlmann, S.; Dzib, S.A.; Sharma, R.; Migliari, S.; Readhead, A.C.S. Evidence for periodic accretion-ejection in LS I +61°303. Mon. Not. R. Astron. Soc. 2020, 498, 3592–3600. [Google Scholar] [CrossRef]
- Bosch-Ramon, V.; Barkov, M. Relativistic hydrodynamical simulations of the effects of the stellar wind and orbital motion on the jets of high-mass microquasars. Astron. Astrophys. 2021, 590, A119. [Google Scholar]
- Bosch-Ramon, V.; Barkov, M.V. Large-scale flow dynamics and radiation in pulsar γ-ray binaries. Astron. Astrophys. 2011, 535, A20. [Google Scholar] [CrossRef]
- Bosch-Ramon, V. Radio emission from high-mass binaries with non-accreting pulsars. arXiv 2011, arXiv:1103.2996. [Google Scholar]
Publisher’s Note: MDPI stays neutral with regard to jurisdictional claims in published maps and institutional affiliations. |
© 2021 by the authors. Licensee MDPI, Basel, Switzerland. This article is an open access article distributed under the terms and conditions of the Creative Commons Attribution (CC BY) license (https://creativecommons.org/licenses/by/4.0/).