Communication

Beryllium Radioactive Isotopes as a Probe to Measure the Residence Time of Cosmic Rays in the Galaxy and Halo Thickness: A “Data-Driven” Approach †

by
Francesco Nozzoli
1,* and
Cinzia Cernetti
2
1
Istituto Nazionale Fisica Nucleare, INFN-TIFPA, via Sommarive, 14, I-38123 Trento, Italy
2
Department of Physics, Trento University, via Sommarive, 14, I-38123 Trento, Italy
*
Author to whom correspondence should be addressed.
This paper is an extended version from the proceeding paper: Cinzia Cernetti and Francesco Nozzoli. Beryllium Radioactive Isotopes as a Probe to Measure Residence Time of Cosmic Rays in the Galaxy and Halo Thickness. In Proceedings of the 1st Electronic Conference on Universe, online, 22–28 February 2021.
Universe 2021, 7(6), 183; https://doi.org/10.3390/universe7060183
Submission received: 29 April 2021 / Revised: 20 May 2021 / Accepted: 1 June 2021 / Published: 4 June 2021

Abstract

:
Cosmic rays are a powerful tool for the investigation of the structure of the magnetic fields in the Galactic halo and the properties of the inter-stellar medium. Two parameters of the cosmic ray propagation models, the Galactic halo (half) thickness, H, and the diffusion coefficient, D, are loosely constrained by current cosmic ray flux measurements; in particular, a large degeneracy exists, with only H / D being well measured. The 10 Be/ 9 Be isotopic flux ratio (thanks to the 2 My lifetime of 10 Be) can be used as a radioactive clock providing the measurement of cosmic ray residence time in a galaxy. This is an important probe with which to solve the H / D degeneracy. Past measurements of 10 Be/ 9 Be isotopic flux ratios in cosmic rays are scarce, and were limited to low energy and affected by large uncertainties. Here a new technique to measure 10 Be/ 9 Be isotopic flux ratio, with a data-driven approach in magnetic spectrometers is presented. As an example, by applying the method to beryllium events published via PAMELA experiment, it is now possible to determine the important 10 Be/ 9 Be measurement while avoiding the prohibitive uncertainties coming from Monte Carlo simulations. It is shown how the accuracy of PAMELA data strengthens the experimental indication for the relativistic time dilation of 10 Be decay in cosmic rays; this should improve the knowledge of the H parameter.

1. Introduction

Cosmic rays are a powerful tool for investigations of physics/astrophysics: high-energy cosmic ray composition provides information on the galactic PeVatrons, and the small anti-matter component in a cosmic ray could identify the dark matter annihilation in our galaxy.
The structure of the magnetic fields in the galactic halo and the properties of the inter-stellar medium can be probed by detailed cosmic ray flux measurements. In particular, the ratio of secondary cosmic rays (such as Li, Be and B) over the primary cosmic rays (such as He, C and O) allows one to determine the grammage —that is, the amount of material passed through by cosmic rays on their journeys through the Galaxy.
Two parameters of the cosmic ray propagation models, the galactic halo (half) thickness, H, and the diffusion coefficient, D, are loosely constrained by the grammage measurement; in particular, a large degeneracy exists, with only H / D being well measured [1].
The uncertainties of D and H parameters (the latter is known to be in the 3–8 kpc range) also reflect on the accuracy of the determination of secondary anti-proton and positrons fluxes that are the background for the dark matter or exotic (astro-)physics searches [2,3,4,5].
Abundances of long-living unstable isotopes in cosmic rays can be used as radioactive clocks providing measurements of cosmic rays’ time spent in the Milky Way. This time information is complementary to the crossed grammage; thus, the abundance of radioactive isotopes in cosmic rays is an important probe for solving the existing H / D degeneracy in cosmic ray propagation models.

Beryllium Isotopic Measurements in Cosmic Rays

Only a few elements in cosmic rays, namely, Be, Al, Cl, Mg and Fe, contain long-living radioactive isotopes; among them, beryllium is the lightest, and thus the most promising for measurements of isotopic composition in the relativistic kinetic energy range. Three beryllium isotopes are found in cosmic rays:
  • 7 Be: stable bare nucleus. It decays by electron capture (T 1 / 2 = 53 days).
  • 9 Be: stable.
  • 10 Be β -radioactive nucleus (T 1 / 2 = 1.39 × 10 6 years).
The missing 8 Be has a central role in stellar and Big-Bang nucleosynthesis; the extremely short half-life (8.19 × 10 17 s) represents a bottleneck for the efficient synthesis of heavier nuclei in the Universe. From the measurement point of view, this “isotopic hole” in the beryllium mass spectrum is very useful in order to determine the large amount of 7 Be and reduce the contamination in the identification of 9 Be and 10 Be.
It is important to mention that with 10 B being the daughter nucleus of 10 Be β -decay, it is possible to extract information of the parameters H and D by using the precise measurement of the elemental ratio Be/B in place of the much more difficult measurement of the 10 Be/ 9 Be isotopic ratio. This possibility was originally discussed in [6], and more recently, the expected value of the 10 Be/ 9 Be isotopic ratio in cosmic rays has become able to be inferred from the precisely measured cosmic rays elemental ratios [1,2,4,5]. However, the problem of uncertainties or biases in fragmentation cross-sections should also be mentioned; in particular, nuclear uncertainties in secondary production models are a major limitation in the interpretation of secondary cosmic ray nuclei [5,7,8]. Thus, isotopically resolved cosmic ray measurements such as the 10 Be/ 9 Be ratio remain very important to model the propagation of cosmic rays.
An example of a magnetic spectrometer able to measure cosmic ray isotopic composition in space is given by the PAMELA detector (see Figure 1). The PAMELA spectrometer was installed onboard Resurs-DK1, the Russian satellite, and launched on 15 June 2006. The spectrometer is 1.3 m long; the 0.43T permanent magnet is equipped with a silicon microstrip Tracker that provides particle rigidity ( R = p / Z ) up to 1TV and energy loss (dE/dx) measurements. A time of flight (ToF) detector, made of three pairs of plastic scintillators, is used to measure the velocity, β = v / c ; particle energy loss, dE/dx; and charge, Z. The time resolution of ToF ranges from 85 to 80 ps for lithium and beryllium nuclei, respectively. At its bottom a silicon-tungsten imaging calorimeter is able to provide a redundant β measurement for sub-relativistic particles thanks to the Bethe–Bloch formula dE/dx Z 2 / β 2 . The identification of different isotopes in magnetic spectrometers relies on the simultaneous measurement of particle rigidity and velocity. This allows the reconstruction of the particle mass m = R Z / ( γ β ) .
The typical mass resolution of magnetic spectrometers onboard past or current cosmic ray experiments ( δ M 0.4–1 amu) does not allow for an event-by-event isotope identification; therefore, the “traditional” approach for the measurement of beryllium’s isotopic abundances relies on the reading of the experimental mass distribution with a Monte Carlo simulation.
This approach requires a very well tuned Monte Carlo simulation of the experiment, and the possible small residual discrepancies with the real detector response could prevent the measurement of the (interesting) small amount of 10 Be.
The analysis of lithium and beryllium isotopes collected by the PAMELA experiment between July 2006 and September 2014 is well described in [9], where the “Monte-Carlo-based” approach only allows for the measurement of 7 Li/ 6 Li and 7 Be/( 9 Be+ 10 Be) due to a slight mismatch of Monte Carlo distributions with the flight data.
In the following a new data-driven approach for the measurement of beryllium isotopic abundances with magnetic spectrometers is described; this can evade part of the systematics related to Monte Carlo simulation. As an example, the application of this approach to PAMELA lithium and beryllium event counts, gathered from Figures 3 and 4 of [9], is shown; and a preliminary, new measurement of 10 Be/ 9 Be in the 0.2–0.85 GeV/n range is provided. Figure 3 of [9] contains the numbers of lithium and beryllium events as functions of β measured by the time of flight (ToF) sub-detector and rigidity measured by the silicon tracker, whereas Figure 4 of [9] contains the numbers of lithium and beryllium events as functions of dE/dx measured by the imaging calorimeter and rigidity measured by the silicon tracker. Both figures contain color coded small integers; therefore, for this example, counts could be extracted (without errors) by image analysis as if they were published in a table.

2. Data-Driven Analysis

By knowing the true values of beryllium isotope masses and having a physically motivated scaling of the mass resolution for the three beryllium isotopes, the shapes of the isotope mass distributions can be retrieved, by self-consistency, solely from the measured data.
In particular, the expected mass resolution for a magnetic spectrometer is:
δ M M = δ R R 2 + γ 4 δ β β 2 .
Typically, the isotopic measurement is pursued in kinetic energy/nucleon bins (i.e., in β bins); therefore, the velocity contribution to mass resolution is constant for the different isotopes.
Moreover, in the (low) kinetic energy range accessible by current isotopic measurements, the rigidity resolution is dominated by multiple Coulomb scattering; i.e., δ R / R is practically constant for the different isotopes.
Finally, the masses of the three Be isotopes are within 30%; therefore, for a fixed β value, the rigidity values for different Be isotopes are within 30%; for this reason, with a very good approximation, δ M / M is constant and we can assume that RMS(M)/<M> is the same for the three unknown mass distributions (hereafter also named t e m p l a t e s ). The accuracy of this approximation is even better for Li isotopes and B isotopes due to the small mass difference.

2.1. Template Transformations

We can define T 7 , T 9 and T 10 as the unknown normalized templates for 7 Be, 9 Be and 10 Be respectively.
A template T a can transform in the template T b by applying the operator A a , b T a ( x ) = T b ( x ) , and we can assume A a , b is just transforming the coordinates x g ( x ) ; therefore, to ensure template normalization:
T b ( x ) = A a , b T a ( x ) = d g d x T a ( g ( x ) )
In principle an infinite set of functions g ( x ) is able to perform a transformation between two specific templates; however, we are typically interested in monotonic functions preserving quantiles while avoiding folding the template. A very simple set of transformations are the linear ones L a , b defined by combinations of translation and scale transformations: x m x + q .
The linear L a , b transforms a normal distribution in a normal distribution.
By defining σ a as the RMS of template T a , and x a the median of template T a , the linear transformation L a , b T a = T b is the function: x σ a σ b x + x a σ a σ b x b .
The same transformation applied to a different template L a , b T c = T d provides: σ d = σ c σ b σ a and x d = x b + ( x c x a ) σ b σ a .
The linear transformation that satisfies the assumption, δ M / M = constant, is simply: x x a x b x ; that is a pure scaling, thereby depending only on the known beryllium isotope mass ratios and not on the unknown mass resolution or template shapes. In the following, the linear approximation for the template transformation is adopted.

2.2. Data-Driven Template Evaluation

Defining the known (measured) data distribution D ( x ) and assuming as fixed the three fractions n Be/Be, this equation system can be considered:
D ( x ) = 7 B e T 7 + 9 B e T 9 + 10 B e T 10 L 7 , 9 D ( x ) = 7 B e T 9 + 9 B e L 7 , 9 T 9 + 10 B e L 7 , 9 T 10 L 7 , 10 D ( x ) = 7 B e T 10 + 9 B e L 7 , 10 T 9 + 10 B e L 7 , 10 T 10 ;
therefore, the 7 Be template can be written as:
T 7 = 1 7 B e D 9 B e 7 B e L 7 , 9 D 10 B e 7 B e L 7 , 10 D + + 9 B e 7 B e 2 T G 1 + 9 B e 7 B e 10 B e 7 B e ( T G 2 + T G 3 ) + 10 B e 7 B e 2 T G 4
and the last four terms, ghost-templates, are defined by:
T G 1 = L 7 , 9 T 9 = L 7 , x G 1 T 7 T G 2 = L 7 , 9 T 10 = L 7 , x G 2 T 7 T G 3 = L 7 , 10 T 9 = L 7 , x G 3 T 7 T G 4 = L 7 , 10 T 10 = L 7 , x G 4 T 7 .
The median values of ghost-templates can be evaluated as follows:
x G 1 = x 9 + ( x 9 x 7 ) σ 9 σ 7 11.5 amu x G 2 = x 9 + ( x 10 x 7 ) σ 9 σ 7 13 amu x G 3 = x 10 + ( x 9 x 7 ) σ 10 σ 7 13 amu x G 4 = x 10 + ( x 10 x 7 ) σ 10 σ 7 14 amu
Profiting from the fact that the ghost-templates are placed beyond T 10 and that we know 7 Be > 9 Be > 10 Be, the contribution of ghost-templates to Equation (4) is small and T 7 can be iteratively evaluated from measured data by using Equation (5).
Once T 7 is obtained, the other templates can be straightforwardly obtained by using L 7 , 9 and L 7 , 10 , and a χ 2 value for the fixed 7 Be/Be and 9 Be/ 10 Be can be obtained by comparison of the sum of the three weighted templates with D ( x ) . The 7 Be/Be and 9 Be/ 10 Be best fit configuration is retrieved by minimizing the χ 2 value.
In a very similar way, the data-driven approach can be adopted for the measurements of a 11 B/ 10 B or 7 Li/ 6 Li flux ratio in cosmic rays. When applied to the measurement of the abundance ratio among only two isotopes, the data-driven approach formulation is even simpler with respect to the three Be isotopes; however, the missing 8 Be, and the fact that 7 Be > 9 Be > 10 Be, are two favorable conditions for the determination of the isotope templates directly from experimental data.
In particular, for the example of Li isotopes, the apparently simple solution for the T 6 template:
T 6 = 1 6 L i D 7 L i 6 L i L 6 , 7 D + 7 L i 6 L i 2 L 6 , 7 T 7
would provide an inaccurate determination of the rightmost T 6 tail due to 7 Li/ 6 Li ∼ 1. This problem can be overcome by evaluating the rightmost tail by iteratively solving the T 7 template (that conversely would provide an inaccurate determination of its leftmost tail for the same reason):
T 7 = 1 7 L i D 6 L i 7 L i L 7 , 6 D + 6 L i 7 L i 2 L 7 , 6 T 6 .
This data-driven approach has been tested on the Monte Carlo simulated events for lithium and beryllium isotopes in the AMS-02 spectrometer (see e.g., [10]), and it is able to correctly retrieve the injected isotopic ratios and template shapes within the statistical fluctuations.

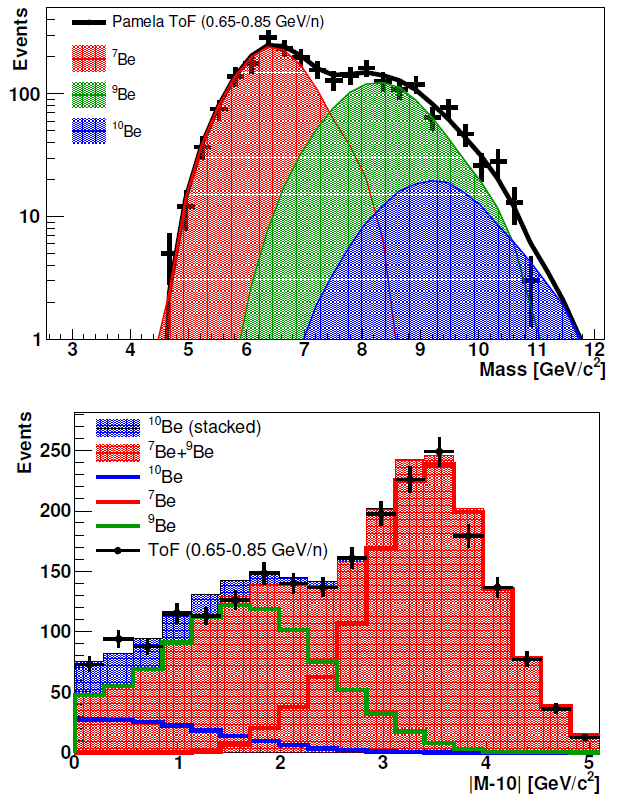
3. An Example of an Application to Pamela Lithium and Beryllium Events

The application of the data-driven approach to lithium and beryllium events published by PAMELA experiment [9] is shown in the following as an example. It is important to note that despite a preliminary measurement of 10 Be/ 9 Be being obtained in the 0.25–0.85 GeV/n kinetic energy range, a full data analysis using this approach by the PAMELA-collaboration could provide a complete measurement of 10 Be/ 9 Be at up to ∼1 GeV/n.
In Figure 2, the example of lithium isotope measurements, by analyzing PAMELA-ToF events in the 0.25–0.75 GeV/n region, is shown. The templates for 6 Li and 7 Li were obtained by applying the data-driven approach.
It is important to note that trivial solutions of the data-driven analysis (Equations (7) and (8)) are obviously 6 Li/Li = 1 and 7 Li/Li = 1; these naive solutions are characterized by χ 2 = 0 . Therefore, the evaluation of the confidence interval for the local minimum of χ 2 determined by the physical solution requires some care; in particular, the statistical bootstrap [11] was adopted to safely evaluate the confidence intervals. Figure 3 shows the χ 2 minimum corresponding to the physical solution for the measurement of lithium isotope abundances using PAMELA ToF in the range 0.25–0.75 GeV/n. Figure 3 also shows the probability distribution of best-fit configurations obtained by statistically bootstrap-re-sampling the measured data distribution.
A similar approach was adopted for the data-driven analysis of beryllium isotopes; and in this case 7 Be/Be = 1, 9 Be/Be = 1 and 10 Be/Be = 1 are three trivial solutions of Equation (4). In Figure 4, the χ 2 map for the < 7 Be/Be vs. 10 Be/ 9 Be> parameter space is shown as an example of PAMELA-ToF events in the 0.65–0.85 GeV/n range (the last bin of this beryllium analysis).
In this last case the shown confidence interval was determined as the iso- χ 2 contour containing 68% of the best-fit configurations obtained by statistically bootstrap-re-sampling the measured data distribution.
In Figure 5, the best-fit for the example of beryllium isotopes collected by PAMELA-ToF in the 0.65–0.85 GeV/n region is shown. The mass templates were obtained with the data-driven approach. Figure 5 also shows the same data and templates but as a function of | M 10 | ; this visualization has the virtue of improved clarity for the 10 Be evidence.
Finally, it is important to note that the results of this data-driven approach are identical, by construction, even applying an arbitrary/overall scaling of the mass values. For this reason, the results obtained by data-driven analysis are quite solid regarding possible rigidity/velocity scale miscalibrations that could prevent the traditional MC-based analysis, as shown in [9]. As a practical example, we applied the data-driven analysis to events measured by PAMELA calorimeter (Figure 4 of [9]), and without a tuned Monte Carlo model/calibration for the d E / d x measurement, no less.

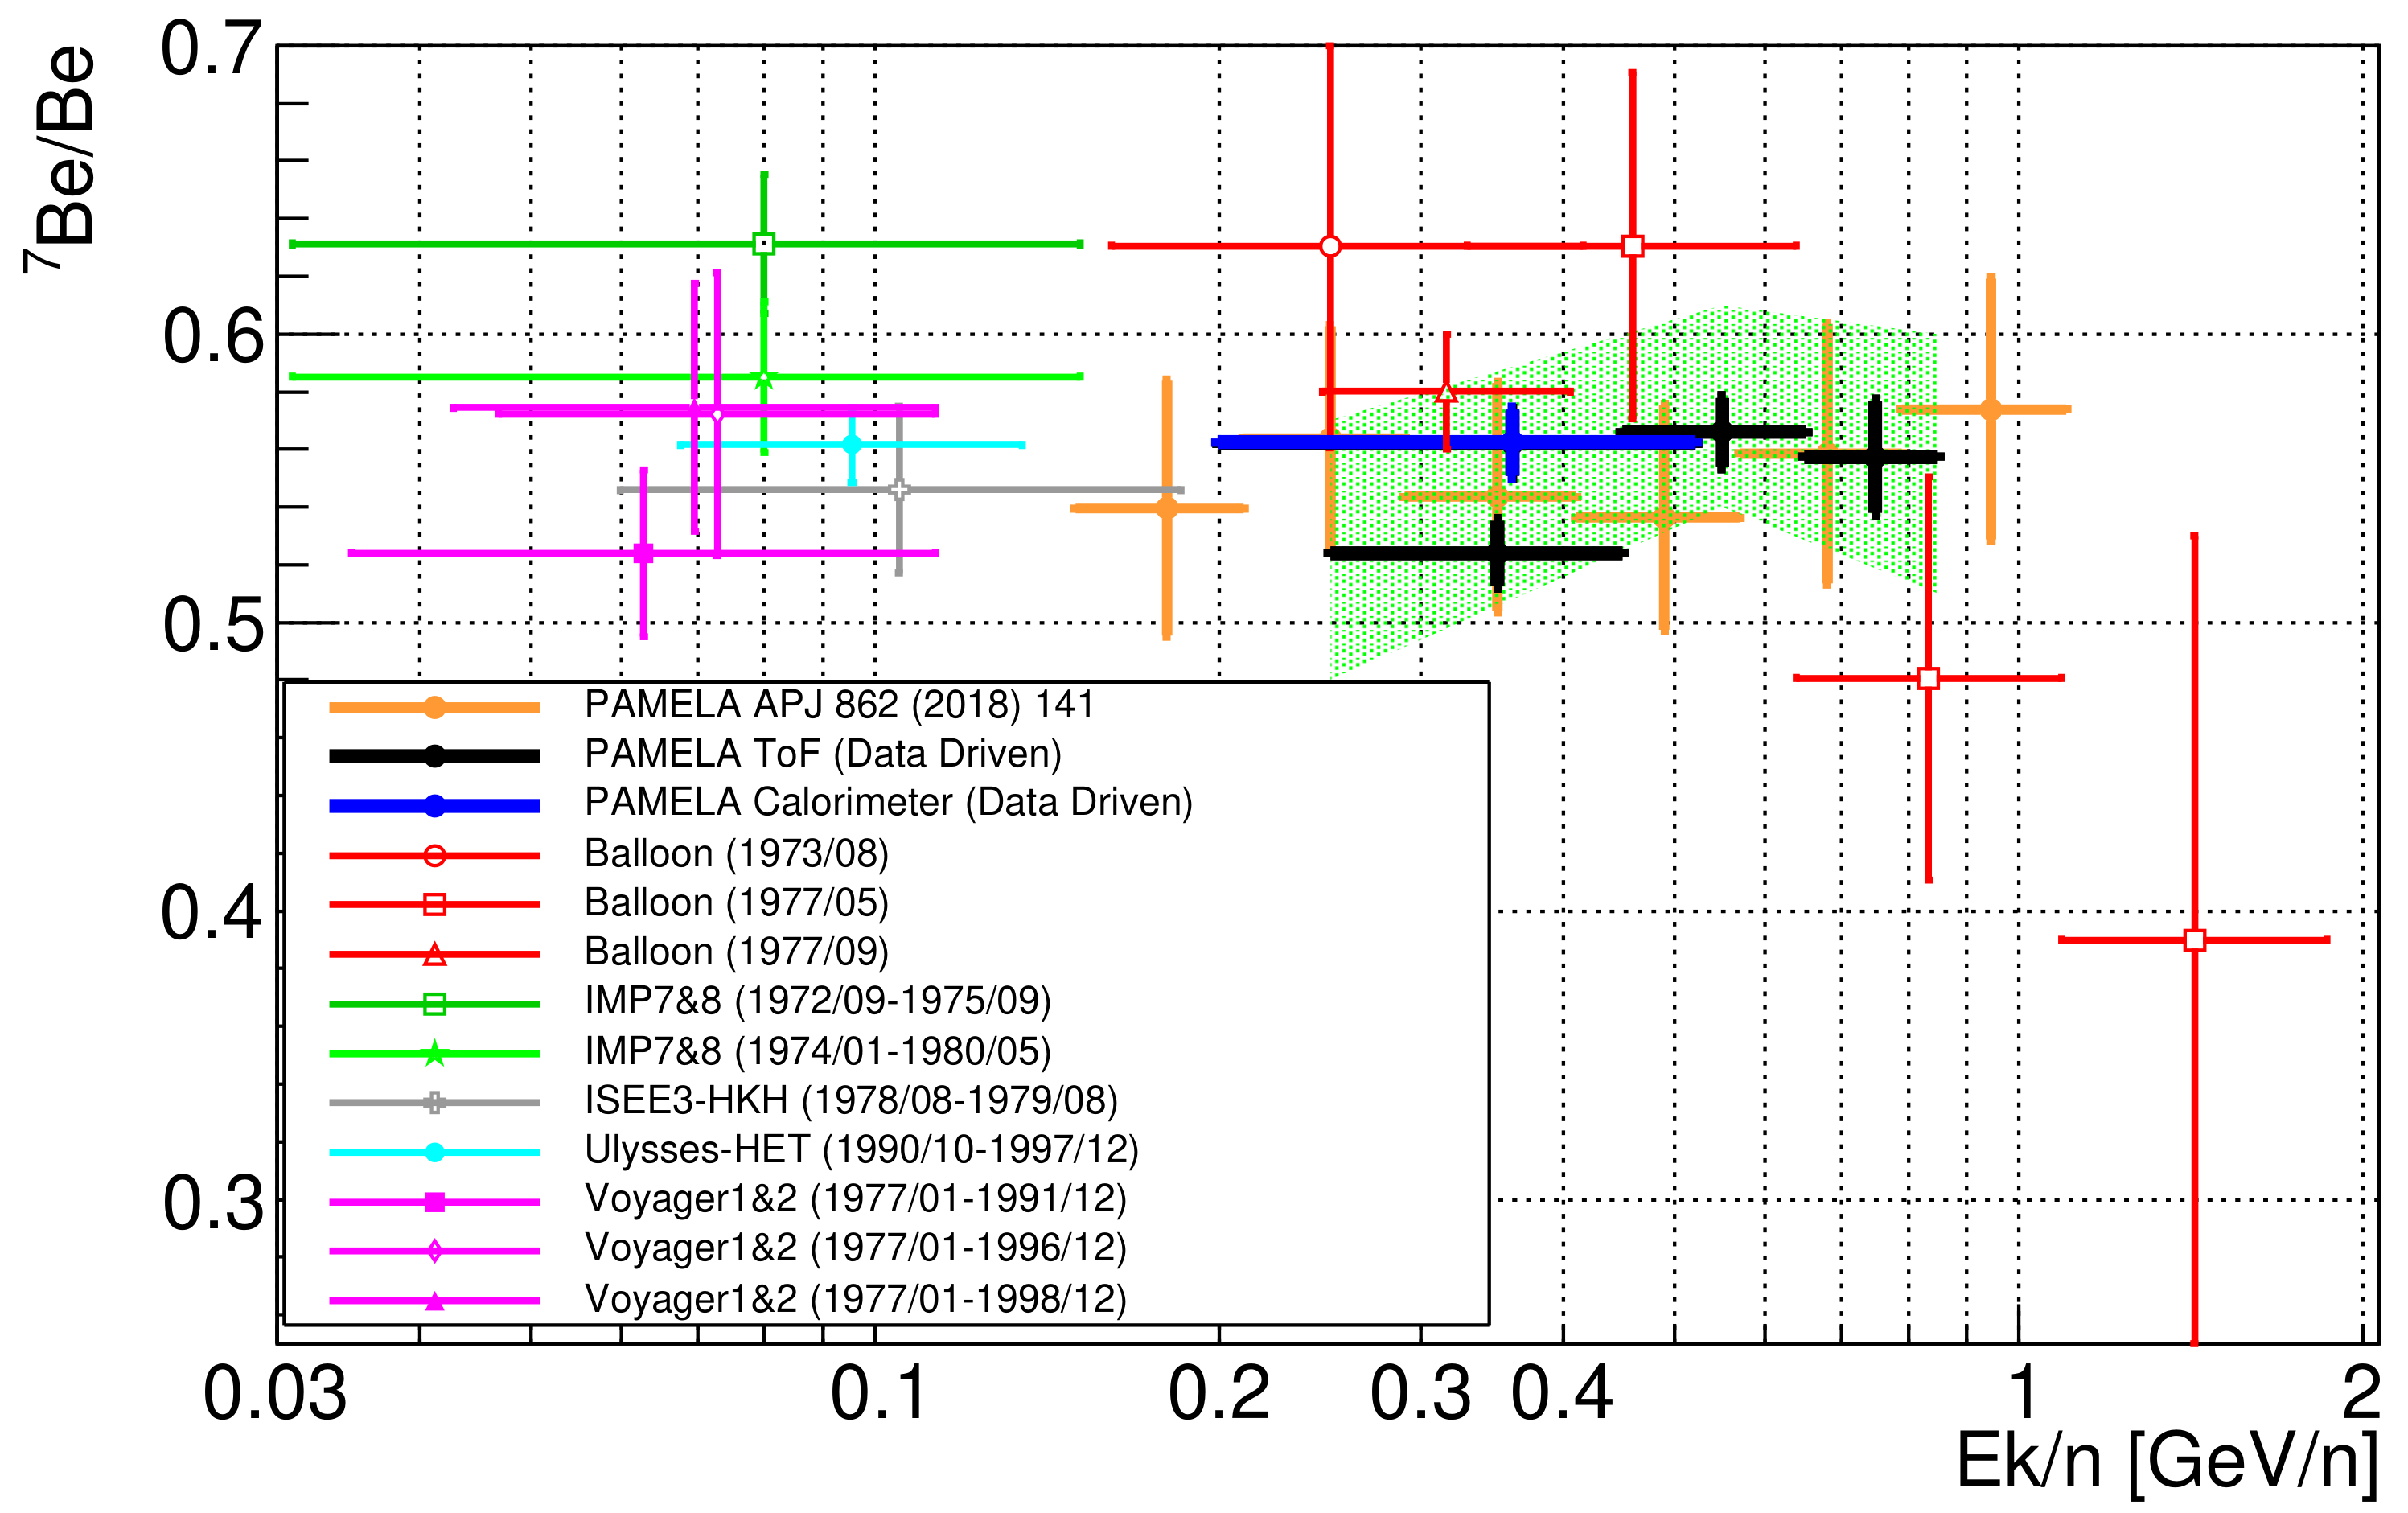
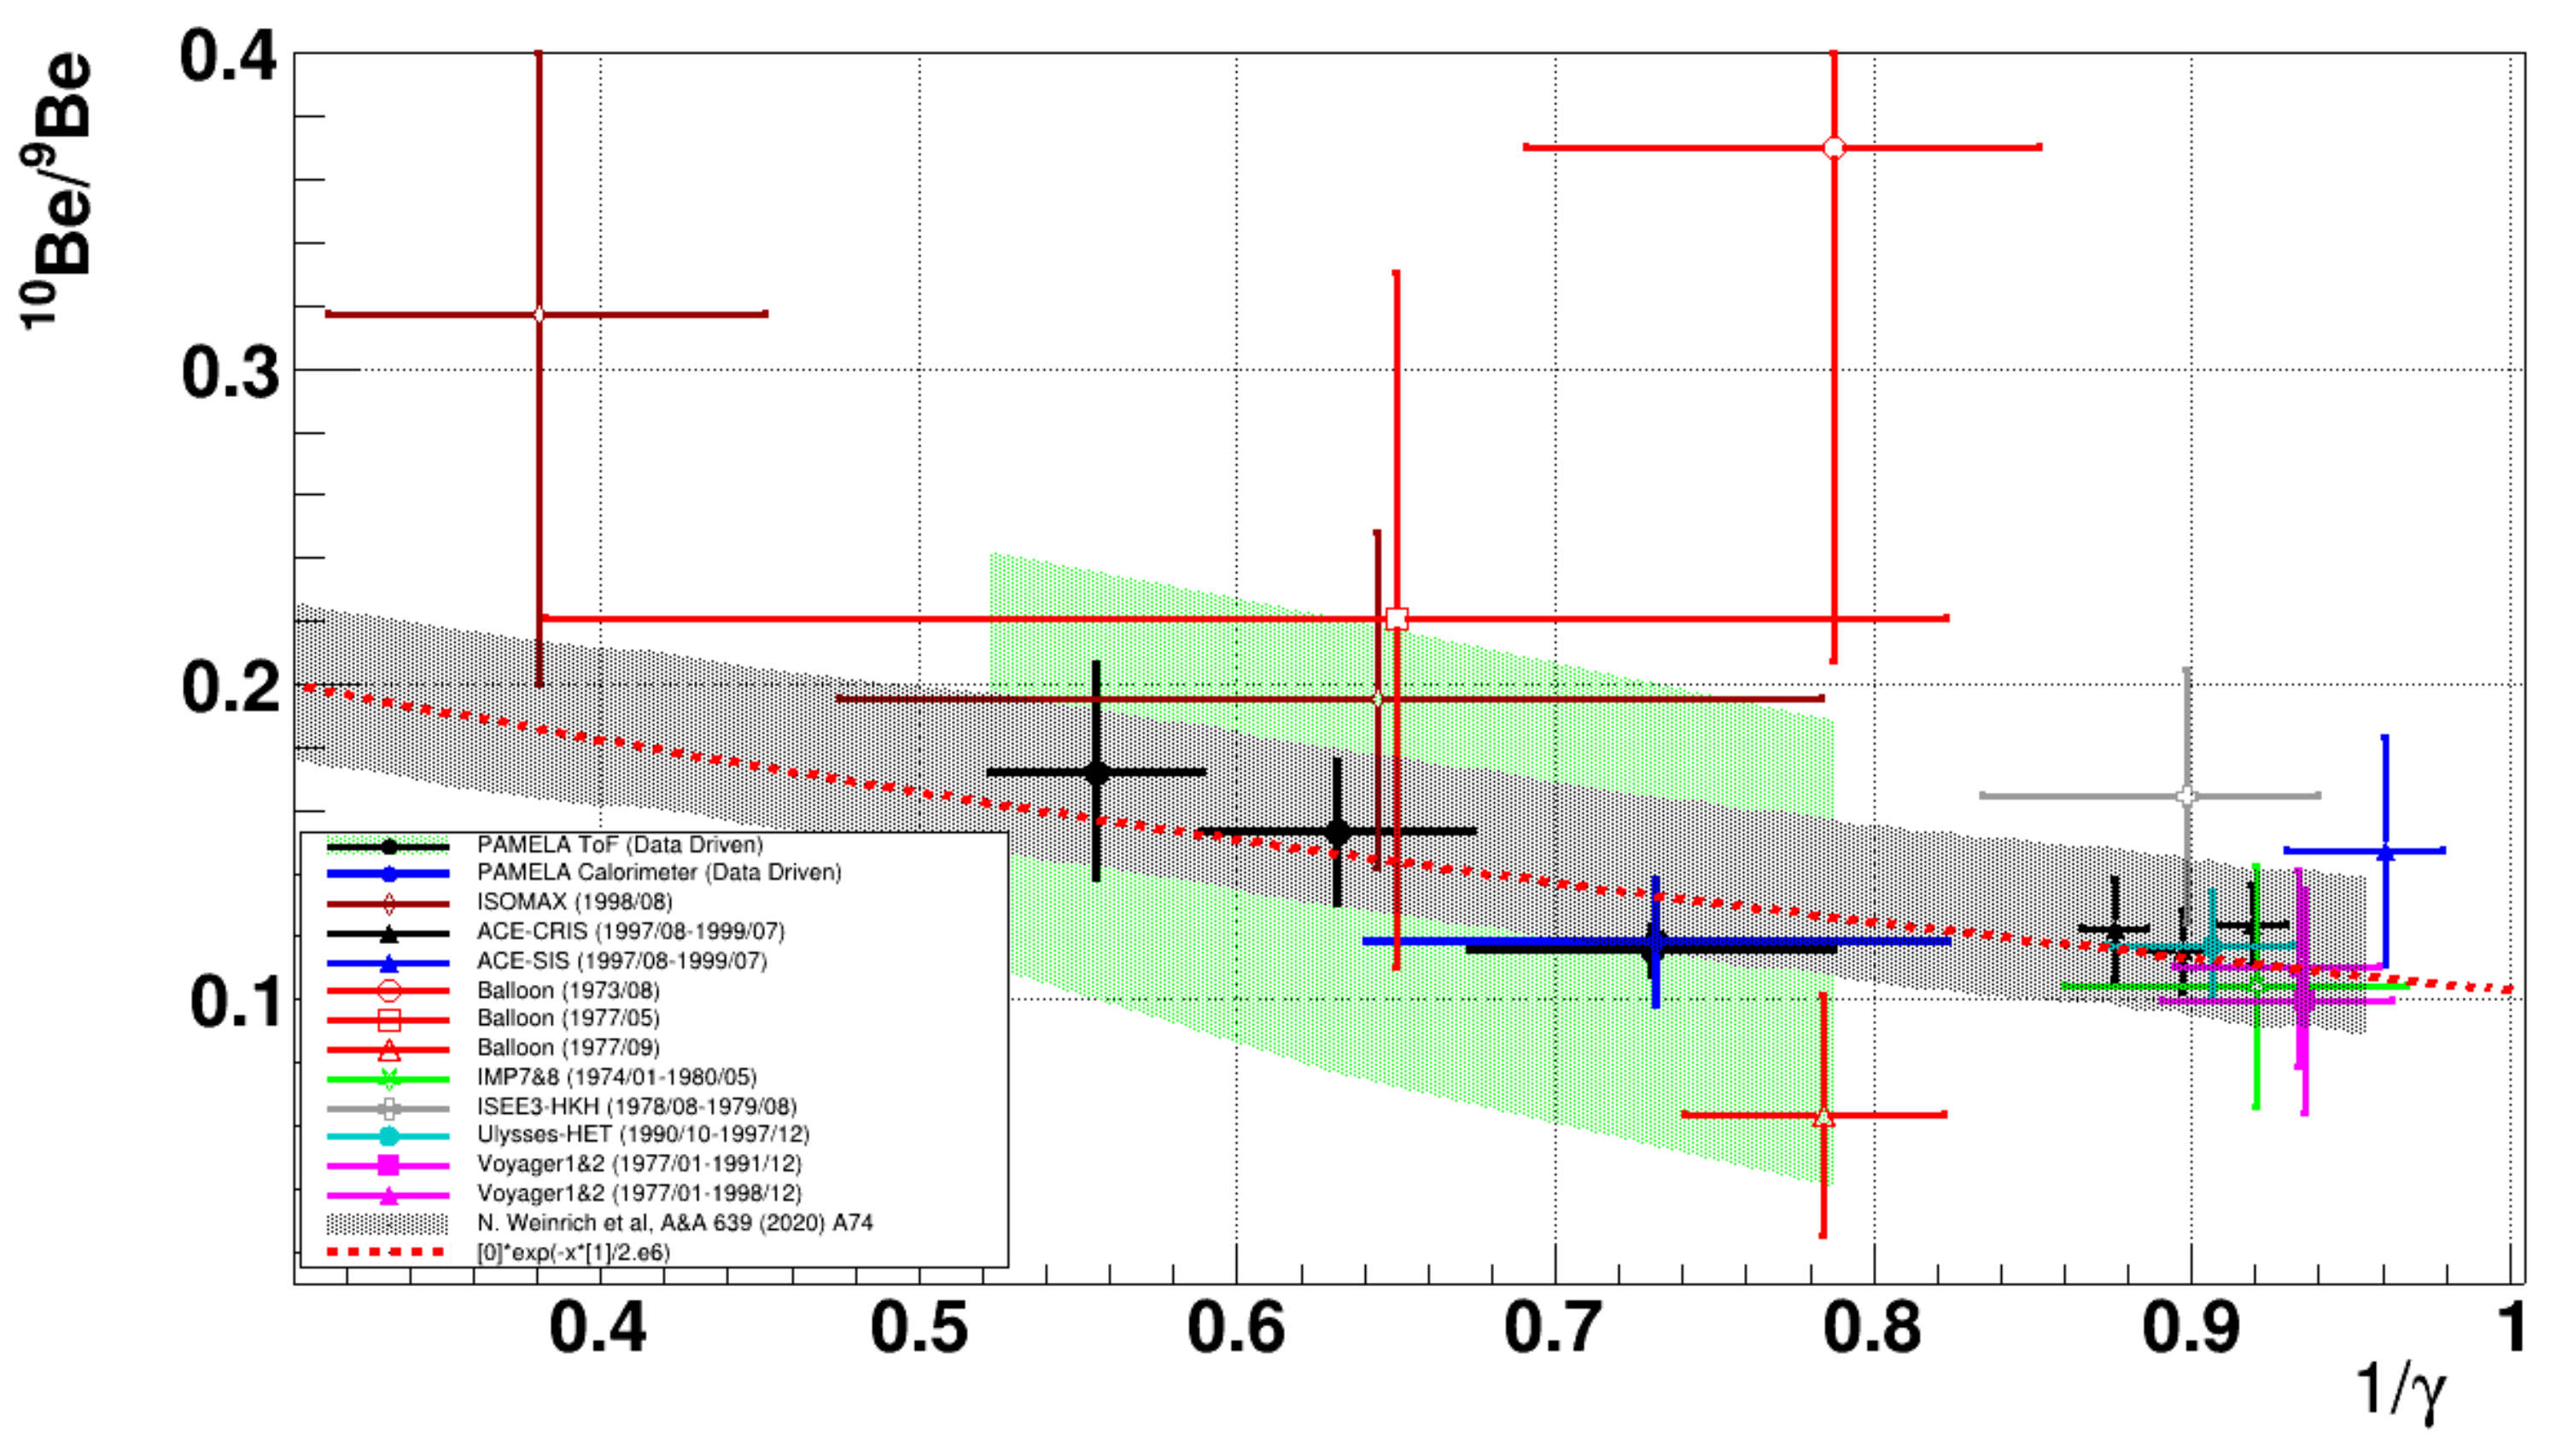
4. Results and Discussion

The results of the data-driven analysis of 7 Li/ 6 Li, 7 Be/Be and 10 Be/ 9 Be ratios applied to PAMELA data [9] are reported in Table 1 and shown in Figure 6, Figure 7 and Figure 8 along with previous experiment measurements [12,13,14,15,16,17,18,19,20,21,22,23,24].
The data-driven measurements obtained by analyzing PAMELA-ToF events (black dots) are in reasonable agreement with the measurements obtained with the PAMELA calorimeter (blue square); and regarding 7 Li/ 6 Li and 7 Be/Be, the results of the data-driven analysis are in agreement with the ones published in [9] based on the Monte Carlo template fit of the PAMELA data (orange dots). The green shaded regions in Figure 6, Figure 7 and Figure 8 are conservative estimations of the systematic errors for the data-driven analysis, related to the possible departures from the assumption of pure template scaling, thereby considering δ M/M = K (1 ± α M ) where K is a constant and α M is a possible, small isotope dependent correction. In particular, knowing the measured PAMELA rigidity resolution [25] in the considered 1.5–4 GV range, and knowing that, for a fixed velocity, the rigidity of 7 Be is 70% of the rigidity of 10 Be, a conservative upper limit of α M < 10% can be inferred for the possible departures from the exact template scaling relation. A complete evaluation of systematic uncertainties requires a study of the possible differences in the selection acceptance for 7 Be, 9 Be and 10 Be as well, and of the different types of contamination due to B, C, N and O fragmentation crossing the material above the detector. These systematics cannot be estimated without a Monte Carlo simulation of the detector; however, their contributions are expected to be small (a few percent) with respect to the wide uncertainties plotted in Figure 7 and Figure 8. Similar arguments also hold for the 7 Li/ 6 Li flux ratio measurements.
The new information provided by the data-driven analysis, when applied to PAMELA data, is a relatively precise estimation of 10 Be/ 9 Be ratio in the range 0.2–0.85 GeV/n, where existing measurements are scarce and affected by large uncertainties. In particular, it is interesting to note that these measurements strengthen the previous indications for a rising 10 Be/ 9 Be ratio at high kinetic energy and are in good agreement with the models of [1,2,4,5], which provided predictions of 10 Be/ 9 Be tuned with the up-to-date AMS-02 fluxes (and previous 10 Be/ 9 Be measurements).
In Figure 8, the comparison of the 10 Be/ 9 Be flux ratio with the expectations for different values of the H parameter in the model [1] (dashed lines) confirms the current knowledge for this parameter in the range 3–8 kpc.
To further study the capability of current measurements of 10 Be/ 9 Be to act as a radioactive clock providing information about cosmic ray propagation time in the galaxy, we plotted in Figure 9 the existing 10 Be/ 9 Be data as a function of the inverse of the relativistic Lorentz factor, γ . This representation allows a simple and minimal phenomenological model to quantify the energy dependence of the 10 Be/ 9 Be ratio:
10 B e 9 B e = A e T γ τ
where τ = 2 My is the lifetime of 10 Be radioactive decay at rest, and the two parameters A and T can be viewed, respectively, as the average 10 Be/ 9 Be ratio produced by the primary cosmic ray collisions and the average propagation time. It is important to remember that Equation (9) is a crude but simple model; other effects not related to cosmic ray propagation time could contribute to the energy dependence of 10 Be/ 9 Be as—for example, the existence of an underdense bubble in the local interstellar medium [26].
The fit of the existing measurements with the simple model of Equation (9) is drawn as a dashed line in Figure 9 and provides A = 0.27 ± 0.13 and T = 1.9 ± 1.1 My. Removing the PAMELA data from this fit would increase the uncertainty of T by 30%; moreover, the uncertainty of A would be more than double.
In conclusion, PAMELA information on the 10 Be/ 9 Be ratio provided by the data-driven approach is important for the study of cosmic ray propagation. Future precision measurements are expected from the forthcoming results of AMS-02 and HELIX experiments.

Author Contributions

Conceptualization, F.N.; methodology, F.N.; software, F.N. and C.C.; validation, F.N. and C.C.; formal analysis, F.N.; investigation, F.N.; data curation, C.C.; writing—original draft preparation, F.N.; writing—review and editing, F.N. and C.C.; visualization, F.N. and C.C.; supervision, F.N.; All authors have read and agreed to the published version of the manuscript.

Funding

This research received no external funding.

Institutional Review Board Statement

Not applicable.

Informed Consent Statement

Not applicable.

Conflicts of Interest

The authors declare no conflict of interest.

References

  1. Evoli, C.; Morlino, G.; Blasi, P.; Aloisio, R. AMS-02 beryllium data and its implication for cosmic ray transport. Phys. Rev. D 2020, 101, 023013. [Google Scholar] [CrossRef] [Green Version]
  2. Feng, J.; Tomassetti, N.; Oliva, A. Bayesian analysis of spatial-dependent cosmic-ray propagation: Astrophysical background of antiprotons and positrons. Phys. Rev. D 2016, 94, 123007. [Google Scholar] [CrossRef] [Green Version]
  3. Korsmeier, M.; Cuoco, A. Galactic cosmic-ray propagation in the light of AMS-02: Analysis of protons, helium, and antiprotons. Phys. Rev. D 2016, 94, 123019. [Google Scholar] [CrossRef] [Green Version]
  4. Weinrich, N.; Boudaud, M.; Derome, L.; Génolini, Y.; Lavalle, J.; Maurin, D.; Salati, P.; Serpico, P.; Weymann-Despres, G. Galactic halo size in the light of recent AMS-02 data. Astron. Astrophys. 2020, 639, A74. [Google Scholar] [CrossRef]
  5. Luque, P.D.L.T.; Mazziotta, M.; Loparco, F.; Gargano, F.; Serini, D. Implications of current nuclear cross sections on secondary cosmic rays with the upcoming DRAGON2 code. J. Cosmol. Astropart. Phys. 2021, 2021, 099. [Google Scholar] [CrossRef]
  6. Webber, W.R.; Soutoul, A. A Study of the Surviving Fraction of the Cosmic-Ray Radioactive Decay Isotopes 10Be,26Al,36Cl and 54Mn as a Function of Energy Using the Charge Ratios Be/B, Al/Mg, Cl/Ar, and Mn/Fe Measured on HEAO 3. Astrophys. J. 1998, 506, 335–340. [Google Scholar] [CrossRef]
  7. Tomassetti, N. Examination of uncertainties in nuclear data for cosmic ray physics with the AMS experiment. Phys. Rev. C 2015, 92, 045808. [Google Scholar] [CrossRef] [Green Version]
  8. Tomassetti, N. Solar and nuclear physics uncertainties in cosmic-ray propagation. Phys. Rev. D 2017, 96, 103005. [Google Scholar] [CrossRef] [Green Version]
  9. Menn, W.; Bogomolov, E.A.; Simon, M.; Vasilyev, G.; Adriani, O.; Barbarino, G.C.; Bazilevskaya, G.A.; Bellotti, R.; Boezio, M.; Bongi, M.; et al. Lithium and Beryllium Isotopes with the PAMELA Experiment. Astrophys. J. 2018, 862, 141. [Google Scholar] [CrossRef]
  10. Aguilar, M.; Cavasonza, L.A.; Ambrosi, G.; Arruda, L.; Attig, N.; Bachlechner, A.; Plyaskin, V. Properties of Cosmic Helium Isotopes Measured by the Alpha Magnetic Spectrometer. Phys. Rev. Lett. 2019, 123, 181102. [Google Scholar] [CrossRef] [Green Version]
  11. Efron, B. Better Bootstrap Confidence Intervals. J. Am. Stat. Assoc. 1987, 82, 171–185. [Google Scholar] [CrossRef]
  12. Yanasak, N.E.; Wiedenbeck, M.E.; Mewaldt, R.A.; Davis, A.J.; Cummings, A.C.; George, J.S.; Leske, R.A.; Stone, E.C.; Christian, E.R.; von Rosenvinge, T.T.; et al. Measurement of the Secondary Radionuclides 10Be, 26Al, 36Cl, 54Mn, and 14C and Implications for the Galactic Cosmic-Ray Age. Astrophys. J. 2001, 563, 768–792. [Google Scholar] [CrossRef] [Green Version]
  13. Hagen, F.A.; Fisher, A.J.; Ormes, J.F. Be-10 abundance and the age of cosmic rays—A balloon measurement. Astrophys. J. 1977, 212, 262–277. [Google Scholar] [CrossRef]
  14. Buffington, A.; Orth, C.D.; Mast, T.S. A measurement of cosmic-ray beryllium isotopes from 200 to 1500 MeV per nucleon. Astrophys. J. 1978, 226, 355–371. [Google Scholar] [CrossRef]
  15. Webber, W.R.; Kish, J. Further Studies of the Isotopic Composition of Cosmic Ray Li, Be and B Nuclei—Implications for the Cosmic Ray Age; ICRC: Kyoto, Japan, 1979; Volume 1, p. 389. [Google Scholar]
  16. Garcia-Munoz, M.; Mason, G.M.; Simpson, J.A. The age of the galactic cosmic rays derived from the abundance of Be-10. Astrophys. J. 1977, 217, 859–877. [Google Scholar] [CrossRef]
  17. Garcia-Munoz, M.; Simpson, J.A.; Wefel, J.P. The Propagation Lifetime of Galactic Cosmic Rays Determined from the Measurement of the Beryllium Isotopes; ICRC: Paris, France, 1981; Volume 2, pp. 72–75. [Google Scholar]
  18. Wiedenbeck, M.E.; Greiner, D.E. A cosmic-ray age based on the abundance of Be-10. Astrophys. J. 1980, 239, L139–L142. [Google Scholar] [CrossRef]
  19. Hams, T.; Barbier, L.M.; Bremerich, M.; Christian, E.R.; de Nolfo, G.A.; Geier, S.; Göbel, H.; Gupta, S.K.; Hof, M.; Menn, W.; et al. Measurement of the Abundance of Radioactive 10Be and Other Light Isotopes in Cosmic Radiation up to 2 GeV Nucleon−1 with the Balloon-borne Instrument ISOMAX. Astrophys. J. 2004, 611, 892–905. [Google Scholar] [CrossRef] [Green Version]
  20. Connell, J.J. Galactic Cosmic-Ray Confinement Time: ULYSSES High Energy Telescope Measurements of the Secondary Radionuclide 10Be. Astrophys. J. 1998, 501, L59. [Google Scholar] [CrossRef]
  21. Lukasiak, A.; Ferrando, P.; McDonald, F.B.; Webber, W.R. The isotopic composition of cosmic-ray beryllium and its implication for the cosmic ray’s age. Astrophys. J. 1994, 423, 426–431. [Google Scholar] [CrossRef]
  22. Lukasiak, A.; McDonald, F.B.; Webber, W.R. Voyager Measurements of the Isotopic Composition of Li, Be and B Nuclei; ICRC: Durban, South Africa, 1997; Volume 3, p. 389. [Google Scholar]
  23. Lukasiak, A. Voyager Measurements of the Charge and Isotopic Composition of Cosmic Ray Li, Be and B Nuclei and Implications for Their Production in the Galaxy; ICRC: Salt Lake City, UT, USA, 1999; Volume 3, p. 41. [Google Scholar]
  24. Aguilar, M.; Alcaraz, J.; Allaby, J.; Alpat, B.; Ambrosi, G.; Anderhub, H.; Ao, L.; Arefiev, A.; Arruda, L.; Azzarello, P.; et al. Isotopic composition of light nuclei in cosmic rays: Results from AMS-01. Astrophys. J. 2011, 736, 105. [Google Scholar] [CrossRef]
  25. Straulino, S.; Adriani, O.; Bonechi, L.; Bongi, M.; Castellini, G.; D’Alessandro, R.; Gabbanini, A.; Grandi, M.; Papini, P.; Ricciarini, S.; et al. The PAMELA silicon tracker. Nucl. Instrum. Methods Phys. Res. Sect. Accel. Spectrometers Detect. Assoc. Equip. 2004, 530, 168–172. [Google Scholar] [CrossRef]
  26. Donato, F.; Maurin, D.; Taillet, R. Radioactive cosmic rays in a diffusion model: Test for a local bubble? Astron. Astrophys. 2002, 381, 539–559. [Google Scholar] [CrossRef]
Figure 1. Scheme of the PAMELA detector. The spectrometer is 1.3 m high; the 0.43T permanent magnet is equipped with a silicon microstrip Tracker that provides rigidity up to 1TV and dE/dx information. A time of flight (ToF) detector, made of three pairs of plastic scintillators, can measure the velocity and charge of the particle. At its bottom, a silicon-tungsten imaging Calorimeter is able to provide a redundant β evaluation, for sub-relativistic particles, via dE/dx measurement.
Universe 07 00183 g001
Figure 2. An example of lithium isotope measurements with the data-driven analysis of PAMELA-ToF data collected in the 0.25–0.75 GeV/n range.
Universe 07 00183 g002
Figure 3. χ 2 configurations obtained by data-driven analysis for lithium events collected by PAMELA-ToF in the 0.25–0.75 GeV/n region (black line). The best-fit probability distribution obtained by statistical bootstrap is shown for comparison (blue histogram).
Universe 07 00183 g003
Figure 4. A map of χ 2 configurations for beryllium events collected by PAMELA-ToF in the 0.65–0.85 GeV/n region. The 68% confidence interval is shown as a red dashed contour.
Universe 07 00183 g004
Figure 5. An example of beryllium isotope measurements with the data-driven analysis of PAMELA-ToF data collected in the 0.65–0.85 GeV/n range. The black continuous line is the sum of the three beryllium components. In the bottom plot the same data are shown as a function of | M 10 | l this allows one to stack the 10 Be contribution (blue filled) over the 7 Be + 9 Be (red filled).
Universe 07 00183 g005
Figure 6. Results of the data-driven measurement of the 7 Li/ 6 Li ratio compared with previous experimental results and with a Monte Carlo based analysis of PAMELA [9] (orange dots). The green shaded contour is the systematic uncertainty inferred for the data-driven analysis.
Universe 07 00183 g006
Figure 7. Results of the data-driven measurement of the 7 Be/Be fraction compared with previous experimental results and with a Monte Carlo based analysis of PAMELA [9] (orange dots). The green shaded contour is the systematic uncertainty inferred for the data-driven analysis.
Universe 07 00183 g007
Figure 8. Results of the data-driven measurement of the 10 Be/ 9 Be ratio compared with previous experimental results and theory expectations: [1] (dashed lines) and [4] (hatched region). The green shaded contour is the systematic uncertainty inferred for the data-driven analysis.
Universe 07 00183 g008
Figure 9. Measurements of the 10 Be/ 9 Be flux ratio as a function of 1 / γ . The dashed line is a phenomenological exponential fit. The new measurements obtained by the Pamela experiment using this data-driven approach strengthen the experimental indications of the expected 1 / γ behavior.
Universe 07 00183 g009
Table 1. Results of the data-driven analysis applied to PAMELA Li and Be events.
E k /n [GeV/n] 7 Li/ 6 Li
0.15–0.35 (Calo)0.95 ± 0.03 ± 0.2
0.35–0.75 (Calo)0.94 ± 0.03 ± 0.25
0.15–0.35 (ToF)0.96 ± 0.03 ± 0.2
0.35–0.75 (ToF)0.88 ± 0.04 ± 0.25
E k /n [GeV/n] 7 Be/Be 10 Be/ 9 Be
0.2–0.52 (Calo)0.56 ± 0.01 ± 0.030.12 ± 0.02 ± 0.07
0.25–0.45 (ToF)0.53 ± 0.01 ± 0.030.115 ± 0.01 ± 0.07
0.45–0.65 (ToF)0.56 ± 0.01 ± 0.0350.15 ± 0.02 ± 0.07
0.65–0.85 (ToF)0.56 ± 0.02 ± 0.040.17 ± 0.03 ± 0.07
Publisher’s Note: MDPI stays neutral with regard to jurisdictional claims in published maps and institutional affiliations.

