1. Introduction
The formation of current sheets with high concentration of magnetic energy in spatially separated regions of magnetized plasma and the possibility of a rapid release of energy via magnetic reconnection have been intensively studied over the past decades. According to modern concepts, the dynamics of current sheets provide a basis for various flare-type phenomena including Solar flares and flares on other stars, substorms in the magnetospheres of the Earth and other planets, and disruption instability in tokamak plasma [
1,
2,
3,
4,
5].
Along with the theoretical research, the dynamics of current sheets and magnetic reconnection are studied in dedicated laboratory experiments. These experiments, among other factors, can provide laboratory modeling of non-stationary astrophysical phenomena [
6,
7,
8,
9,
10,
11,
12]. Laboratory experiments are carried under highly controlled and reproducible conditions and use modern methods of plasma diagnostics, which allows for the relation of plasma dynamics to the evolution of magnetic fields, currents, and electrodynamic forces in current sheets [
11,
12,
13,
14,
15,
16].
The initial conditions for the formation of current sheets in laboratory experiments can be established within a relatively wide range, therefore providing the current sheets of different structures, much like the current sheets in natural conditions (for example, in the Earth’s magnetosphere). In particular, by changing the mass of ions in plasma, we can bring about changes in both the relative thickness of the sheet and the role of the Hall effect in plasma dynamics [
14,
15]. In plasma with heavy ions, we obtain “thin” sub-ionic current sheets with a thickness of the order of the ion inertial length. In the lighter-ions plasma, “thick” current sheets are usually formed with a thickness exceeding several times the ion inertial length [
14,
15,
17].
Magnetic energy accumulated in the vicinity of the metastable current sheet can be transformed into thermal energy and into the energy of high-speed flows of plasma [
18,
19,
20]. Plasma is accelerated along the surface of the current sheet mainly under the action of the Ampère forces that are initially directed from the central region of the sheet to its edges on both sides [
11,
21]. In some cases, plasma acceleration can be spatially inhomogeneous in the normal direction to the sheet, and higher acceleration can be at some distance from the middle plane of the sheet, in regions of low plasma density [
11,
22,
23].
Accelerated plasma flows along the current sheet surface can result in exciting the reverse currents at the sheet edges. This effect can significantly change the dynamic processes in the current sheets, including the process of plasma acceleration [
24].
This paper is focused on the experimental research of plasma dynamics in current sheets produced in helium plasma in two-dimensional magnetic fields with a null line of the X-type. The basic parameters of plasma and current sheets were obtained by spectroscopic methods and magnetic measurements. The energy of accelerated plasma flows is correlated with the structure of electrodynamic forces at successive stages of the current sheet evolution. Of particular interest is the first registration of the reverse currents in current sheets formed in the helium plasma. Excitation of reverse currents gives rise to additional Ampère forces that slow down previously accelerated plasma flows.
2. Experimental Setup and Methods of Diagnostics
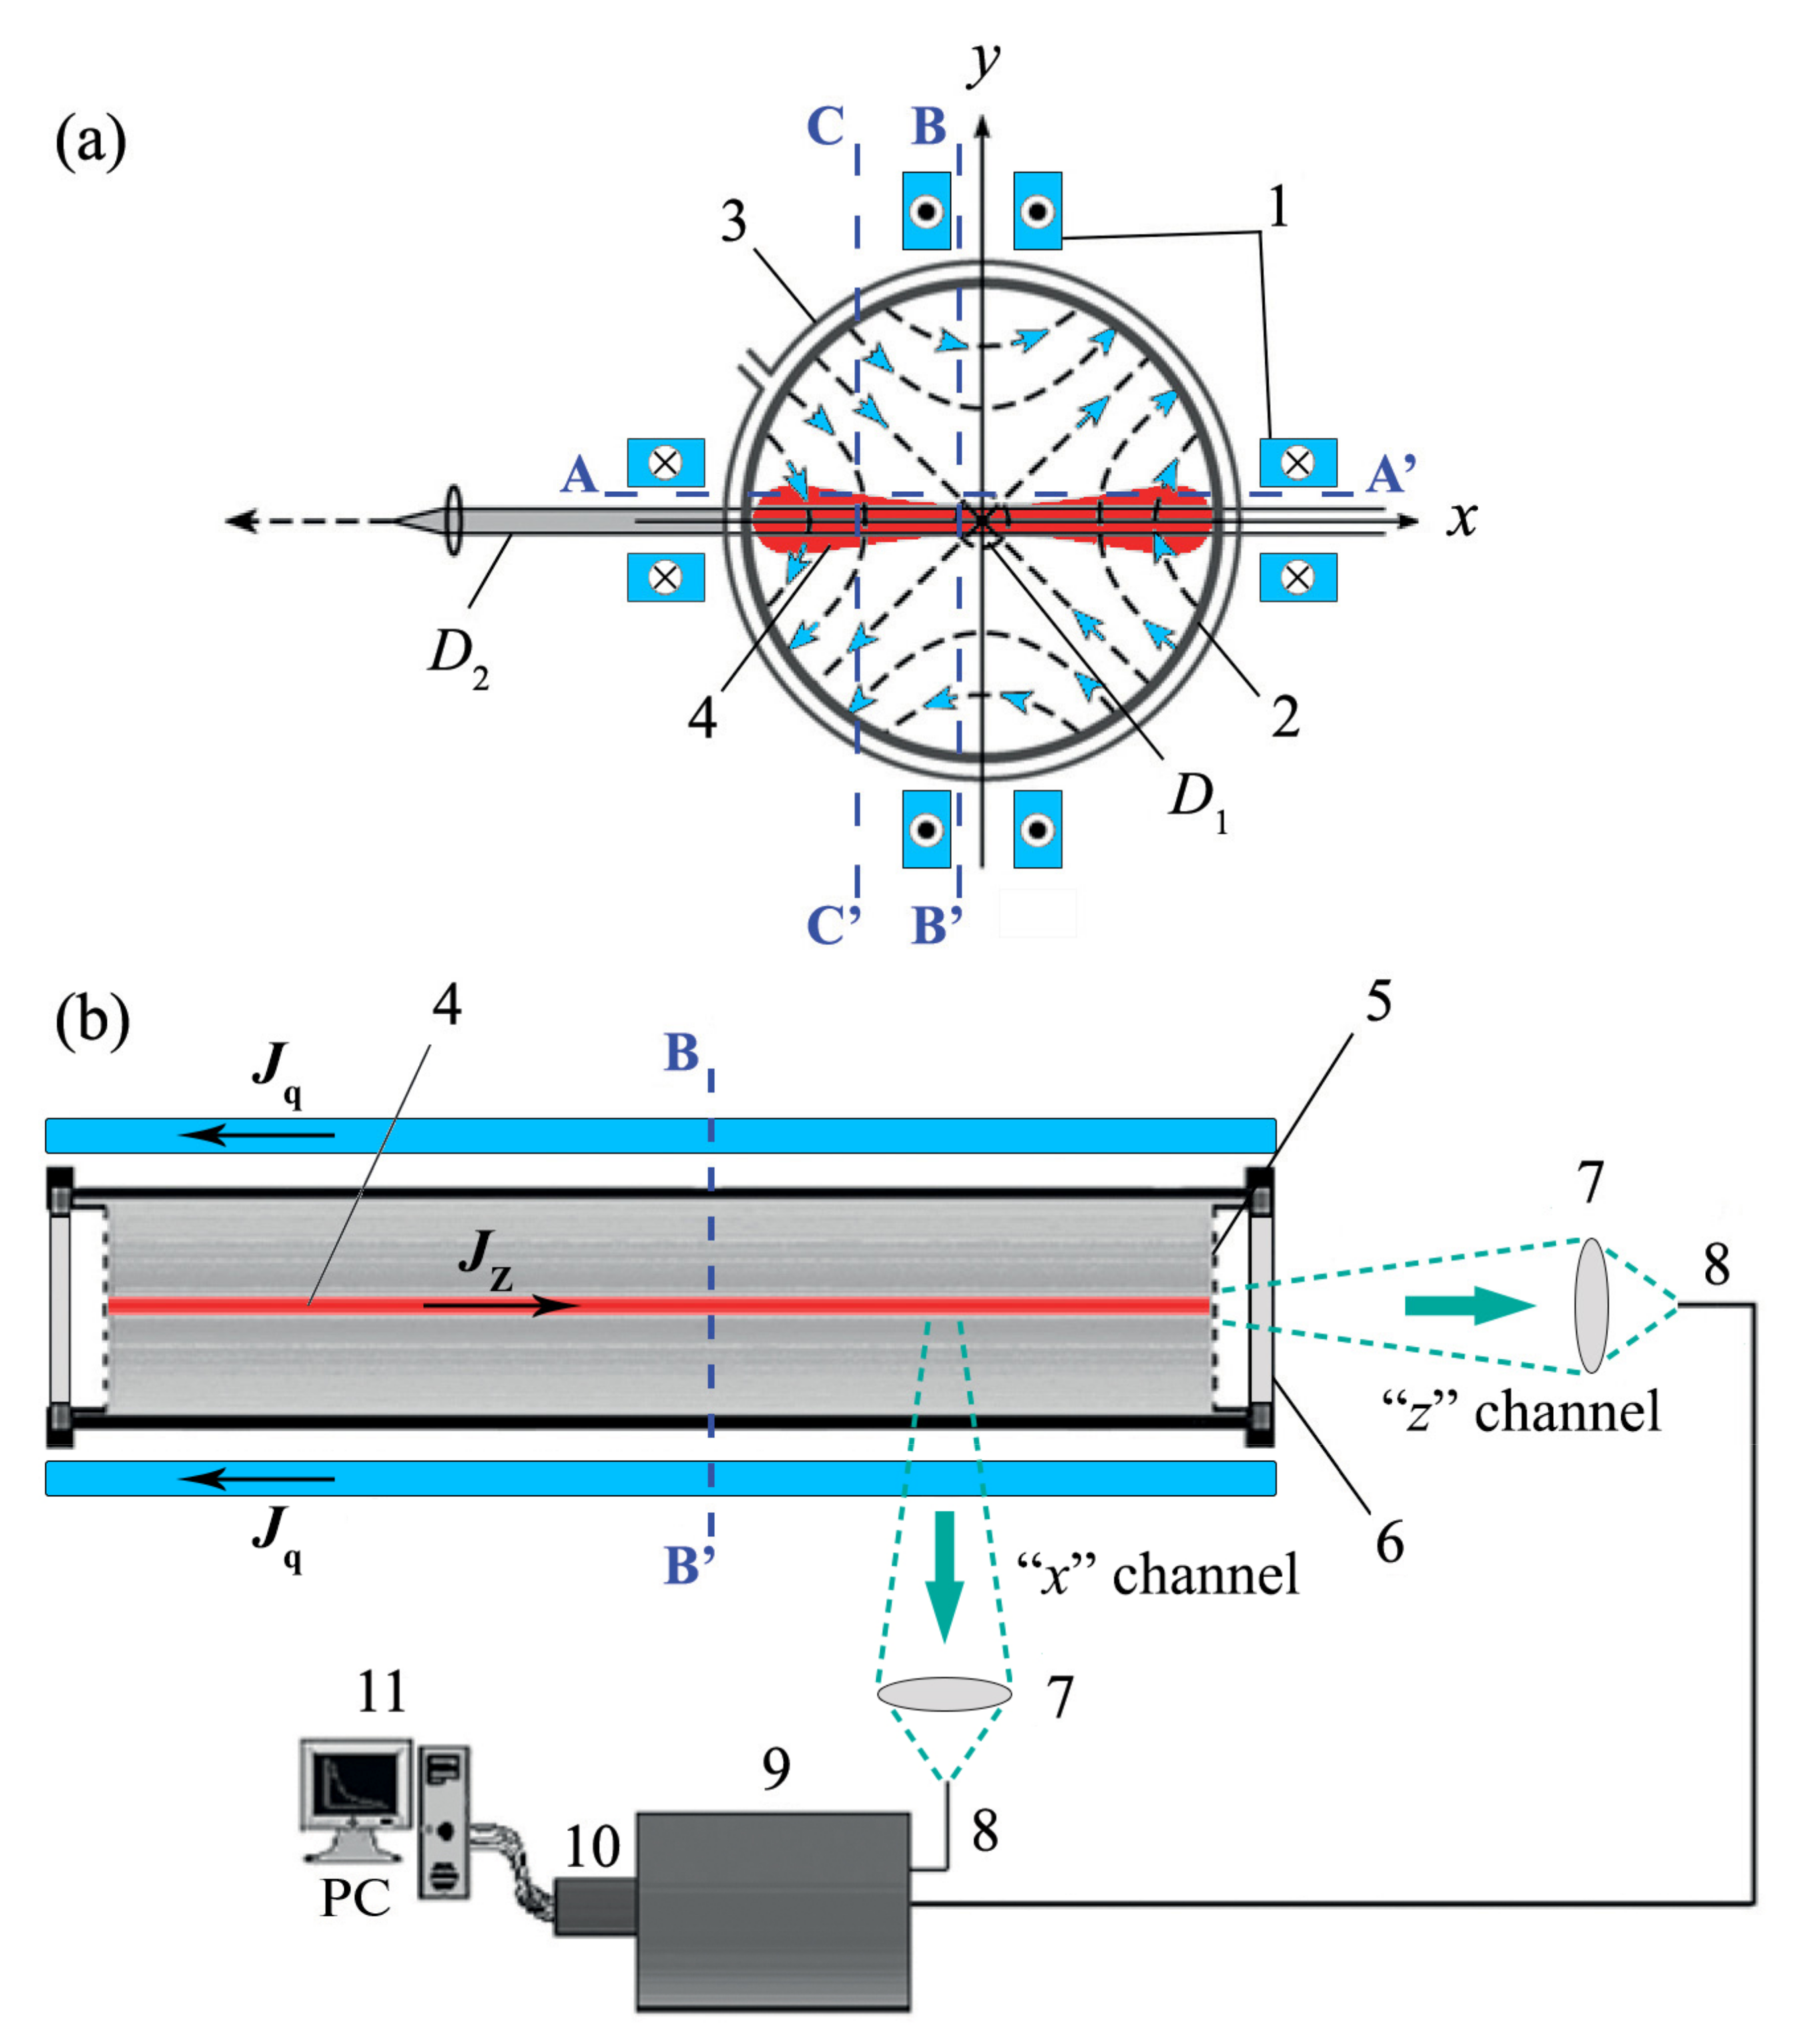
Plasma dynamics in the current sheets were studied with the experimental setup CS-3D (
Figure 1) [
7,
25,
26]. A quartz vacuum chamber (18 cm in diameter, 100 cm long) was filled with helium gas up to pressure of 320 mTorr. A system of straight current-carrying conductors placed outside the vacuum chamber excited a quasistationary 2D magnetic field with the null line of the X-type at the
z axis:
The null line was aligned with the chamber axis. The magnetic field gradient h in the xy-plane was established equal to 0.5 kG/cm. The initial plasma in the magnetic field (1) was produced using the Θ-discharge with strong preliminary ionization, and the initial plasma was almost homogeneous in the z direction. Then, the plasma current was excited by applying the impulsive voltage between two grid electrodes that were arranged at the chamber ends on the distance of Δz = 60 cm from each other. The time dependence of the plasma current was close to sinusoid, with the amplitude ≈ 45 kA and the half-period T/2 = 6.3 μs.
The current
initiated 2D plasma flows in the magnetic field
, and gave rise to the current sheet formation during the first 1–1.5 μs. The typical transverse sizes of the current sheet were: 2δ
x ≈ 12–17 cm (width) and 2δ
y ≈ 1.5–3.5 cm (thickness), at the level of
; here,
is the current density at the middle plane of the sheet [
27,
28]. The sheet length along the direction of the current was equal to Δz.
Plasma flows in the
xy-plane resulted in increasing the electron density in the middle plane of the current sheet. This density exceeded several times the densities of both the initial plasma and the surrounding plasma [
29,
30].
The velocities of the helium ions and the electron densities were obtained by registration of the profiles of two spectral lines: the He II 468.6 nm (the
n = 3 →
n = 2 transition,
) and the He II 320.3 nm (the
n = 4 →
n = 2 transition,
). Analyzing the spectral data, we took into account that the broadening of the He II
spectral line was caused by both the Doppler and Stark effects, while the broadening of the He II
line was due mainly to the Stark effect [
31,
32]. The difference between the constants of the Doppler and Stark broadenings of these spectral lines allowed for calculation of the plasma parameters in the sheet; for details see [
20,
33].
The optical part of the setup included two channels for simultaneous registration of plasma emission in two mutually perpendicular directions. In the “
z-channel,” the radiation was collected from the central quasi-cylindrical region D1 (Ø~1.5 cm), extended along the direction of the plasma current, shown in
Figure 1. This channel was used to determine the plasma density and the ions’ thermal velocities in the central region of the current sheet, since the directed plasma motions occur predominantly in the
xy-plane. The “
x-channel” collected the plasma radiation along the width of the current sheet (region D2, Ø~2.5 cm,
Figure 1). This channel was used to determine the ions’ velocities in the
x-direction and the plasma density, both averaged along the sheet width. Plasma emission from two channels was transmitted via the quartz light guides on the entrance slit of the monochromator MDR-3 (diffraction grating 1200 grooves/mm, inverse linear dispersion D = 1.3 nm/mm). The monochromator was completed with the Nanogate 1-UF programmed electro-optical detector. The profiles of the spectral lines were recorded in one pulse of the experimental setup with an integration time of ≈0.8 μs.
In order to investigate the magnetic fields of the current sheets, we recorded the time dependences of three mutually perpendicular components of the magnetic field measured by the system of magnetic probes. The probes could be moved in the
xy-plane either along the width of the current sheet, at a distance of ≈1.2 cm from the
x-axis (line AA’), or across the current sheet, at the distances of −0.8 cm and −5.0 cm from the
y-axis (lines BB’ and CC’, respectively). The measured data were then analyzed and processed to obtain the spatial distributions of the magnetic fields, current densities, and the Ampere forces [
11,
16,
21].
3. Evolution of Plasma Parameters in Current Sheets Formed in the Helium Plasma
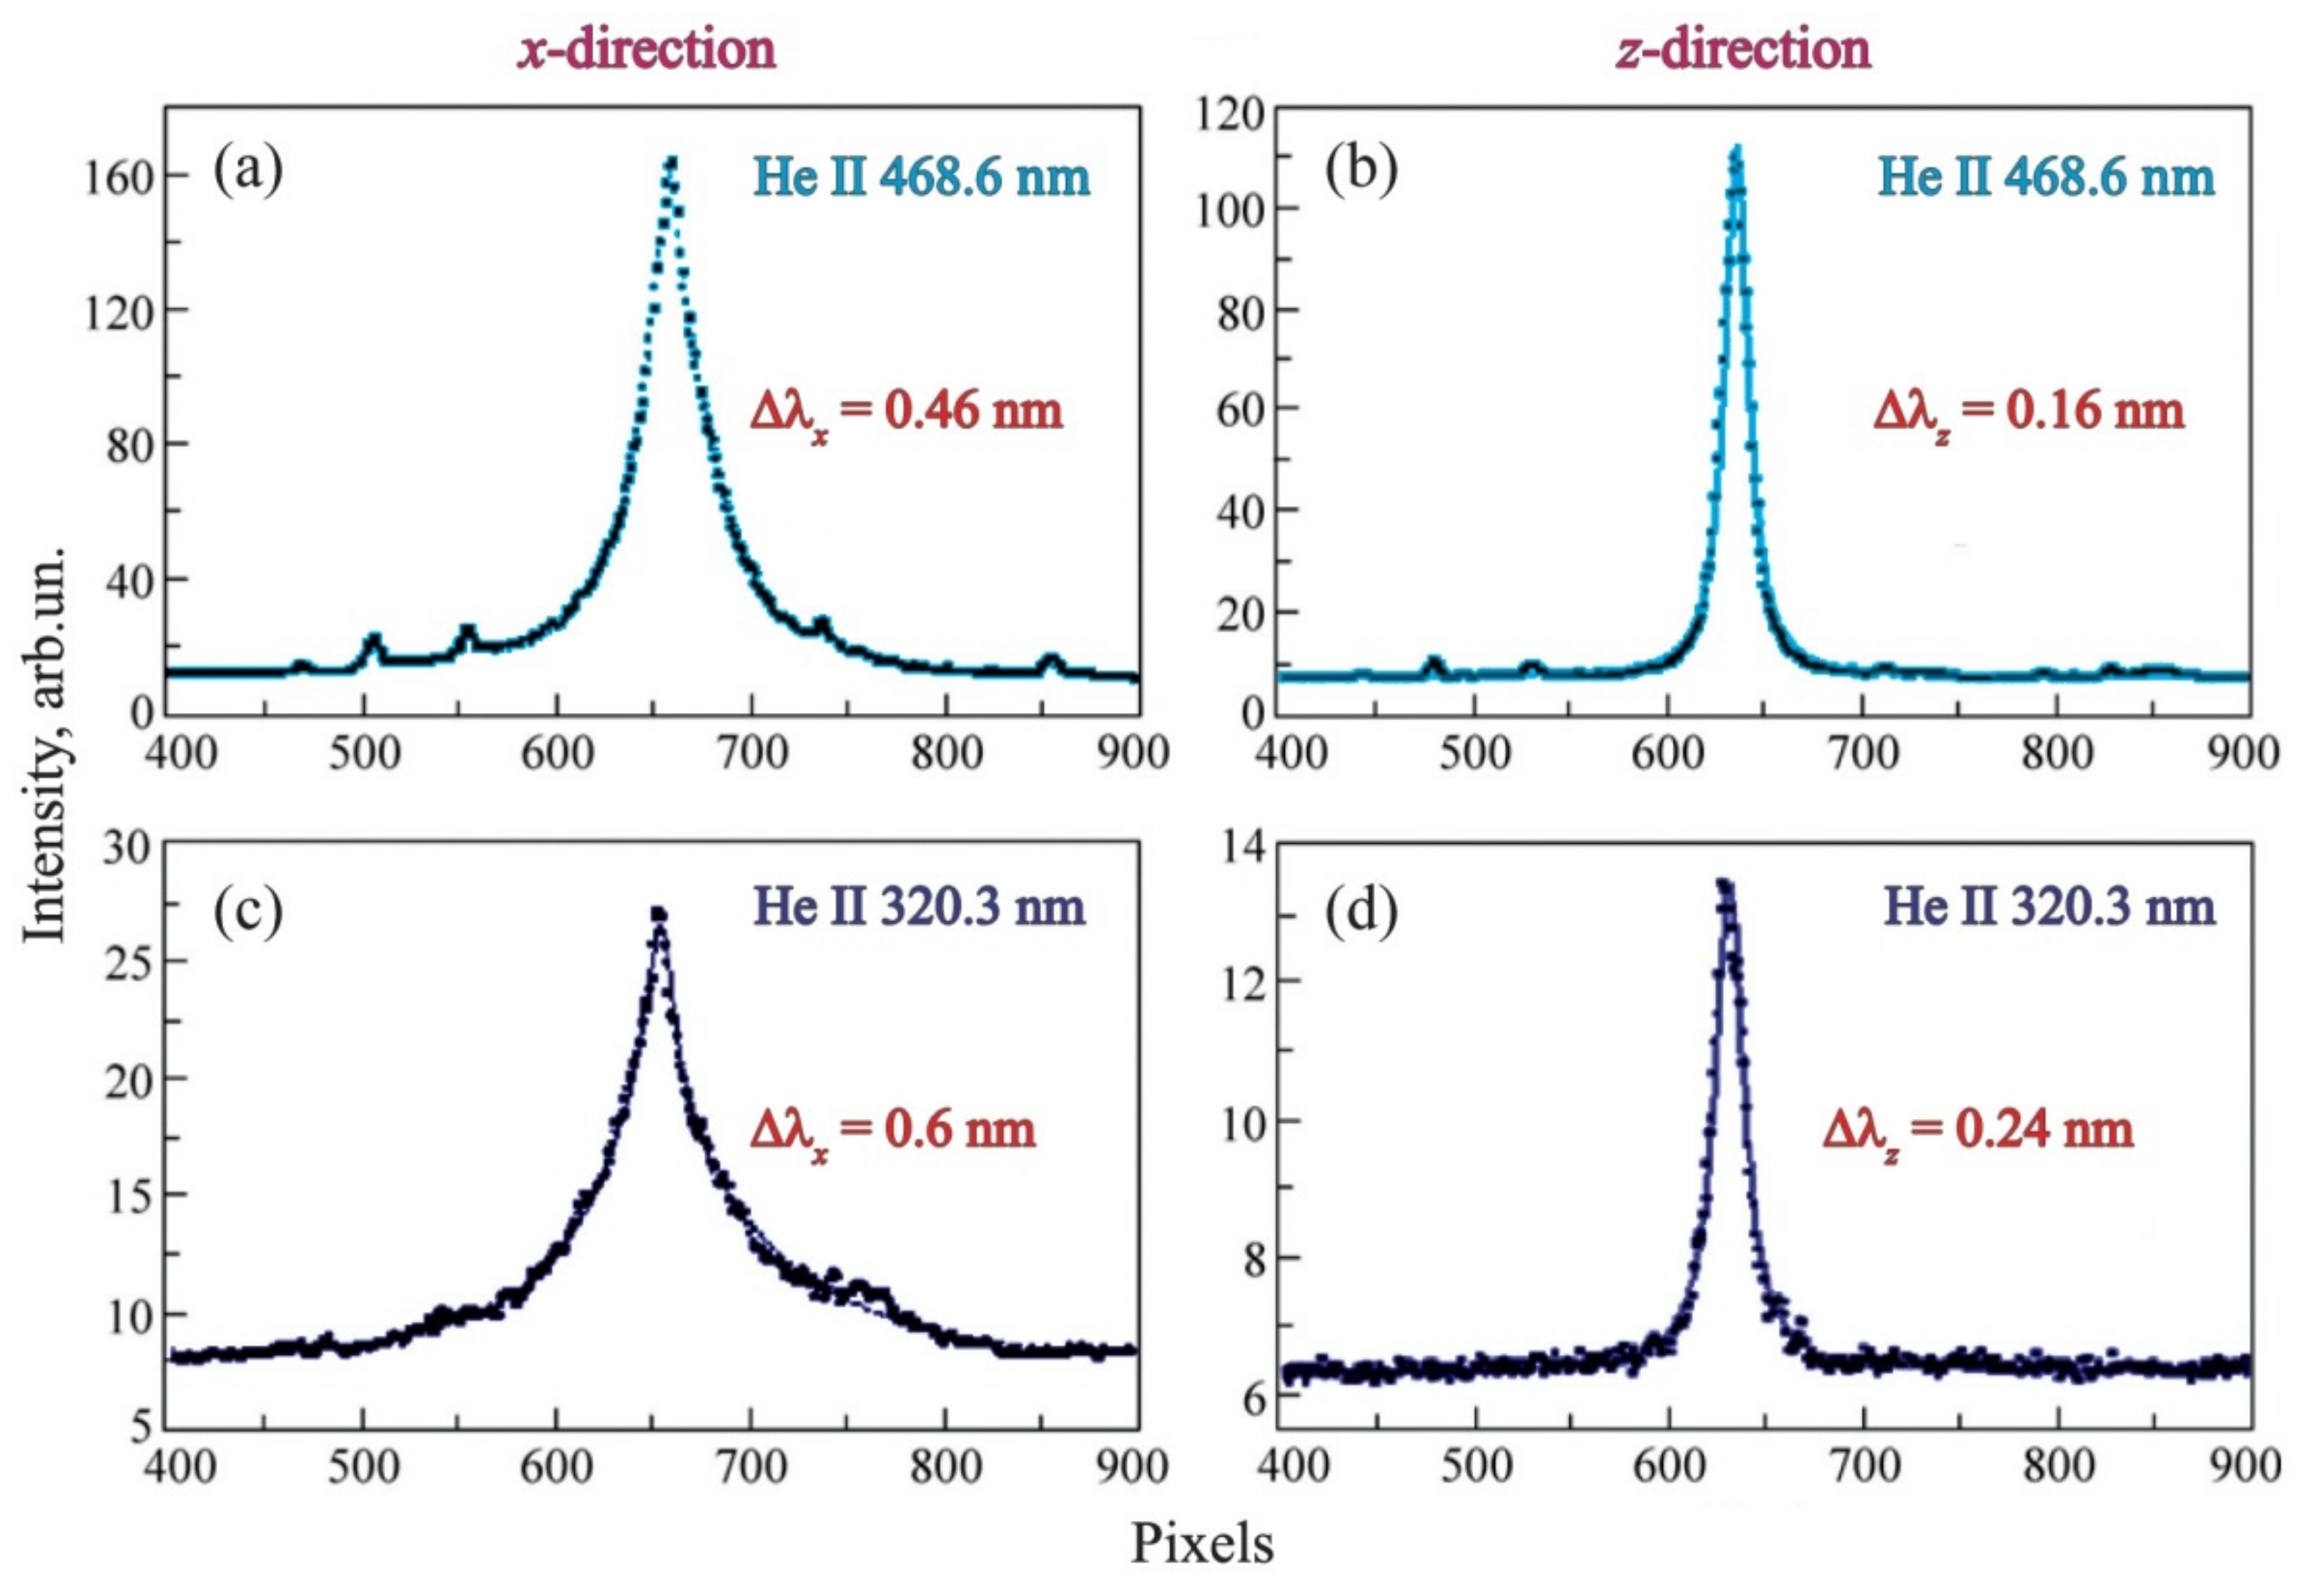
In the context of the presented research, one of the most important characteristics of the current sheet is the energy of plasma flows that are accelerated along the sheet width. The evolution of this energy, along with the evolution of the ion temperature and plasma density, was obtained by analyzing the profiles of the spectral lines: He II 468.6 nm and He II 320.3 nm. It was found that the broadenings of these lines registered in the
x-direction (
) were usually several times larger than the broadenings measured in the
z-direction (
) [
20,
33]. For example, at
t ≈ 3.3 μs, the ratio of the half-widths was
≈ 4 for the He II
line, and the same ratio was
≈ 3 for the He II
line at
t ≈ 4.3 μs (
Figure 2). The differences between
and
show that the values of both the ion velocities and plasma density measured in the
x-channel exceed the same parameters measured in the
z-channel.
The quantitative characteristics of the plasma parameters were derived from the experimental data with the use of the Stark constants for the spectral lines He II
[
34] and He II
[
35]; in this case, the calculations were carried out by the method of the successive approximations (for details see [
33]).
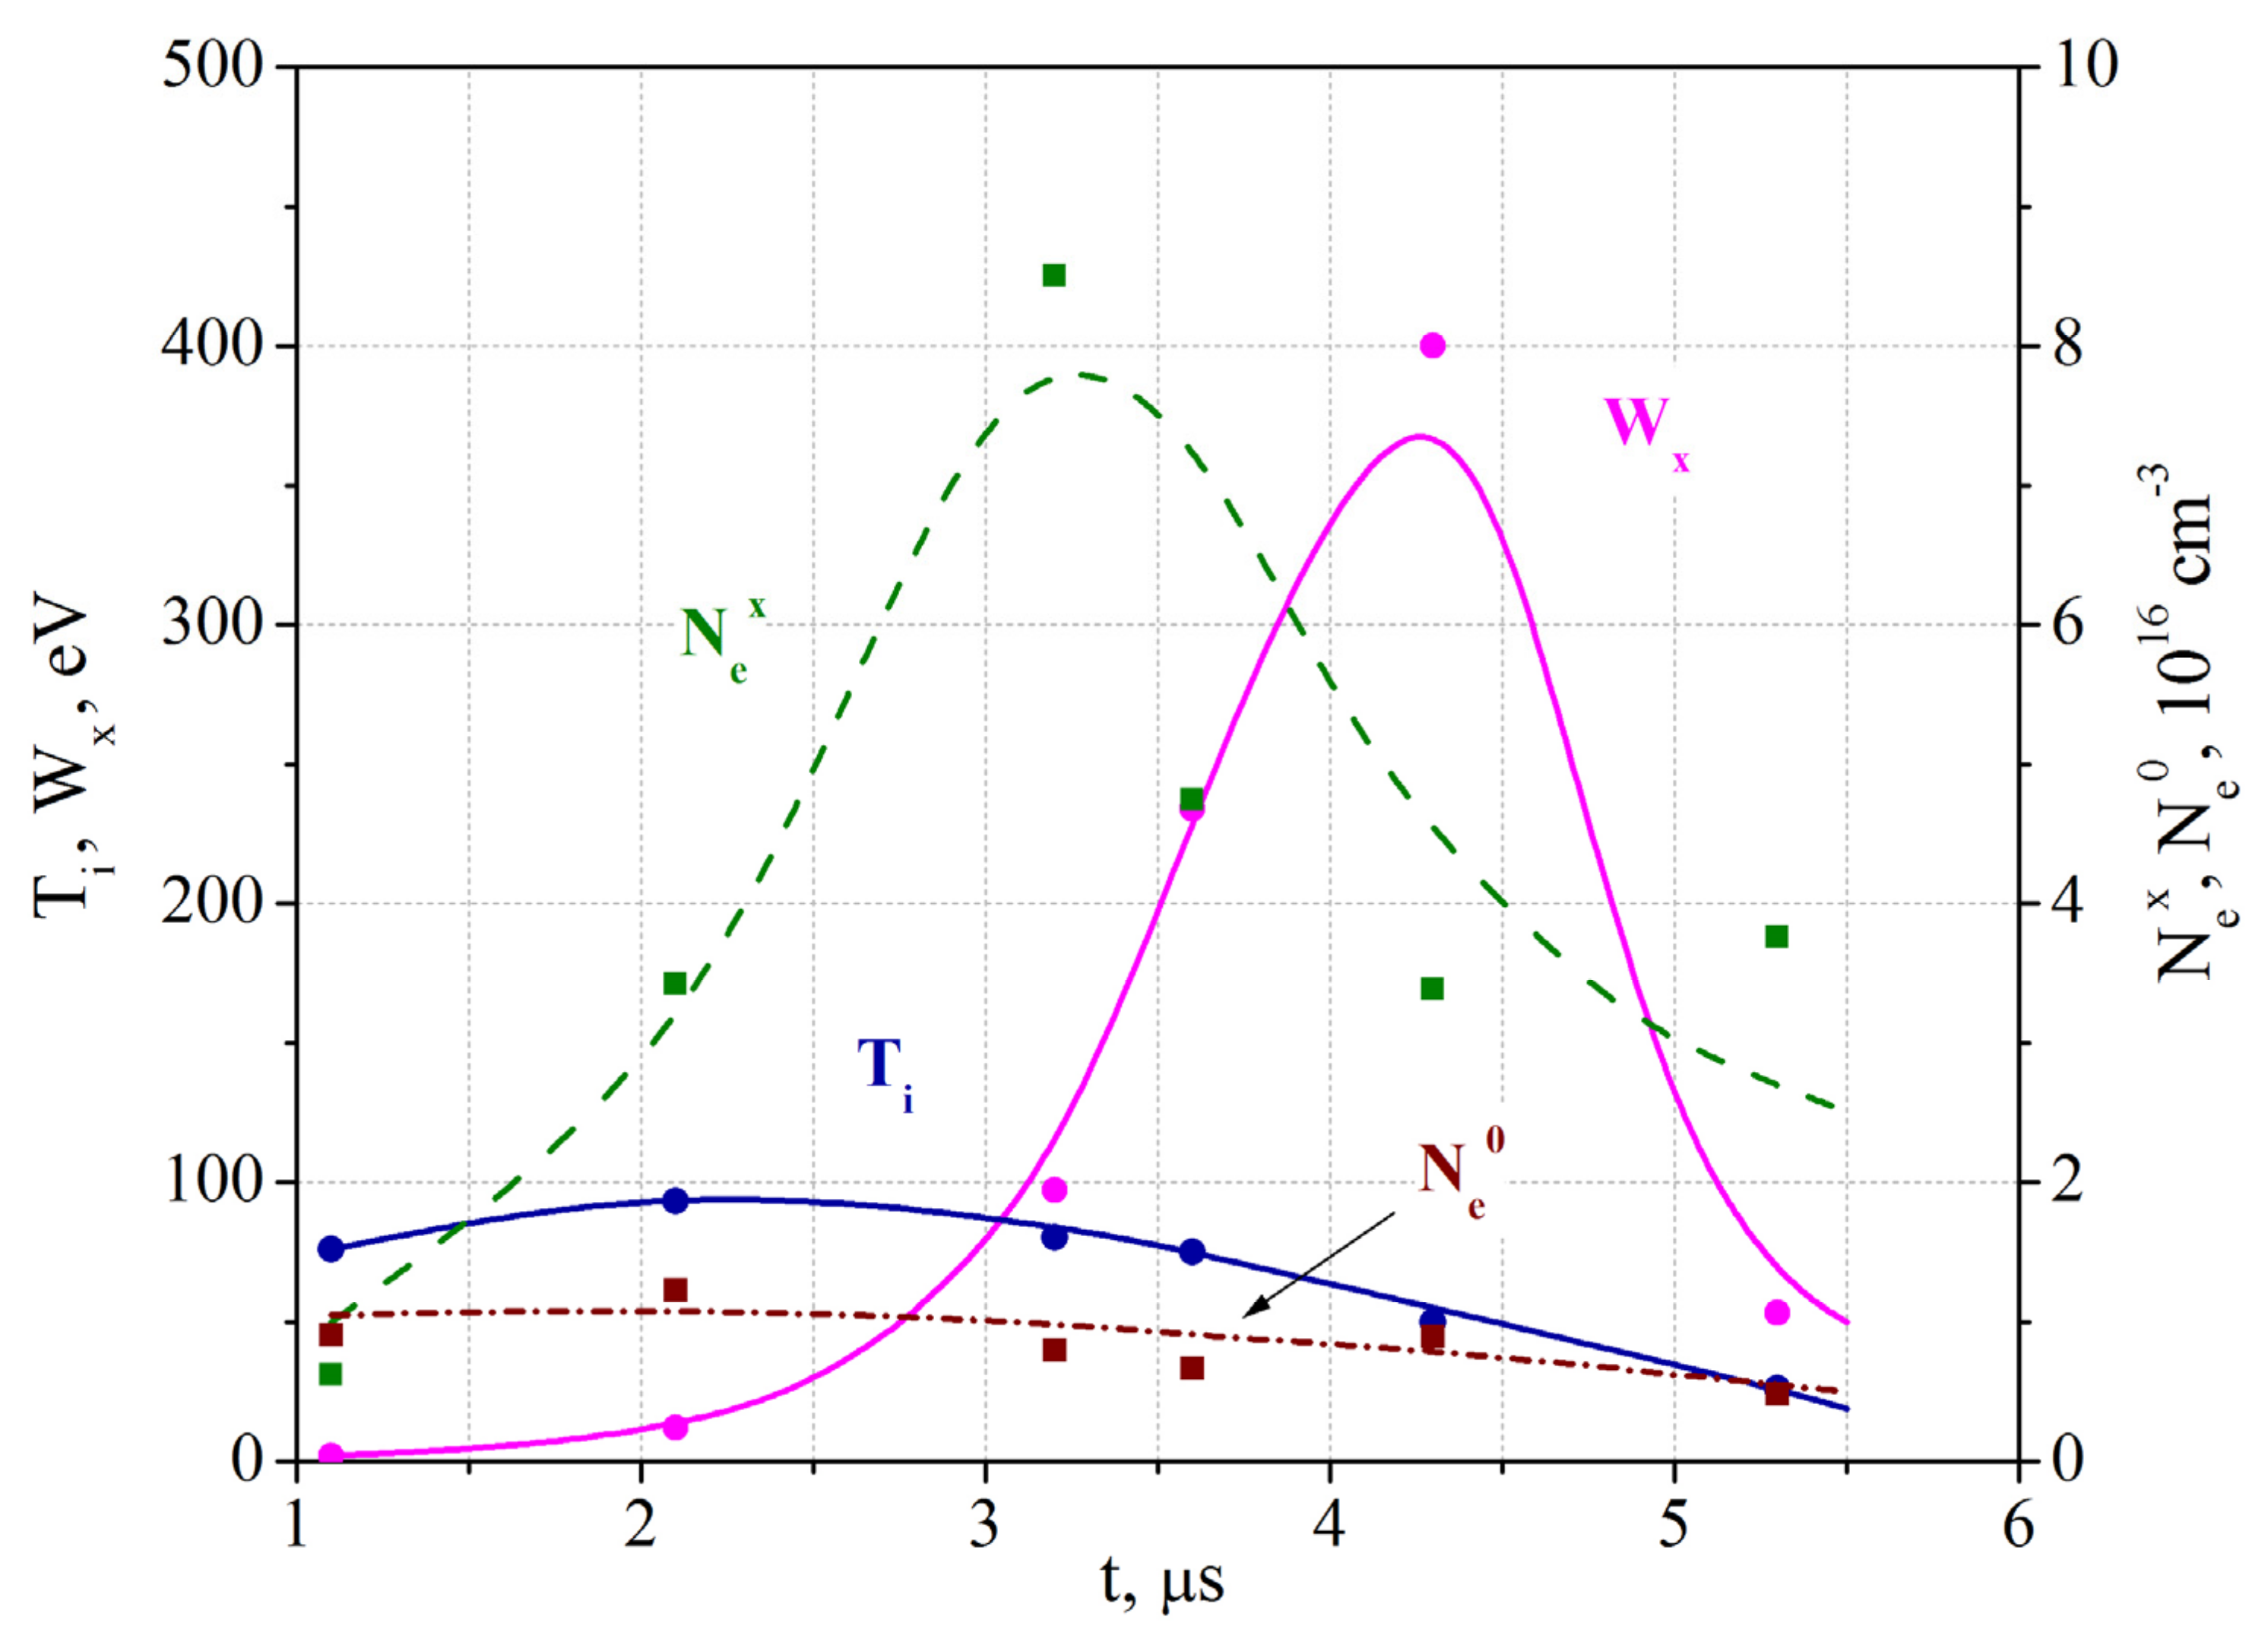
Figure 3 shows how plasma parameters change with time. The temperature
of the helium ions and the electron density
at the central region of the current sheet were calculated on the base of the data available from the
z-channel. The values of the ion energy and plasma density
calculated on the base of the
x-channel data were, as a rule, higher than
and
.
The revealed difference between the data from the
x- and
z-channels proves that helium ions receive an excess energy of directed motion along the width of the current sheet (along the
x-axis) [
20,
33]. We defined the energy of the directed ions’ motion
as the difference between the total ion energy measured by the
x-channel, and the ion thermal energy
measured by the
z-channel at the same time. We also associate the difference between plasma densities
and
with the plasma motion in the
x-direction: from the central region of the current sheet to its edges; see below.
One can see from the
Figure 3 that, at the early times (
t ≈ 1.2 µs), the electron density was practically uniform along the current sheet,
≈
≈
cm
, the ion temperature was
≈ 90 eV, and there were no plasma motions in the
x-direction:
≈ 0.
The energy started increasing after t ≈ 2.2 µs, and, at t ≈ 3.4 µs, became equal to the thermal energy: ≈ ≈ 100 eV. The corresponding average rate of the energy gain was ≈ 70 eV/µs. After this initial stage, the energy of the helium ions started growing much faster: at t ≈ 4.3 µs, the energy of the plasma directed motions peaked at ≈ 400 eV, so that the helium ions became superthermal, >> ≈ 50 eV. At this stage, the rate of the energy gain became ≈ 330 eV/µs.
Immediately after the energy of the plasma directed motions attained the maximal value (at
t ≈ 4.3 µs), it decreased very quickly; see
Figure 3. In the time interval
t ≈ 4.3–5.4 µs, the rate of the energy decrease was |
| ≈ 320 eV/µs. The processes in the current sheet that are responsible for slowing down the accelerated plasma flows are discussed in the next sections of the paper.
The plasma density averaged over the current sheet width, , grew significantly at t > 1.5 µs, and at t ≈ 3.4 µs it reached its maximal value, ≈ cm, whereas electron density in the middle of the sheet remained unchanged, ≈ cm. An increase in the electron density is an additional indication of plasma motions from the middle of the current sheet towards its edges that resulted in plasma accumulation at the peripheral regions of the sheet. The succeeding decrease in can be related to plasma losses on the walls of the vacuum chamber.
4. Ampère Forces in Current Sheets and Plasma Acceleration
Excitation of the plasma current
parallel to the null line of the magnetic field (1) brings about formation of a current sheet, i.e., a relatively narrow region compressed in the
y-direction and elongated in the
x-direction, where both the electric current and plasma are concentrated. The current sheet formation gives rise to a significant change in the initial magnetic configuration (1): the tangential magnetic field component
increases significantly near the sheet surface, whereas the normal component
becomes several times lower than its initial value
and holds the same direction as
[
21].
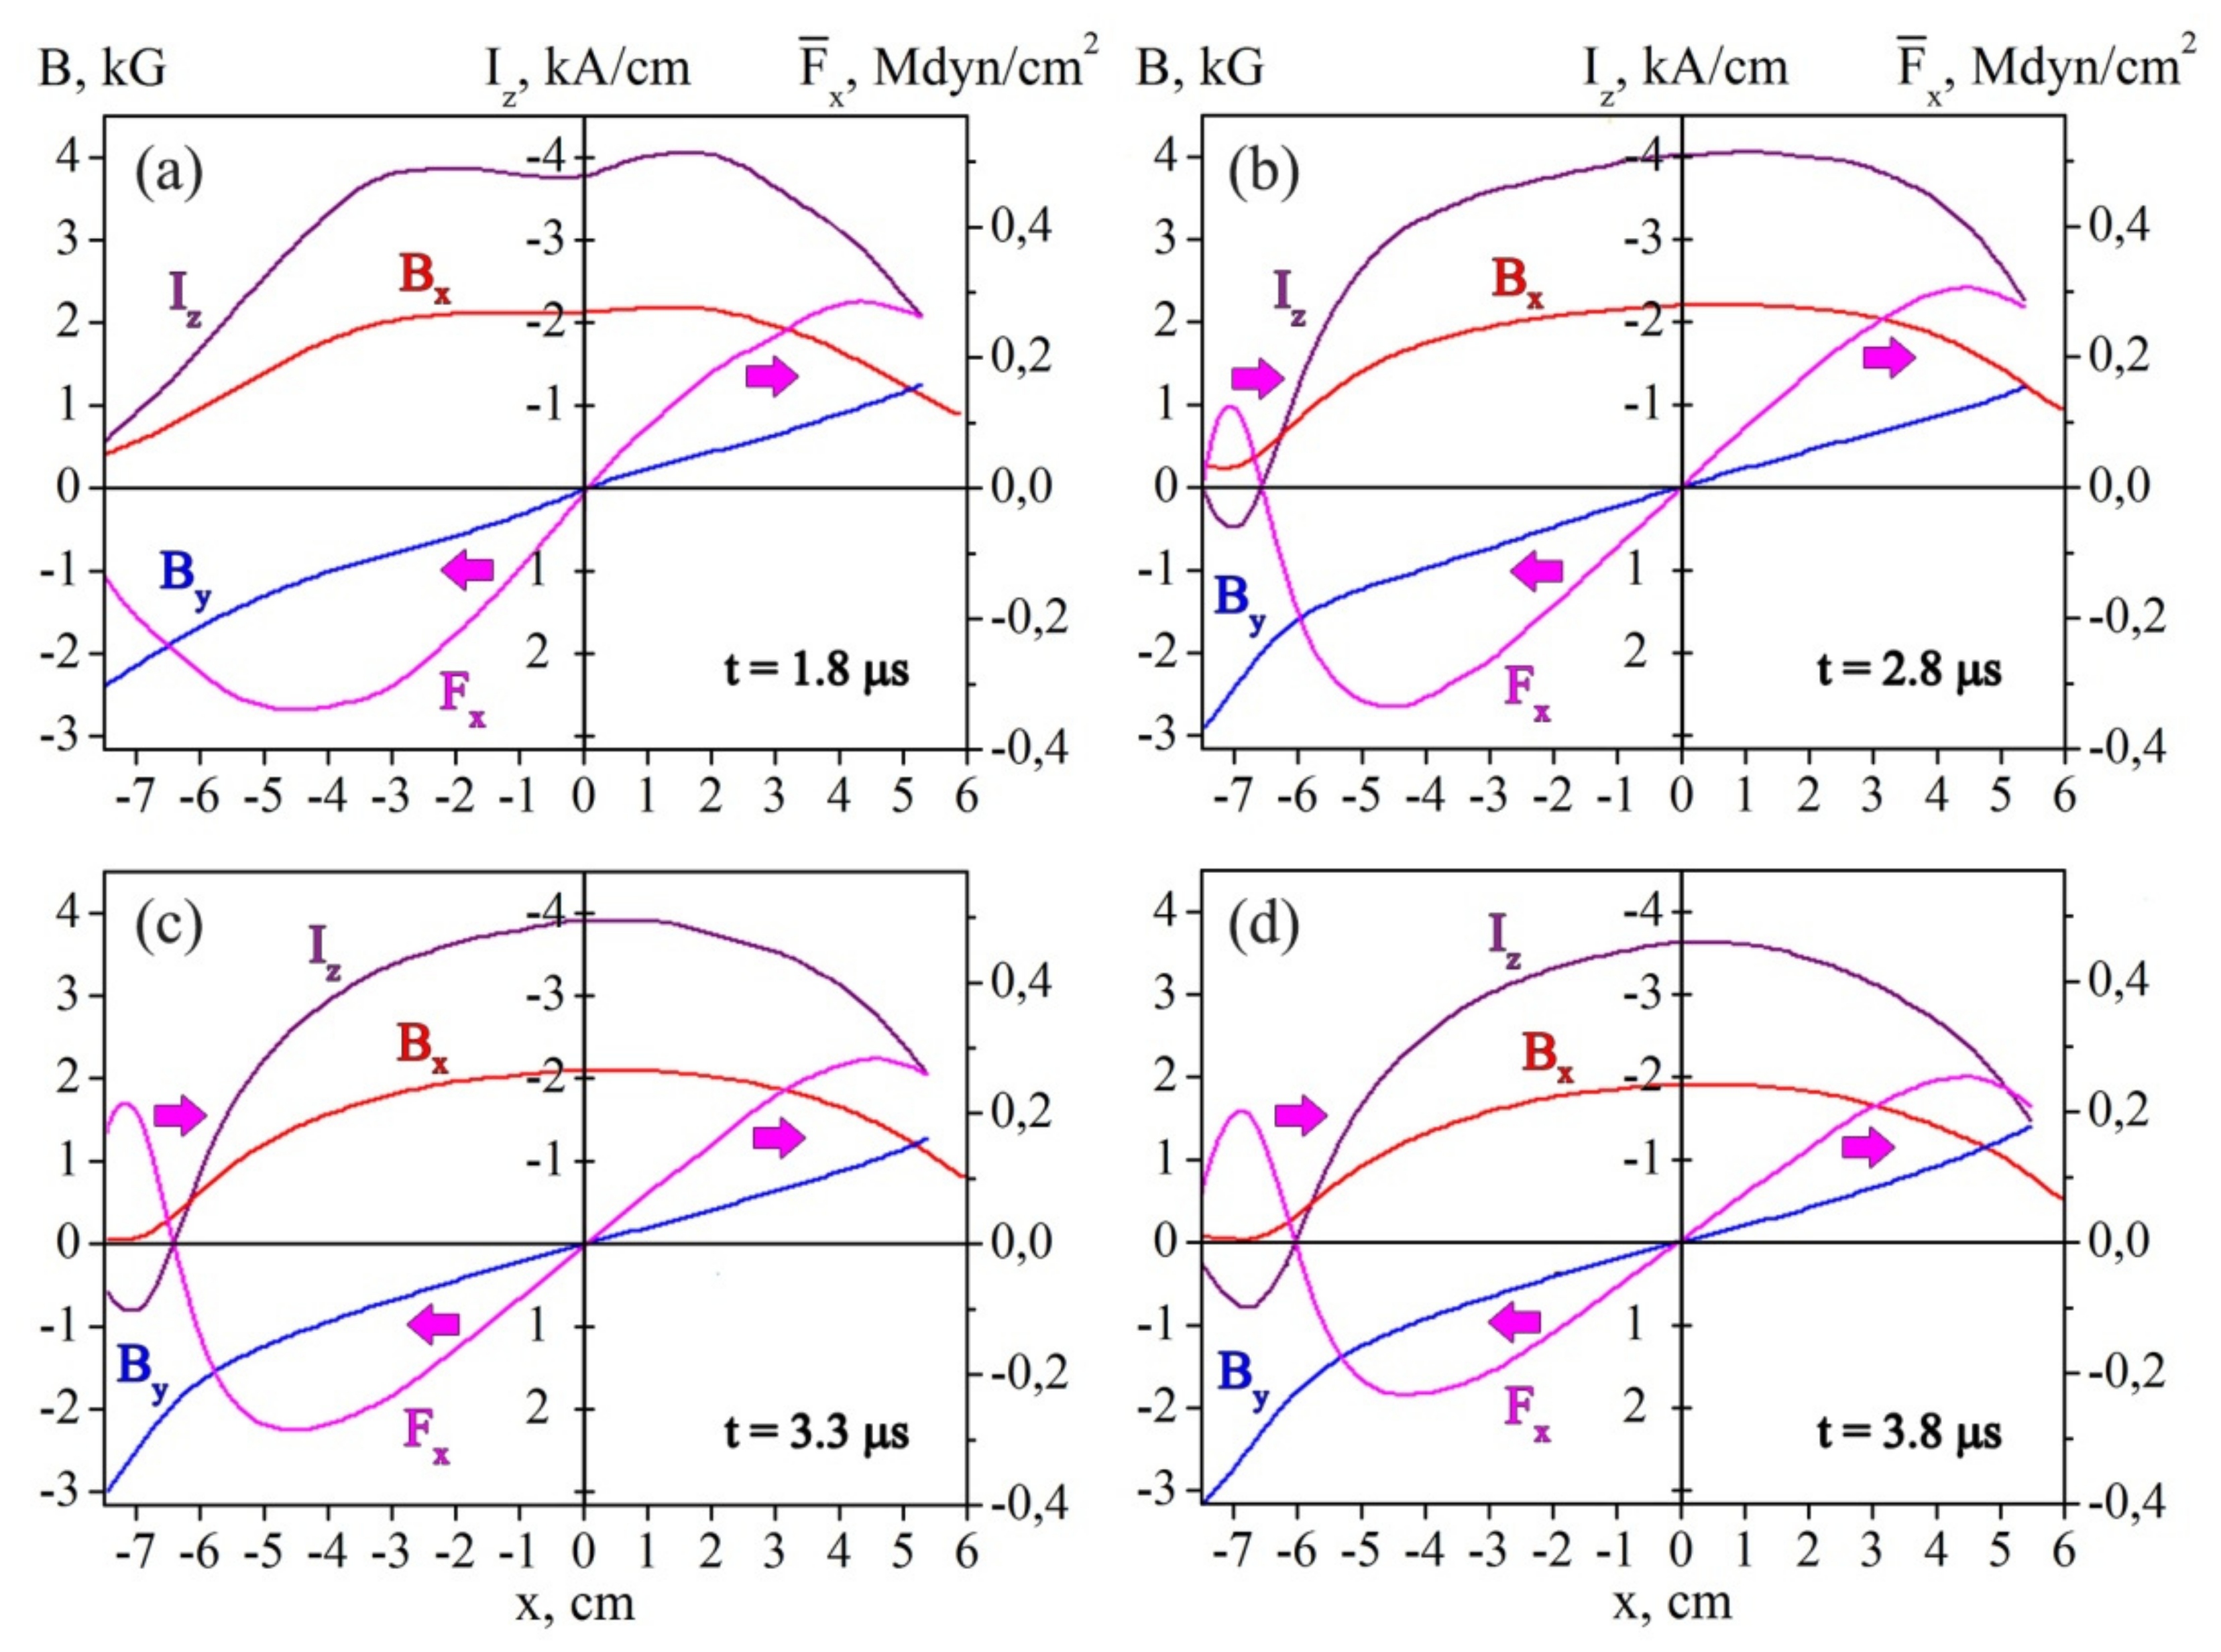
Typical distributions of the current sheet parameters along the sheet width (along the
x-direction), shortly after the sheet formation, are shown in the
Figure 4a. The presented parameters are the tangential magnetic field component
, the normal magnetic field component
, the linear current
within the sheet thickness
, and the Ampère force
within the same region. The linear current
is maximal in the middle of the sheet (at
x ≈ 0), vanishes at the sheet side edges, and in the whole sheet has one, and only one, direction. This direction is specified by the external electric field which had excited the plasma current
and given rise to the current sheet formation. The Ampère forces
are of the opposite directions in the regions (
x > 0) and (
x < 0), i.e., the
forces are directed from the middle of the sheet to both of its side edges (see below). Note that the directions of the Ampère forces
are marked in
Figure 4 by arrows.
Plasma acceleration occurs under the action of a pressure gradient and the Ampère forces:
Here,
,
, and
are the mass, concentration, and velocity of plasma ions,
p is the plasma pressure, and
is the density of the Ampère forces. In a current sheet formed in a 2D magnetic field (1), plasma acceleration along the sheet surface (in the
x-direction) results mainly from the action of the Ampère forces
, since the pressure gradient is usually negligible [
18,
29,
30]. The magnitude and direction of the Ampere force
depend on the current density in the sheet
and the strength of the normal magnetic field component
:
The Ampère forces
shown on
Figure 4 are the integrals of
within
:
Here, we take into account that the normal
component changes insignificantly within the integration region 2Δ
y [
21,
28]. The forces
can accelerate plasma along the sheet surface, building up the kinetic plasma energy
.
Directed fluxes of helium ions have been actually detected and investigated by spectral methods; see above and References [
19,
20,
33]. Characteristic features of the temporal evolution of the averaged energy of plasma fluxes
can be followed in
Figure 3. During the first ≈ 3.4 µs after the onset of plasma current
, the energy
does not exceed the thermal energy of the helium ions. A sharp increase in the kinetic energy
starts with a delay which is due mainly to the inertia of the ions [
24,
28], and, to some extent, to the increase in the Ampère forces with time. As we have shown above, the energy of plasma flows peaks at
t ≈ 4.3 µs, when
≈ 400 eV, and then goes down.
In accordance with the structure of the Ampère forces
shown in
Figure 4a, plasma velocities are directed from the central region of the sheet to its side edges, so that the absolute values of the velocities
should increase near the edges, while, in the central region, the velocities are relatively small and do not exceed the ions’ thermal velocities.
5. Generation of Reverse Currents
At the later stages of the current sheet evolution, the distributions of the parameters shown in
Figure 4 change significantly: see
Figure 4b–d. A distinctive feature of these distributions is the appearance of reverse currents at the side edges of the current sheet. The reverse currents flow in the direction opposite to the main current in the central region of the sheet. Simultaneously, the current sheet becomes thicker and the current density rapidly decreases at a considerable distance from the null line along the
x-axis, (compare
Figure 5a,b).
The possibility of the appearance of reverse currents in current sheets has been predicted theoretically by S.I. Syrovatsky [
36], and, subsequently, reverse currents have been revealed experimentally [
11,
21]. The generation of reverse currents is closely connected with the motion of plasma flows in the magnetic field of the current sheet, as we have demonstrated for current sheets formed in plasmas with heavy ions—Ar and Kr [
24,
37]. In this paper we present results related to phenomena that occur in current sheets formed in plasma containing the He ions. We consider the excitation of reverse currents, as well as the effect of reverse currents on the dynamics of plasma flows.
It is known that plasma motion in a magnetic field gives rise to the excitation of inductive electric fields. This effect should also come into play when plasma flows move along the width of the current sheet across the transverse magnetic field
. This motion should result in the generation of the inductive electric fields
:
where
is the velocity of the plasma flow and
is the transverse magnetic field.
Within the whole current sheet, the electric field
is directed oppositely to the initial field
, which has caused the plasma current
and the current sheet formation. As follows from the relation (5), the inductive fields
should be substantially inhomogeneous within the width of the sheet. This occurs because both the velocities of the plasma flows and the strength of the normal component of the magnetic field are inhomogeneous [
24]. The maximal values of the field
should be reached at the side edges, where both absolute values
and
are sufficiently large, so that the inductive fields here can exceed the absolute value of the initial electric field
. As a result, currents
of the opposite direction with respect to the main current
are excited in the sheet, and this phenomenon is most clearly manifested at the side edges of the sheet.
Moreover, a faster decrease in the current density
and increase in the current sheet thickness, 2δ
y, at the considerable distance from the null line along the
x-axis,
Figure 5b, are also due to the appearance of reverse currents, but of a smaller value than at the sheet edges; see also [
24].
Excitation of currents of the opposite direction at the side edges of the current sheet generates the Ampère forces
in these regions, which are directed oppositely to the forces in the sheet central region, i.e., from the side edges to the middle of the sheet;
Figure 4b–d. The absolute values of the forces
are comparable with the forces
in the middle of the sheet, despite that the reverse currents are relatively small. This is due to the significant strength of the normal
component at the sheet side edges. The appearance of the forces
should result in changing plasma dynamics in the current sheet, and can produce deceleration of previously accelerated plasma flows.
6. Work of the Ampère Forces and Slow down of Plasma Flows
The kinetic energy of plasma flows can change (either increase or decrease) due to the work of the Ampère forces at the distances where these forces act. Below, we estimate the work of the Ampère forces
at the half-width of the current sheet (
) at successive times:
Here,
is the radius of the vacuum chamber, i.e., the largest possible half-width of the sheet. The values of the work
A (
t) are calculated separately for two different regions. The first is the central region (
), where the main (direct) currents are concentrated, and we denote the work of Ampère forces at this region as
;
Figure 6a. At the second region (
), the reverse currents are concentrated, and this work is denoted as
;
Figure 6a. Here,
is the coordinate where both the linear current
and the Ampère force
change directions; see
Figure 4. The total work of the Ampere forces
within the whole half-width of the current sheet (
) is also shown in
Figure 6a; it is evident that
.
At the first stage of the current sheet evolution (
t < 4.0 µs), the work of the Ampère forces is positive,
,
Figure 6a, and plasma can be effectively accelerated along the sheet surface. Then, the situation changes dramatically, since the absolute value of the work
sharply increases due to the excitation of reverse currents. Simultaneously, the
value slightly decreases; so that the total work
goes down and, moreover, it even becomes negative after
t ≈ 5.0 µs. Based on these results, we can conclude that, at the later stages of the current sheet evolution, the plasma flows should slow down.
The data presented in
Figure 6a allow us to give an interpretation for experimental results related to the evolution of the kinetic energy of plasma flows; see
Figure 6b. A comparison of the work of the multidirectional Ampère forces
and
, on the one hand, with changes in the energy of the accelerated plasma flows
, on the other hand, demonstrate a satisfactory time correlation; see
Figure 6. Plasma is effectively accelerated in the first stage of the current sheet evolution, when the work of the Ampère forces
, and the total work is positive,
. At this stage, plasma flows become super-thermal. Later on, the excitation of reverse currents and the appearance of significant Ampere forces
caused by the reverse currents result in braking previously accelerated plasma flows and a rapid decrease in the energy
.
The appearance of braking forces makes it possible to explain the nature of the temporal changes in the energy of plasma flows, when the energy achieves the super-thermal value and then reduces quite quickly [
20,
23,
24,
33].
It can be assumed that the generation of reverse currents and, as a result, the appearance of braking forces, can also affect the characteristics of high-speed plasma flows that extend from the tail region of the magnetosphere towards the Earth. Indeed, as shown by direct measurements carried out with the help of various satellite missions, the deceleration of plasma flows directed to the Earth has been recorded at distances from the Earth about (10–20)
[
38,
39,
40,
41] (here,
is the radius of the Earth). We believe that the excitation of the reverse currents and the appearance of additional forces directed towards high-speed plasma flows can be a significant factor leading to slowing down plasma flows in the Earth’s magnetosphere.
7. Conclusions
In this paper, we present experimental results on the dynamics of plasma with the helium ions in the current sheets formed in two-dimensional magnetic fields with the null-line of the X-type. The research was carried out using the CS-3D experimental setup at the Prokhorov General Physics Institute of the Russian Academy of Sciences. The parameters of the plasma in the current sheets were investigated by the spectroscopic methods using two various spectral lines of the helium ion that were registered along two mutual perpendicular directions. The structure and evolution of the magnetic fields, electric currents, and the Ampère forces in the current sheets were studied using a system of magnetic probes.
We demonstrate an appearance of plasma flows accelerated along the width (the larger transverse size) of the current sheet. The energy of the flows increases rapidly and peaks at 400 eV, whereas the temperature of the helium ions is about 50 eV. Immediately upon reaching its maximum, the energy of the plasma flows decreases very quickly.
We analyze the structure of the Ampère forces that can accelerate plasma along the current sheet width. At the early stage of the current sheet evolution, the Ampère forces are directed from the middle of the sheet to both of its side edges, and build up the kinetic energy of directed flows of the helium ions.
The plasma flows that are moving in the magnetic field of the current sheet excite the inductive electric fields and the electric currents of the opposite directions relative to the main current in the sheet. The reverse currents reveal themselves primarily at the side edges of the current sheet, and bring about the Ampère forces that are directed oppositely to the forces in the sheet central region. These forces modify plasma dynamics in the current sheet, initiating deceleration of previously accelerated plasma flows. Comparison of the work of the multidirectional Ampère forces in the current sheet with the evolution of the energy of the accelerated plasma flows demonstrates a satisfactory time correlation.
The appearance of braking forces makes it possible to explain the nature of the temporal changes in the energy of plasma flows, when the energy has achieved the super-thermal value and then reduces quite quickly.
It should be emphasized that phenomena related to the excitation of reverse currents in the current sheets represent a manifestation of the general Lenz’s rule. According to this rule, the induction current always results in decreasing the impact of the cause that has excited this current.
It seems reasonable that the excitation of the reverse currents and the appearance of the Ampère forces directed towards high-speed plasma flows can be a significant factor leading to braking plasma flows in the Earth’s magnetosphere.

