Article

Obscuration and Scattering in Narrow-Line Seyfert 1s

1
Key Laboratory for Polar Science, MNR, Polar Research Institute of China, 451 Jinqiao Road, Shanghai 200136, China
2
CAS Key Laboratory for Research in Galaxies and Cosmology, University of Sciences and Technology of China, Hefei 230026, China
*
Author to whom correspondence should be addressed.
Universe 2020, 6(6), 73; https://doi.org/10.3390/universe6060073
Submission received: 30 March 2020 / Revised: 14 May 2020 / Accepted: 18 May 2020 / Published: 28 May 2020
(This article belongs to the Special Issue Seyfert Galaxies Astrophysics)

Abstract

:
Narrow-line Seyfert 1s (NLS1s) observed at large inclinations from face-on are important for understanding this amazing AGN subclass. However, progress is slowly being made in the huntings and studies of highly obscured (EB–V ≥ 1) NLS1s. Recently, we discovered that multi-wavelength photometric and polarimetric analysis can be of great help in identifying and studying highly obscured NLS1s. This paper presents an intercomparison study of three typical highly obscured NLS1s. By joint analysis of extinction, absorption lines, and scattered AGN radiation, properties of the nucleus (disk and broad emission line regions) are measured. Physical and geometrical conditions about circum-nucleus obscuring/scattering clouds are also estimated. In addition, the host galaxies which are usually difficult to observe in such high luminosity NLS1s are also revealed in these targets. The results show that obscuration and scattering can be powerful probes to obscured NLS1s. Analogues of these obscured NLS1s are found to widely exist. In addition, they will be followed up in our future works, so as to understand the nuclei, circum-nucleus clouds, and host galaxies of NLS1s.

1. Introduction

In the early studies of emission line galaxies, it was established that there are three types of Seyfert galaxies: type 1s with broad permitted lines, type 2s with permitted lines of widths similar to that of narrow forbidden lines [1], and an intermediate class with line properties in between the two [2]. Later on, these different types of AGNs were proposed to have similar structures but observed at different inclinations, knowns as the AGN unification scheme [3]. In this orientation-based model, a dusty torus is assumed outside of the accretion disk and broad emission line regions (BELRs) in the equatorial plane of AGNs. If viewed at smaller inclinations from face on, the prominent disk continuum and broad emission lines (BELs) are observed, giving typical observational properties of type 1 AGNs. At larger inclinations, though, the disk continuum and BELs are obscured or totally blocked by the torus, which brings the observational properties of type intermediate and type 2 AGNs.
Osterbrock and Pogge then found a special class of Seyfert 1s, in which BELs are significantly narrower (full-width at half maximum of Balmer BELs, F W H M Balmer BEL 2200 km s−1 [4]) than normal type 1s. These are referred to as narrow-line Seyfert 1s (NLS1s) [5]. Follow-up works found that NLS1s deviate from normal seyfert 1s in several interesting ways; for example, the BELs are usually Lorentzian rather than Gaussian, FeII emissions are stronger, X-ray variabilities have shorter time scales and larger amplitudes, correlations of variability between the X-ray and optical continuum are found to be more tight, etc. [4,6,7,8]. These differences are evidence that NLS1s can be at early stages of AGNs, whose central black holes are relatively small and fast accreting [9].
As a special subclass or evolutionary stage of AGNs though, there has been some blind spots in our knowledge of NLS1s for quite a long time. According to the unification model of AGNs, there should be type intermediate and type 2 counterparts of NLS1s. However, only two obscured AGNs (NGC 5506 [10] and Mrk 573 [11]) are reported to have narrow BELs similar to NLS1s before our studies. This fact to some extent leads to the conjecture that the NLS1s could be actually normal broad-line Seyfert 1s observed nearly face-on. When we observe the disk-like BELR at face-on sightlines, a relatively narrower lorentzian profile will be obtained for the permitted lines [5,7,12]. This hypothesis shows that the inclinations can be important issues in our understanding of NLS1s.
As an attempt to go further, we carried out a series of studies of obscured NLS1s, i.e., NLS1s viewed at large inclinations from face-on. Type intermediate (obscured at EB–V ∼1, with detectable transmitted BELs in the optical-NIR) and type 2 counterparts (severely obscured at equivalent EB–V of ∼10, with non-detectable transmitted BELs in the optical-NIR) of NLS1s are taken into account. After inspecting the UV-optical-IR SED of previously identified NLS1s, including well studied cases (e.g., the prototypes [5]) and objects identified in large spectral surveys (e.g., 12th data release of the sloan digital sky survey, or SDSS DR12 [13]), we find strong IR flux excess in several targets as compared to type 1 AGNs, indicating the presence of prominent obscuration. Several typical objects, IRAS F11119+3257, Mrk 1239 and SDSS J120300.19+162443.7 (hereafter J1203+1624), are then noticed. The g W 4 colors of the three NLS1s are 15.4 mag, 12.5 mag, and 13.2 mag, larger than the composite of type 1 quasars [14] (a combined spectrum of type 1 AGNs from UV-optical [15] to the IR [16,17]) redenned at an EB–V of 0.5. Detailed analysis of these targets reveal similar but different stories in these violent AGNs. Here in this paper, we present an intercomparison study that introduces such an interesting AGN subclass and discuss the implications. Archival data of these three NLS1s are collected and follow-up observations are carried out. We follow conventional methods in reducing and analysing the data (described in Appendix A), which leads to the results presented in this paper. Obscurations (extinction and absorption) in these NLS1s are studied in Section 2. Scattering processes are discovered in some interesting targets, which offer great helps in studying the obscured nuclei and scattering clouds in these AGNs (Section 3). Finally, host galaxies of these extreme AGNs are also investigated (Section 4). Throughout the paper, all uncertainties are at 1- σ level if not stated specifically.

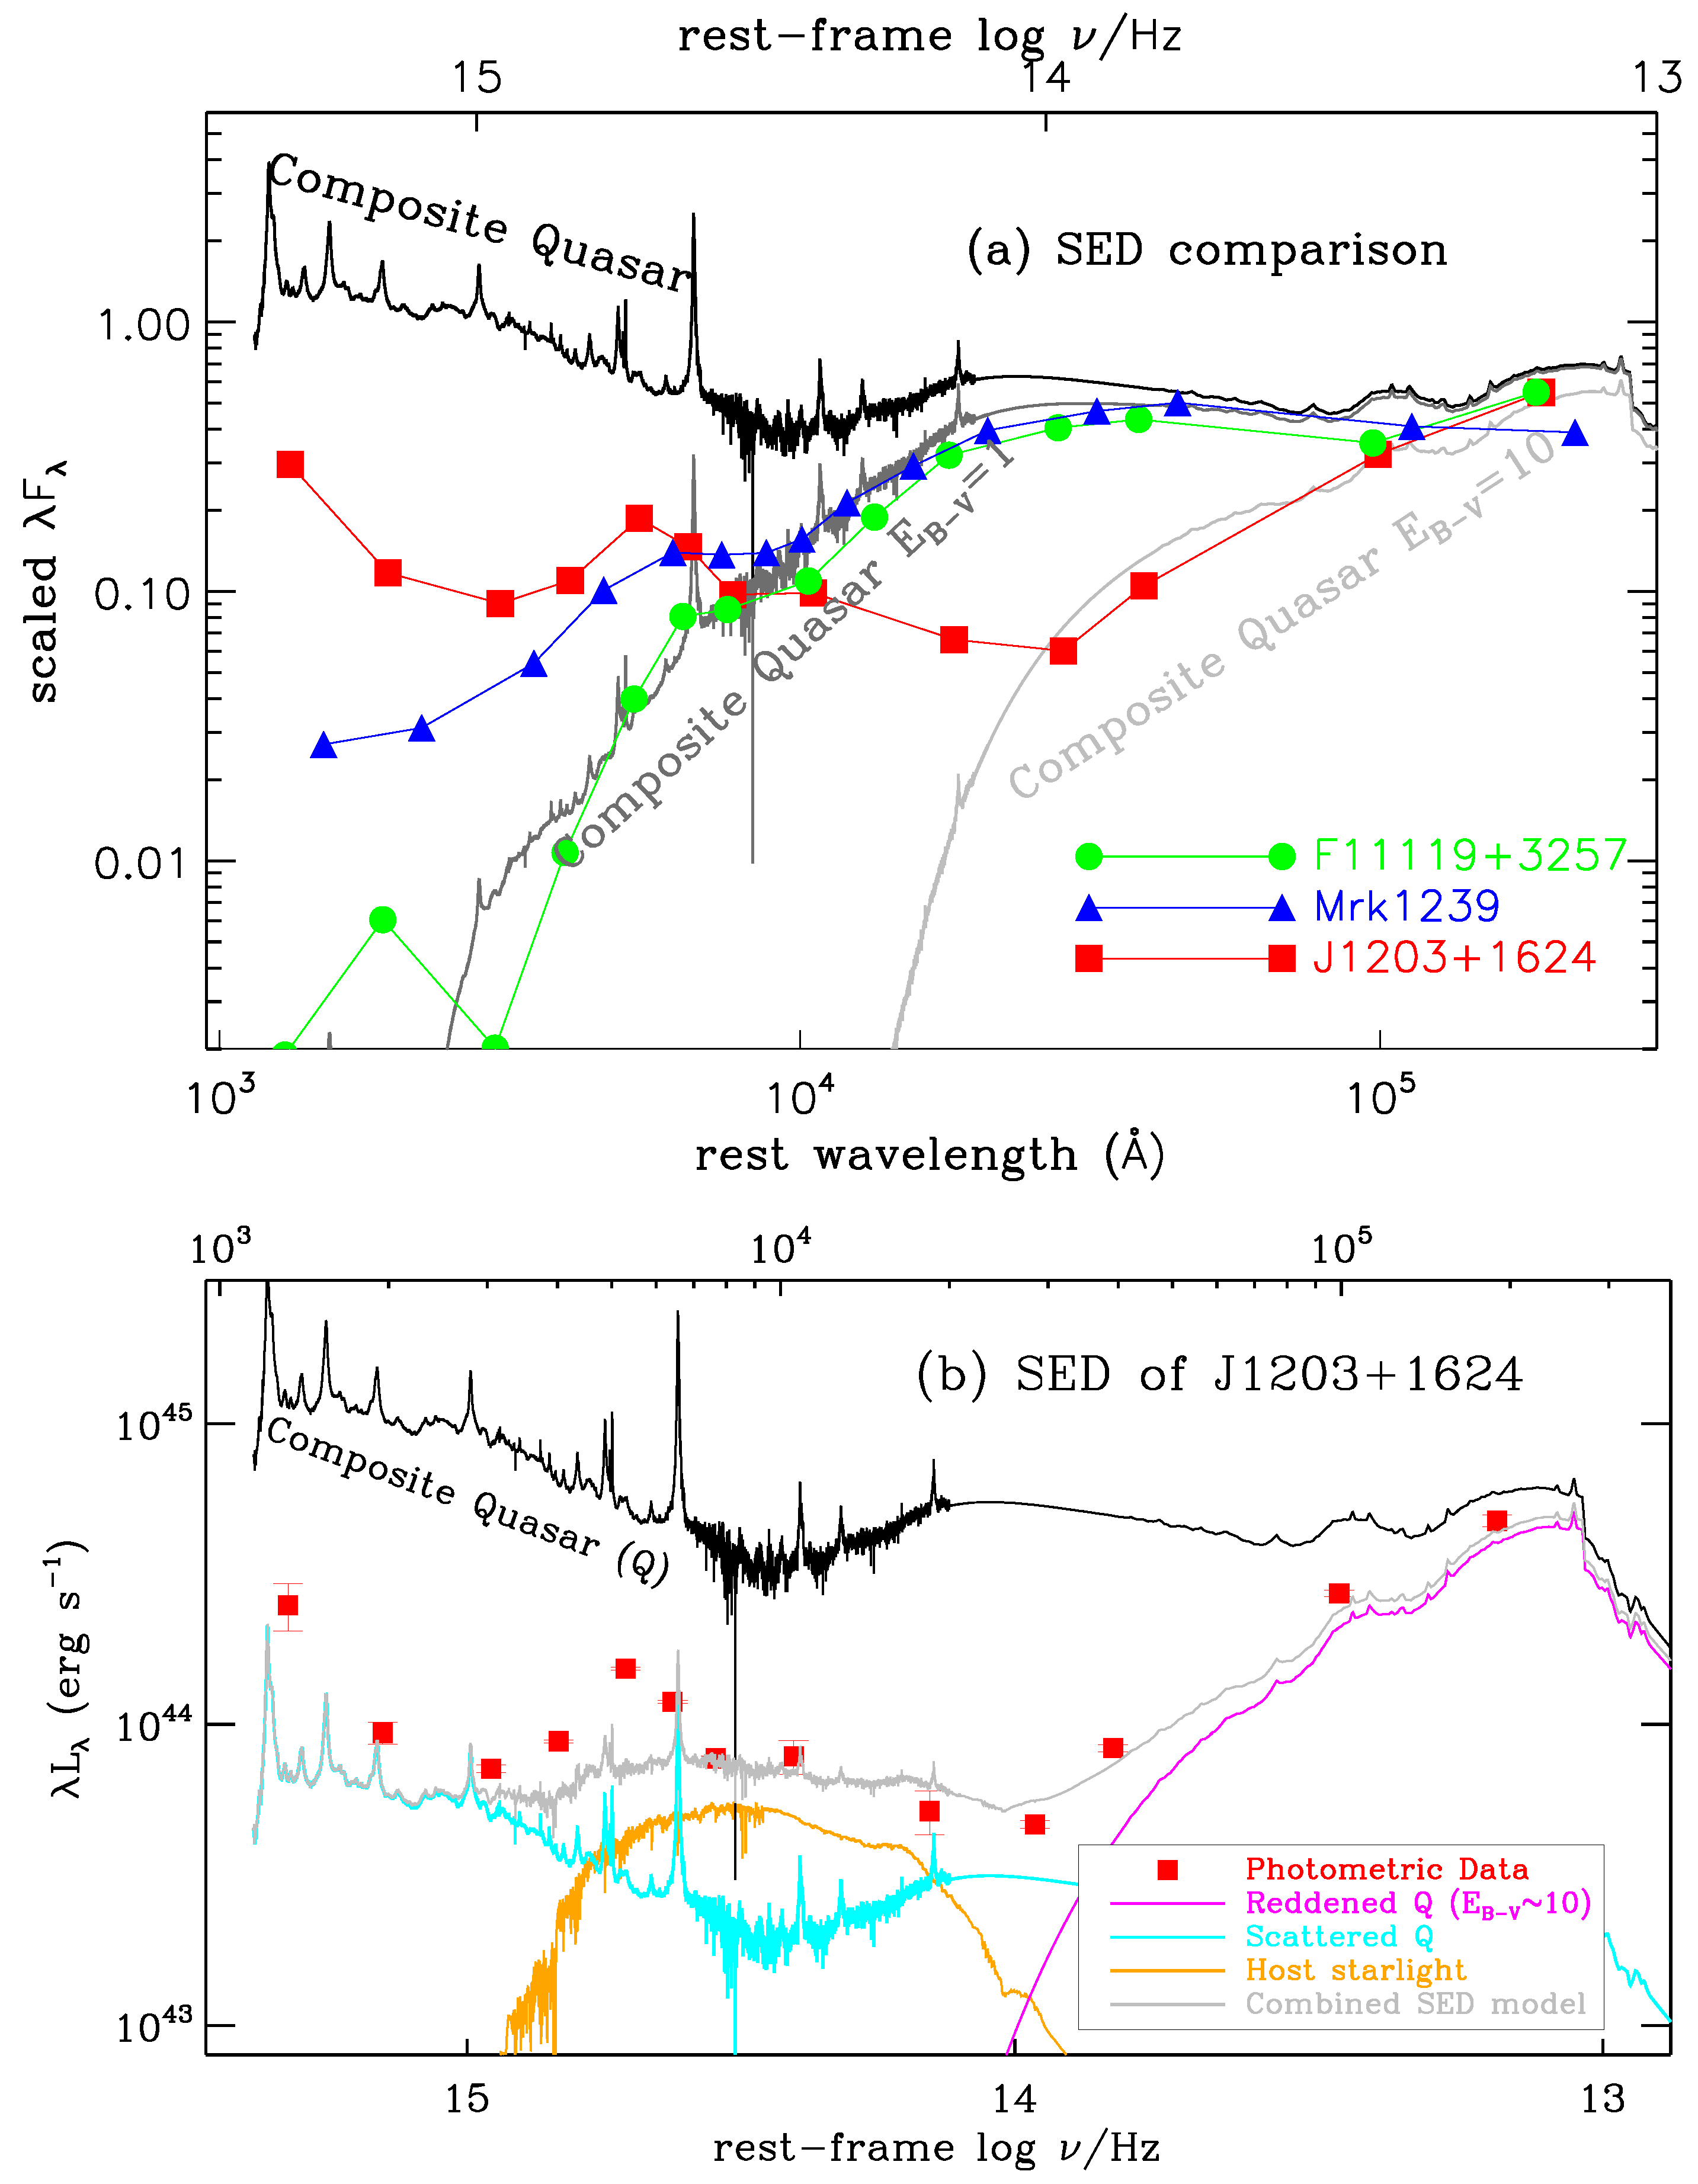
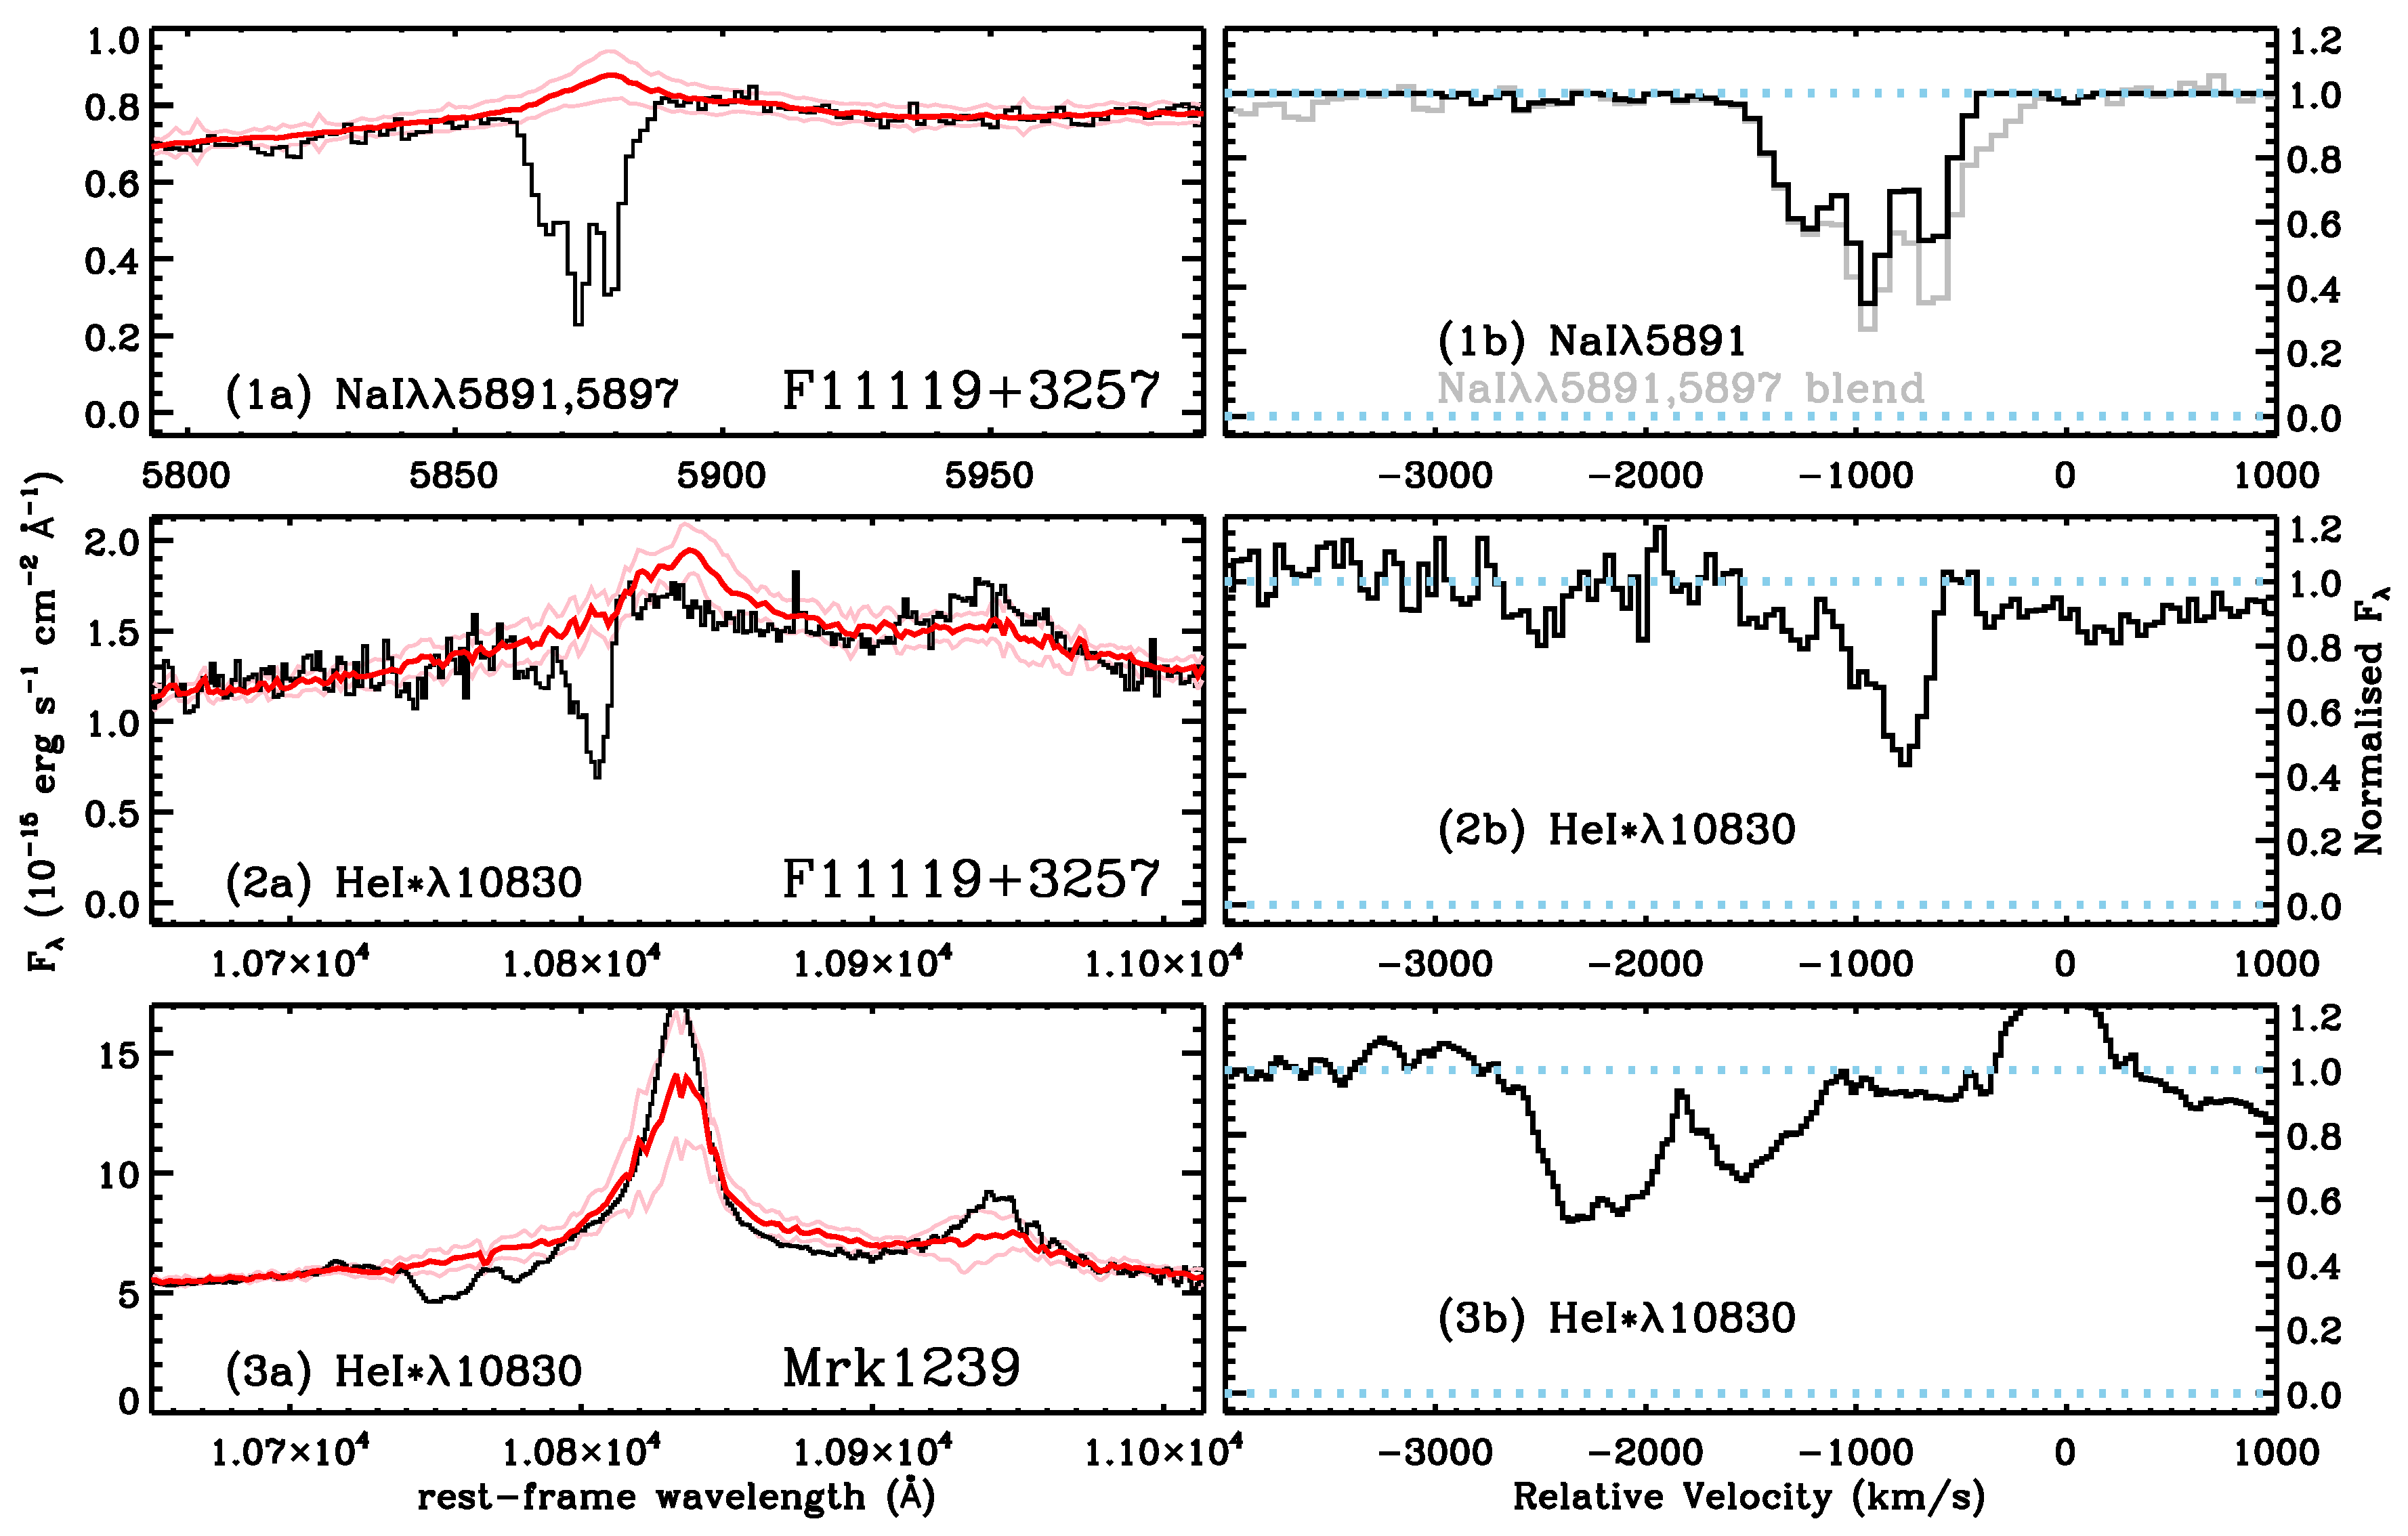
2. Obscuration in NLS1s

Since NLS1s observed at large inclinations from face-on are important in our understanding of their basic differences from normal broad line AGNs, there has been studies dedicated to looking for obscured NLS1s. In 2 reddened quasars (NGC 5506 [10] and Mrk 573 [11]), NIR spectroscopy revealed that the FWHM of Paβ BELs are less than 2000 km s−1, making them candidates of obscured NLS1s. These studies are evidence that there can be NLS1s observed at large inclinations. In addition, when the optical radiation from AGN is obscured, the transmitted disk continuum and BELs can possibly be studied in the IR if obscuration is not too strong.
Based on these results, we selected several typical NLS1s (e.g., IRAS F11119+3257, Mrk 1239, etc.) in which significant obscurations are found by inspecting their SEDs. Archival photometric data from G A L E X (Galaxy Evolution Explorer, UV [18]), SDSS (optical [19]), 2MASS (the Two Micron All Sky Survey, near-IR [20]) and W I S E (Wide-field Infrared Survey Explorer, mid-IR [21]) for these targets are collected, and spectroscopic data from SDSS and 6dF Galaxy Survey (6dFGS) [22] are then obtained. We then performed NIR spectroscopy of these targets (described in Appendix A). Extinction and absorption in the optical and IR of these obscured NLS1s are then explored in detail based on these data.
By comparing the spectral energy distributions (SEDs) of typical obscured NLS1s visually with the composite of type 1 quasars reddened at different EB–V s, the extinction to the disk continuum are evaluated. As shown in Figure 1a, the SED of F11119+3257 is close to the composite quasar SED reddened with the Small Magellanic Cloud (SMC) extinction curve [23] at an EB–V ∼1 (corresponding to N H 10 22.7 cm 2 if gas-to-dust ratio of typical interstellar medium in SMC [23] is considered). A more detailed study found that the extinction curve in F11119+3257 is more steep as compared to that in normal quasars, i.e., the observed extinctions in shorter wavelengths are stronger than expected. This means that the dust grains that obscure F11119+3257 can be relatively small [24]. In the case of Mrk 1239, we found that it is similar to F11119+3257 in the IR, but a significant flux excess is found in the UV-optical band. This flux excess is later on found to be produced by scattered AGN radiation and star light from the host galaxy (details will be shown in the following sections). On the other hand, with the identification of the type 2 counterpart of NLS1 (NLS2), SDSS J120300.19+162443.7 (hereafter J1203+1624) [25], a NLS1 viewed at nearly edge-on is detected. The IR SED of J1203+1624 is severely obscured, at an extinction level of EB–V ∼10, and the UV-optical fluxes are dominated by scattered AGN radiation and star light from the host galaxy.
In the optical-IR spectra of obscured NLS1s, several absorption lines are identified (examples are shown in Figure 2). In the cases of F11119+3257 and Mrk 1239, the absorption lines are blue shifted at speeds of ∼1000 km s−1 and [1000–3000] km s−1 respectively, indicating that the obscuring clouds are connected with quasar outflows. Photoionization modellings (described in detail in Appendix B) based on the absorption line measurements indicate that the obscuring clouds are at distances of several kilo-parsec (galactic-scale outflows) in F11119+3257 [24] and ∼[0.01,1] kpc in Mrk 1239. On the other hand, the studying of He   I   * λ 10830 absorption lines in three other obscured NLS1s shows that the obscuring clouds can also be related to the dusty torus [14]. Nevertheless, absorption lines are powerful diagnoses of obscuring clouds in NLS1s. The obscurers in obscured NLS1s are found to be related to either outflows or the dusty torus. In addition, the torus-related cases suggest that some obscured NLS1s could be observed at large inclinations from face-on.

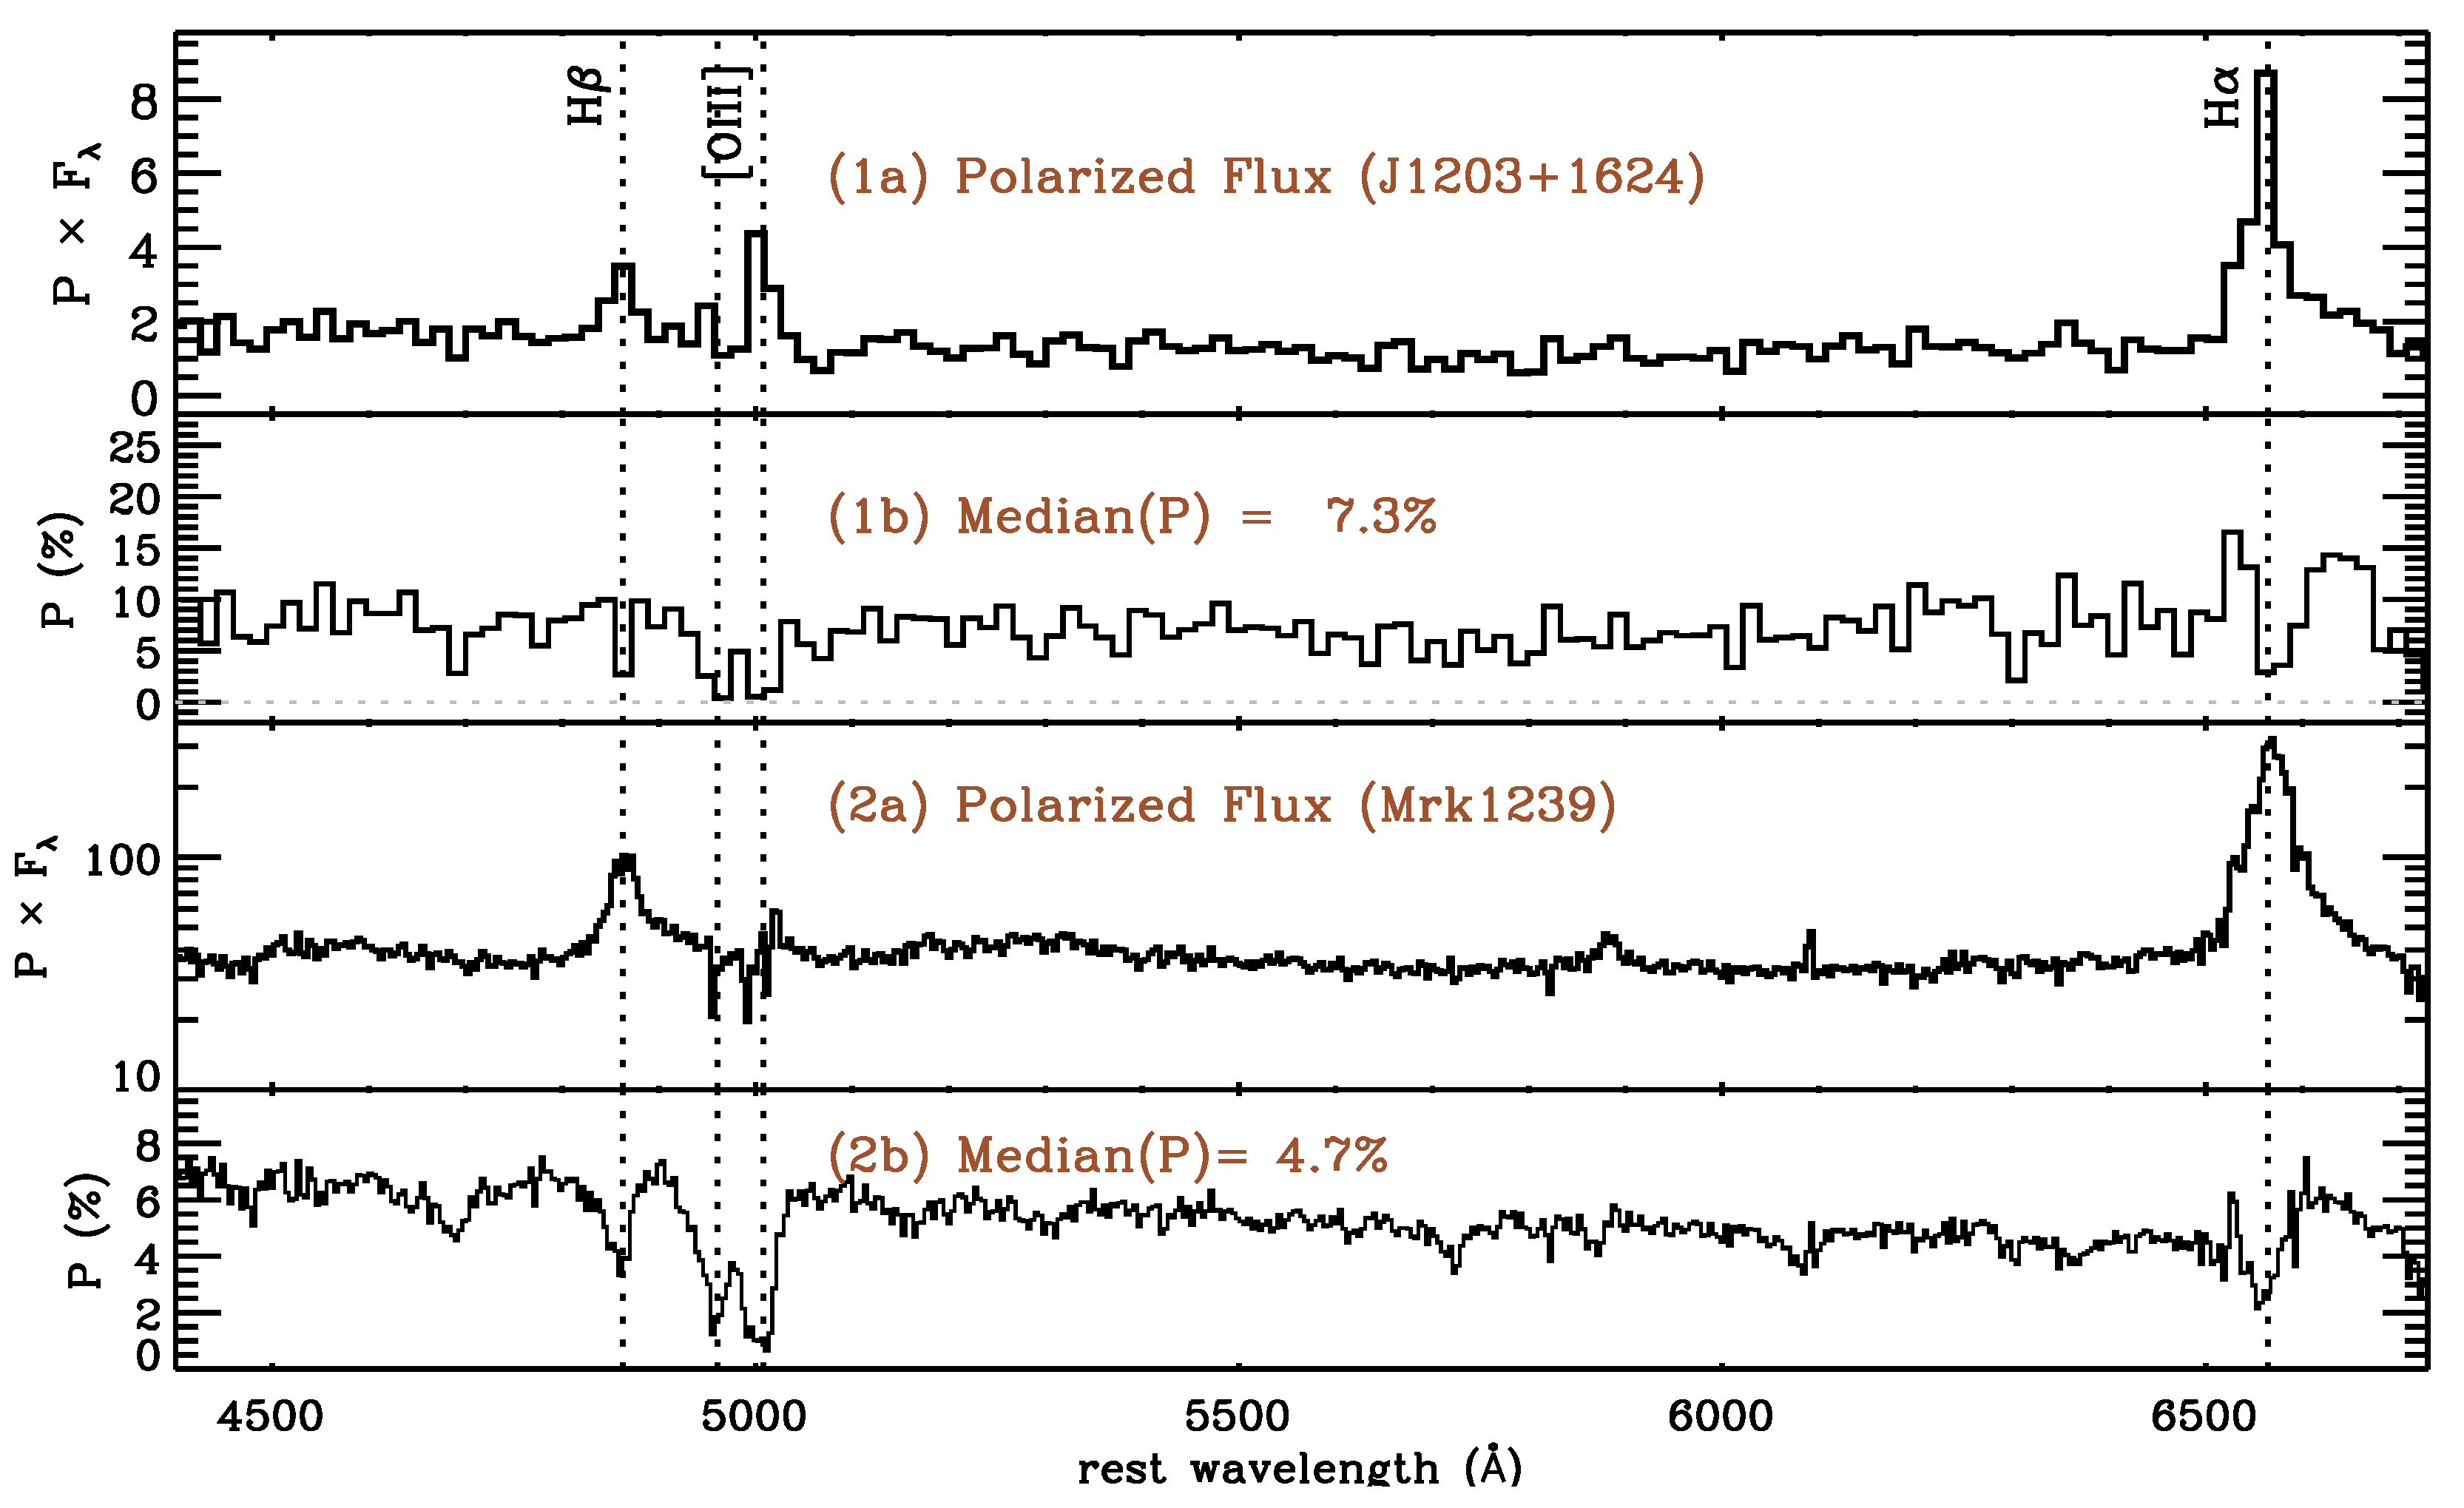
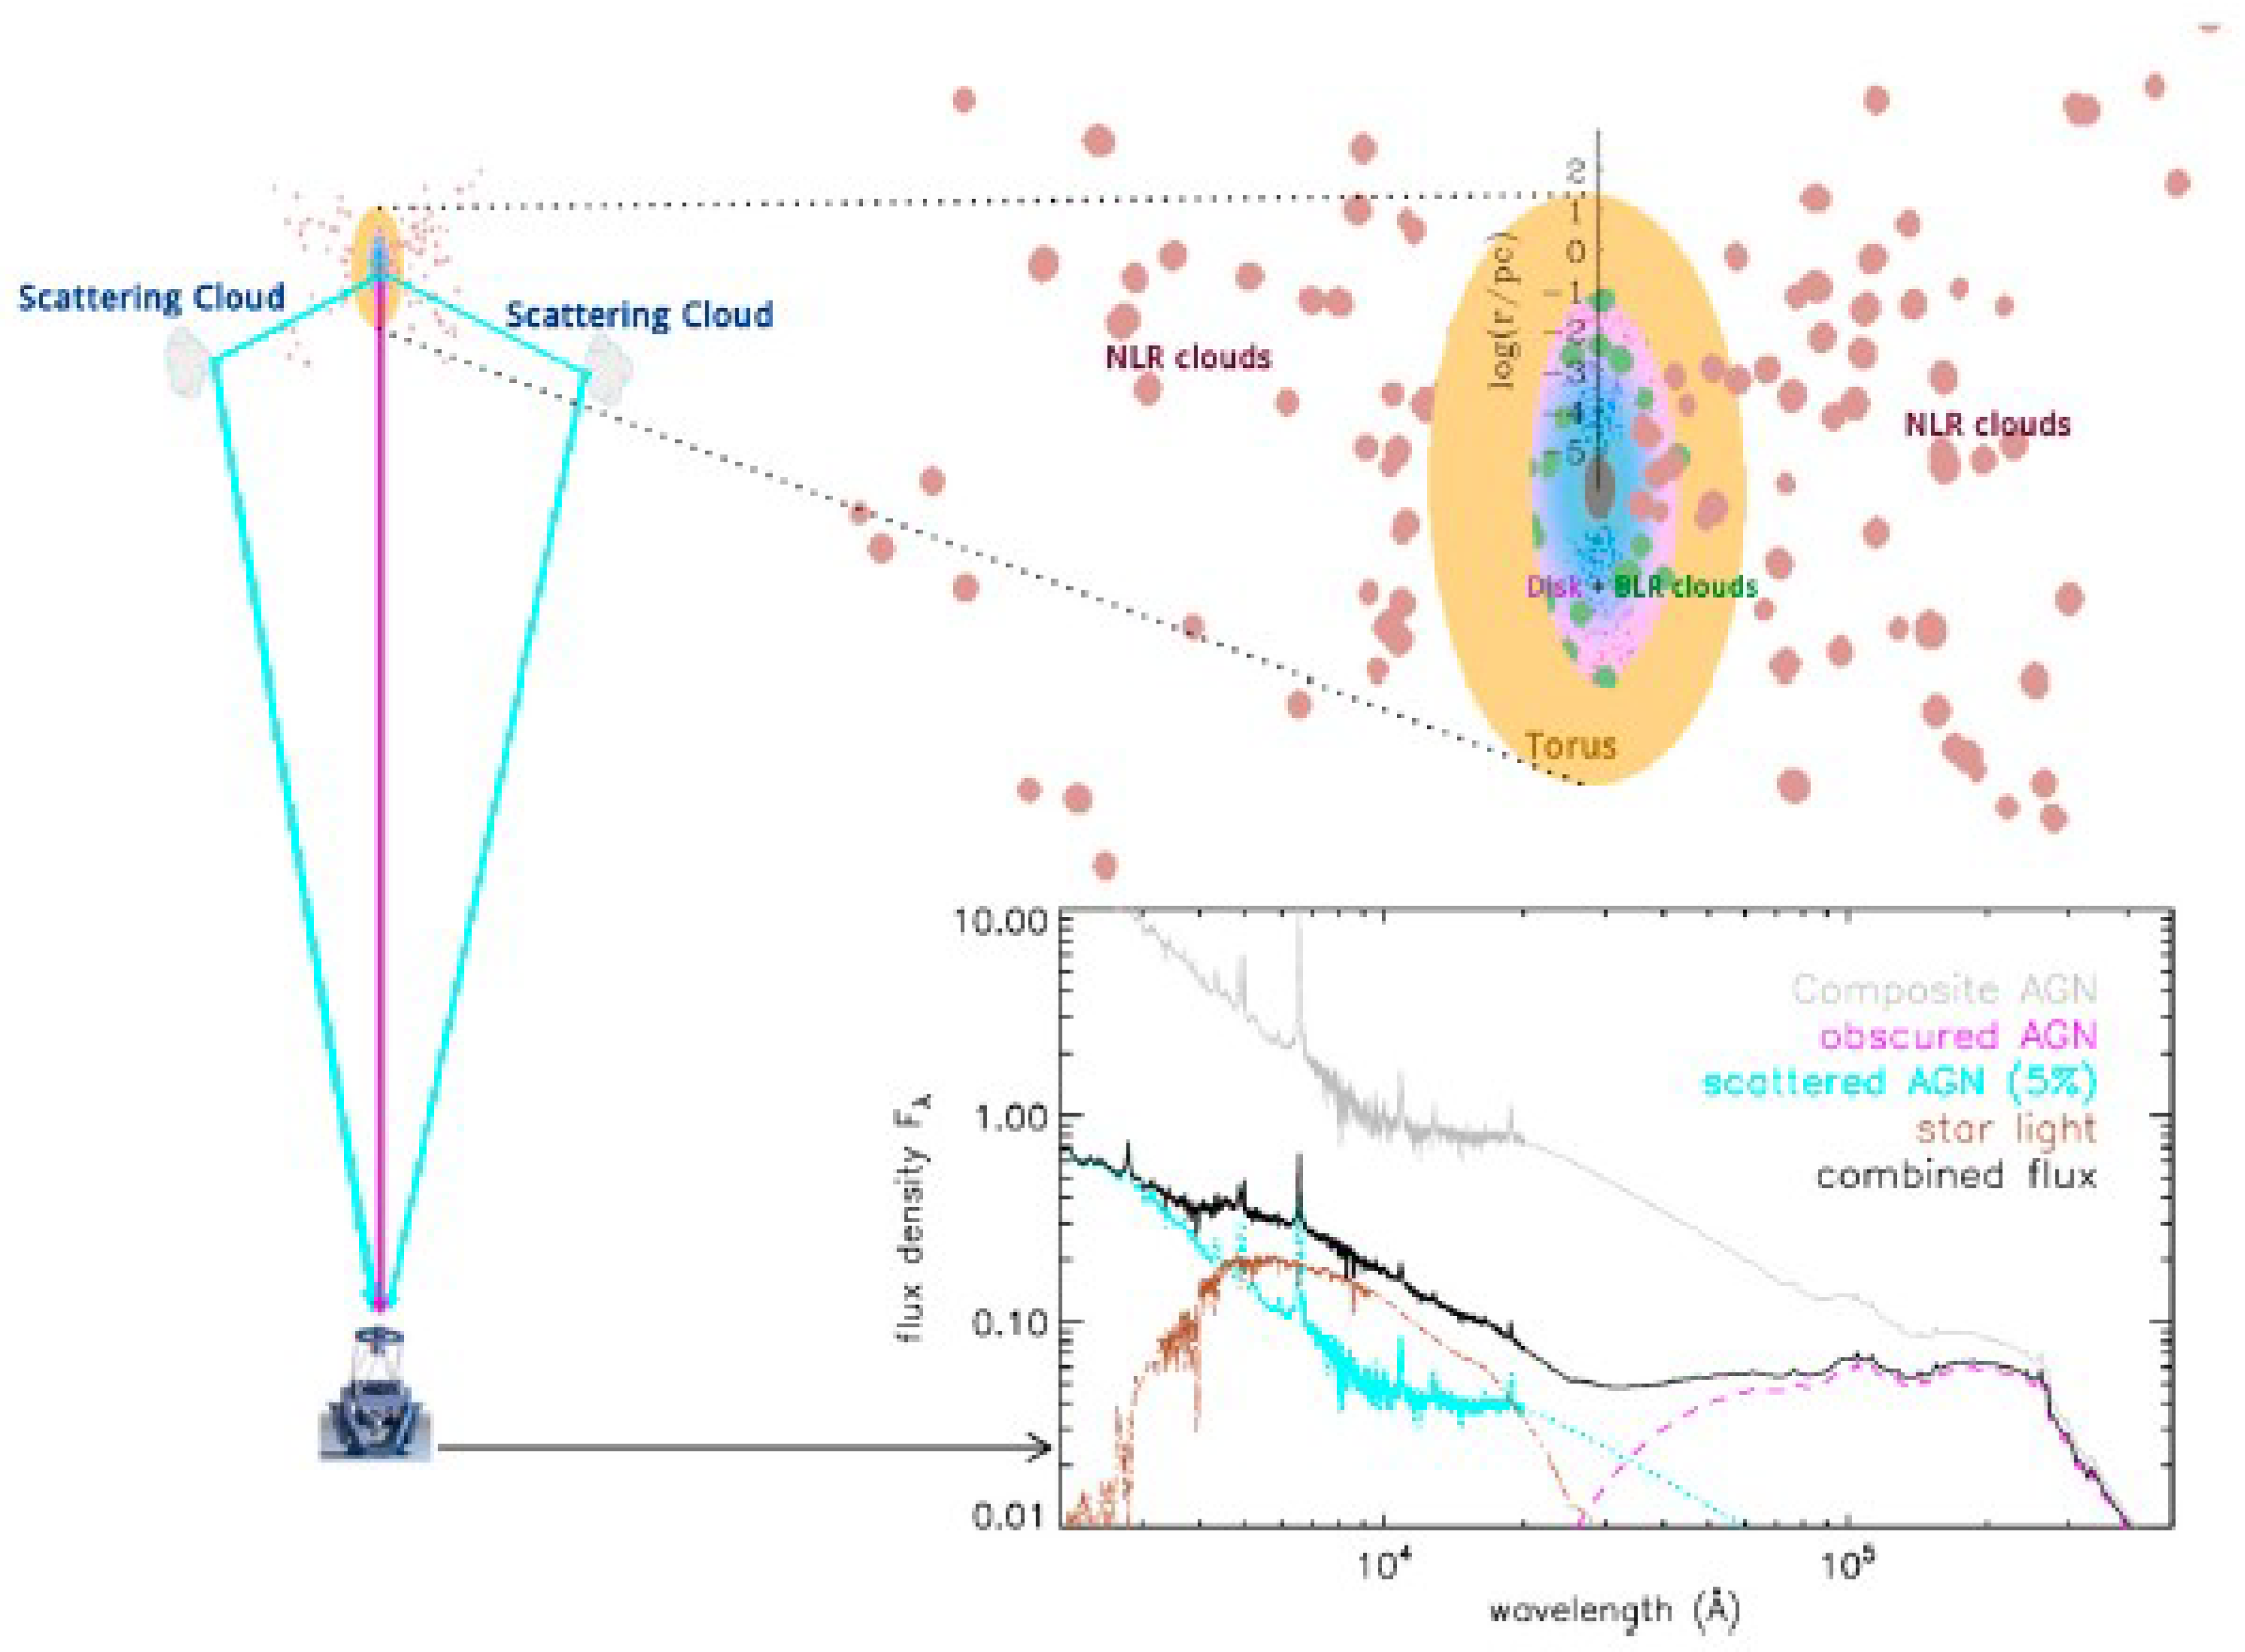
3. Scattering in NLS1s

The visual SED comparison in the previous section shows that in some obscured NLS1s, significant flux excesses are found in the UV-optical band as compared to reddened quasar templates. As shown in Figure 1, this phenomenon is most obviously observed in J1203+1624, in which the fluxes in the UV-optical band are dominated by the excess component. By analyzing the UV-optical spectrum, a blue disk continumm and a BEL component are discovered, with a F W H M Balmer BEL = 1270 ± 20 km s−1, leading to the identification of J1203+1624 as a NLS1. Similar to some well studied AGNs such as OI 287, such a blue AGN component in the UV-optical band in a highly obscured AGN can come from scattering if high degree of polarization (P) is discovered [27]. We then followed J1203+1624 with the imaging spectropolarimeter on the Multiple-Mirrow Telescope (MMT/SPOL), and a high degree of polarization P 7.3% (upper panels in Figure 3) is discovered, which is larger than in 90% of the type 2 AGNs reported. Therefore, the blue AGN component can be scattered AGN radiation. The SED of J1203+1624 is decomposed into three components, a reddened AGN components that dominates in the mid-IR (λ > 3 μm), a star light component approximated well with a SSP [28] at an age of ∼1.4 Gyr, and a scattered AGN component that dominates in the UV (Figure 1b).
In type 2 AGNs where the obscurations are much higher than in type intermediate AGNs, the continuum and BELs radiated by the accretion disk and BELR are usually entirely blocked by the dusty torus. On the other hand, though, the identification of narrow line Seyfert galaxies relies directly upon the measurements of broad emission lines. Such a discrepancy makes NLS2s very difficult to be distinguished from normal Seyfert 2 galaxies. Dewangan and Griffiths proposed that Seyfert 2 galaxies with similar properties in X-ray to NLS1s (rapid variability and steep spectra) can be NLS2s [29]. A reasonable solution to the identification of NLS2 is provided in this paper. However, it would be better if the BELs in these NLS2 candidates can be studied so as to confirm the identifications. Luckily, the analysis of J1203+1624 shows that in some NLS2s, clouds around the AGNs have chances to scatter a fraction of the incident radiation from the core into our sightlines. As illustrated in the schematic cartoon in Figure 4, a scattering fraction of about 5% enables a clear view of the disk continuum and BELs when the AGN is deeply obscured. Thus, scattering processes offer unique opportunities for studying the buried nuclei in NLS2s and also other type 2 AGNs. Follow-up works dedicated to scattering in NLS2 will help to establish similarities and differences between NLS2s and other Seyfert 2 galaxies. Through detailed analysis, we found that, Mrk 1239, 1 of the 8 prototypes of NLS1s, is actually a type intermediate NLS1. In addition, similar to J1203+1624, evidence of scattering processes in Mrk 1239 are also detected (lower panels in Figure 3), indicating that obscured NLS1s with strong scattered light are probably not rare cases. By measuring the width of scattered BELs, mass of central black holes and Eddington ratios of the AGNs in J1203+1624 [25] and Mrk 1239 [30] are estimated, and the results are listed in Table 1.
Besides revealing blocked nuclei in obscured NLS1s, the scattered fluxes also reflects properties of the scattering clouds. First of all, the portion of the scattered flux indicates the global covering fraction of scattering clouds to the central engine (accretion disk and the BELR). In the cases of J1203+1624 and Mrk 1239, the covering faction are ∼3% and ∼10% respectively, indicating that there are a large number of clouds around the AGNs. Secondly, the composition of the scattering clouds can be inferred by checking the distribution of P. When photons are scattered by free electrons, the scattering cross section (and also P) does not depend on wavelength. Such an independence is seen in J1203+1624 (Figure 3(1b)), indicating the scattering clouds are most likely ionized hot gas clouds full of free electrons. On the other hand, scattering by dust will lead to a higher P at smaller wavelength in the UV-optical band. Mrk 1239 is very likely the case, in which the scattering clouds can be relatively cold and dusty. Last but not least, the distribution of P around scattered emission lines shows the relative motion between the scattering clouds and the emission line regions. As an example, rotating outflows in the quasar PG 1700+518 are revealed in spectropolarimetry of the Hα emission line [32]. We find that P enhances at the blue wing of the Hα BEL in J1203+1624 (at the red wings of Hα BEL in Mrk 1239), which indicates that the scattering cloud is inflowing to the nucleus of J1203+1624 (outflowing from the nucleus of Mrk 1239). Also the polarized emission lines can be broadened by the thermal motion of the scattering particles.

4. The Host Galaxies of Obscured NLS1s

NLS1s often have fast-accreting black holes at their centers. With such a powerful engine, radiation from the continuum can easily outshine the star light, making the analysis of their host galaxies hard to achieve. In obscured AGNs though, the radiation from the central engines is largely suppressed, making the observation of host galaxies in the optical band much easier (Figure 4). Based on the SED decomposition with the SSP templates and measurements of stellar absorption lines, properties of host galaxies in J1203+1624 and Mrk 1239 are obtained, which are also listed in Table 1. A comparison between the central black holes and their host galaxies shows that these two obscured NLS1s generally follows the M σ * correlation [33]. The extinction of AGN component in F11119+3257 is similar to that in Mrk 1239; however, evidence of star light is not detected, indicating that the host galaxy could be smaller than predicted by the M σ * correlation. On the other hand, a narrow Paα component deeply obscured by dust in F11119+3257 is discovered. Based on the high star formation rate inferred from FIR dust emission, this narrow Paα emission line can be radiated from the obscured star formation region. Therefore, the non-detection of star light in F11119+3257 can also be caused by obscuration.

5. Summary and Prospect

NLS1 is an amazing sub-class of Seyferts that promotes much research in the field of AGN astrophysics. In our recent studies, we find that obscured NLS1s, i.e., NLS1s observed at different angles offer a unique opportunity to investigate some properties of NLS1s that were poorly understood before. The intercomparison study of the three typical obscured NLS1s shows that obscuring and scattering processes are powerful probes to these AGNs. By analyzing the transmitted AGN radiation in the IR and the scattered fluxes in the UV-optical band, the central engine (super massive black holes and BELRs) can be measured to a similar extent as compared to in normal type 1 AGNs, even for type 2 AGNs such as J1203+1624. On the other hand, detailed analysis of the extinction curves and absorption lines reveals properties of clouds obscuring the AGN in our sightlines. In addition, conditions of scattering clouds can be measured based on details of scattered fluxes and their polarization. Large amount of obscuring and scattering clouds are detected in the three obscured NLS1 discussed in this paper: Mrk 1239, J1203+1624 and F11119+3257. In addition, when the AGNs are highly obscured, the host galaxies that are usually difficult to study can also be observed in obscured NLS1s. We found that Mrk 1239, J1203+1624 and probably some other obscured NLS1s also follow the M σ * correlation. In addition, in cases such as F11119+3257, the star formation is violent and can be highly obscured; spectroscopy in mid-IR are required to investigate the stellar component in such NLS1s.
Interesting and diverse properties are discovered in these three obscured NLS1s. However, the number of cases are far from reaching an overall understand of this special AGN subclass. Based on the SED properties and emission line measurements, a small sample of obscured NLS1s is constructed. We will follow these targets up with spectrophotometric and polarimetric observations, so as to understand statistically the nuclei, circum-nucleus clouds, and host galaxies of NLS1s, as well as the similarities and differences between NLS1s and other AGNs.

Author Contributions

Conceptualization, H.Z., X.P. and P.J.; methodology, X.P.; validation, X.P.; investigation, X.P. and H.Z.; resources, X.P. and P.J.; data curation, X.P.; writing—original draft preparation, X.P.; writing—review and editing, H.Z. and P.J.; visualization, X.P.; supervision, H.Z.; project administration, X.P. and H.Z.; funding acquisition, H.Z., X.P. and P.J. All authors have read and agreed to the published version of the manuscript.

Funding

This research was funded by National Natural Science Foundation of China (NSFC-11903029, 11973037).

Conflicts of Interest

The authors declare no conflict of interest.

Abbreviations

The following abbreviations are used in this manuscript:
SEDSpectral Energy Distribution
NLS1Narrow-Line Seyfert 1
AGNActive Galactic Nuclei
BELBroad Emission Line
BELRBroad Emission Line Region
F W H M Full Width at Half Maximum
G A L E X Galaxy Evolution Explorer
SDSSSloan Digital Sky Survey
2MASSthe Two Micron All Sky Survey
W I S E Wide-field Infrared Survey Explorer
SMCSmall Magellanic Cloud
SSPSimple Stellar Population
BALBroad Absorption Line
MMT/SPOLImage Spectropolarimeter on the Multiple-Mirror Telescope
MMT/BCBlue Channel Spectrograph on the Multiple-Mirror Telescope

Appendix A. Observation and Data Analysis

The optical-IR spectroscopic observations of F11119+3257, Mrk 1239, and J1206+1624 are summarized in Table A1. Since variability of the three NLS1s are mild as monitored by Catalina Sky Survey [34] and the resolutions of the optical-IR spectra are similar (∼2000), we combine the data for each objects before follow-up data analysis. For the spectropolarimetric observations, stokes parameters are obtained via a sequence of exposures during MMT/SPOL observations. The polarized fluxes and polarization angles are then calculated [35].
The optical-IR spectra of each objects are then fitted with multiple spectral components, including Fe   II   template, power law continuum, ssp (if there are significant stellar absorption lines in the spectrum), broad and narrow emission lines. Iterative modelling processes are performed until the model parameters converge (see [24,25] for a more detailed description).
For different objects, the SED decomposition are performed differently according to properties of their SEDs. The optical-IR SED of F11119+3257 is very likely to be dominated by transmitted AGN radiation since there is no evidence of scattered AGN radiation and star light in this wavelength range. In Mrk 1239 and J1203+1624, though, the presence of star light and scattered fluxes are both confirmed. Through image decomposition, the fluxes of the extended component (star light) are then separated from the psf (point spreading function) component (AGN) in Mrk 1239. The stellar population in J1203+1624 is analyzed with spectral fitting since prominent stellar absorption lines are observed. After the removal of star light, the IR SED of both Mrk 1239 and J1203+1624 can be fitted with a reddened AGN template. In the meantime, significant flux excesses are found in the UV-optical band after removing reddened (transmitted) AGN radiation and star light from the SED. The presumption that the flux excesses come from scattered AGN radiation is consistent with the high degree of polarization revealed in the spectropolarimetric observations. By comparing the flux excess in the UV-optical band (e.g., the cyan line in Figure 1) to the extinction-free AGN template (e.g., the grey line in Figure 1), the fraction of AGN radiation been scattered into our sightline is then estimated.
Table A1. Estimated physical conditions of the AGNs and host galaxies of the obscured NLS1s.
Wavelength CoverageTelescope/InstrumentDate of ObservationReferences
F11119+3257
3610–10,390 [Å]SDSS/BOSSMar 2013[36]
9800–24,500 [Å]P200/TSpec24 Feb 2013[24]
Mrk 1239
4000–7600 [Å]6dFGS26 Apr 2004[22]
3350–7560 [Å]MMT/BC27 Dec 2011[30]
4200–8200 [Å]MMT/SPOL5 Apr 2016[30]
9800–24,500 [Å]P200/TSpec23 Feb 2013[30]
J120300.19+162443.7
3100–9180 [Å]SDSS17 Apr 2007[19]
3350–5100 [Å]MMT/BC27 Dec 2011[25]
8770–9520 [Å]MMT/BC29 Feb 2012[25]
3200–10,200 [Å]MMT/BC1 Feb 2012[25]
9800–24,500 [Å]P200/TSpec23 Feb 2013[25]
4200–8200 [Å]MMT/SPOL5 Apr 2016[25]

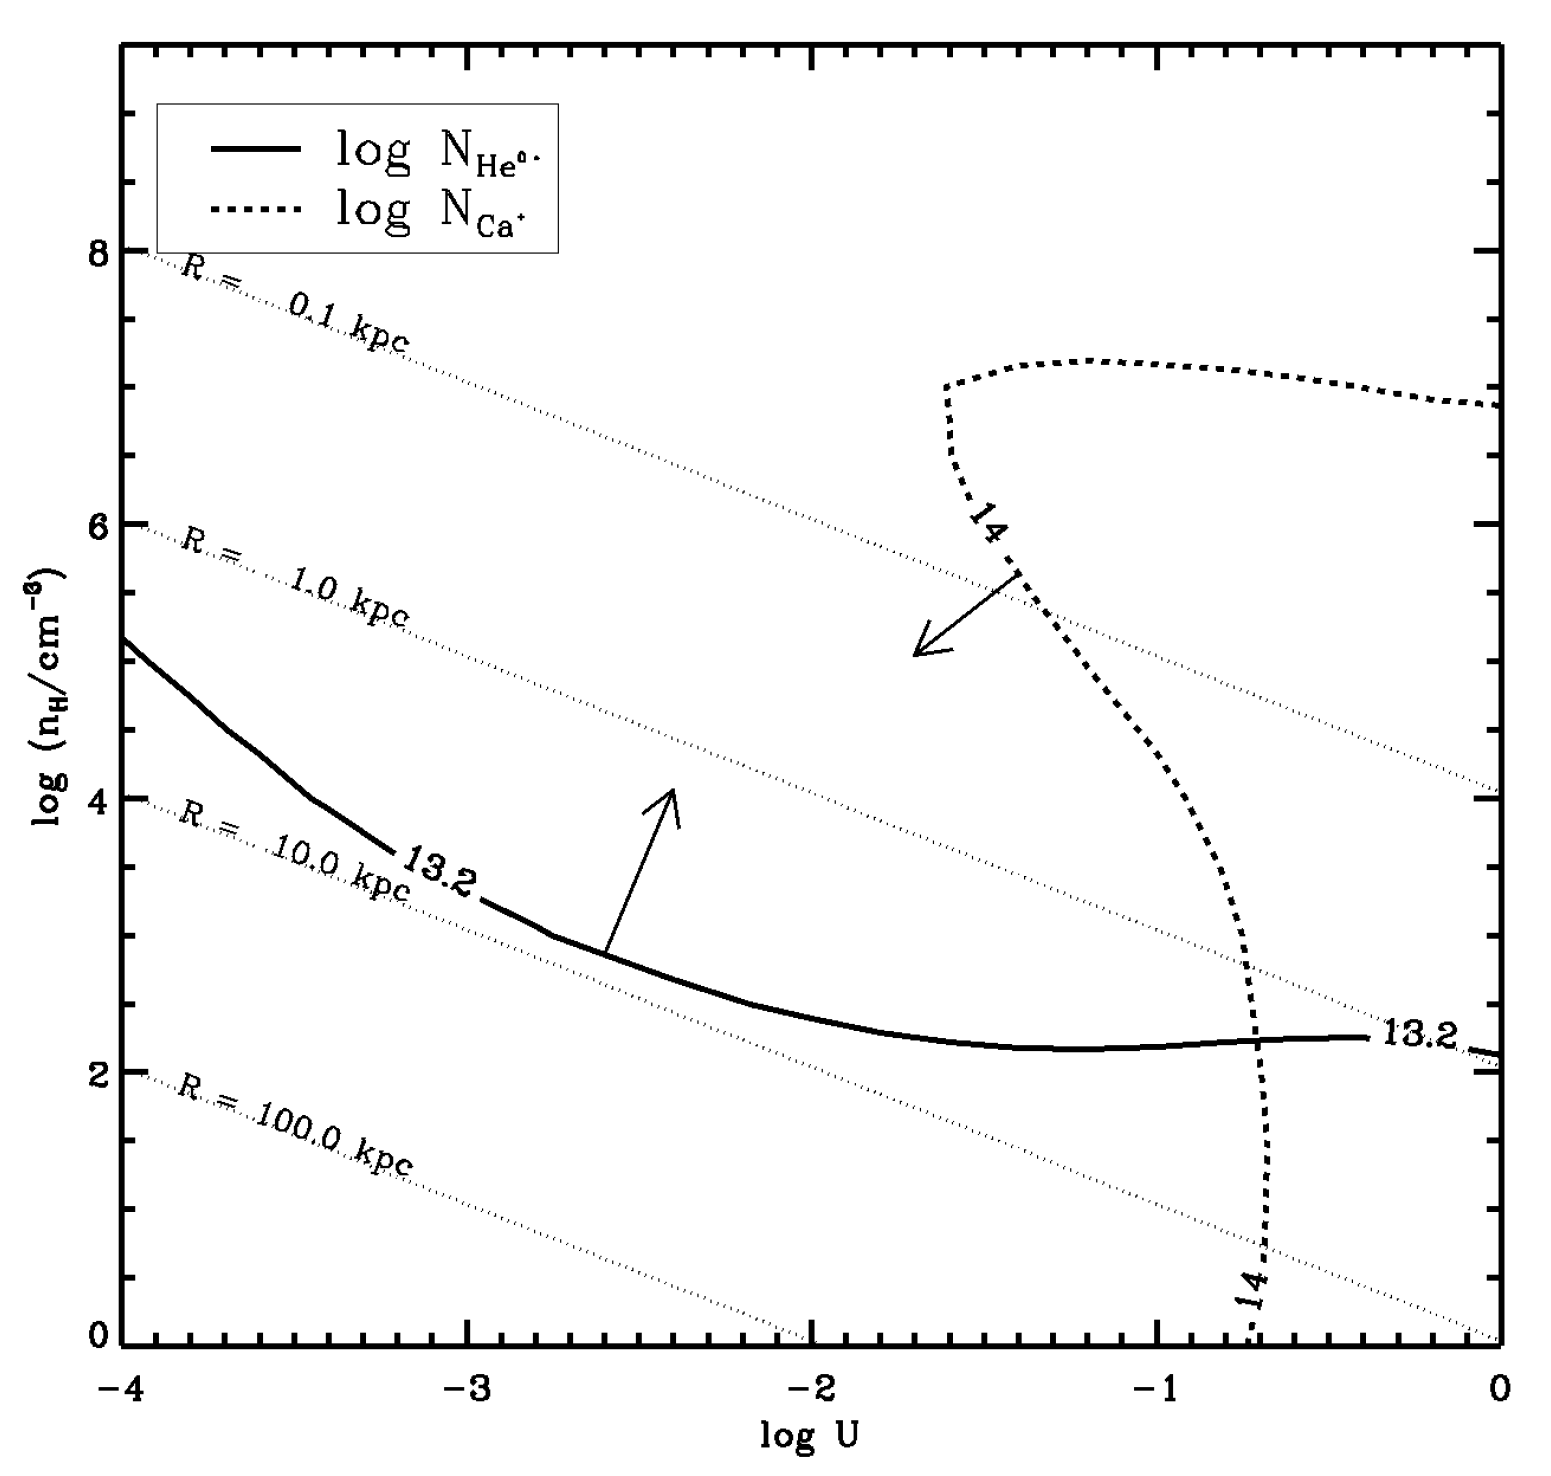
Appendix B. Photoionization Modelling

With the detection of several blueshifted absorption lines, the photoionization processes in the outflowing gas can be approximated with CLOUDY simulations [37]. As an example, the most reliable absorption line measured in F11119+3257 is based on the Na   I   λ λ 5891,5897 doublet, i.e., log N Na 0 / cm 2 = 13.7 ± 0.1 . We thus assume a gas slab with a neutral sodium column density of N Na 0 / cm 2 = 13 . 7 ± 0 . 1 for the outflowing gas, photoionized by an incident AGN radiation at a luminosity of L bol = 10 12 . 6 L . A series of CLOUDY simulations with ionization parameter U ranging from 10−4 to 1 and hydrogen number density n H ranging from 1 cm−3 to 1010 cm−3 are carried out. The column densities measured from BALs in F11119+3257 are then compare with the model predictions in Figure A1. Photoionization simulations indicate that the outflow locates at a distance scale of ∼[1,10] kpc to the central AGN if a number density of n H 10 2 cm 3 [38] is assumed. With the detection of blueshifted emission lines, physical conditions of the outflow material in F11119+3257 can be diagnosed in further details with photoionization simulations [24].
Figure A1. Comparison between the measured BAL column densities in F11119+3257 with CLOUDY simulations is shown. The lower limit of log N He 0 ( 2 3 S ) / cm 2 > 13.2 is indicated with solid lines and the upper limit of log N Ca + < 10 14 . 0 cm 2 is indicated with dashed lines. Distances of the cloud in the parameter space to the illuminant AGN are shown with dotted lines.
Universe 06 00073 g0a1

References

  1. Khachikian, E.Y.; Weedman, D.W. An atlas of Seyfert galaxies. Astrophys. J. 1974, 192, 581–589. [Google Scholar] [CrossRef]
  2. Osterbrock, D.E.; Koski, A.T. NGC 4151 and Markarian 6—Two intermediate-type Seyfert galaxies. Mon. Not. R. Astron. Soc. 1976, 176, 61P–66P. [Google Scholar] [CrossRef] [Green Version]
  3. Antonucci, R. Unified models for active galactic nuclei and quasars. Annu. Rev. Astron. Astrophys. 1993, 31, 473–521. [Google Scholar] [CrossRef]
  4. Zhou, H.; Wang, T.; Yuan, W.; Lu, H.; Dong, X.; Wang, J.; Lu, Y. A Comprehensive Study of 2000 Narrow Line Seyfert 1 Galaxies from the Sloan Digital Sky Survey. I. The Sample. Astrophys. J. Suppl. Ser. 2006, 166, 128–153. [Google Scholar] [CrossRef] [Green Version]
  5. Osterbrock, D.E.; Pogge, R.W. The spectra of narrow-line Seyfert 1 galaxies. Astrophys. J. 1985, 297, 166–176. [Google Scholar] [CrossRef]
  6. Leighly, K.M. A Comprehensive Spectral and Variability Study of Narrow-Line Seyfert 1 Galaxies Observed by ASCA. I. Observations and Time Series Analysis. Astrophys. J. Suppl. Ser. 1999, 125, 297–316. [Google Scholar] [CrossRef] [Green Version]
  7. Leighly, K.M. A Comprehensive Spectral and Variability Study of Narrow-Line Seyfert 1 Galaxies Observed by ASCA. II. Spectral Analysis and Correlations. Astrophys. J. Suppl. Ser. 1999, 125, 317–348. [Google Scholar] [CrossRef] [Green Version]
  8. Jin, C.; Ward, M.; Done, C. A combined optical and X-ray study of unobscured type 1 active galactic nuclei—II. Relation between X-ray emission and optical spectra. Mon. Not. R. Astron. Soc. 2012, 422, 3268–3284. [Google Scholar] [CrossRef] [Green Version]
  9. Jin, C.; Ward, M.; Done, C. A combined optical and X-ray study of unobscured type 1 active galactic nuclei—III. Broad-band SED properties. Mon. Not. R. Astron. Soc. 2012, 425, 907–929. [Google Scholar] [CrossRef]
  10. Nagar, N.M.; Oliva, E.; Marconi, A.; Maiolino, R. NGC 5506 unmasked as a Narrow Line Seyfert 1: A direct view of the broad line region using near-IR spectroscopy. Astron. Astrophys. 2002, 391, L21–L24. [Google Scholar] [CrossRef]
  11. Ramos Almeida, C.; Pérez García, A.M.; Acosta-Pulido, J.A.; González-Martín, O. Unveiling the Narrow-Line Seyfert 1 Nature of Markarian 573 Using Near-Infrared Spectroscopy. Astrophys. J. 2008, 680, L17. [Google Scholar] [CrossRef]
  12. Komossa, S.; Voges, W.; Xu, D.; Mathur, S.; Adorf, H.-M.; Lemson, G.; Duschl, W.J.; Grupe, D. Radio-loud Narrow-Line Type 1 Quasars. Astron. J. 2006, 132, 531–545. [Google Scholar] [CrossRef] [Green Version]
  13. Rakshit, S.; Stalin, C.S.; Chand, H.; Zhang, X.-G. A Catalog of Narrow Line Seyfert 1 Galaxies from the Sloan Digital Sky Survey Data Release 12. Astrophys. J. Suppl. Ser. 2017, 229, 39. [Google Scholar] [CrossRef]
  14. Zhang, S.; Zhou, H.; Shi, X.; Liu, W.; Pan, X.; Jiang, N.; Ji, T.; Jiang, P.; Wang, S. Reddening and He   I   *λ10830 Absorption Lines in Three Narrow-line Seyfert 1 Galaxies. Astrophys. J. 2017, 845, 126. [Google Scholar] [CrossRef] [Green Version]
  15. Vanden Berk, D.E.; Richards, G.T.; Bauer, A.; Strauss, M.A.; Schneider, D.P.; Heckman, T.M.; York, D.G.; Hall, P.B.; Fan, X.; Knapp, G.R.; et al. Composite Quasar Spectra from the Sloan Digital Sky Survey. Astron. J. 2001, 122, 549–564. [Google Scholar] [CrossRef]
  16. Glikman, E.; Helfand, D.J.; White, R.L. A Near-Infrared Spectral Template for Quasars. Astrophys. J. 2006, 640, 579–591. [Google Scholar] [CrossRef]
  17. Netzer, H.; Lutz, D.; Schweitzer, M.; Contursi, A.; Sturm, E.; Tacconi, L.J.; Veilleux, S.; Kim, D.-C.; Rupke, D.; Baker, A.J.; et al. Spitzer Quasar and ULIRG Evolution Study (QUEST). II. The Spectral Energy Distributions of Palomar-Green Quasars. Astrophys. J. 2007, 666, 806–816. [Google Scholar] [CrossRef] [Green Version]
  18. Morrissey, P.; Conrow, T.; Barlow, T.A.; Small, T.; Seibert, M.; Wyder, T.K.; Budavári, T.; Arnouts, S.; Friedman, P.G.; Forster, K.; et al. The Calibration and Data Products of GALEX. Astrophys. J. Suppl. Ser. 2007, 173, 682–697. [Google Scholar] [CrossRef] [Green Version]
  19. York, D.G.; Adelman, J.; Anderson, J.E.; Anderson, S.F.; Annis, J.; Bahcall, N.A.; Bakken, J.A.; Barkhouser, R.; Bastian, S.; Berman, E.; et al. The Sloan Digital Sky Survey: Technical Summary. Astron. J. 2000, 120, 1579–1587. [Google Scholar] [CrossRef]
  20. Skrutskie, M.F.; Cutri, R.M.; Stiening, R.; Weinberg, M.D.; Schneider, S.; Carpenter, J.M.; Beichman, C.; Capps, R.; Chester, T.; Elias, J.; et al. The Two Micron All Sky Survey (2MASS). Astron. J. 2006, 131, 1163–1183. [Google Scholar] [CrossRef]
  21. Wright, E.L.; Eisenhardt, P.R.M.; Mainzer, A.K.; Ressler, M.E.; Cutri, R.M.; Jarrett, T.; Kirkpatrick, J.D.; Padgett, D.; McMillan, R.S.; Skrutskie, M.; et al. The Wide-field Infrared Survey Explorer (WISE): Mission Description and Initial On-orbit Performance. Astron. J. 2010, 140, 1868–1881. [Google Scholar] [CrossRef]
  22. Jones, D.H.; Read, M.A.; Saunders, W.; Colless, M.; Jarrett, T.; Parker, Q.A.; Fairall, A.P.; Mauch, T.; Sadler, E.M.; Watson, F.G.; et al. The 6dF Galaxy Survey: Final redshift release (DR3) and southern large-scale structures. Mon. Not. R. Astron. Soc. 2009, 399, 683–698. [Google Scholar] [CrossRef]
  23. Martin, N.; Maurice, E.; Lequeux, J. The structure of the Small Magellanic Cloud. Astron. Astrophys. 1989, 215, 219–242. [Google Scholar]
  24. Pan, X.; Zhou, H.; Liu, W.; Liu, B.; Ji, T.; Shi, X.; Zhang, S.; Jiang, P.; Wang, H.; Hao, L. Discovery of Metastable He   I * λ10830 Mini-broad Absorption Lines and Very Narrow Paschen α Emission Lines in the ULIRG Quasar IRAS F11119+3257. Astrophys. J. 2019, 883, 173. [Google Scholar] [CrossRef] [Green Version]
  25. Pan, X.; Lu, H.; Komossa, S.; Xu, D.; Yuan, W.; Sun, L.; Smith, P.S.; Zhang, S.; Jiang, P.; Yang, C.; et al. A Deeply Buried Narrow-line Seyfert 1 Nucleus Uncovered in Scattered Light. Astrophys. J. 2019, 870, 75. [Google Scholar] [CrossRef]
  26. Liu, W.-J.; Zhou, H.; Ji, T.; Yuan, W.; Wang, T.-G.; Jian, G.; Shi, X.; Zhang, S.; Jiang, P.; Shu, X.; et al. A Comprehensive Study of Broad Absorption Line Quasars. I. Prevalence of He   I * Absorption Line Multiplets in Low-ionization Objects. Astrophys. J. Suppl. Ser. 2015, 217, 11. [Google Scholar] [CrossRef] [Green Version]
  27. Goodrich, R.W.; Miller, J.S. Spectropolarimetry of the Unusual High-Polarization Quasar OI 287. Astrophys. J. 1988, 331, 332. [Google Scholar] [CrossRef]
  28. Bruzual, G.; Charlot, S. Stellar population synthesis at the resolution of 2003. Mon. Not. R. Astron. Soc. 2003, 344, 1000–1028. [Google Scholar] [CrossRef] [Green Version]
  29. Dewangan, G.C.; Griffiths, R.E. Type 2 Counterparts of Narrow-Line Seyfert 1 Galaxies. Astrophys. J. 2005, 625, L31–L34. [Google Scholar] [CrossRef] [Green Version]
  30. Pan, X.; Zhou, H.; Sun, L.; Smith, P.; Yang, C.; Ji, T.; Jiang, N.; Jiang, P.; Liu, W.; Lu, H.; et al. Extinction, Absorption, and Reflection in A Prototype Narrow-Line Seyfert 1, Mrk 1239. Astrophys. J. 2020, submitted. [Google Scholar]
  31. Ramos Almeida, C.; Levenson, N.A.; Rodríguez Espinosa, J.M.; Alonso-Herrero, A.; Asensio Ramos, A.; Radomski, J.T.; Packham, C.; Fisher, R.S.; Telesco, C.M. The Infrared Nuclear Emission of Seyfert Galaxies on Parsec Scales: Testing the Clumpy Torus Models. Astrophys. J. 2009, 702, 1127–1149. [Google Scholar] [CrossRef] [Green Version]
  32. Young, S.; Axon, D.J.; Robinson, A.; Hough, J.H.; Smith, J.E. The rotating wind of the quasar PG 1700+518. Nature 2007, 450, 74–76. [Google Scholar] [CrossRef] [PubMed] [Green Version]
  33. Kormendy, J.; Ho, L.C. Coevolution (Or Not) of Supermassive Black Holes and Host Galaxies. Annu. Rev. Astron. Astrophys. 2013, 51, 511–653. [Google Scholar] [CrossRef] [Green Version]
  34. Drake, A.J.; Djorgovski, S.G.; Mahabal, A.; Beshore, E.; Larson, S.; Graham, M.J.; Williams, R.; Christensen, E.; Catelan, M.; Boattini, A.; et al. First Results from the Catalina Real-Time Transient Survey. Astrophys. J. 2009, 696, 870–884. [Google Scholar] [CrossRef]
  35. Schmidt, G.D.; Stockman, H.S.; Smith, P.S. Discovery of a Sub-Megagauss Magnetic White Dwarf through Spectropolarimetry. Astrophys. J. 1992, 398, L57. [Google Scholar] [CrossRef]
  36. Ahn, C.P.; Alexandroff, R.; Allende Prieto, C.; Anders, F.; Anderson, S.F.; Anderton, T.; Andrews, B.H.; Aubourg, É.; Bailey, S.; Bastien, F.A.; et al. The Tenth Data Release of the Sloan Digital Sky Survey: First Spectroscopic Data from the SDSS-III Apache Point Observatory Galactic Evolution Experiment. Astrophys. J. Suppl. Ser. 2014, 211, 17. [Google Scholar] [CrossRef]
  37. Ferland, G.J.; Korista, K.T.; Verner, D.A.; Ferguson, J.W.; Kingdon, J.B.; Verner, E.M. CLOUDY 90: Numerical Simulation of Plasmas and Their Spectra. Publ. Astron. Soc. Pac. 1998, 110, 761–778. [Google Scholar] [CrossRef]
  38. Tombesi, F.; Meléndez, M.; Veilleux, S.; Reeves, J.N.; González-Alfonso, E.; Reynolds, C.S. Wind from the black-hole accretion disk driving a molecular outflow in an active galaxy. Nature 2015, 519, 436–438. [Google Scholar] [CrossRef]
Figure 1. (a) SEDs of typical obscured NLS1s are significantly suppressed in the UV-optical band as compared to the SED of composite quasar [14] (black line). The SED of F11119+3257 (green dots) and Mrk 1239 (blue triangles) in the IR are similar to the SED of composite quasar reddened at an extinction of EB–V ∼1 (grey line), and the SED in the mid-IR (λ > 3 μm) of the NLS2 J1203+1624 (red squares) is similar to that of composite quasar reddened at a large color excess of EB–V ∼10 (light grey line). (b) The SED of the NLS2 J1203+1624 (red squares) consists of a deeply obscured nucleus (magenta line) that dominates in the mid-IR, a single SSP (simple stellar population) for star lights from host galaxy (orange lines), and a scattered AGN component in the UV-optical band (cyan line). Panel (b) is reproduced based on Figure 4 in [25].
Universe 06 00073 g001
Figure 2. Examples of absorption lines in obscured NLS1s. The observed spectra (black lines) around the absorption lines are compared with pair-matching [26] absorption-free models (red lines) and their uncertainties at 1 σ confidence level (pink lines) in the left panels. The normalized fluxes for the absorption lines are in the right panels. From upside down, the absorption lines are: (1a,1b) show Na   I   λ λ 5891, 5897 broad absorption line (BAL) blend of F11119+3257, (2a,2b) show He   I   * λ 10830 BAL of F11119+3257, (3a,3b) show He   I   λ 10830 BAL of Mrk 1239. Panel (1a,1b,2a,2b) are reproduced based on Figure 6 in [24].
Universe 06 00073 g002
Figure 3. The polarized flux spectrum and the distribution of degree of polarization P of J1203+1624 are shown in (1a) and (1b) respectively. The polarized flux spectrum and the distribution of degree of polarization P of Mrk 1239 are shown in (2a) and (2b) respectively. Panel (1a,1b) are reproduced based on Figure 5 in [25].
Universe 06 00073 g003
Figure 4. A schematic cartoon in the left illustrates the radiative processes in an obscured AGN with strong scattering processes (e.g., J1203+1624). The incident AGN radiation (magenta lines) is significantly reddened by obscurers (e.g., dusty torus). Scattering clouds around AGNs can reflect radiation (cyan lines) into our sightlines, which provides us an additional view of the accretion disks and BELRs in type-II AGNs. On the other hand, the star light from host galaxy, which is relatively weak in normal high luminosity NLS1s, can also be observed.
Universe 06 00073 g004
Table 1. Estimated physical conditions of the AGNs and host galaxies of the obscured NLS1s.
Object Name FWHM BELs km s−1 L bol L EB–V
mag
M M L bol / L Edd M * M References
F11119+3257198010 12.6 ≈1.21.0 0.2 + 0.4 × 10 8 ≈1-[24]
Mrk 1239 910 ± 30 10 11.8 ≈1.66.4  ± 0.4 × 10 6 ≈0.6 1.5 × 10 9 [30]
J120300.19+162443.7 1270 ± 20 10 12.1 ∼10< 2.7 × 10 7 >1.5 7.7 × 10 9 [25]
NGC 5506180010 10.8 ∼25.3 0.1 + 0.1 × 10 6 ∼0.1-[10], this paper
Mrk 573 1700 ± 400 10 11.0 ∼3.5 7 × 10 6 ∼0.1-[11,31], this paper
L bol : bolometric luminosities of the AGN, in units of solar luminosity L . EB–V: B–V Color excess estimated based on fitting the transmitted AGN component. M : masses estimated for the supper massive black holes, in units of solar mass M . M * : stellar masses estimated for the host galaxies, in units of solar mass M .

