Correlation of Heavy and Light Flavors in Simulations †


1
Department of Physics, Budapest University of Technology and Economics, Műegyetem rkp. 3, 1111 Budapest, Hungary
2
Wigner Research Centre for Physics, Konkoly-Thege Miklós út 29-33, 1121 Budapest, Hungary
*
Author to whom correspondence should be addressed.
†
This paper is based on the talk at the 18th Zimányi School, Budapest, Hungary, 3–7 December 2018.
Universe 2019, 5(5), 118; https://doi.org/10.3390/universe5050118
Submission received: 25 March 2019
/
Revised: 15 May 2019
/
Accepted: 16 May 2019
/
Published: 20 May 2019
(This article belongs to the Special Issue The Zimányi School and Analytic Hydrodynamics in High Energy Physics)
Abstract
:The ALICE experiment at the Large Hadron Collider (LHC) ring is designed to study the strongly interacting matter at extreme energy densities created in high-energy heavy-ion collisions. In this paper we investigate correlations of heavy and light flavors in simulations at LHC energies at mid-rapidity, with the primary purpose of proposing experimental applications of these methods. Our studies have shown that investigating the correlation images can aid the experimental separation of heavy quarks and help understanding the physics that create them. The shape of the correlation peaks can be used to separate the electrons stemming from b quarks. This could be a method of identification that, combined with identification in silicon vertex detectors, may provide much better sample purity for examining the secondary vertex shift. Based on a correlation picture it is also possible to distinguish between prompt and late contributions to D meson yields.
1. Introduction
Quark-gluon plasma (QGP) is a state of matter which exists at extremely high temperatures and densities, where quarks are no longer confined to hadrons [1]. Initially, the Universe was filled with this hot and dense matter. Quark-gluon plasma can be recreated in high-energy heavy-ion collisions at large accelerator rings such as the LHC.
The angular correlation data of the STAR experiment [2] shows a strong suppression of the away-side correlation peak in central Au+Au collisions, while no such effect can be observed in p+p collisions. This indicates a strong quenching of jets that traverse the QGP. In the case of d+Au collision, we do not experience jet-suppression even though there is cold hadronic nuclear matter present. It was among the first convincing shreds of evidence of hot and dense strongly interacting nuclear matter in the final state. The interaction of partons with quark–gluon plasma is often studied by full jet reconstruction. However, in heavy-ion collisions, high background from the underlying event makes it difficult to reconstruct jets below a certain momentum. Measuring the angular correlation of particles is a technique that solves this problem. Comparison of angular correlations in small and large collision systems reveals information of jet modification by the strongly interacting medium.
Heavy-flavor (charm and beauty) quarks are an excellent tool to study heavy-ion collisions. Most of them are created in the initial stages of the reaction, and their long lifetime ensures that they interact both with the hot and dense medium as well as with the cold hadronic matter before they decay. Identifying characteristic correlation images of heavy and light quarks can help understand flavor-dependent fragmentation. Furthermore, finding these characteristic shapes can be used as an alternative method to pin down feed-down of beauty hadrons into charm without the need to find the secondary vertex. We carried out studies with the PYTHIA 8.1 Monte Carlo event generator [3] to compare the near-side and away-side correlation peaks associated with hadrons from different heavy quarks from a given . The following simulation results serve as a case study that the techniques we developed can be successfully applied in today’s large experiments such as ALICE at the LHC to aid and interpret heavy-flavor correlation measurements.
2. Analysis Method
We used the PYTHIA 8.1 Monte Carlo event generator [3] to simulate hard QCD events using the default Monash 2013 [4] settings for LHC p + p data. Five million p − p collision events were simulated at a time, at the center-of-mass energy of TeV. The phase space has been reduced so that the leading hard process has at least 5 GeV/c momentum. Heavy flavor scale settings were used similarly to recent STAR analyses, e.g., that in [5]. For beauty and charm simulations, only the two-to-two processes were enabled ( and , as well as and , respectively), while light hadron correlations were simulated by allowing all hard quantum color dynamics processes.
The variables we use to describe particle kinematics are the three-momentum (), the azimuth angle () and the pseudorapidity (, where is the transverse momentum).
To examine the correlation of particles, we followed a technique similar to [6]. We selected a trigger particle from a given momentum () range, and associated particles from a lower momentum () window to examine all other particles from the same event. Then we calculated the differences in the azimuth angles as well as the pseudorapidities of the trigger and associated particles within each event. The plane () can be divided into two parts along : near-side and away-side peak region. We defined near-side as the range from to , and the away-side as the range from /2 to 3/2. Near-side correlations give information about the structure of jets since, after background subtraction, most trigger and associated particles come from the same jet. Differences between correlations of beauty, charm and light flavor provide valuable information about flavor-dependent jet fragmentation. Away-side correlation is mostly from back-to-back jet pairs and it is sensitive to the underlying hard processes.
We examined the width of fitted functions in the GeV/c trigger particle transverse momentum range, and in different associated particle transverse momentum () ranges ( GeV/c, GeV/c, GeV/c and GeV/c). In the latter case we ensured that > .
Correlation analyses usually use the mixed-event technique to correct for the finite size of the detector in [6]. However, at mid-rapidity it is sufficient to assume a uniform track distribution and therefore we apply a reweighting of events with a “tent-shaped” function where is the maximal acceptance in which tracks were recorded. In the analysis, we only used the ||< 1.6 range.
Processes that fulfilled the conditions of the central limit theorem yield Gaussian-shaped correlation peaks. In case of weakly decaying resonances corresponding to secondary vertices that can be displaced with several millimeters, however, the Gaussian shape is not necessarily adequate. Therefore we also apply a Generalized Gaussian fit on the near- and away-side correlation peaks. Gaussian functions of the different projections are
and the generalized Gaussian functions of the different projections are
where N is the normalization factor, is the width of the peak in the direction of , and is the width of the peak in the direction of .
The generalized Gaussian function has an extra parameter compared to the Gaussian. If = 1, then the generalized Gaussian function is an exponential function. If = 2, it was reduced to a regular Gaussian function. If was greater than two then the top of the function was flattened.
3. Results
3.1. Correlations of Light Charged Hadrons
As a first test we reproduced the near- and away-side correlation peaks of light charged hadrons (, , p and ) both in the and the directions. For all the particles we investigated in this study, we only examined the near-side peak in the direction of , and in the direction of we investigated both peaks. Below, the parameters were shown in different ranges.
The left panel in Figure 1 represents the peak in with near-side cut (||</2) with generalized Gaussian fit. The parameter was unity within uncertainties, indicating a distribution that was significantly sharper than Gaussian and consistent with an exponential function. The right panel in Figure 1 shows the near- and away-side peaks with Gaussian fits in direction. The shape of the peaks were well described by a Gaussian.
To get a more comprehensive picture, we also showed the fit parameters in function of . The left panel in Figure 2 shows the peak width for Gaussian fitting, while the right panel in Figure 2 shows the peak width for generalized Gaussian fitting and the parameter of the function. Error bars represent the uncertainties of the fit parameters. The correlation peaks of the light charged hadrons were getting narrower towards higher and was constant within uncertainties.
3.2. Prompt Production of Heavy Flavor Mesons
We examined the direct decay cases of D mesons from c quarks and B mesons from b quarks, without feed-down. In Figure 3 both peaks were consistent with a Gaussian. The only exception is B mesons with 5 < < 8 GeV, where the fit is significantly narrower than a Gaussian.
3.3. D Meson from the Decay of the B Meson
We investigated D mesons from the decay of B mesons. The left panel in Figure 4 shows a strong dependence of the away-side peak on (not observed in light flavor or prompt heavy flavor production). The right panel in Figure 4 decreases with , together with . (Peaks are getting both narrower and is less than two towards high ).
Based on Figure 3 and Figure 4, it is possible to distinguish between prompt D mesons and non-prompt D mesons from decays of B mesons. The statistical separation of these two contributions allows for the understanding of the flavor-dependence of heavy-quark energy loss within the Quark-gluon plasma. The effect of Quark-gluon plasma on heavy quarks can be investigated by the ratio of D meson from b quarks and c quarks.
3.4. Investigation of Electrons from B Mesons
We investigated the electrons from B mesons. Electrons can come directly from semileptonic B-decays, as well as semileptonic decays of charmed mesons that B feeds down into. Still, these branching ratios are in the order of a couple of percents [7], so the electron yield is relatively low. Therefore, the lack of statistics was a limit in the analysis. However, the results are suitable for drawing conclusions.
Figure 5 shows that correlations of B meson decay electron with hadron produce wider correlation peaks than in the c quark decay electron case. There’s no significant dependence of on and .
It can be assumed that the significant deviation of the peaks from Gaussian and the strong momentum dependence of the parameters can be traced back to the decay kinematics, in which the momentum of the b quark and the location of the secondary vertex play a role. It is a well-known phenomenon that long-range correlation components from long-lived resonances lead to Lévy-like distributions rather than Gaussian [8]. It seems possible to separate the electrons coming from B mesons simply by the shape of the correlation peaks. This could be a method of identification that, combined with particle identification based on secondary vertex reconstruction in silicon tracking detectors such as the ALICE ITS [9], may provide a much better sample purity than what we can currently achieve.
3.5. Comparison of B-Meson and b-Quark Correlations
Finally, we compared correlations of B mesons with hadrons to b quarks with hadrons. The b quarks were taken directly from parton-level Monte Carlo truth information. In an experiment, correlations with b quarks can be constructed by taking the jet axis of b-tagged jets [10], a process that is very problematic at low momenta, especially in heavy ion collisions. We expect that there will be no significant difference between the two, as the only source of B meson is the b quark decay, besides the b quark direction is close to the axis of the b-jet, and due to its large mass the direction of the b quark momentum will determine the direction of the B meson momentum. However, higher precision is needed to verify whether the away-side peak of b quark to hadron correlations follows a similar trend to the away-side peak of B meson to hadron correlations.
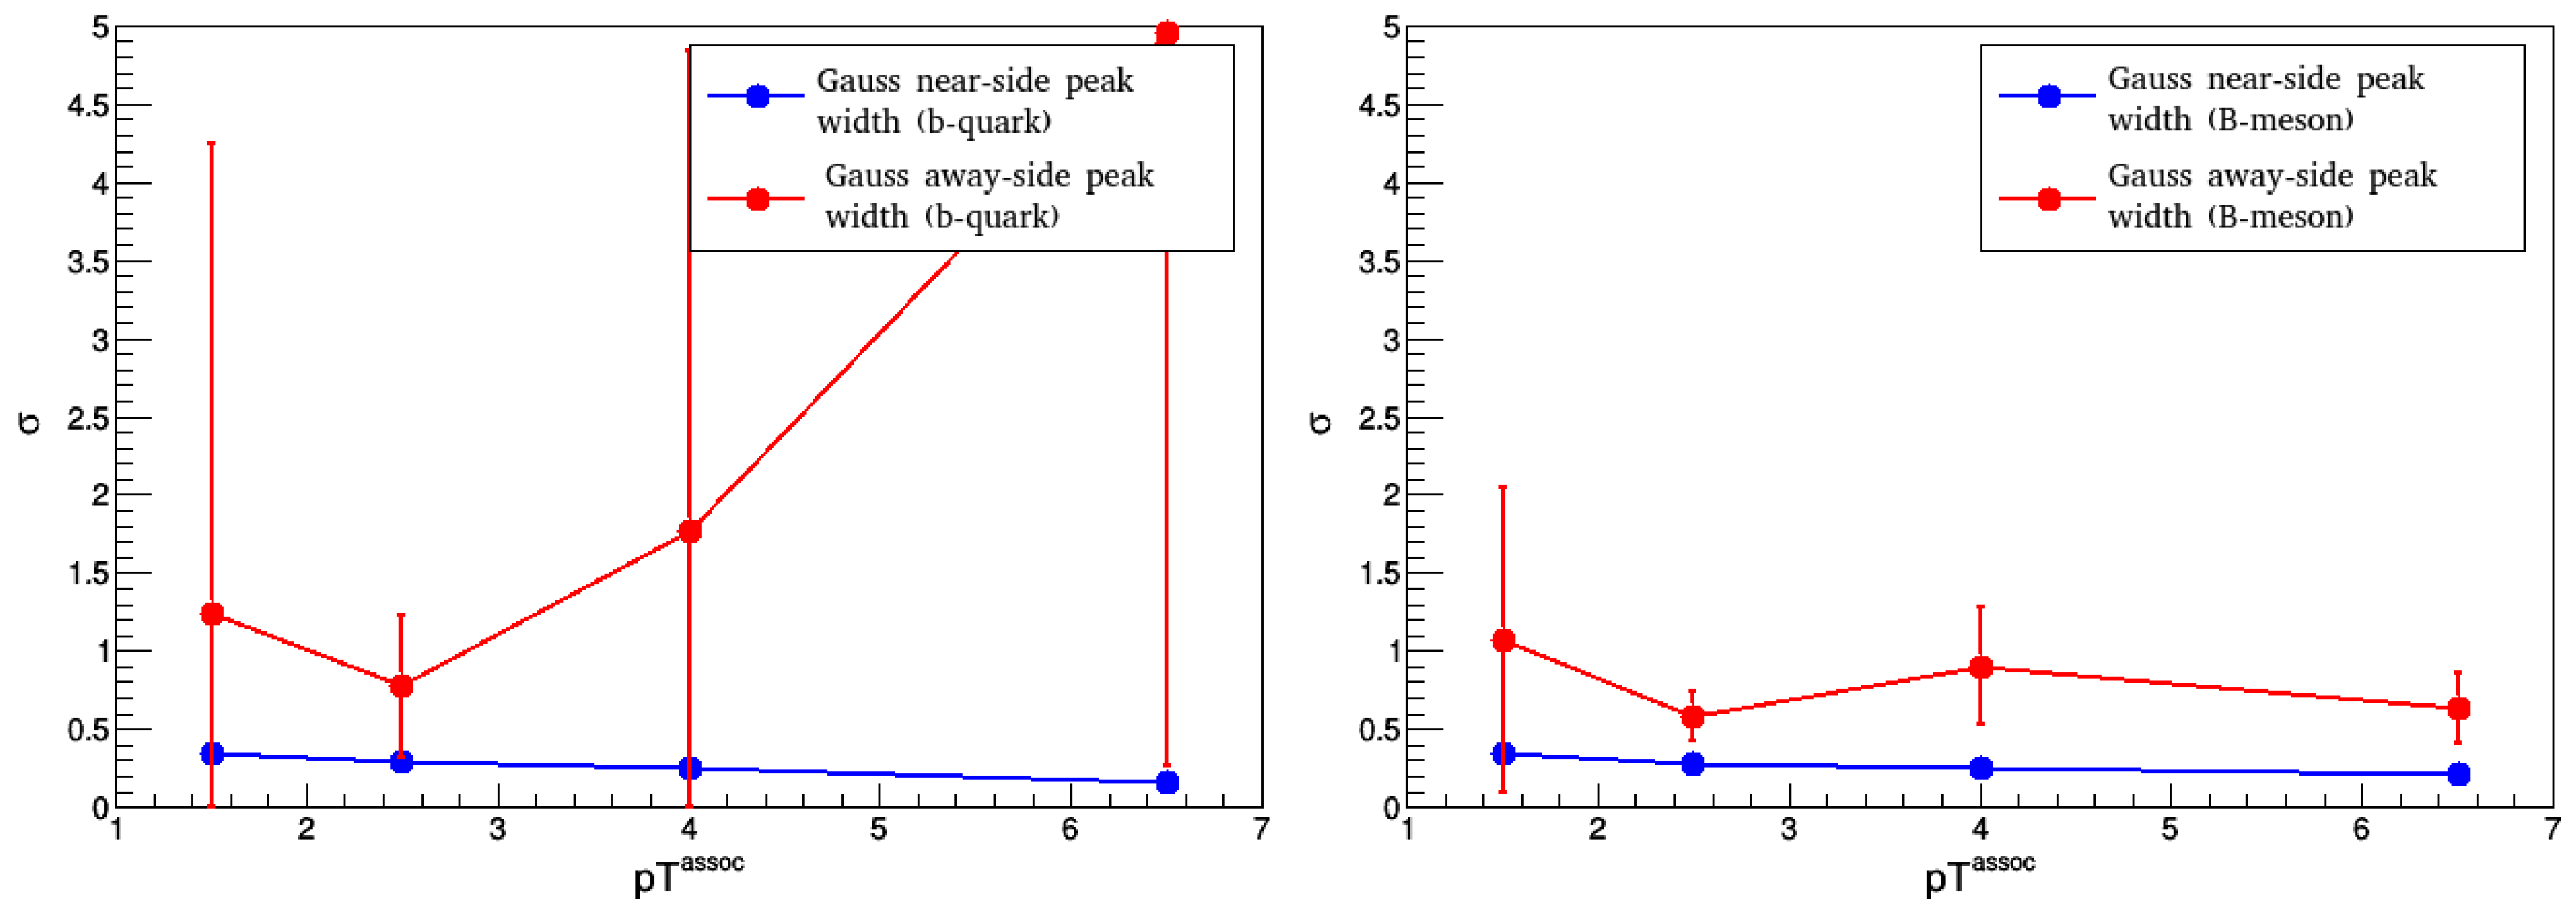
Figure 6 shows that evolution of correlation pictures with momentum match within uncertainties. We have a characteristic b correlation image, which is present in both b quarks and B mesons, which is further supports that the B meson is a good proxy for the b quark.
4. Conclusions
In summary, we have shown that a detailed analysis of heavy-flavor correlations can help in understanding flavor-dependent fragmentation as well as aid particle identification. The shape of the correlation peaks can be used to separate the electrons coming from b quark decays. This could be a method of identification that, combined with particle identification in secondary vertex detectors, may provide a much better sample purity than traditional methods. Correlation images are sensitive to the distribution of secondary vertices of heavy-quark decays, and the latter processes can be statistically separated from light quarks. Based on a correlation picture it is possible to distinguish between prompt D mesons and non-prompt D mesons from decays of B mesons. The statistical separation of these two contributions allows for the understanding of the flavor-dependence of heavy-quark energy loss within the quark-gluon plasma. We also see a characteristic b-correlation image, which is present in both b quarks and B mesons. B mesons can be used to study b quarks in the momentum regime where the reconstruction of b jets is not feasible.
Author Contributions
This research was carried out by E.F. under the supervision of R.V.
Funding
This work has been supported by the Hungarian National Research Fund (OTKA) grant K120660. Author RV thanks for the support of the János Bolyai fellowship of the Hungarian Academy of Sciences.
Conflicts of Interest
The author declares no conflict of interest.
References
- Shuryak, E.V. Quantum Chromodynamics and the Theory of Superdense Matter. Phys. Rep. 1980, 61, 71–158. [Google Scholar] [CrossRef]
- Adams, J.; et al.; [STAR Collaboration] Evidence from d+Au measurements for final state suppression of high pT hadrons in Au+Au collisions at RHIC. Phys. Rev. Lett. 2003, 91, 072304. [Google Scholar] [CrossRef] [PubMed]
- Sjostrand, T.; Mrenna, S.; Skands, P.Z. A Brief Introduction to PYTHIA 8.1. Comput. Phys. Commun. 2008, 178, 852–867. [Google Scholar] [CrossRef]
- Skands, P.; Carrazza, S.; Rojo, J. Tuning PYTHIA 8.1: The Monash 2013 Tune. Eur. Phys. J. C 2014, 74, 3024. [Google Scholar] [CrossRef]
- Adamczyk, L.; et al.; [STAR Collaboration] Υ production in U + U collisions at = 193 GeV measured with the STAR experiment. Phys. Rev. C 2016, 6, 064904. [Google Scholar] [CrossRef]
- Adam, J.; et al.; [ALICE Collaboration] Anomalous evolution of the near-side jet peak shape in Pb-Pb collisions at = 2.76 TeV. Phys. Rev. Lett. 2017, 119, 102301. [Google Scholar] [CrossRef] [PubMed]
- Tanabashi, M.; et al.; [Particle Data Group] Review of Particle Physics. Phys. Rev. D 2018, 98, 030001. [Google Scholar] [CrossRef]
- Vértesi, R.; [PHENIX Collaboration]. THERMINATOR simulations and PHENIX images of a heavy tail of particle emission in 200-GeV Au+Au collisions. In Proceedings of the 23rd Winter Workshop on Nuclear Dynamics, Big Sky, MT, USA, 11–18 February 2007; Bauer, W., Bellwied, R., Harris, J.W., Eds.; EP Systema: Budapest, Hungary, 2007. [Google Scholar]
- Yang, P.; Aglieri, G.; Cavicchioli, C.; Chalmet, P.L.; Chanlek, N.; Collu, A.; Gao, C.; Hillemanns, H.; Huang, G.; Junique, A.; et al. MAPS development for the ALICE ITS upgrade. J. Instrum. 2015, 10, C03030. [Google Scholar] [CrossRef]
- Jung, K.; [CMS Collaboration]. Measurements of b-jet Nuclear Modification Factors in pPb and PbPb Collisions with CMS. Nucl. Phys. A 2014, 931, 470–474. [Google Scholar] [CrossRef]
Figure 1.
The peak in with near-side cut (|| < /2) of light charged hadrons with generalized Gaussian fitting (on the left side) and the near-and away-side peaks of light charged hadrons in plane with Gaussian fitting (on the right side).
Figure 1.
The peak in with near-side cut (|| < /2) of light charged hadrons with generalized Gaussian fitting (on the left side) and the near-and away-side peaks of light charged hadrons in plane with Gaussian fitting (on the right side).
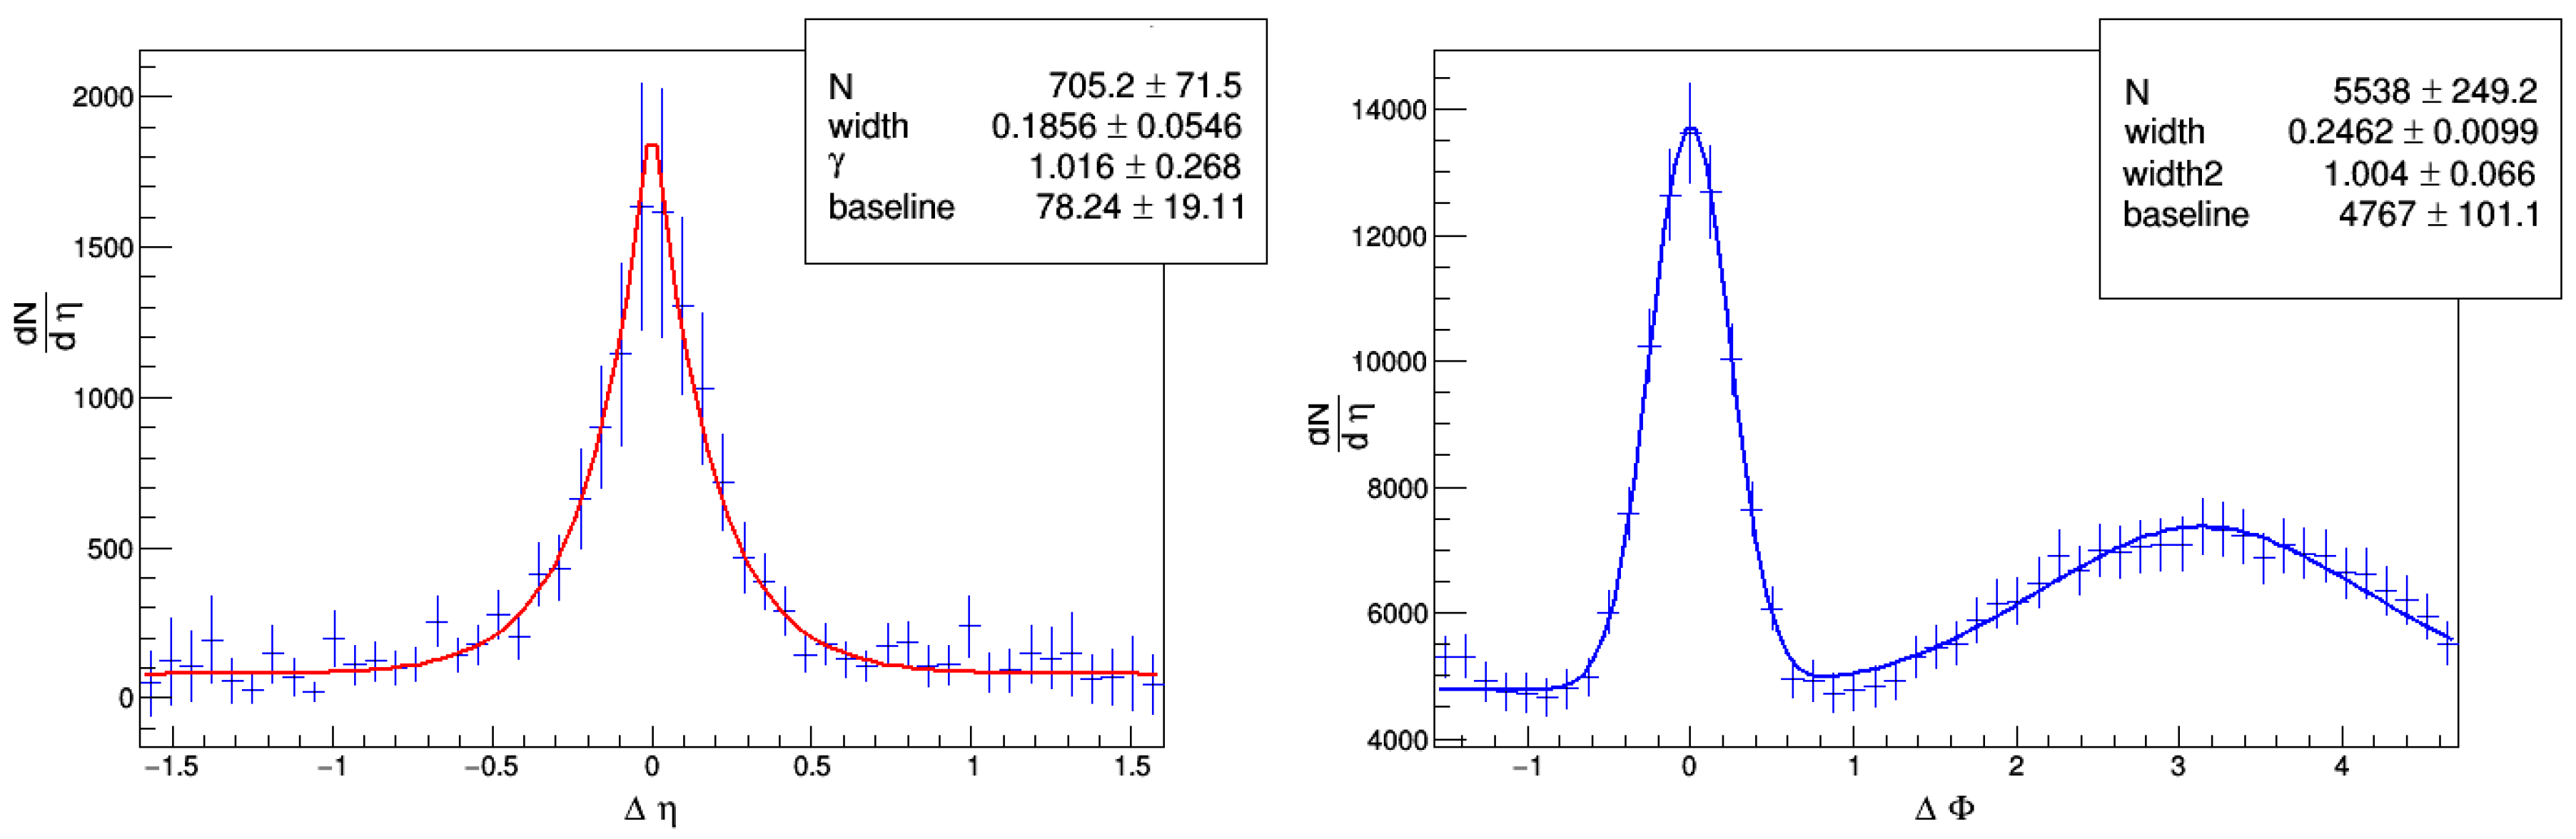
Figure 2.
The peak width for Gaussian fitting (on the left side) and for generalized Gaussian fitting (on the right side) for 5 < < 8 GeV/c and different values.
Figure 2.
The peak width for Gaussian fitting (on the left side) and for generalized Gaussian fitting (on the right side) for 5 < < 8 GeV/c and different values.

Figure 3.
B mesons from b quarks(on the left side) and D mesons from c quarks (on the right side) and for GeV/c and different values.
Figure 3.
B mesons from b quarks(on the left side) and D mesons from c quarks (on the right side) and for GeV/c and different values.
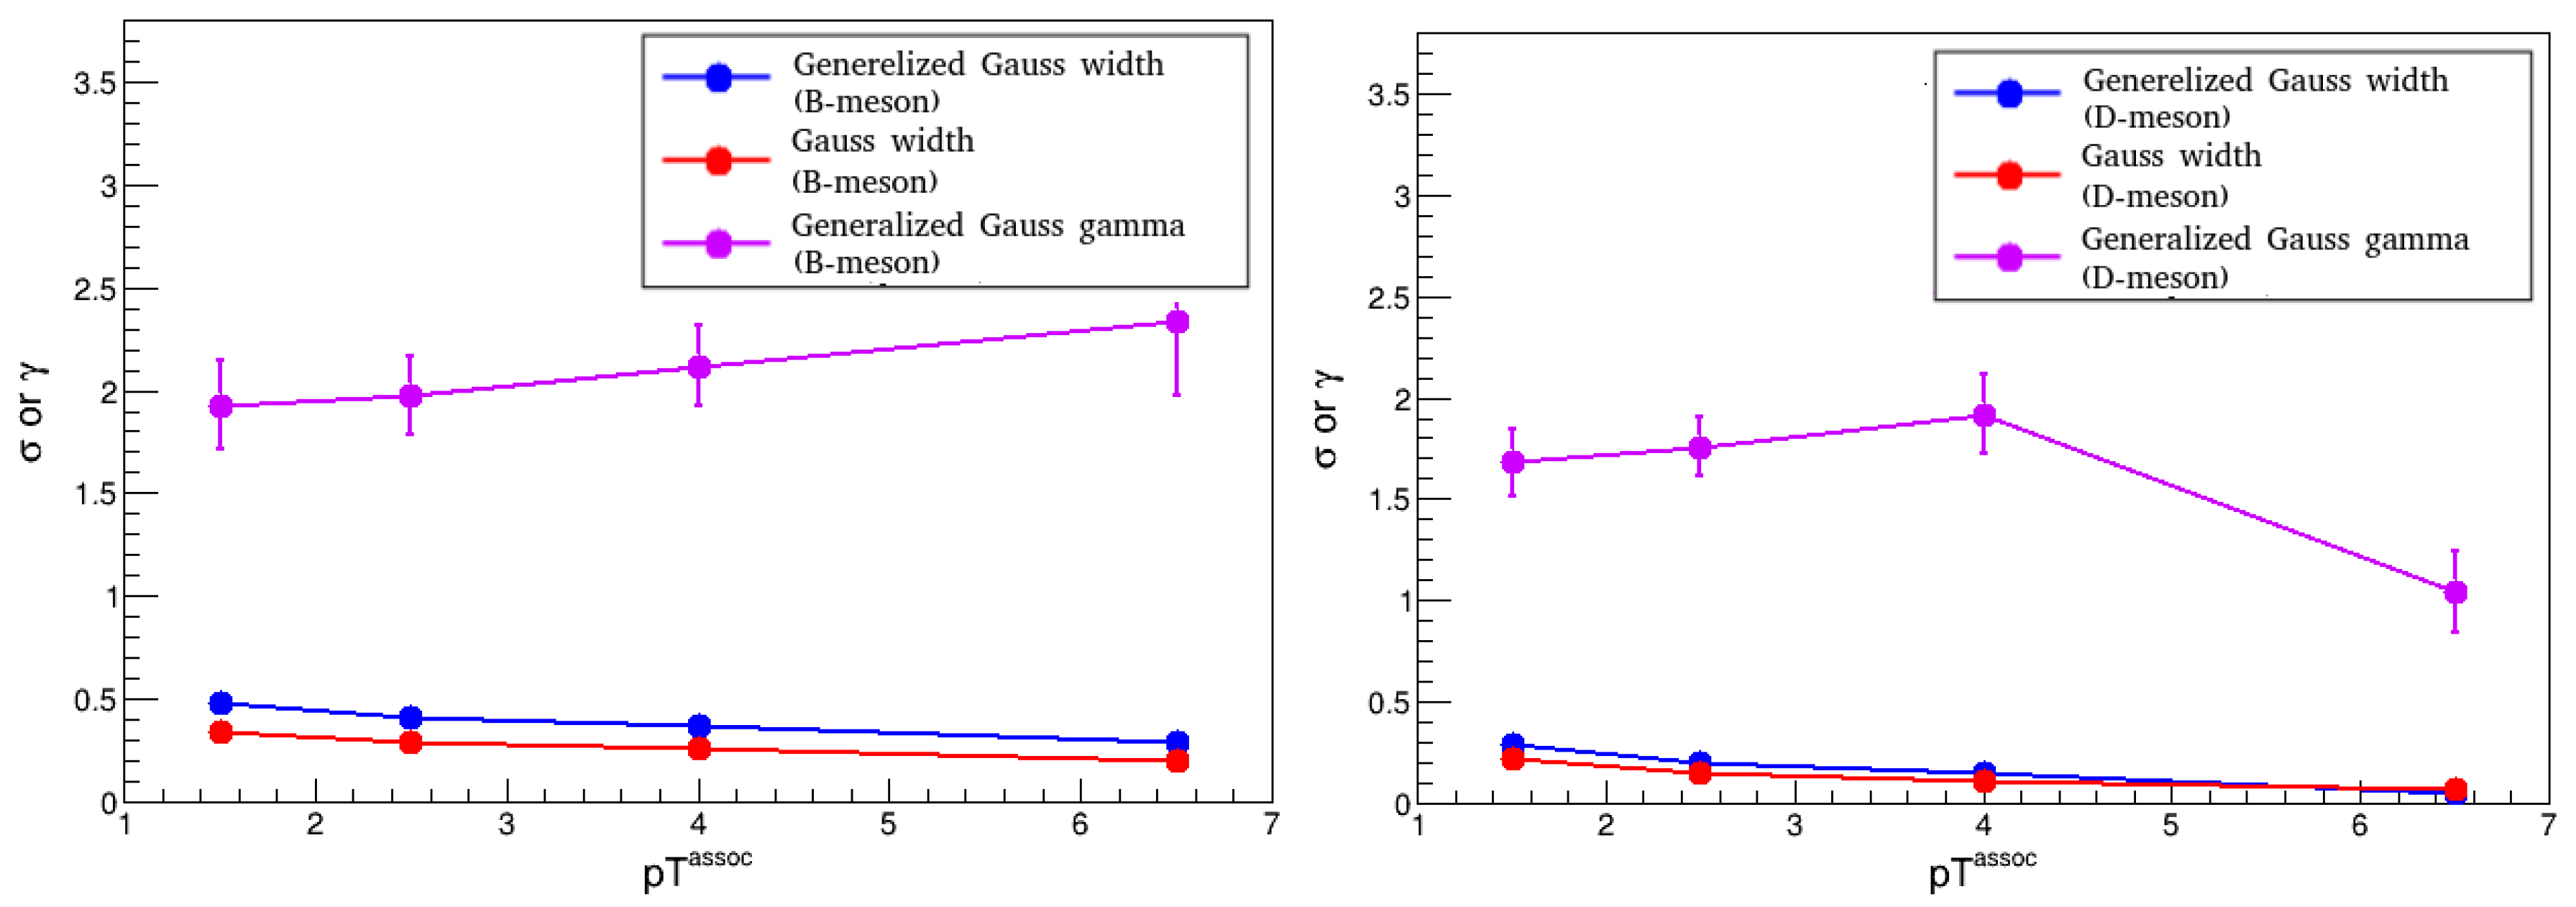
Figure 4.
The peak width for Gaussian fitting (on the left side) and for generalized Gaussian fitting (on the right side) for D meson from the decay of the B meson for 5 < < 8 GeV/c and different values.
Figure 4.
The peak width for Gaussian fitting (on the left side) and for generalized Gaussian fitting (on the right side) for D meson from the decay of the B meson for 5 < < 8 GeV/c and different values.

Figure 5.
Generalized Gaussian fitting function for electrons from B mesons (left) and c quarks (right), for GeV/c and different values.
Figure 5.
Generalized Gaussian fitting function for electrons from B mesons (left) and c quarks (right), for GeV/c and different values.
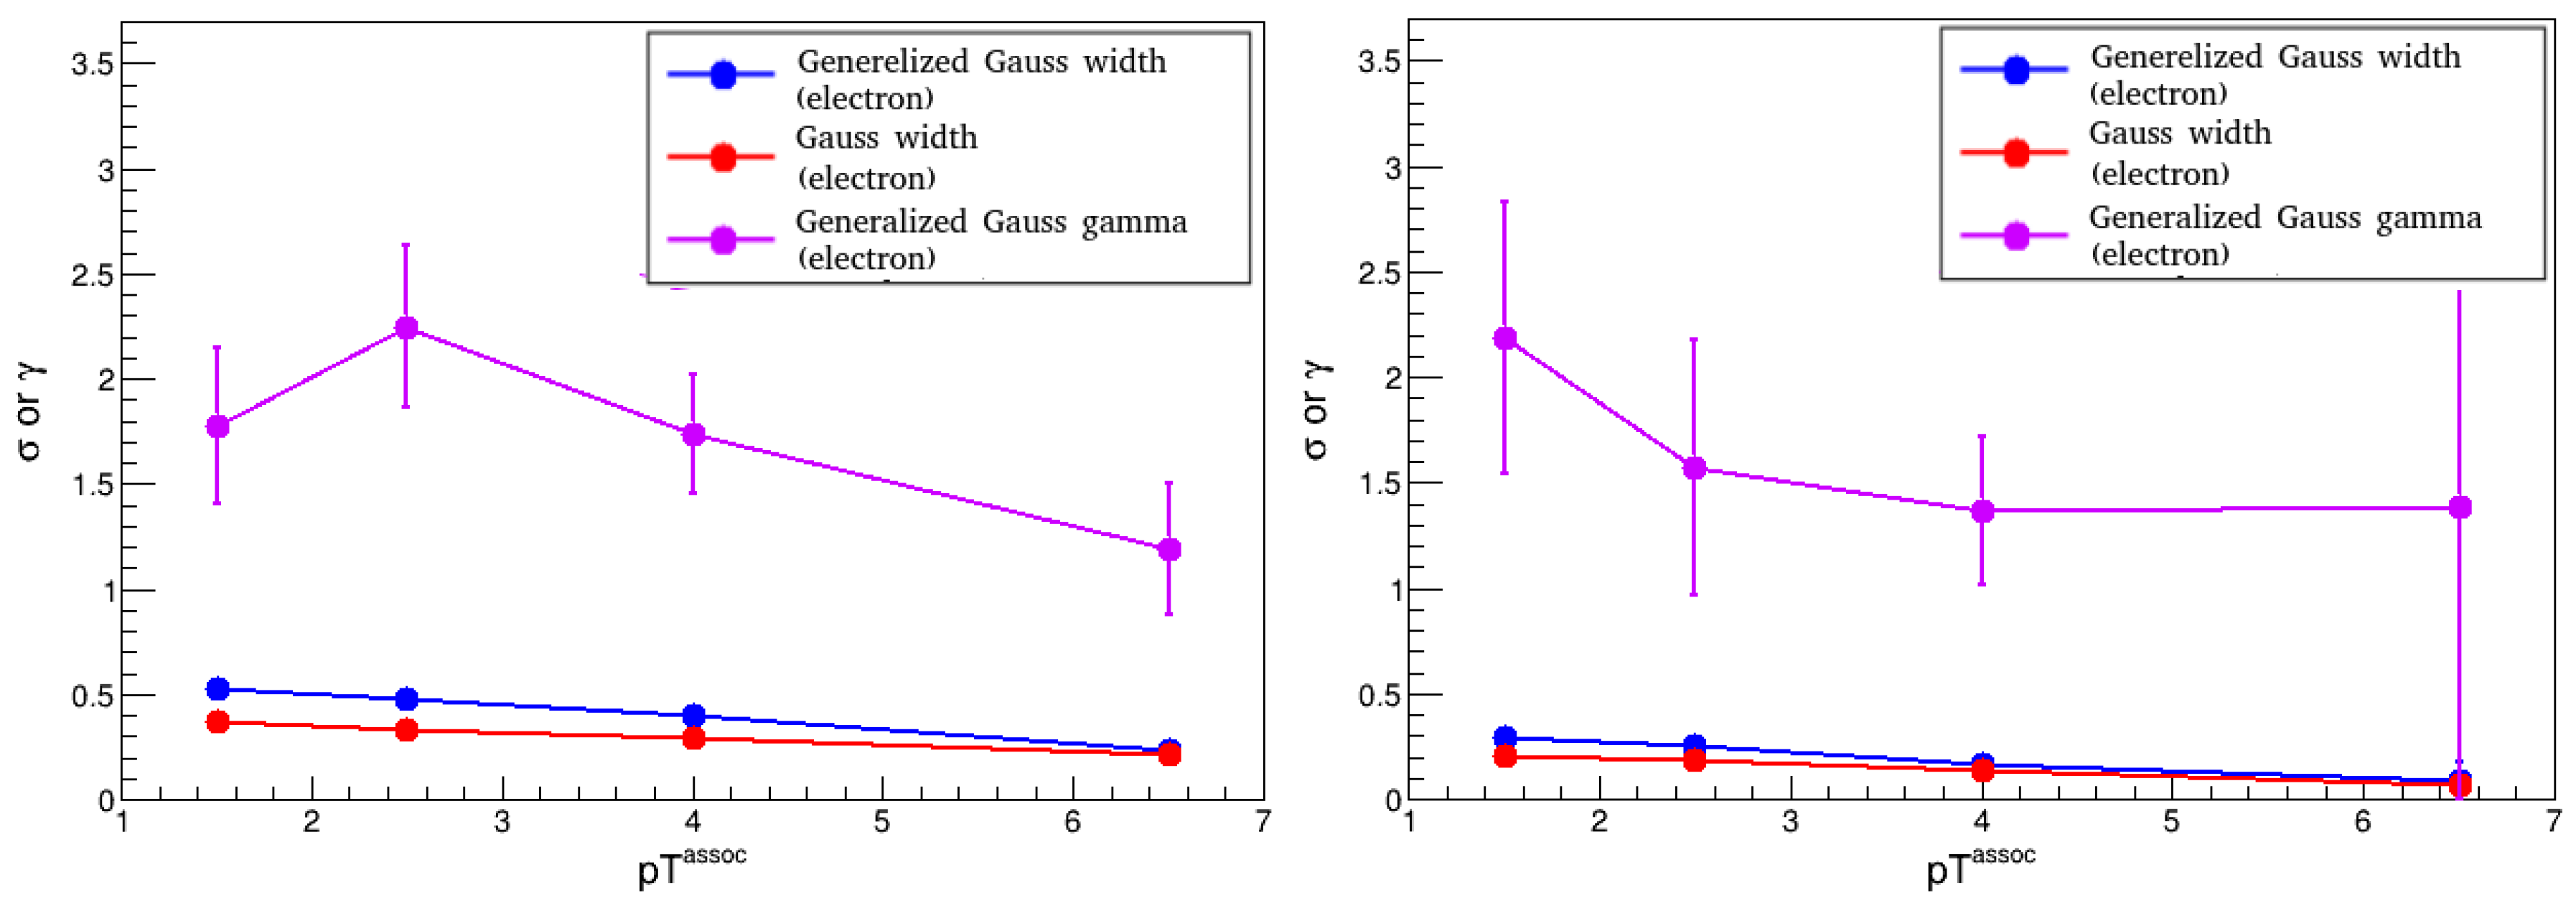
Figure 6.
Comparsion of b quark (on the left) and B meson (on the right) correlations to hadrons.
© 2019 by the authors. Licensee MDPI, Basel, Switzerland. This article is an open access article distributed under the terms and conditions of the Creative Commons Attribution (CC BY) license (http://creativecommons.org/licenses/by/4.0/).
Share and Cite
MDPI and ACS Style
Frajna, E.; Vértesi, R. Correlation of Heavy and Light Flavors in Simulations. Universe 2019, 5, 118. https://doi.org/10.3390/universe5050118
AMA Style
Frajna E, Vértesi R. Correlation of Heavy and Light Flavors in Simulations. Universe. 2019; 5(5):118. https://doi.org/10.3390/universe5050118
Chicago/Turabian StyleFrajna, Eszter, and Róbert Vértesi. 2019. "Correlation of Heavy and Light Flavors in Simulations" Universe 5, no. 5: 118. https://doi.org/10.3390/universe5050118
Note that from the first issue of 2016, this journal uses article numbers instead of page numbers. See further details here.