Article

Color–Distance Relations in Cometary Comae: A 14-Comet, Multi-Epoch Statistical Study

by
Alberto Silva Betzler
1,2,*,
Ingrid dos Santos Delfino
3,
Agábio Brasil dos Santos
4 and
Orahcio Felicio de Sousa
3
1
Departamento de Física da Terra e do Meio Ambiente, Instituto de Física, Universidade Federal da Bahia, Salvador 40170-280, Bahia, Brazil
2
Centro de Ciência e Tecnologia em Energia e Sustentabilidade, Universidade Federal do Recôncavo da Bahia, Feira de Santana 44085-132, Bahia, Brazil
3
Centro de Formação de Professores, Universidade Federal do Recôncavo da Bahia, Amargosa 45300-000, Bahia, Brazil
4
Instituto de Matemática e Estatística, Universidade Federal da Bahia, Salvador 40170-110, Bahia, Brazil
*
Author to whom correspondence should be addressed.
Universe 2026, 12(3), 65; https://doi.org/10.3390/universe12030065
Submission received: 14 December 2025 / Revised: 1 February 2026 / Accepted: 25 February 2026 / Published: 27 February 2026
(This article belongs to the Special Issue Detection and Tracking of Near-Earth Asteroids)

Abstract

Color–distance relations in the comae of 14 comets are analyzed using homogeneous broadband UBV/BVRI photometry. The sample includes several inner-Solar-System–reaching comets, including a subset from near-Earth orbits in the dynamical sense (perihelion distance q < 1.3 au), so the results are directly relevant to the near-Earth meteoroid environment. For each comet, we combine robust color statistics, rank-correlation tests, and simple activity laws to define two empirical diagnostics: an absolute color at 1 au and a differential heliocentric color index that measures color changes with distance. The ensemble does not follow a single universal trend; instead, we identify three empirical classes. One class of comets shows significant color gradients, usually confined to blue-sensitive indices and consistent with varying gas-to-dust ratios along the orbit. A second class exhibits colors that are persistently redder than the Sun and are statistically consistent with being constant both with heliocentric distance and across perihelion. A third class of “step comets” shows discrete changes in color level between pre- and post-perihelion branches, most often in red or red–near-IR indices, with little or no monotonic color–distance correlation within each branch. Several objects therefore defy the intuitive expectation of becoming bluer as they approach the Sun, emphasizing that heliocentric color evolution is highly object-dependent and that multi-epoch color monitoring is essential for interpreting cometary coma behavior.

1. Introduction

Since antiquity, bright comets displaying colors ranging from yellow to red have fascinated and frightened humanity [1]. These colors arise from the combined contributions of a continuum component associated with sunlight scattered by dust particles, as well as emission lines and bands produced by neutral molecules and radicals in the coma [2], making broadband colors a key macroscopic diagnostic of cometary activity. Broadband photometry remains one of the most widely used and practical techniques for this purpose because standard filter sets are available on most telescope systems at observatories worldwide.
The Johnson–Cousins U, B, V, and R filters have central wavelengths of 0.36, 0.44, 0.55, and 0.70 µm and bandwidths between 0.04 and 0.21 µm [3]. Within these passbands lie strong emission features of C2, C3, CN, and NH2 [4]. As the production rates of many species follow power-law dependences on heliocentric distance with negative exponents [5,6], their relative contribution to the broadband flux is expected to decrease as the comet recedes from the Sun. If the balance between gas emission and dust-scattered continuum changes with r, the observed color indices should exhibit systematic color–distance trends. Surprisingly, the fundamental relationship between color and heliocentric distance in comets is still poorly constrained in the literature and is often treated as a secondary topic, since most cometary studies focus on chemical abundances and their implications for Solar System formation. Early attempts based on near-infrared J H K photometry reached contrasting conclusions. Using colors from 14 comets, Hartmann and Cruikshank [7] reported systematic color changes with heliocentric distance and interpreted them in terms of evolving grain size distributions, changing ice-to-dust ratios, and possible phase-reddening effects. In contrast, Jewitt and Meech [8] analyzed homogeneous J H and H K colors for 23 comets over 1 r 6  au and found no evidence for a universal color–distance trend, concluding that the intrinsic scatter of colors at fixed r exceeds any systematic dependence on heliocentric distance and reflects real differences between grain populations in different comets. Together, these results highlight that even the existence of a common color–distance relation remains unsettled and motivate a systematic re-examination of broadband colors as tracers of cometary activity.
Systematic analyses of broadband color–distance trends can, however, provide an independent diagnostic of the evolving dust-to-gas ratio, the onset and fading of activity, and possible compositional or textural gradients in the coma. By quantifying these trends over a wide range of heliocentric distances, this work aims to assess whether broadband colors can be used as a practical proxy for the underlying physical and chemical evolution of cometary activity. In simple terms, we ask whether cometary broadband colors change systematically with heliocentric distance and whether such changes can be used to trace the evolution of cometary activity.
To address this question, we investigate whether such trends are present in a deliberately heterogeneous sample (in dynamical class and observing circumstances) of 14 comets observed in the U B V and B V R I systems over long time spans and wide ranges of heliocentric distance and analyzed under a uniform photometric framework and statistical pipeline (see Table 1). We analyze the behavior of the color indices U B , B V , and V R as functions of heliocentric distance using appropriate statistical tests, which are still rarely applied in cometary studies, to determine whether these relationships are present and under which circumstances. We also introduce two new parameters: absolute colors and differential heliocentric indices derived from secular light-curve fits. We compare the resulting coma colors with solar values, using them as a practical and simple proxy to characterize these color–distance trends. Whenever polarimetric data are available, we additionally examine the behavior of the degree of linear polarization as an independent diagnostic of dust properties, allowing a direct comparison between color–distance relations and polarimetric trends. This represents, to our knowledge, one of the first systematic multi-comet applications of such statistical diagnostics to broadband cometary colors, complemented when possible by polarimetric information.

2. Data and Methods

In this section, we describe the photometric dataset, the reduction procedures, and the statistical tools used in our analysis. We first summarize the observations and the construction of a homogeneous U B V / B V R I catalog for the 14 comets in our sample. We then present the method adopted to fit their secular light curves, which provides a compact description of the heliocentric dependence of the flux in each band. Finally, we define the derived quantities used throughout the paper—in particular, the absolute colors and the differential heliocentric indices that we use to characterize color–distance trends in a uniform way.

2.1. Dataset and Reductions

The data analyzed in this manuscript come from two main sources: (i) published work by our group and other research teams and (ii) new observations of several comets obtained in a photometric survey conducted by the first author between 2010 and 2017 using robotic telescopes (0.25–2.0 m) located in Spain, the USA, and Australia, accessed through the Slooh, iTelescope, and Las Cumbres Observatory networks. For each comet, the data source, UT time span, heliocentric-distance range, and orbital phase (pre-perihelion, post-perihelion, or both) are specified in the corresponding subsection. All new or re-reduced data produced by our group are listed in Appendix A (Table A1, Table A2, Table A3, Table A4, Table A5, Table A6, Table A7, Table A8, Table A9, Table A10, Table A11, Table A12, Table A13 and Table A14), grouped by object. Throughout this work, the expression “near-Earth” is used in a dynamical/physical sense (orbits that reach the near-Earth region; here, we adopt the operational criterion of perihelion distance q < 1.3  au), and this does not imply a specific close-approach distance to Earth. This choice is motivated by the fact that inner-Solar-System comets can shed dust that may contribute to the near-Earth meteoroid environment (meteor-stream progenitors in a broad sense). In our 14-comet sample, the objects satisfying q < 1.3  au are C/1969 Y1 (Bennett), C/2011 L4 (PANSTARRS), C/2012 K1 (PANSTARRS), C/2012 S1 (ISON), C/2013 R1 (Lovejoy), 1P/Halley, and 41P/Tuttle–Giacobini–Kresák.
For clarity and to allow an explicit assessment of the sample composition, Table 1 summarizes the main characteristics of the 14 comets (dynamical class, perihelion distance q, pre-/post-perihelion coverage, heliocentric-distance range, observing epoch, and data provenance). The sample is intentionally heterogeneous in dynamical class and observing circumstances, and the measurements span a broad range in heliocentric distance (approximately 0.8–6.4 au), including inbound and/or outbound branches, which may correspond to different activity regimes.
In this work, the term “homogeneous” does not refer to the physical or dynamical properties of the comet population. Instead, it refers to the uniform photometric framework and analysis protocol adopted throughout: consistent filter system and color-index definitions, a consistent calibration/reduction approach, and the same statistical pipeline applied to each object to derive per-comet diagnostics and the subsequent classification. Thus, Table 1 makes explicit what is heterogeneous in the sample (object class and observing coverage) and what is treated homogeneously (photometric definitions and analysis methodology).
Because the dataset compiles multi-facility observations and the calibration/reduction procedure is described in this section, Table 1 reports data provenance and literature references rather than listing individual telescopes.
Ney [9] showed that the measured magnitude of a comet depends strongly on the photometric aperture radius ρ , making it essential that colors be measured with identical photometric geometry. In the same context, Betzler et al. [10] found that the B V color index is approximately proportional to log 10 ( p ) , so the use of different apertures introduces systematic offsets between observations, whereas no significant color gradient with p was detected in the V R and R I indices. To avoid these systematic effects in the magnitudes and, in particular, in B V , we adopt, for our own data, a fixed aperture radius in arcseconds equal to the full width at half maximum (FWHM) of the cometary coma at the epoch of minimum geocentric distance, typically about two to three times the stellar FWHM of an unsaturated field star for each comet. Betzler et al. [11] showed for comets C/2012 K1 (PANSTARRS) and 63P/Wild 1 that this aperture encloses more than 80% of the total luminous flux of the coma. Under these conditions, the measured magnitudes and the derived color indices can be treated as nearly total values in the sense defined by Mazzotta Epifani et al. [12].
Flux calibration and instrumental magnitudes were obtained by differential photometry using 10–15 comparison stars in each frame. The Johnson–Kron–Cousins V-band magnitudes and B V and V R color indices of the comparison stars were estimated from the polynomial relation between the 2MASS J K color and the B V R I magnitudes of Landolt standard stars proposed by Warner [13]. Apparent V-band magnitudes and calibrated B V and V R color indices for the comets were then derived with a Python code based on the photometric routines of the photutils package from the Astropy project [14].
The B V and V R color indices listed in the tables are given as medians. Because medians are robust against outliers, they provide a more reliable measure of central tendency than the mean in skewed distributions. The associated uncertainties are expressed as the median absolute deviation (MAD), defined as the median of the absolute deviations from the sample median. These robust estimators describe the observed distributions more faithfully in the presence of outliers and are therefore preferred in our statistical analyses.
The correlation between the color indices and the heliocentric distance r was assessed using Spearman’s rank correlation test [15]. This non-parametric test evaluates whether a monotonic relationship exists between two variables, without assuming linearity or normality. We report the Spearman rank correlation coefficient ρ and the associated two-sided p-value, and we consider a correlation statistically significant when p < 0.05 . Like most rank-based tests, Spearman’s test does not explicitly incorporate individual measurement uncertainties, and its statistical power can be reduced by small sample sizes or a narrow range in the independent variable.
In addition, for comets observed both before and after perihelion, we computed the differential activity index Δ n (see Section 2.3) as an additional diagnostic of changes in the color–distance trend across perihelion. For the same objects, we also computed Kendall’s τ [16] in addition to Spearman’s ρ as an alternative rank-based measure of monotonic association, using its two-sided p-value as an independent check of the inferred trends. As an ad hoc robustness check on the rank statistics, we fitted a Theil–Sen robust linear regression [17] of color on r and inspected the sign and the 95% confidence interval of the slope. A trend was regarded as physically meaningful only when the rank-based tests indicated statistical significance and the Theil–Sen slope had a confidence interval that did not include zero. Additionally, we applied the two-sample Mann–Whitney U test [18] to compare the color indices before and after perihelion, providing a distribution-based check on whether the pre- and post-perihelion color samples are consistent with the color–distance trends identified by the correlation tests. In terms of descriptive statistics, we also compared the medians and MAD values of the color-index distributions, separated by orbital phase, with the solar colors given by Holmberg et al. [19].
Table 1. Overview of the 14-comet sample: dynamical class, perihelion distance q, orbital period P, inbound/outbound coverage, heliocentric-distance range of the measurements, observing epoch, and data sources.
CometClassq (au)P (yr)Cov.r Range (au)EpochSource(s)
C/1969 Y1 (Bennett)LPC0.53761747post0.830–1.7351970[20]
C/2010 S1 (LINEAR)LPC5.8999not definedpre- and post-perihelion6.061–6.249 (pre); 5.902–6.383 (post)2013This work
C/2011 L4 (PANSTARRS)LPC0.3015not definedpost1.872–3.7032013This work
C/2012 J1 (Catalina)LPC3.1587not definedpre3.170–3.2802012[21]
C/2012 K1 (PANSTARRS)LPC1.0546not definedpre1.907–2.6722014[11]
C/2012 S1 (ISON)LPC0.0125not definedpre1.220–6.1612012–2013This work
C/2013 R1 (Lovejoy)LPC0.811811705pre- and post-perihelion1.052–1.287 (pre); 1.519–2.215 (post)2013–2014This work
C/2014 S2 (PANSTARRS)LPC2.10062212.0post2.341–3.0542016[22]
C/2020 V2 (ZTF)LPC2.2280not definedpre- and post-perihelion2.300–5.410 (pre); 2.300–5.260 (post)2022–2024[23]
1P/HalleyHTC0.574975.9pre- and post-perihelion0.920–2.860 (pre); 1.630–5.860 (post)1985–1987PDS
4P/FayeJFC1.57827.4pre- and post-perihelion1.593–1.595 (pre); 1.593–1.734 (post)1991[24]
41P/Tuttle–Giacobini–KresákJFC1.04505.4pre- and post-perihelion1.045–1.179 (pre); 1.045–1.082 (post)2017This work
63P/Wild 1JFC1.950913.2pre- and post-perihelion1.951–1.960 (pre); 1.951–2.045 (post)2013[11]
168P/HergenrotherJFC1.41536.9post1.416–1.4642012This work
Notes. LPC = long-period comet (typically P ≳ 200 yr); HTC = Halley-type comet; JFC = Jupiter-family comet; PDS = NASA Planetary Data System. “pre” and “post” denote pre- and post-perihelion data, respectively. Perihelion distances q and orbital periods P were retrieved from the JPL Small-Body Database Lookup (SBDB; https://ssd.jpl.nasa.gov/tools/sbdb_lookup.html#/ (accessed on 1 February 2026)). For several LPCs in our sample, SBDB reports P as “not defined” because their osculating solutions are (near-)parabolic and/or not sufficiently constrained: small uncertainties in the reciprocal semimajor axis (1/a) translate into extremely large and unstable periods, so quoting a single, reliable P is not meaningful.

2.2. Fitting the Secular Light Curve of Comets

The apparent magnitude m ( Δ , r ) of a comet observed at heliocentric distance r and geocentric distance Δ (both in au) can be written as
m ( Δ , r ) = m ( 1 , 1 ) + 5 log 10 Δ + 2.5 n log 10 r ,
where m ( 1 , 1 ) is the absolute magnitude at r = Δ = 1 au and n is the activity index of the comet [25,26].
The parameters m ( 1 , 1 ) and n were estimated using a weighted least-squares fit, in which the photometric uncertainty of each data point is used to weight its contribution to the fit. This method was applied to the linear relation between the geocentric magnitude
m geo = m ( Δ , r ) 5 log 10 Δ
and log 10 r , i.e.,
m geo = m ( 1 , 1 ) + 2.5 n log 10 r .
This procedure was applied independently to each photometric filter used in our dataset.

2.3. Absolute Colors and Differential Heliocentric Indices

Building on the secular light-curve fits described above, we introduced two derived photometric parameters to search for systematic trends of the color indices with heliocentric distance.
For a given filter X, Equation (1) can be written as
m X ( Δ , r ) = m X ( 1 , 1 ) + 5 log 10 Δ + 2.5 n X log 10 r ,
where m X ( 1 , 1 ) is the absolute magnitude in filter X at r = Δ = 1 au and n X is the corresponding activity index. For a pair of filters ( X , Y ) with central wavelengths such that λ X < λ Y , we define the absolute color as
Δ m ( 1 , 1 ) = m X ( 1 , 1 ) m Y ( 1 , 1 ) ,
and the differential heliocentric index as
Δ n = n X n Y .
The corresponding color index as a function of heliocentric distance is then
m X ( Δ , r ) m Y ( Δ , r ) = Δ m ( 1 , 1 ) + 2.5 Δ n log 10 r .
The differential index Δ n quantifies the chromatic trend of the comet as it approaches the Sun: a positive value indicates a bluening with decreasing heliocentric distance (the shorter-wavelength band brightens more rapidly than the longer-wavelength one), a negative value indicates reddening, and a value consistent with zero implies no significant color trend within our uncertainties. The absolute color Δ m ( 1 , 1 ) provides a standardized reference by specifying the color index at r = Δ = 1 au, which facilitates comparisons between cometary and solar colors and among different comets in the sample.

3. Results and Analysis

The 14 comets in our sample are divided into the two standard dynamical families: short-period (SP) and long-period (LP) comets [27]. Within each family, the objects are listed in order of increasing discovery year. For SP comets, we also indicate the perihelion year of the apparition analyzed in this work, to facilitate the identification of the observed passage. The photometric results for each comet are presented in this section, organized by object as follows.

3.1. C/1969 Y1 (Bennett)

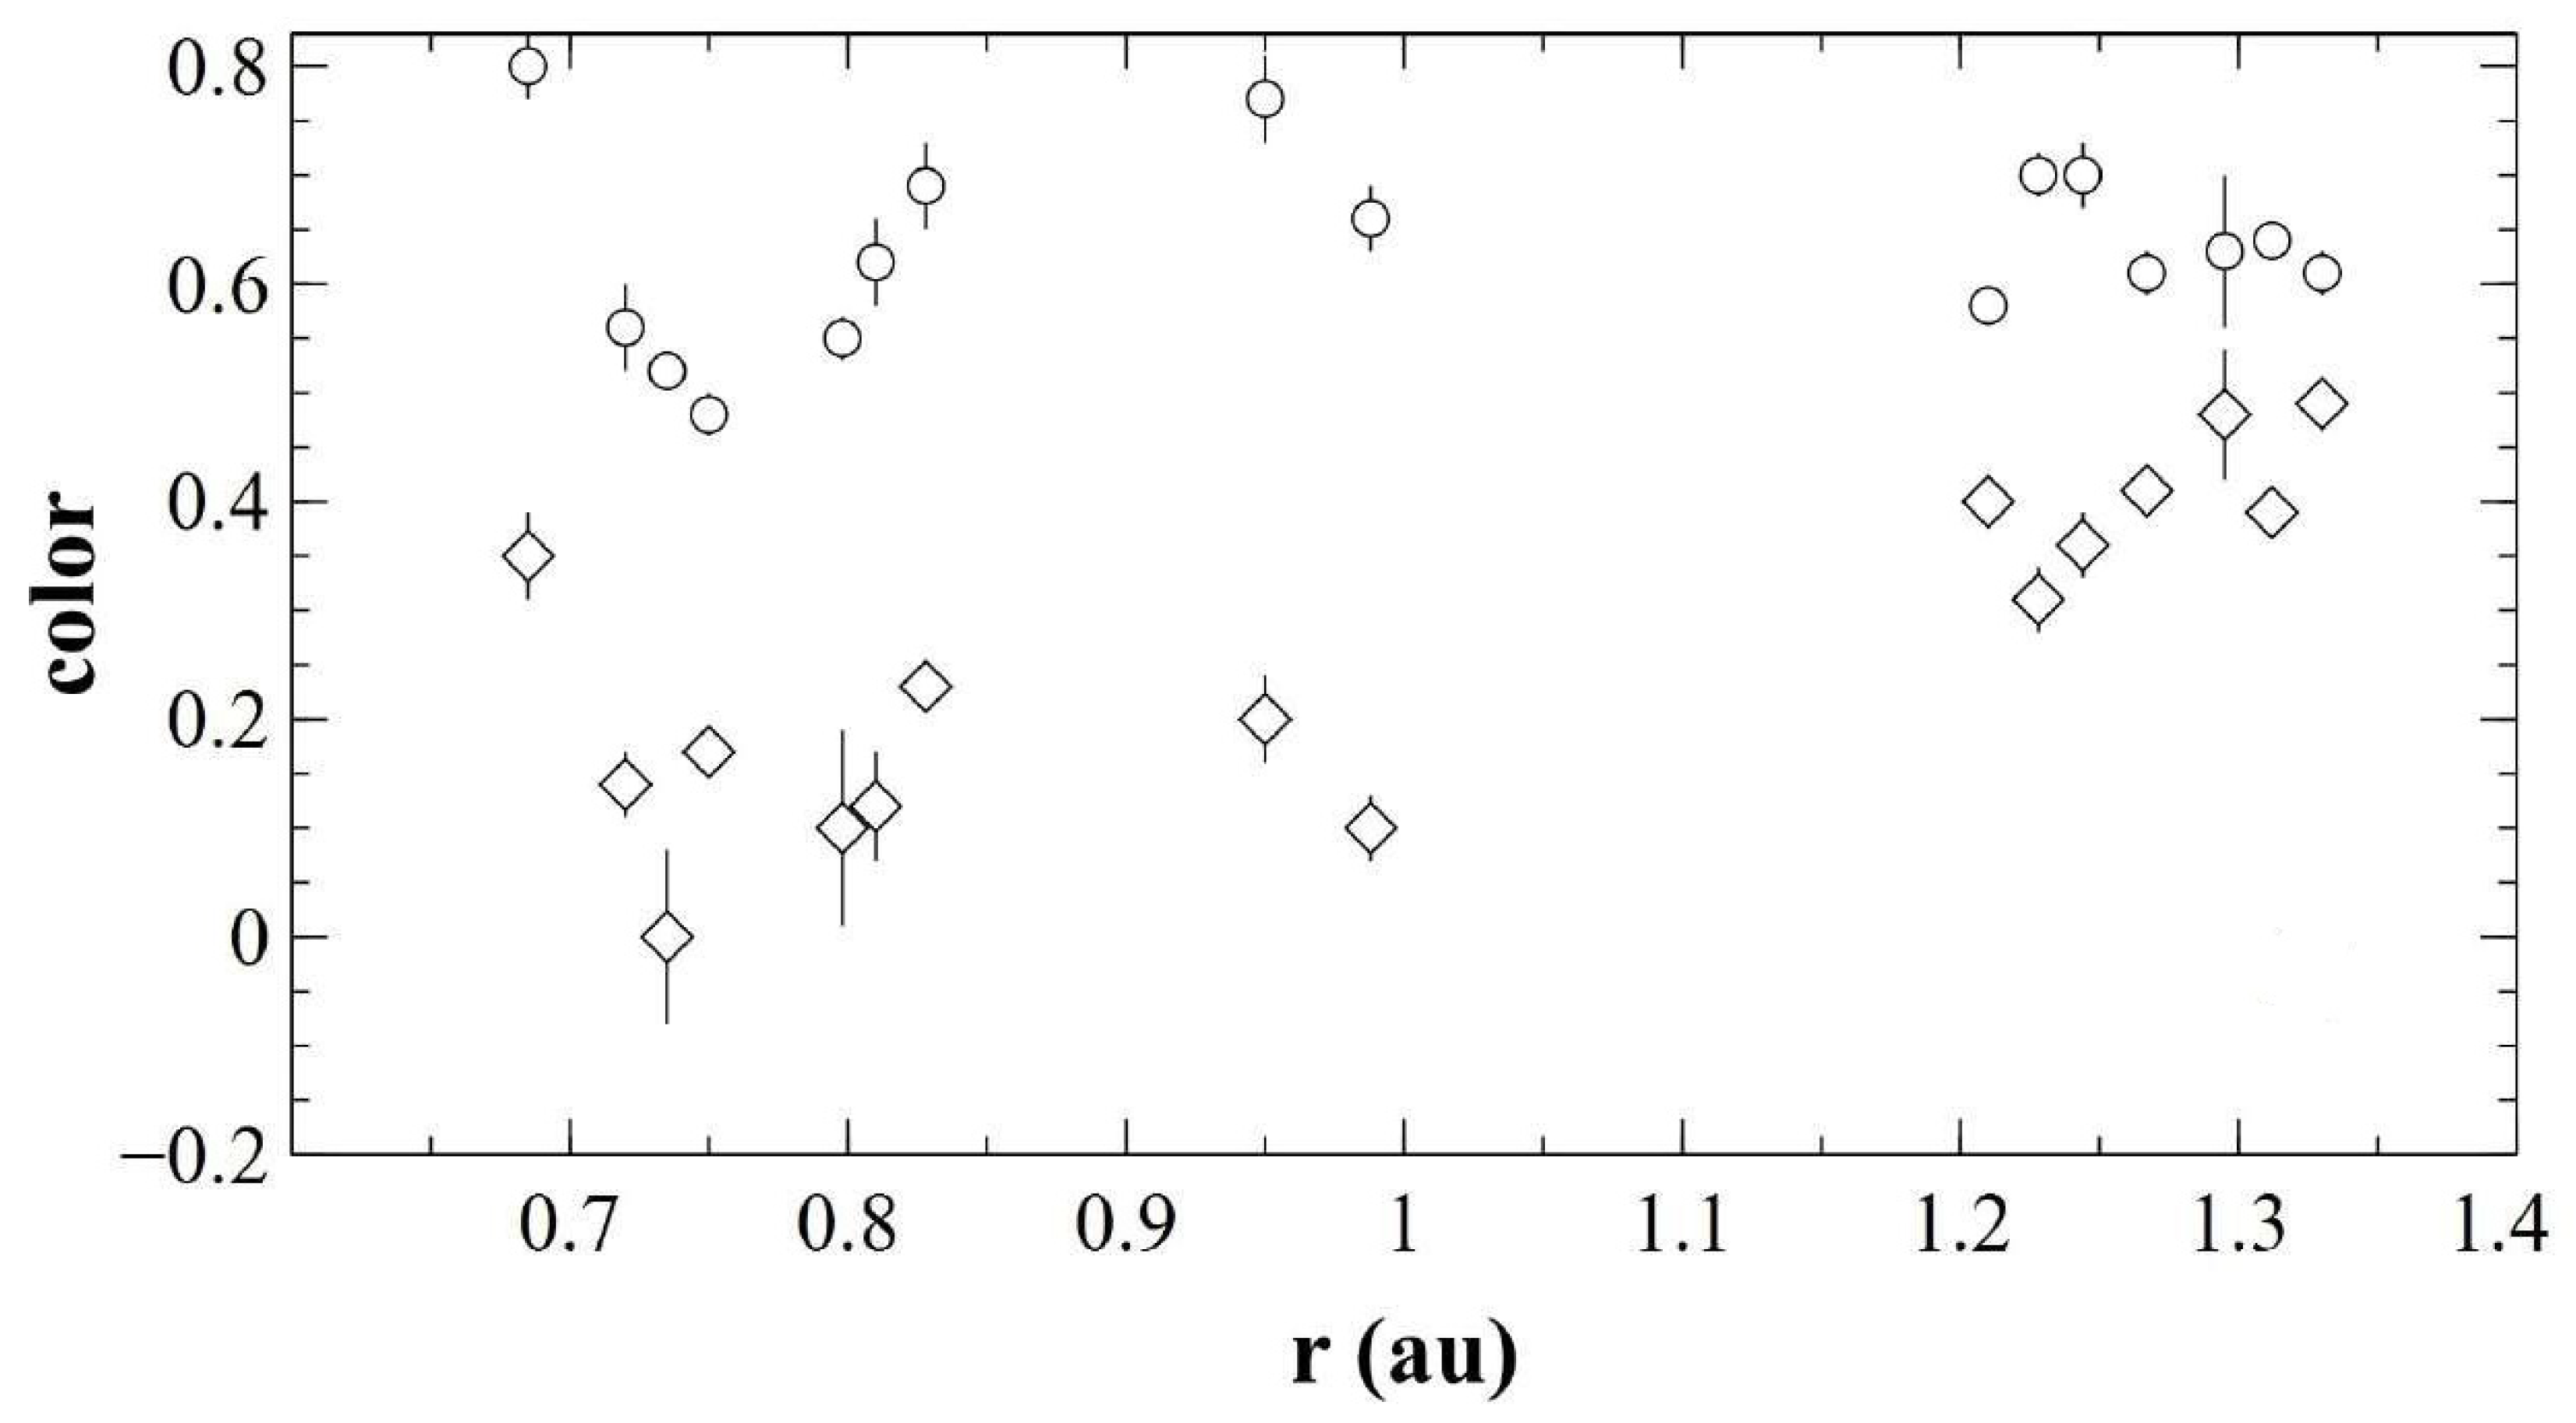
The data for comet Bennett analyzed in this subsection are taken from Table 1 in [20], where the B and U magnitudes are not explicitly listed. In this work, these magnitudes were estimated from the published color indices B V and U B by adding them to the corresponding V and B magnitudes, respectively. The comet was observed between April 8.73 and May 18.43 1970 UT, after its perihelion passage, in 16 observing epochs with a median sampling interval of about 1 day, while its heliocentric distance increased from 0.83 to 1.735 au (Figure A1).
We first characterized the global color distributions with robust statistics. For the combined dataset ( N = 16 ), the median colors are U B = 0.270 with MAD = 0.130 and B V = 0.625 with MAD = 0.065 . The corresponding first and third quartiles are Q 1 ( U B ) = 0.135 , Q 3 ( U B ) = 0.3925 , and Q 1 ( B V ) = 0.575 , Q 3 ( B V ) = 0.6925 . Using the reference solar colors U B = 0.173 ± 0.064 and B V = 0.642 ± 0.016 , the Sun falls between the first quartile and the median in the U B distribution (second quartile) and between the median and the third quartile in the B V distribution (third quartile). Thus, the coma is slightly redder than the Sun in U B , while in B V it is essentially solar, with only a small shift toward bluer values relative to the reference.
We quantified heliocentric trends using Spearman’s rank correlation between color indices and heliocentric distance r. For U B versus r, we obtained a Spearman coefficient ρ 0.739 with p 1.08 × 10 3 ( N = 16 ), indicating a moderate to strong positive and statistically significant monotonic correlation: as r increases, U B becomes redder. In contrast, for B V versus r, the correlation is weak and not significant, with ρ 0.20 and p 0.45 . These non-parametric results already suggest that any chromatic evolution is confined to the ultraviolet relative to the optical continuum, while the optical color B V remains approximately constant over the sampled heliocentric range.
To connect these rank-based diagnostics with a parametric description of the secular light curves, we modeled the geocentric magnitudes as a function of heliocentric distance using weighted least squares. For each band, we defined the geocentric magnitude as
m geo = m 5 log 10 Δ
and fitted the relation
m geo = a + b log 10 r ,
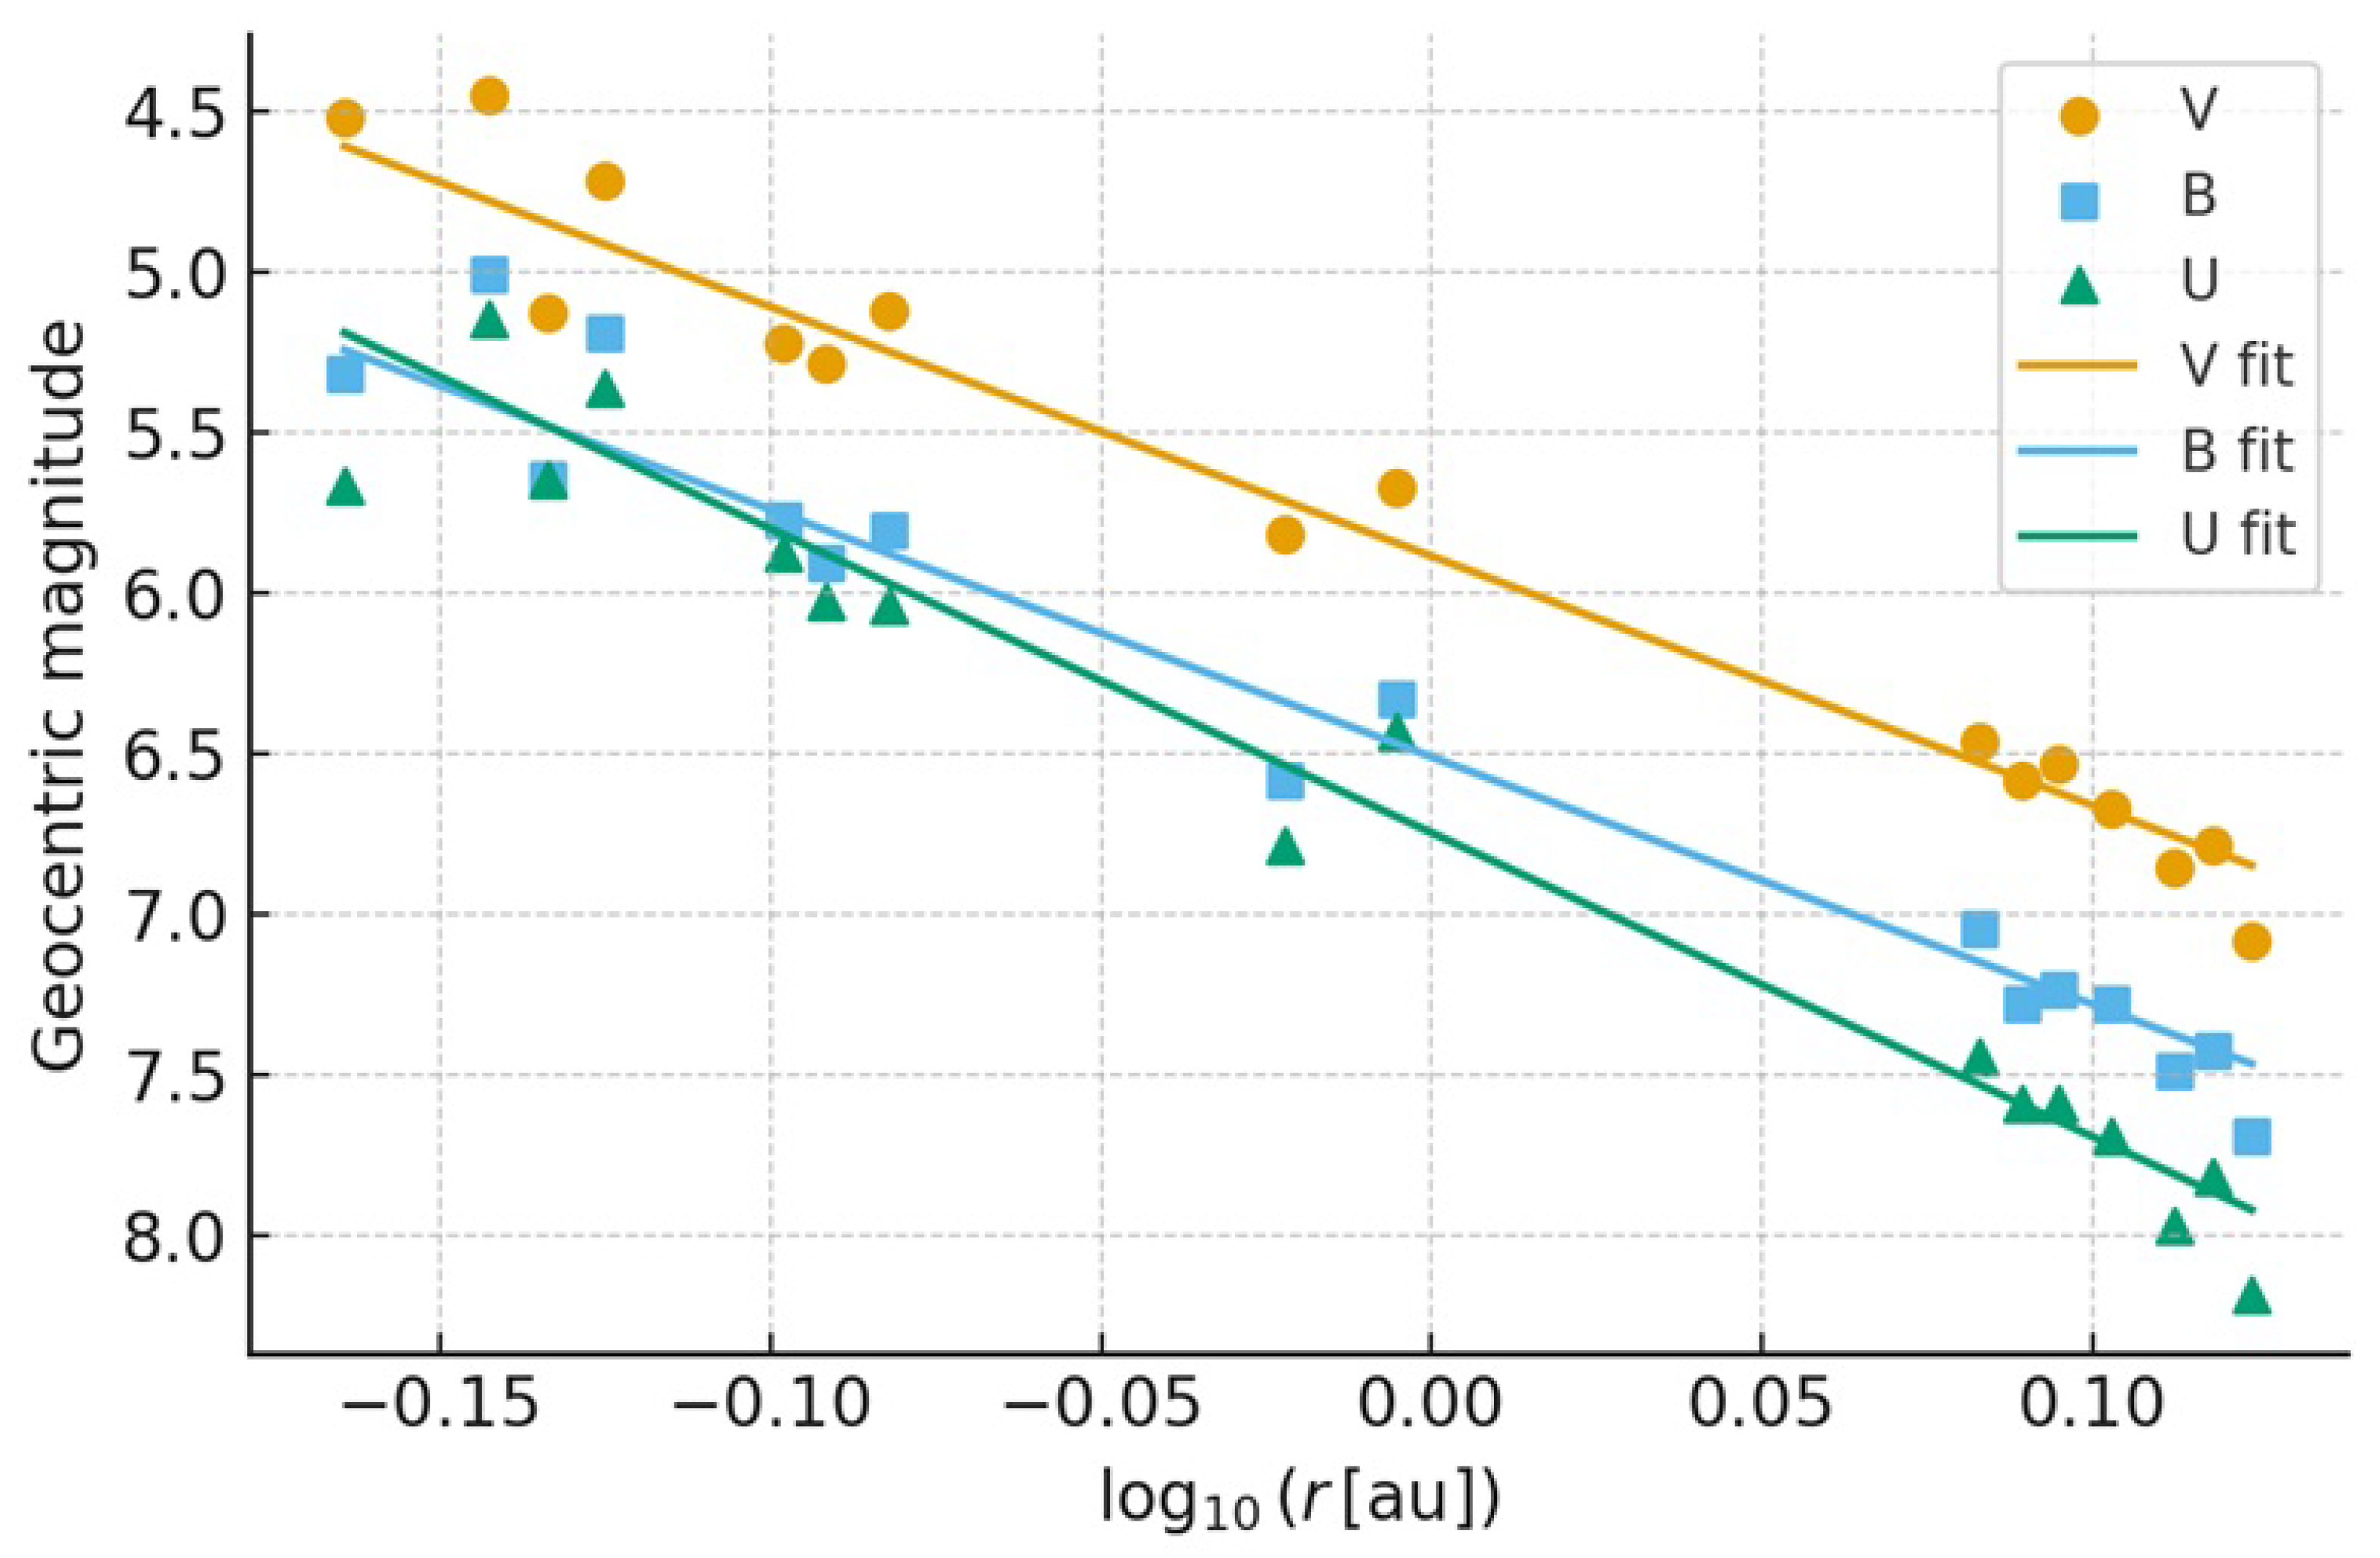
using the photometric uncertainties as weights. The best-fit parameters are a U = 6.747 ± 0.049 , b U = 9.489 ± 0.451 ; a B = 6.510 ± 0.043 , b B = 7.723 ± 0.381 ; and a V = 5.884 ± 0.041 , b V = 7.779 ± 0.361 (Figure A2). Interpreting the intercepts as absolute magnitudes at r = Δ = 1 au, we obtain the absolute colors
( U B ) abs = a U a B = 0.237 ± 0.065
and
( B V ) abs = a B a V = 0.626 ± 0.059 ,
in excellent agreement with the sample medians. These results confirm that comet Bennett is mildly redder than the Sun in U B and essentially solar in B V ; the absolute colors therefore validate the picture inferred from the empirical distributions.
From the heliocentric slopes, we also derived differential “activity indices” for the colors. Writing b = 2.5 n 2 , the slopes correspond to activity indices n 2 ( U ) = 3.80 ± 0.18 , n 2 ( B ) = 3.09 ± 0.15 , and n 2 ( V ) = 3.11 ± 0.14 . The relative activity indices for the colors, defined as Δ n 2 = n 2 ( λ 1 ) n 2 ( λ 2 ) = ( b 1 b 2 ) / 2.5 , are
Δ n 2 ( U B ) = 0.71 ± 0.23
and
Δ n 2 ( B V ) = 0.02 ± 0.21 .
Taking the uncertainties into account, the differential activity indices provide a quantitative measure of the robustness of the heliocentric color gradients. From the heliocentric slopes, we obtain Δ n 2 ( U B ) = 0.71 ± 0.23 and Δ n 2 ( B V ) = 0.02 ± 0.21 . The index Δ n 2 ( U B ) is therefore significantly positive at the 3 σ level, indicating a genuine reddening of the U B color with increasing heliocentric distance. In contrast, Δ n 2 ( B V ) is statistically indistinguishable from zero, so any putative trend in B V cannot be regarded as significant. These parametric results are fully consistent with the non-parametric Spearman analysis: the strong and significant correlation between U B and r ( ρ 0.739 , p 1.08 × 10 3 ) reflects the same underlying gradient captured by the positive Δ n 2 ( U B ) , whereas the weak and non-significant correlation for B V versus r ( ρ 0.20 , p 0.45 ) is mirrored by the Δ n 2 ( B V ) value that is consistent with zero within 1 σ .
The physical interpretation of these trends is consistent with the expected behavior of the gas and dust components in the coma. The marked heliocentric trend in U B , contrasted with the nearly constant B V color, is naturally explained if the flux measured in the U band, and to a lesser extent in the B band, is more susceptible to contamination by gas emission lines. Migach and Shiper [28] reported the presence of CN, C2, and C3 emission lines on spectrograms of comet Bennett, with several of these transitions falling in the spectral ranges covered by the U and B filters. As the comet moves away from the Sun, the relative contribution of gas emission to the total flux in U and B is expected to decline more rapidly than the dust continuum, naturally producing a reddening of the ultraviolet color index with increasing r. In contrast, the B and V filters both transmit radiation from some of the same molecular bands, which can make differential trends in B V harder to detect at a statistically significant level.
In summary, the combined evidence from robust distribution statistics, Spearman rank correlations, parametric secular fits, and differential activity indices with their associated uncertainties provides a coherent picture of the color behavior of comet Bennett based on the present dataset. The coma exhibits near-solar optical colors with no statistically significant heliocentric trend in B V , while a clear heliocentric gradient is confined to the ultraviolet colors involving the U band. This gradient is seen both in the strong, positive Spearman correlation of U B with r and in the significantly positive Δ n 2 ( U B ) , whereas the lack of a significant Δ n 2 ( B V ) is in agreement with the absence of a monotonic trend in B V as a function of heliocentric distance. The present analysis indicates that Johnson U and V filters are particularly well suited to detect heliocentric color trends and, indirectly, the changing relative importance of gas emission and dust continuum in cometary comae. Further U B V observations of comets from different dynamical classes would provide a useful test of whether the behavior observed for comet Bennett is common or exceptional.

3.2. C/2010 S1 (LINEAR)

We analyzed the color indices B V and V R from comet C/2010 S1 (LINEAR) as a function of heliocentric distance by splitting the dataset into two subsamples, before and after perihelion (here taken at JD 2456432.82968 = 2013-May-20.32968007 UT). The pre-perihelion subset comprises 13 entries (JDs 2456140.71361–2456236.71270), spanning r = 6.061 6.249 AU, and the post-perihelion subset 42 entries (JDs 2456454.57547–2456778.72478), spanning r = 5.902 6.383 AU. In total, the sample contains 42 B V and 54 V R color indices. The dataset analyzed here results from a reprocessing and consolidation across all available observing seasons for this object. Relative to Table 7 in [10], which included a subset of this sample, this increases the counts from 11 to 42 for B V (+282%) and from 11 to 54 for V R (+391%; see Table A1, Table A2 and Table A3).
Before perihelion, the sample comprises 13 measurements with complete color information. The median colors are B V = 0.70 with MAD (median absolute deviation) = 0.03 and V R = 0.37 with MAD = 0.01 . After perihelion, we obtain 29 B V and 41 V R measurements, with medians B V = 0.66 (MAD = 0.06 ) and V R = 0.40 (MAD = 0.04 ). Quantitatively, the solar colors fall in the first quartile of the pre-perihelion distributions for both B V and V R (fractional ranks 0.15 ), indicating a coma slightly redder than the Sun. Post-perihelion, the solar B V lies between the first quartile and the median (fractional rank 0.45 ), while the solar V R remains in the first quartile (fractional rank 0.22 ) (Figure A3 and Figure A4).
To test for monotonic color trends with heliocentric distance, we applied two-tailed Spearman’s rank correlation separately to the pre- and post-perihelion subsets. Before perihelion, no significant correlation is detected: for B V versus r, ρ = 0.22 , p = 0.47 ; for V R versus r, ρ = 0.24 , p = 0.44 ( N = 13 in both cases). After perihelion, a strong and highly significant negative correlation emerges for B V versus r ( ρ = 0.65 , p 1.4 × 10 4 , N = 29 ) and a weaker but still significant negative trend for V R versus r ( ρ = 0.39 , p 1.2 × 10 2 , N = 41 ).
We also compared the level of the color distributions across perihelion using two-sample Mann–Whitney U tests (two-tailed). For B V , the shift is highly significant ( U = 31.0 , z = 4.2835 , p = 1.8 × 10 5 ; N pre = 13 , N post = 29 ), with a large rank-biserial effect size r rb = 0.836 ; the post-perihelion distribution is shifted to bluer values (median 0.66 vs. 0.70 ). For V R , the difference is moderate but significant ( U = 156.0 , z = 2.2302 , p = 0.0257 ; N pre = 13 , N post = 41 ), with a rank-biserial effect size r rb = 0.415 and a slightly redder post-perihelion median ( 0.40 vs. 0.37 ).
Taken together, the Mann–Whitney results (global level shifts across perihelion) and the Spearman trends (within-branch gradients vs. r) are consistent: B V shows both a post-perihelion level decrease and a negative dependence on r; V R exhibits a small upward level shift post-perihelion yet still a negative within-branch trend with decreasing r. Overall, in the better-sampled post-perihelion branch, comet S1 becomes systematically bluer in both indices at smaller heliocentric distances, an effect stronger in B V , plausibly reflecting changes in grain-size distribution, albedo, or coma scattering/phase function at smaller r.

3.2.1. Phase-Angle Effects

Complementing the distance trends described above, we quantified phase reddening within the same post-perihelion branch using two-tailed Spearman tests between color and phase angle α . For B V , we find a positive correlation with α ( ρ = 0.546 , p = 2.16 × 10 3 , N = 29 ), whereas V R shows no significant relation ( ρ = 0.255 , p = 0.107 , N = 41 ). Together with the negative B V r trend reported above, these results imply two concurrent gradients in B V : it becomes bluer at smaller r while reddening with increasing α . The color observed at any epoch therefore reflects the combined influence of heliocentric evolution and viewing geometry.

3.2.2. Consistency with Polarimetry and Dust Models

Independent CCD polarimetry of comets C/2010 S1 and C/2010 R1 at r = 5.9 7.0 au reports spatially varying negative polarization whose absolute value increases with cometocentric distance (reaching 3 % in the outer coma), and these trends are reproduced by simulations of micron-sized porous aggregates (overall radius R 1.3 μ m built from N 10 3 monomers of a 0.1 μ m , refractive index m = 1.65 + i 0.05 ) [29]. Such dust-dominated scattering naturally yields near-solar colors with mild average reddening and predicts phase-dependent reddening strongest in the blue continuum, consistent with our positive B V α correlation and the weaker response of V R , while remaining compatible with the modest level shifts observed across perihelion.

3.3. C/2011 L4 (PANSTARRS)

The photometric dataset corresponds to the post-perihelion phase of the orbit of comet C/2011 L4 (PANSTARRS), whose perihelion occurred at t p = 2013.03 . 10.17 (JD 2456361.66996). It covers the interval from 2013.06.03.18 (JD 2456446.67604) to 2013.10.13.84 (JD 2456579.33539), over a heliocentric distance range from 1.87199 to 3.70322 au (Table A4 and Table A5).
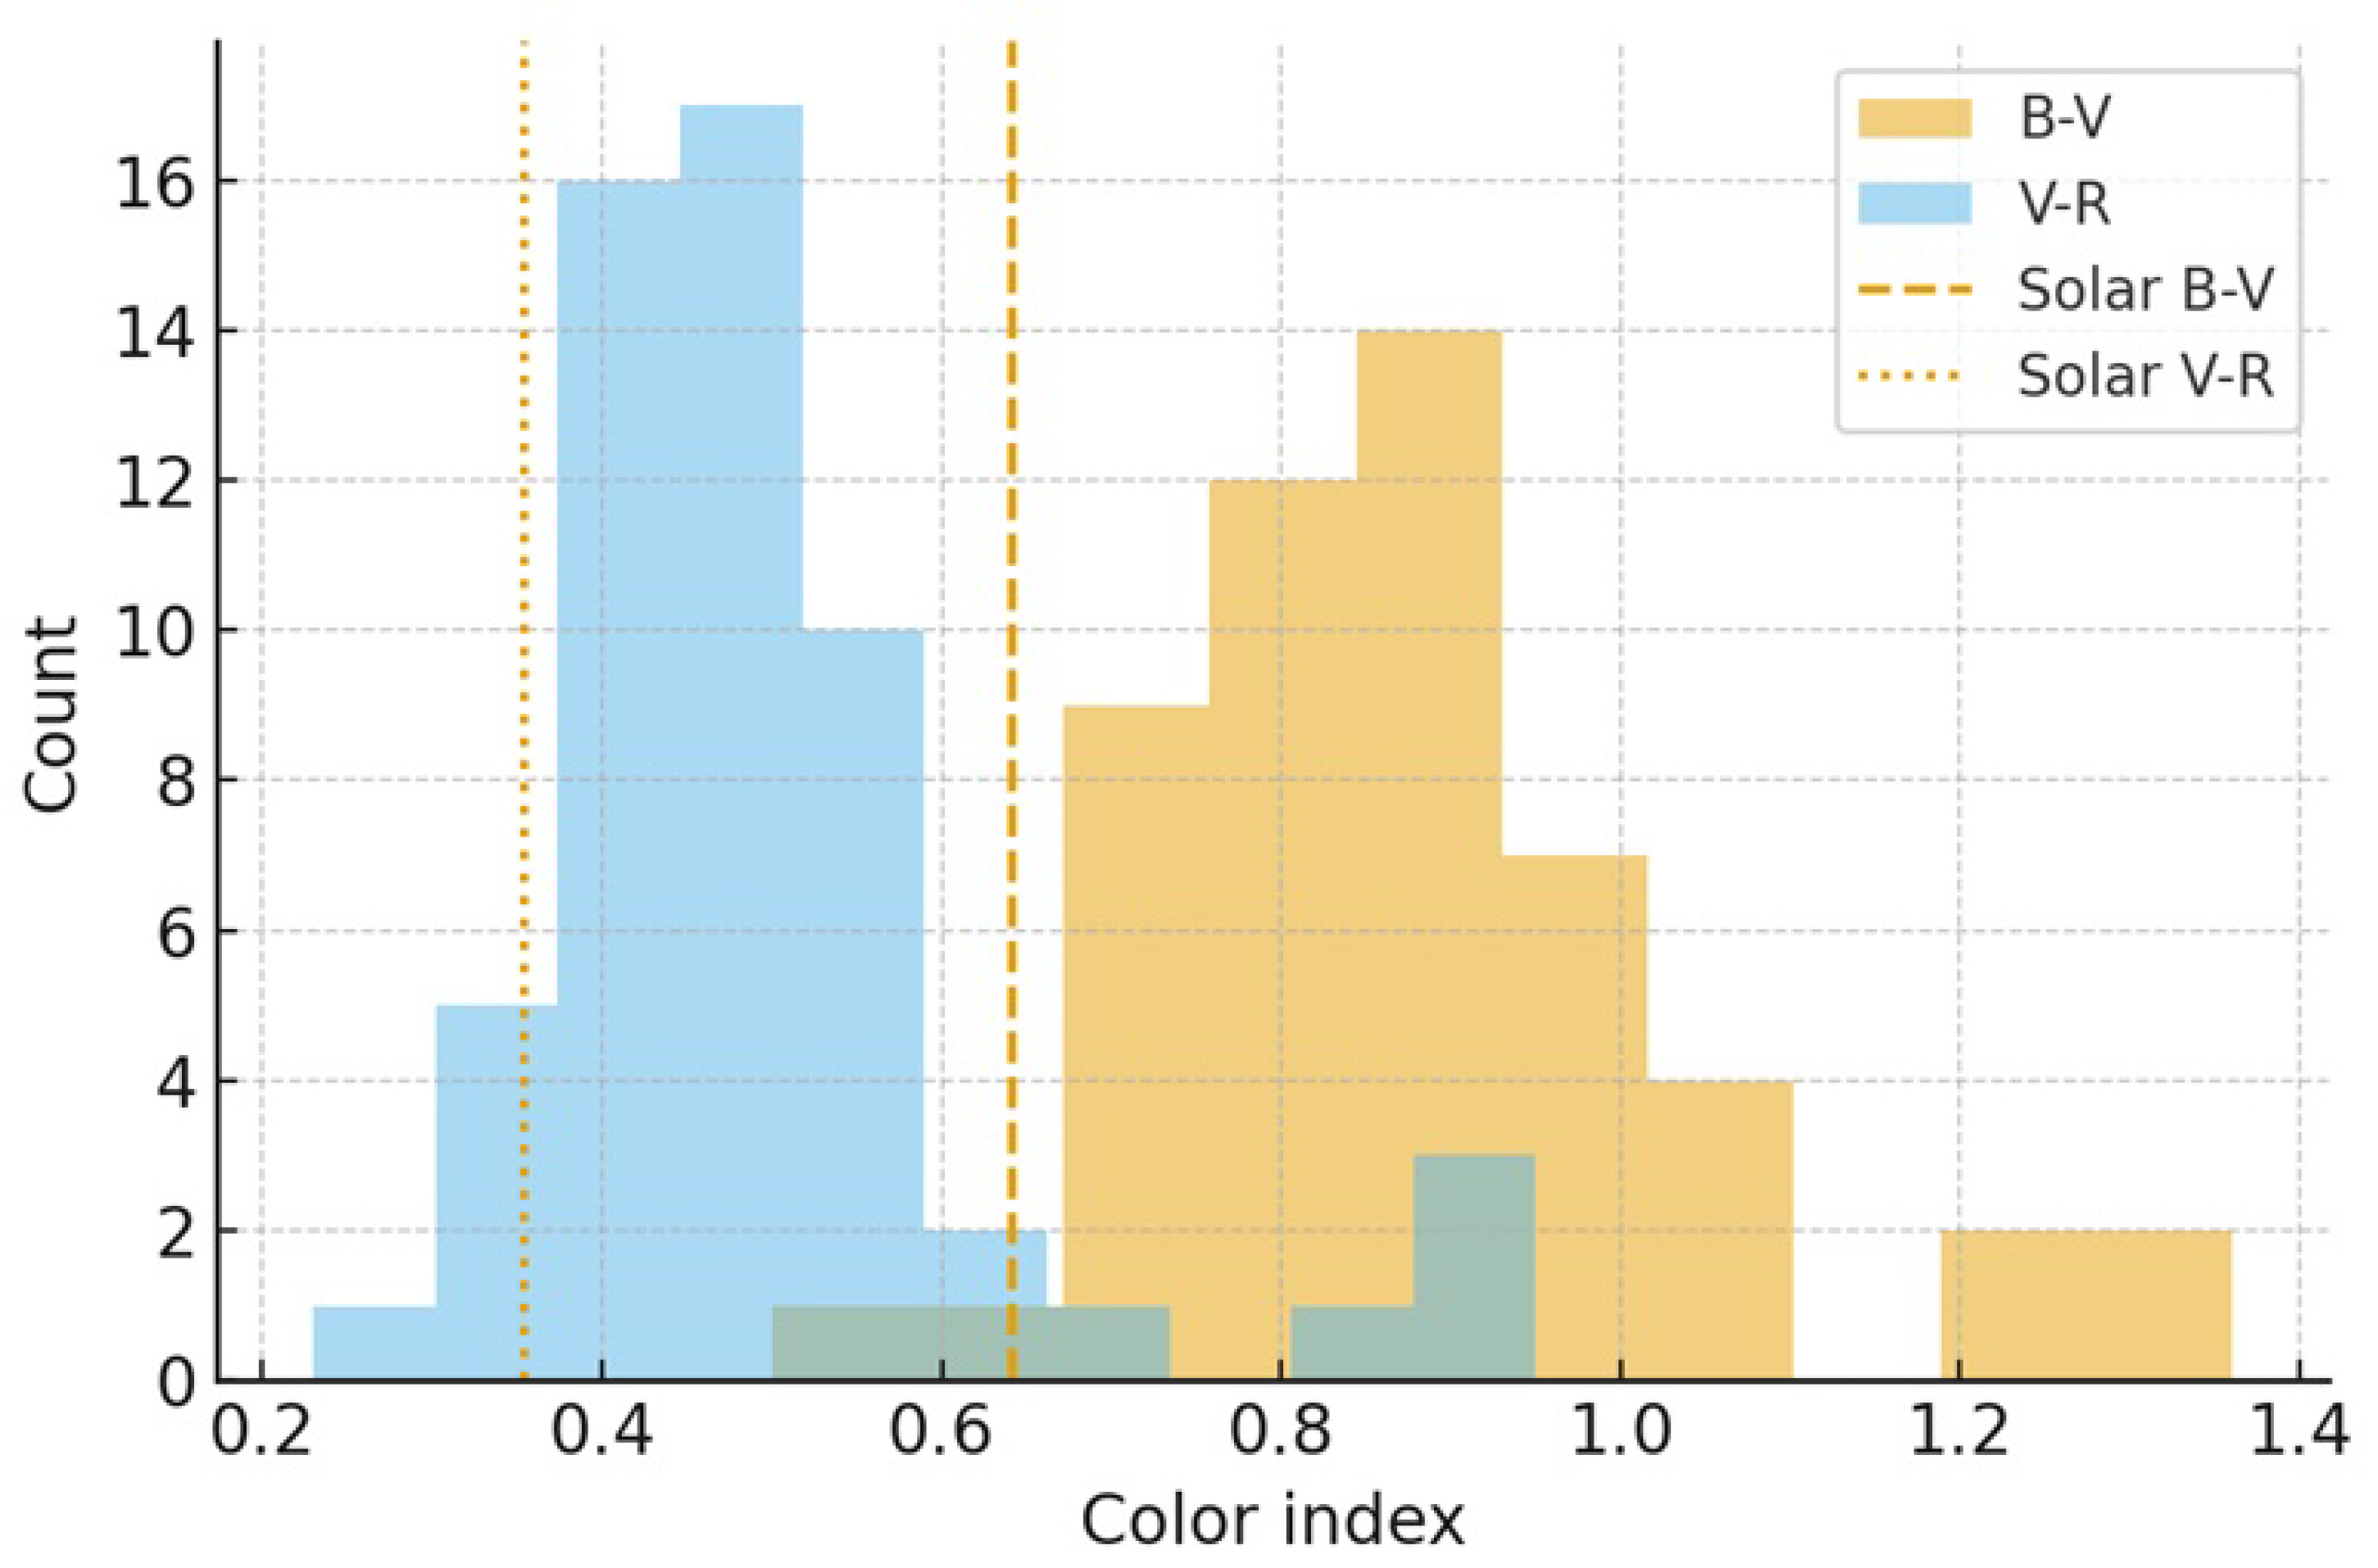
We first characterize the color distributions. The median color indices are B V = 0.89 with a median absolute deviation (MAD) of 0.09 ( n = 52 ) and V R = 0.48 with MAD = 0.05 ( n = 56 ). When compared with the adopted solar colors, the comet is systematically redder in both indices. Histograms of the B V and V R distributions (Figure A5), with the solar values overplotted as vertical reference lines, show that the solar colors lie within the first quartile of both distributions, i.e., toward the bluer edge of the sample. This indicates that the scattering material in the coma of C/2011 L4 is, on average, redder than the solar continuum.
Our color analysis is consistent with previous multi-wavelength observations of C/2011 L4. Near-infrared and optical data obtained during the pre-perihelion, inbound leg of the orbit show a very strong dust continuum whose spectral slope becomes redder as the comet approaches the Sun, with no gas emission lines (CN, HCN, CO) detected and a dust-to-gas mass ratio larger than four [30]. Although those observations refer to the inbound branch and our dataset samples the post-perihelion phase between r 1.87 and 3.70 au, together they indicate that C/2011 L4 is an unusually dust-rich comet with an optically red continuum. The systematically redder-than-solar B V and V R indices and the placement of the solar colors in the first quartile of our distributions support the view that, also after perihelion, the coma of C/2011 L4 remains dominated by a dust-rich scattering component.
Additional constraints on the dust properties of C/2011 L4 are provided by linear and circular polarimetry. Rosenbush et al. [31] obtained imaging polarimetry for C/2011 L4 at heliocentric distances and phase angles typical of active comets, and found linear polarization values compatible with those of dust-rich comets together with a weak but systematic left-handed circular polarization signal at the level of a few tenths of a percent. The detection of predominantly left-handed circular polarization in C/2011 L4, in line with the behavior observed in other comets, supports a picture in which light scattering is dominated by irregular dust grains and multiple scattering within the coma. This polarimetric view is fully consistent with our finding that the broadband colors are persistently redder than solar and show no significant evolution with heliocentric distance.
To test for color evolution with heliocentric distance, we computed Spearman rank correlation coefficients between the color indices and r. For B V versus r, we obtained ρ s 0.06 with a two-sided p 0.67 ( n = 52 ). For V R versus r, we obtained ρ s 0.14 with p 0.31 ( n = 56 ). In both cases, the correlations are statistically insignificant, providing no evidence for a monotonic trend of color with heliocentric distance in the observed interval. Within the uncertainties, the coma color is stable as the comet moves along its orbit.
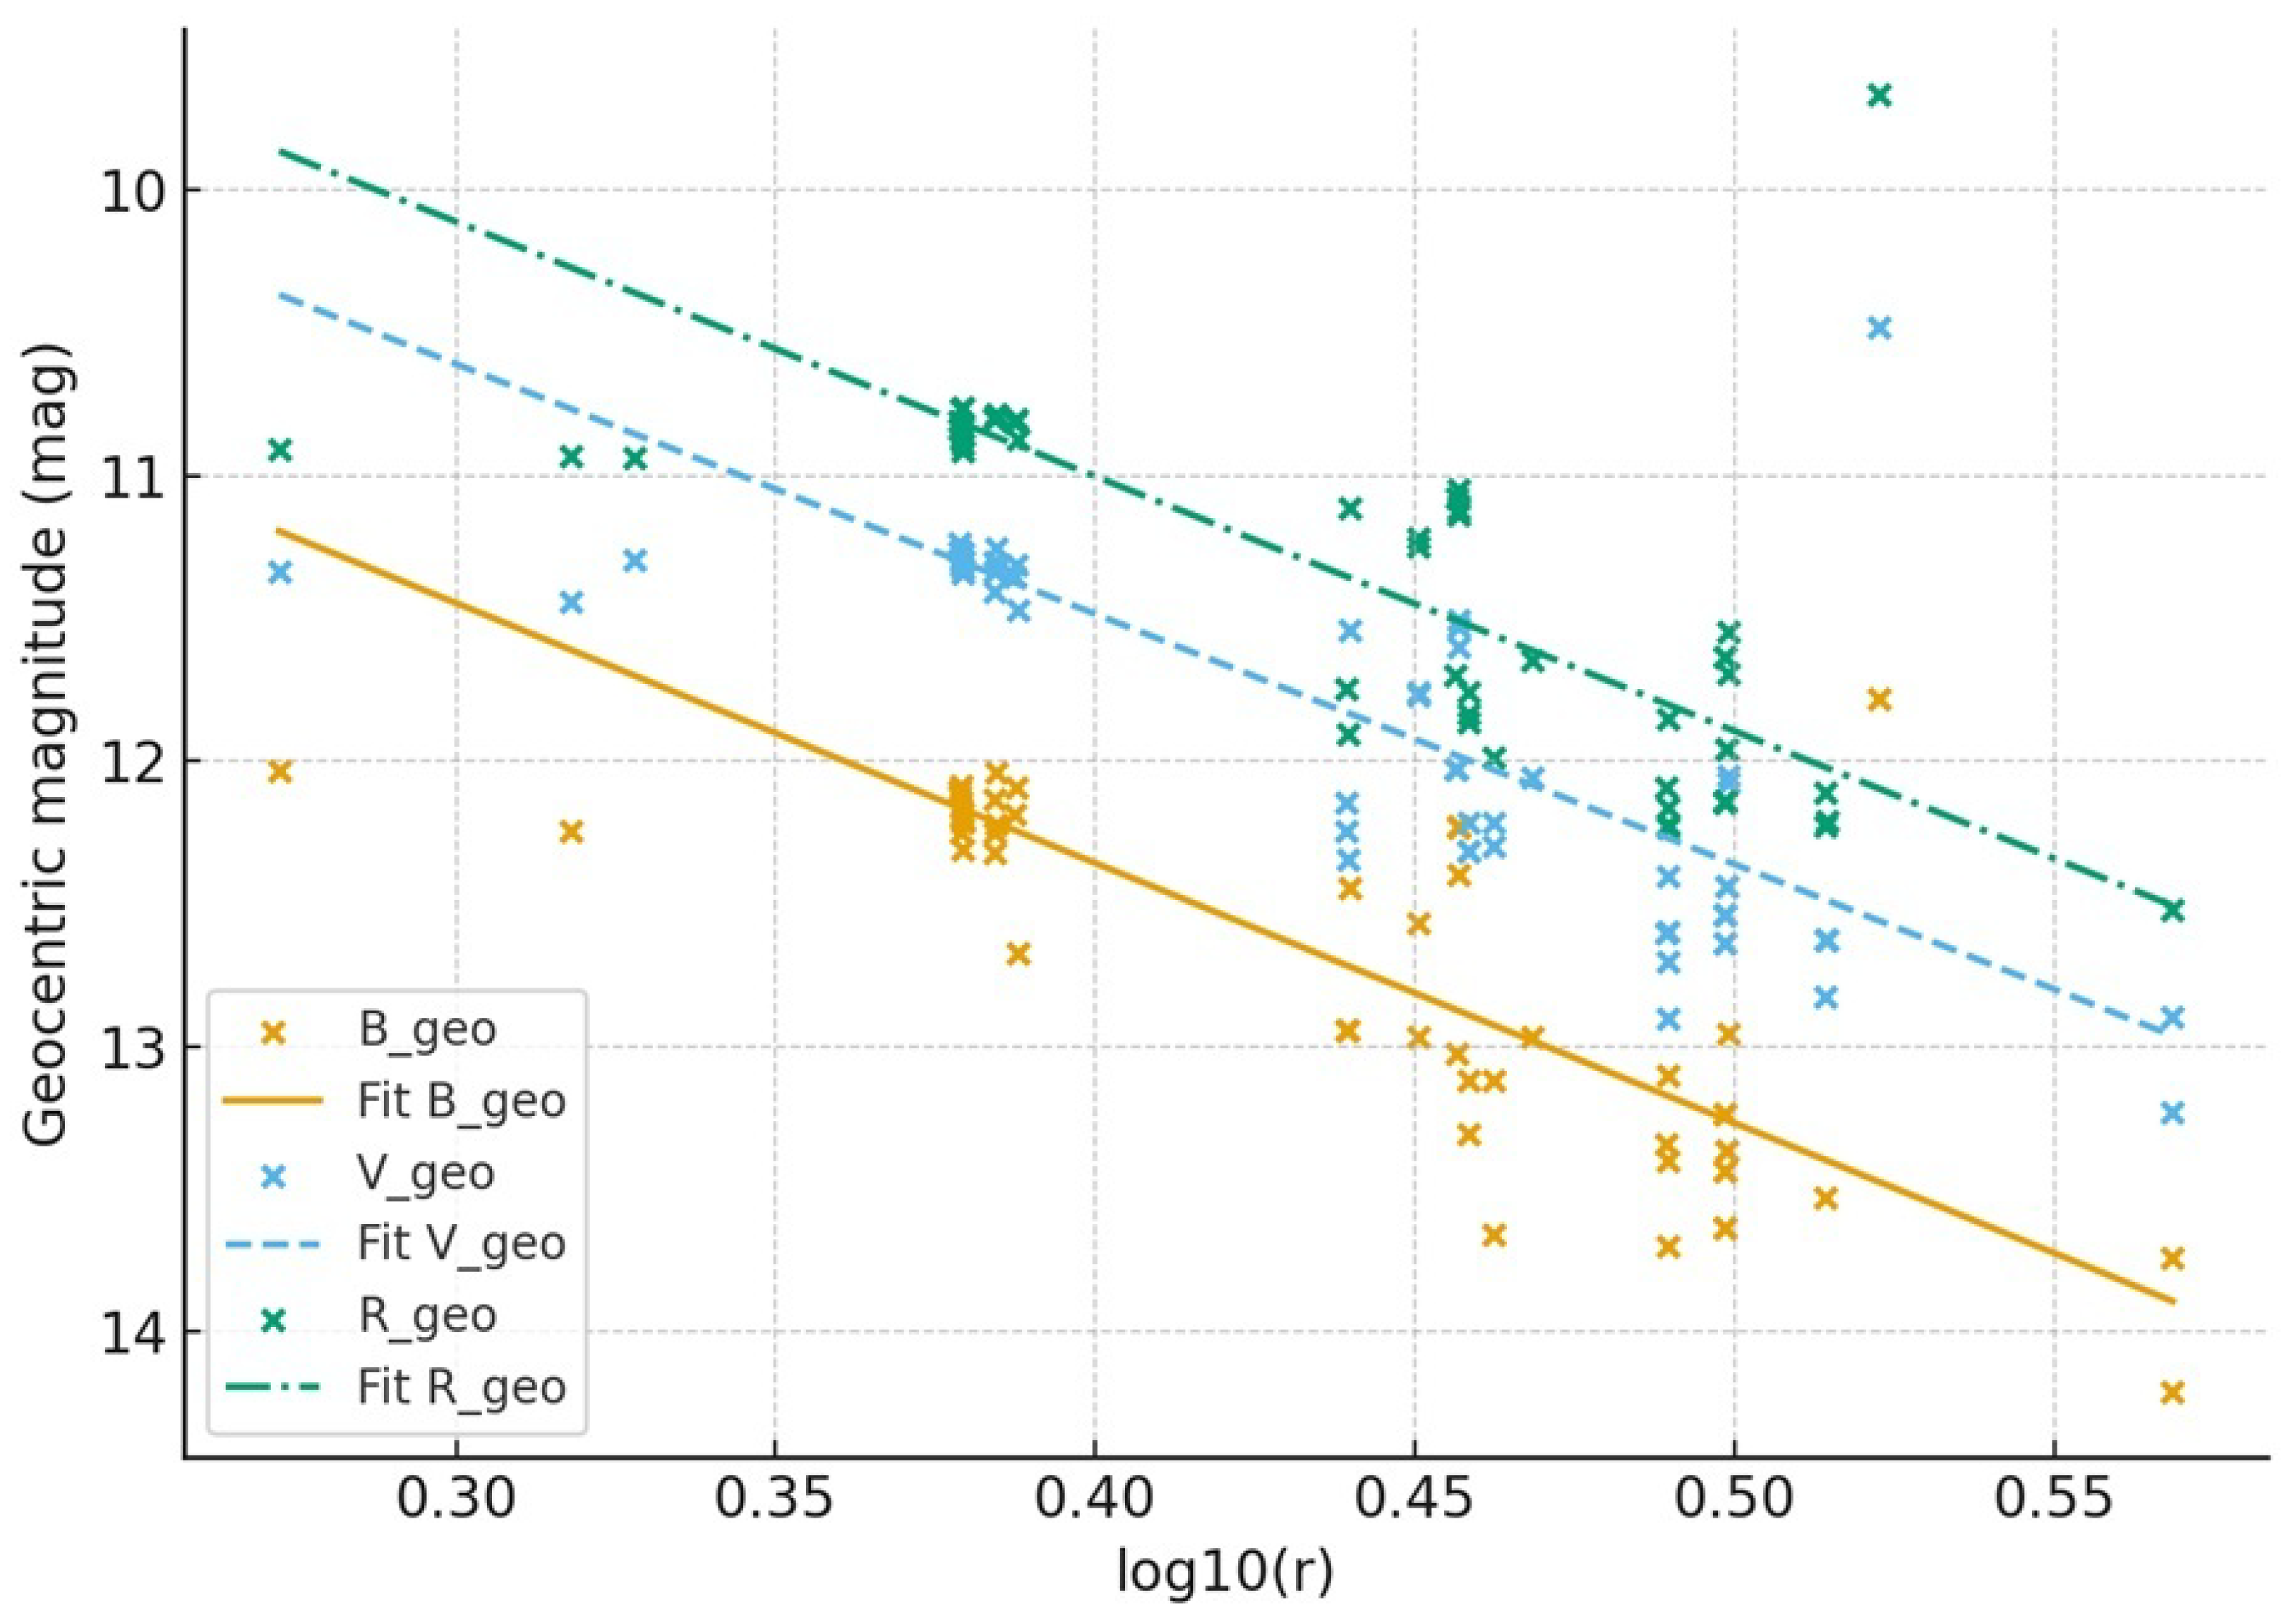
The dependence of the B-, V-, and R-band geocentric magnitudes on heliocentric distance was parameterized as
m geo = a + b log 10 r ,
with r in au (Figure A6). The resulting weighted least-squares fits (using 1 / σ m 2 as weights) yield a V = 7.98 ± 0.22 and b V = 8.77 ± 0.52 ( n = 60 ), a R = 7.43 ± 0.25 and b R = 8.93 ± 0.57 ( n = 56 ), and a B = 8.71 ± 0.28 and b B = 9.11 ± 0.67 ( n = 52 ).
From the intercepts, we derived “absolute” colors associated with these activity laws:
( B V ) 0 = a B a V = 0.73 ± 0.36 , ( V R ) 0 = a V a R = 0.55 ± 0.33 .
Within the rather large uncertainties, these values are consistent with the observed median colors, and their central values remain redder than the solar reference.
To probe differential radial behavior across filters, we compared the exponents of the activity laws. Using b = 2.5 n , we obtain
Δ n B V = b B b V 2.5 = 0.14 ± 0.34 , Δ n V R = b V b R 2.5 = 0.06 ± 0.31 .
Both differences are statistically consistent with zero, indicating no significant differential radial behavior between the B, V, and R bands. These small and poorly constrained differential heliocentric exponents are fully consistent with the non-significant Spearman coefficients discussed above.
Taken together, these diagnostics provide a coherent picture. The color distributions and intercept-based absolute colors show that C/2011 L4 is persistently redder than the Sun, indicating dust-dominated scattering with typical cometary reddening. The non-significant rank correlations and the consistent radial slopes across B, V, and R demonstrate that this red color remains effectively constant over the sampled heliocentric range, with no robust evidence for color gradients associated with changing activity level or dust properties.

3.4. C/2012 J1 (Catalina)

We analyzed the pre-perihelion broadband color indices B R and V R , and the V-band magnitudes of comet J1, based on 24 paired measurements of B, V, and R in the heliocentric range 3.17 r 3.28 au, obtained between 6 September 2012 (UT 0.98) and 12 November 2012 (UT 0.40), as listed in Table 2 in [21].
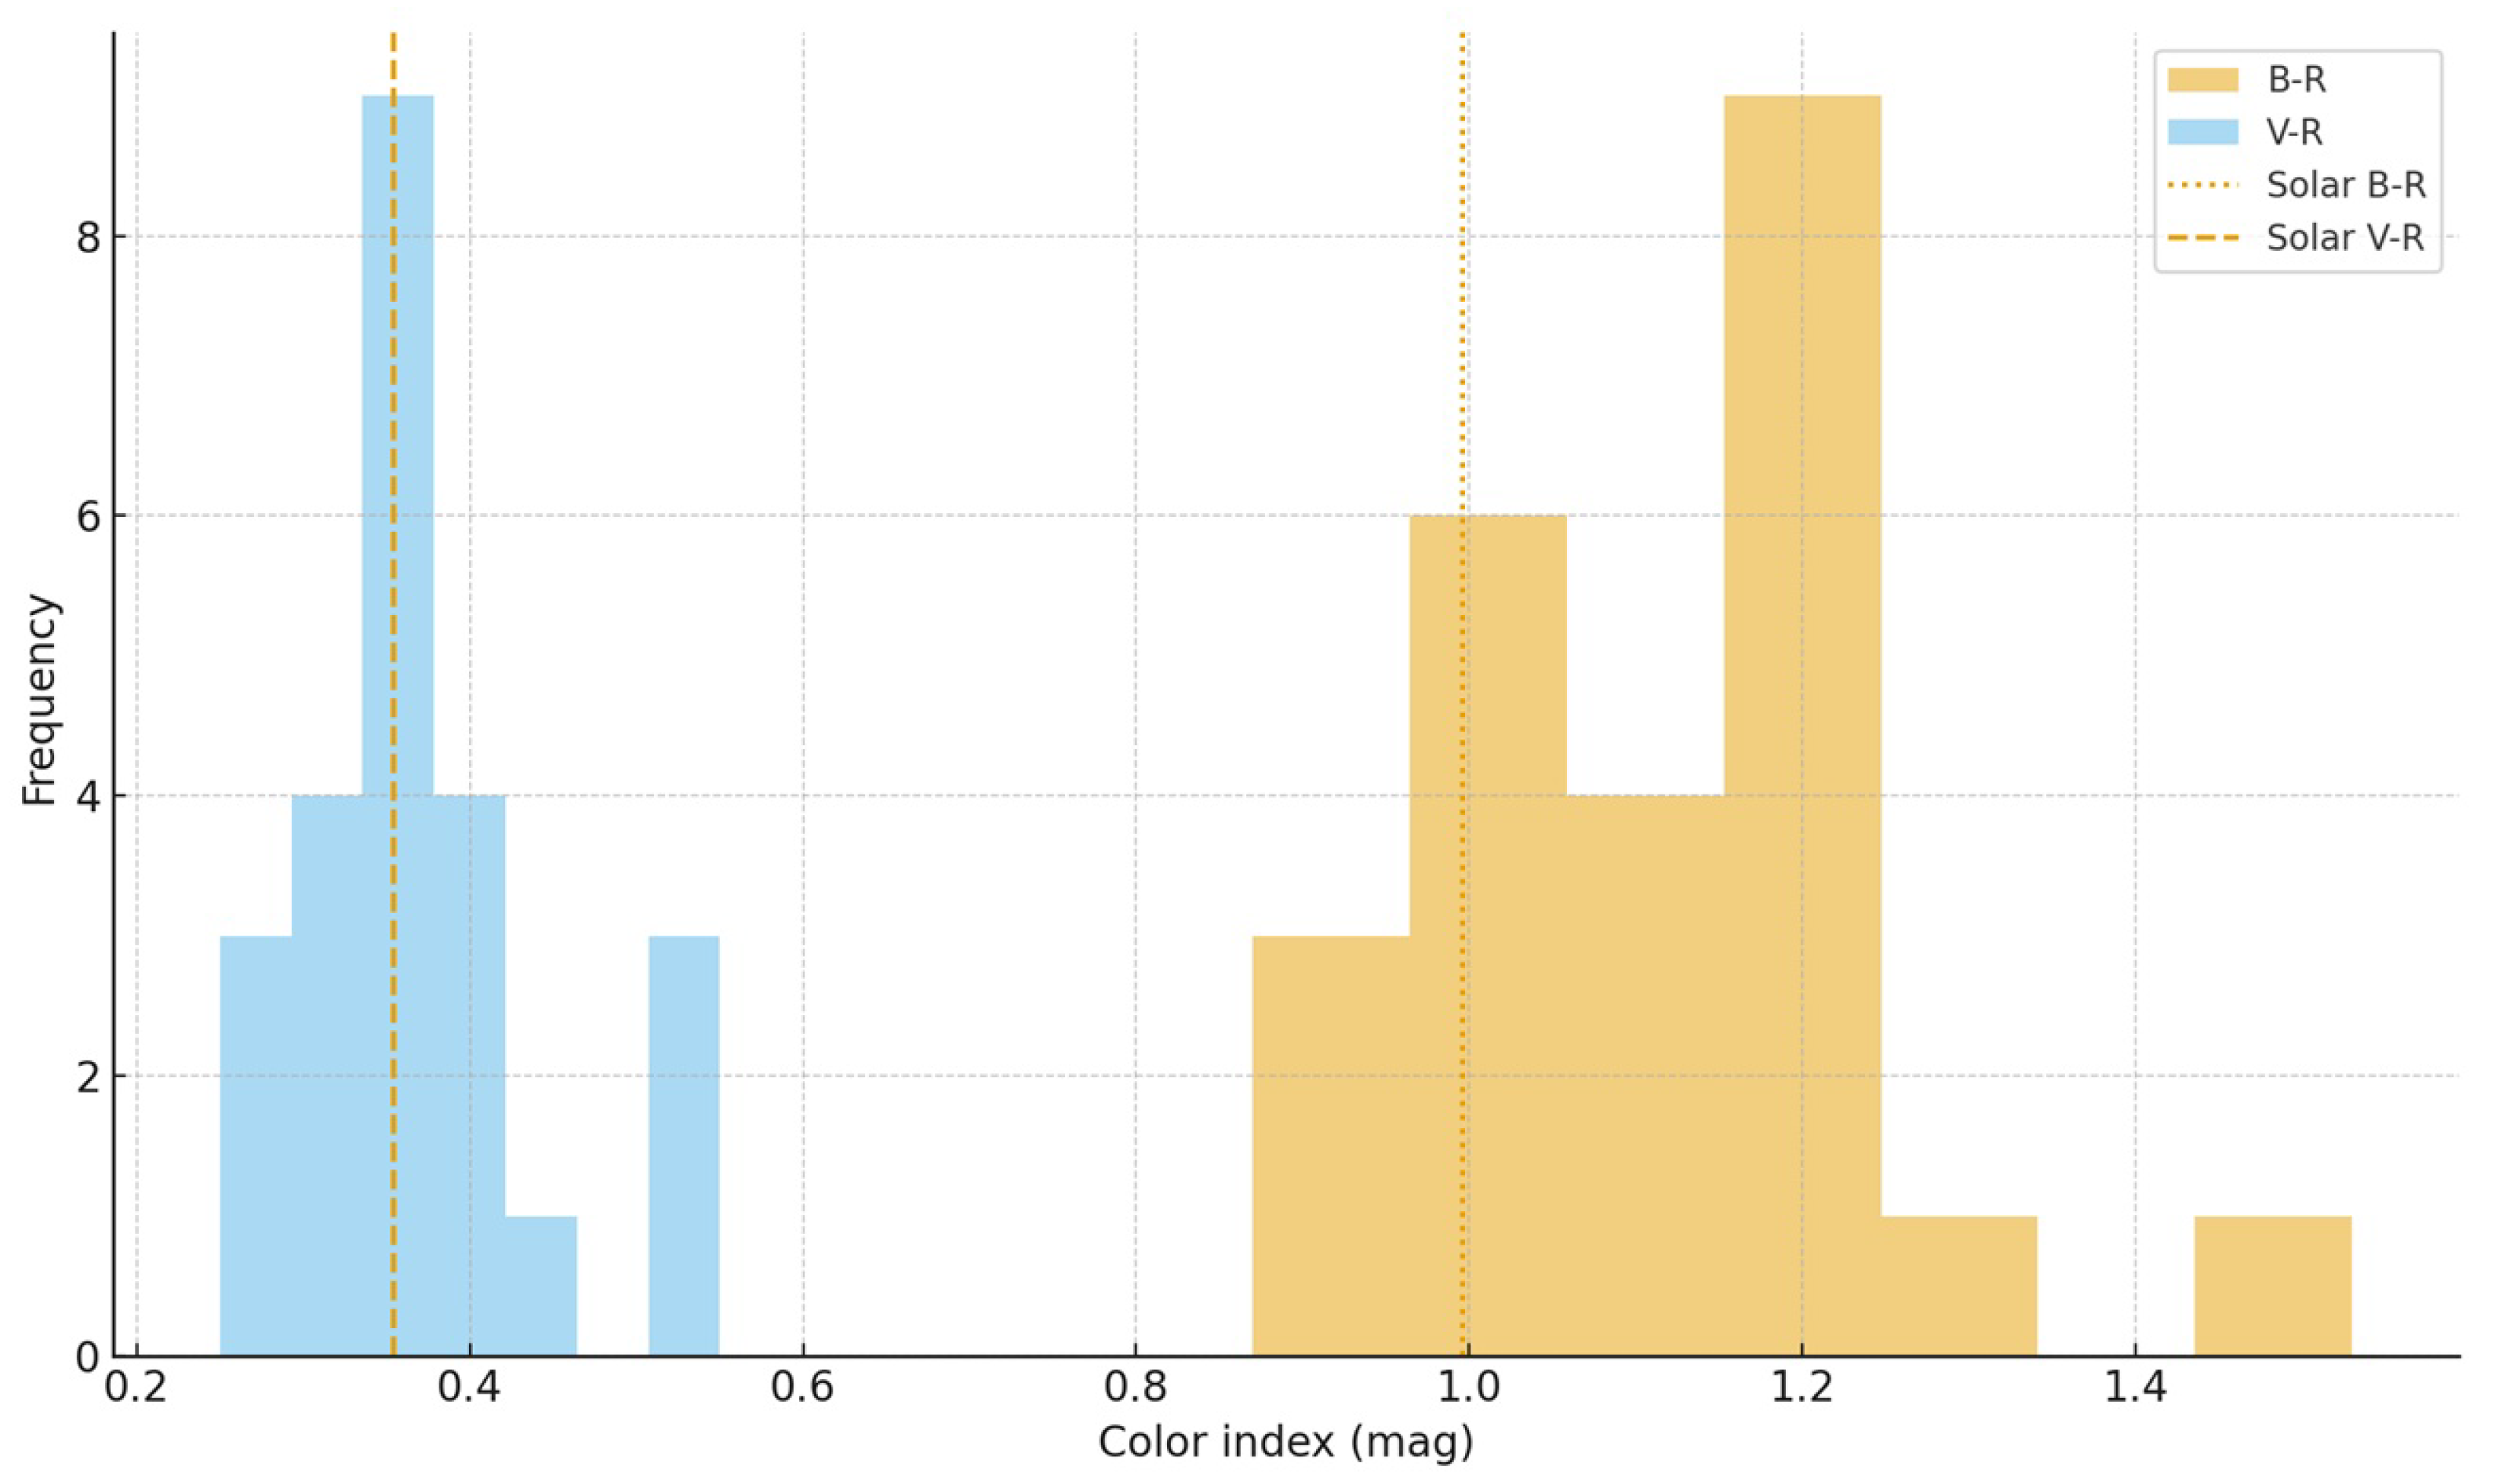
The resulting color distributions are moderately narrow. The median and median absolute deviation are B R = 1.135 (MAD = 0.080) and V R = 0.365 (MAD = 0.035). For comparison, we adopted solar reference colors B R = 0.996 ± 0.019 and V R = 0.354 ± 0.010 . In B R , the solar color lies in the first quartile of the cometary distribution ( 21st percentile), well below the median and also below the interquartile range [ Q 1 , Q 3 ] [ 1.045 , 1.182 ] . In V R , the solar value falls between the first quartile and the median ( 33rd percentile) within [ Q 1 , Q 3 ] [ 0.33 , 0.395 ] . These diagnostics show that the coma is clearly redder than the Sun in B R , whereas in V R it is essentially solar-like.
The histograms of B R and V R for J1, plotted in the same panel with vertical reference lines at the solar colors (Figure A7), visually confirm this behavior. The B R distribution is offset toward larger values relative to B R , with no overlap between the solar color and the highest-density region of the sample. In contrast, the V R distribution peaks very close to V R , and the solar value lies well within the core of the distribution. The combination of medians, dispersion measures, and quartile positions therefore indicates a dust-dominated coma that is moderately red in the blue–red baseline, while retaining a nearly solar continuum slope in the visual–red interval.
To investigate possible heliocentric trends, we applied Spearman’s rank correlation test between the color indices and the heliocentric distance r. For B R versus r, we obtained ρ = 0.26 with p 0.22 ( N = 24 ), indicating a weak positive correlation that is not statistically significant at conventional confidence levels. For V R versus r, the correlation is even weaker, with ρ = 0.15 and p 0.50 . In both cases, the p-values are much larger than 0.05, so there is no evidence of a monotonic color–distance trend over the very limited heliocentric interval sampled. Within the uncertainties, both color indices can be regarded as constant with r.
For consistency with the rest of the comet sample, we also attempted to derive “absolute” colors and differential heliocentric indices by fitting geocentric magnitudes as a function of log r in each filter and combining the fitted coefficients. However, in the case of J1, the baseline in r is too short for these regressions to be well-constrained: the fitted intercepts and slopes are strongly covariant, and the propagated uncertainties on the derived absolute colors and differential indices are comparable to or larger than the values themselves. As a result, these regression-based color diagnostics are not physically informative for J1 and are not used in our quantitative conclusions. The robust information is provided by the distribution-based statistics and rank correlations, which consistently indicate a coma redder than the Sun in B R , solar-like in V R , and with no statistically significant chromatic evolution over the observed heliocentric range.
Independent polarimetric and spectroscopic observations of C/2012 J1 (Catalina) at r 3.17 au with the 6 m BTA telescope [32] found a mean linear polarization of about 2 % across the coma and detected CN emission in the (0–0) band, with a gas production rate Q ( CN ) 3.7 × 10 23 molecules s−1. Such a low negative polarization at small phase angles is typical of dust-dominated comae, while the modest CN production implies that gas emission is present but does not overwhelm the dust continuum in the optical bands. These independent diagnostics are fully consistent with our color analysis, in which the coma appears moderately red in B R , essentially solar in V R , and shows no statistically significant color–distance trends over 3.17 r 3.28 au.

3.5. C/2012 K1 (PANSTARRS)

We analyzed 42 pre-perihelion epochs of its orbit, obtained between 14 March 2014 (UT 0.096) and 18 May 2014 (UT 0.092), corresponding to heliocentric distances from 2.672 to 1.907 au, as listed in Table 3 in [11].
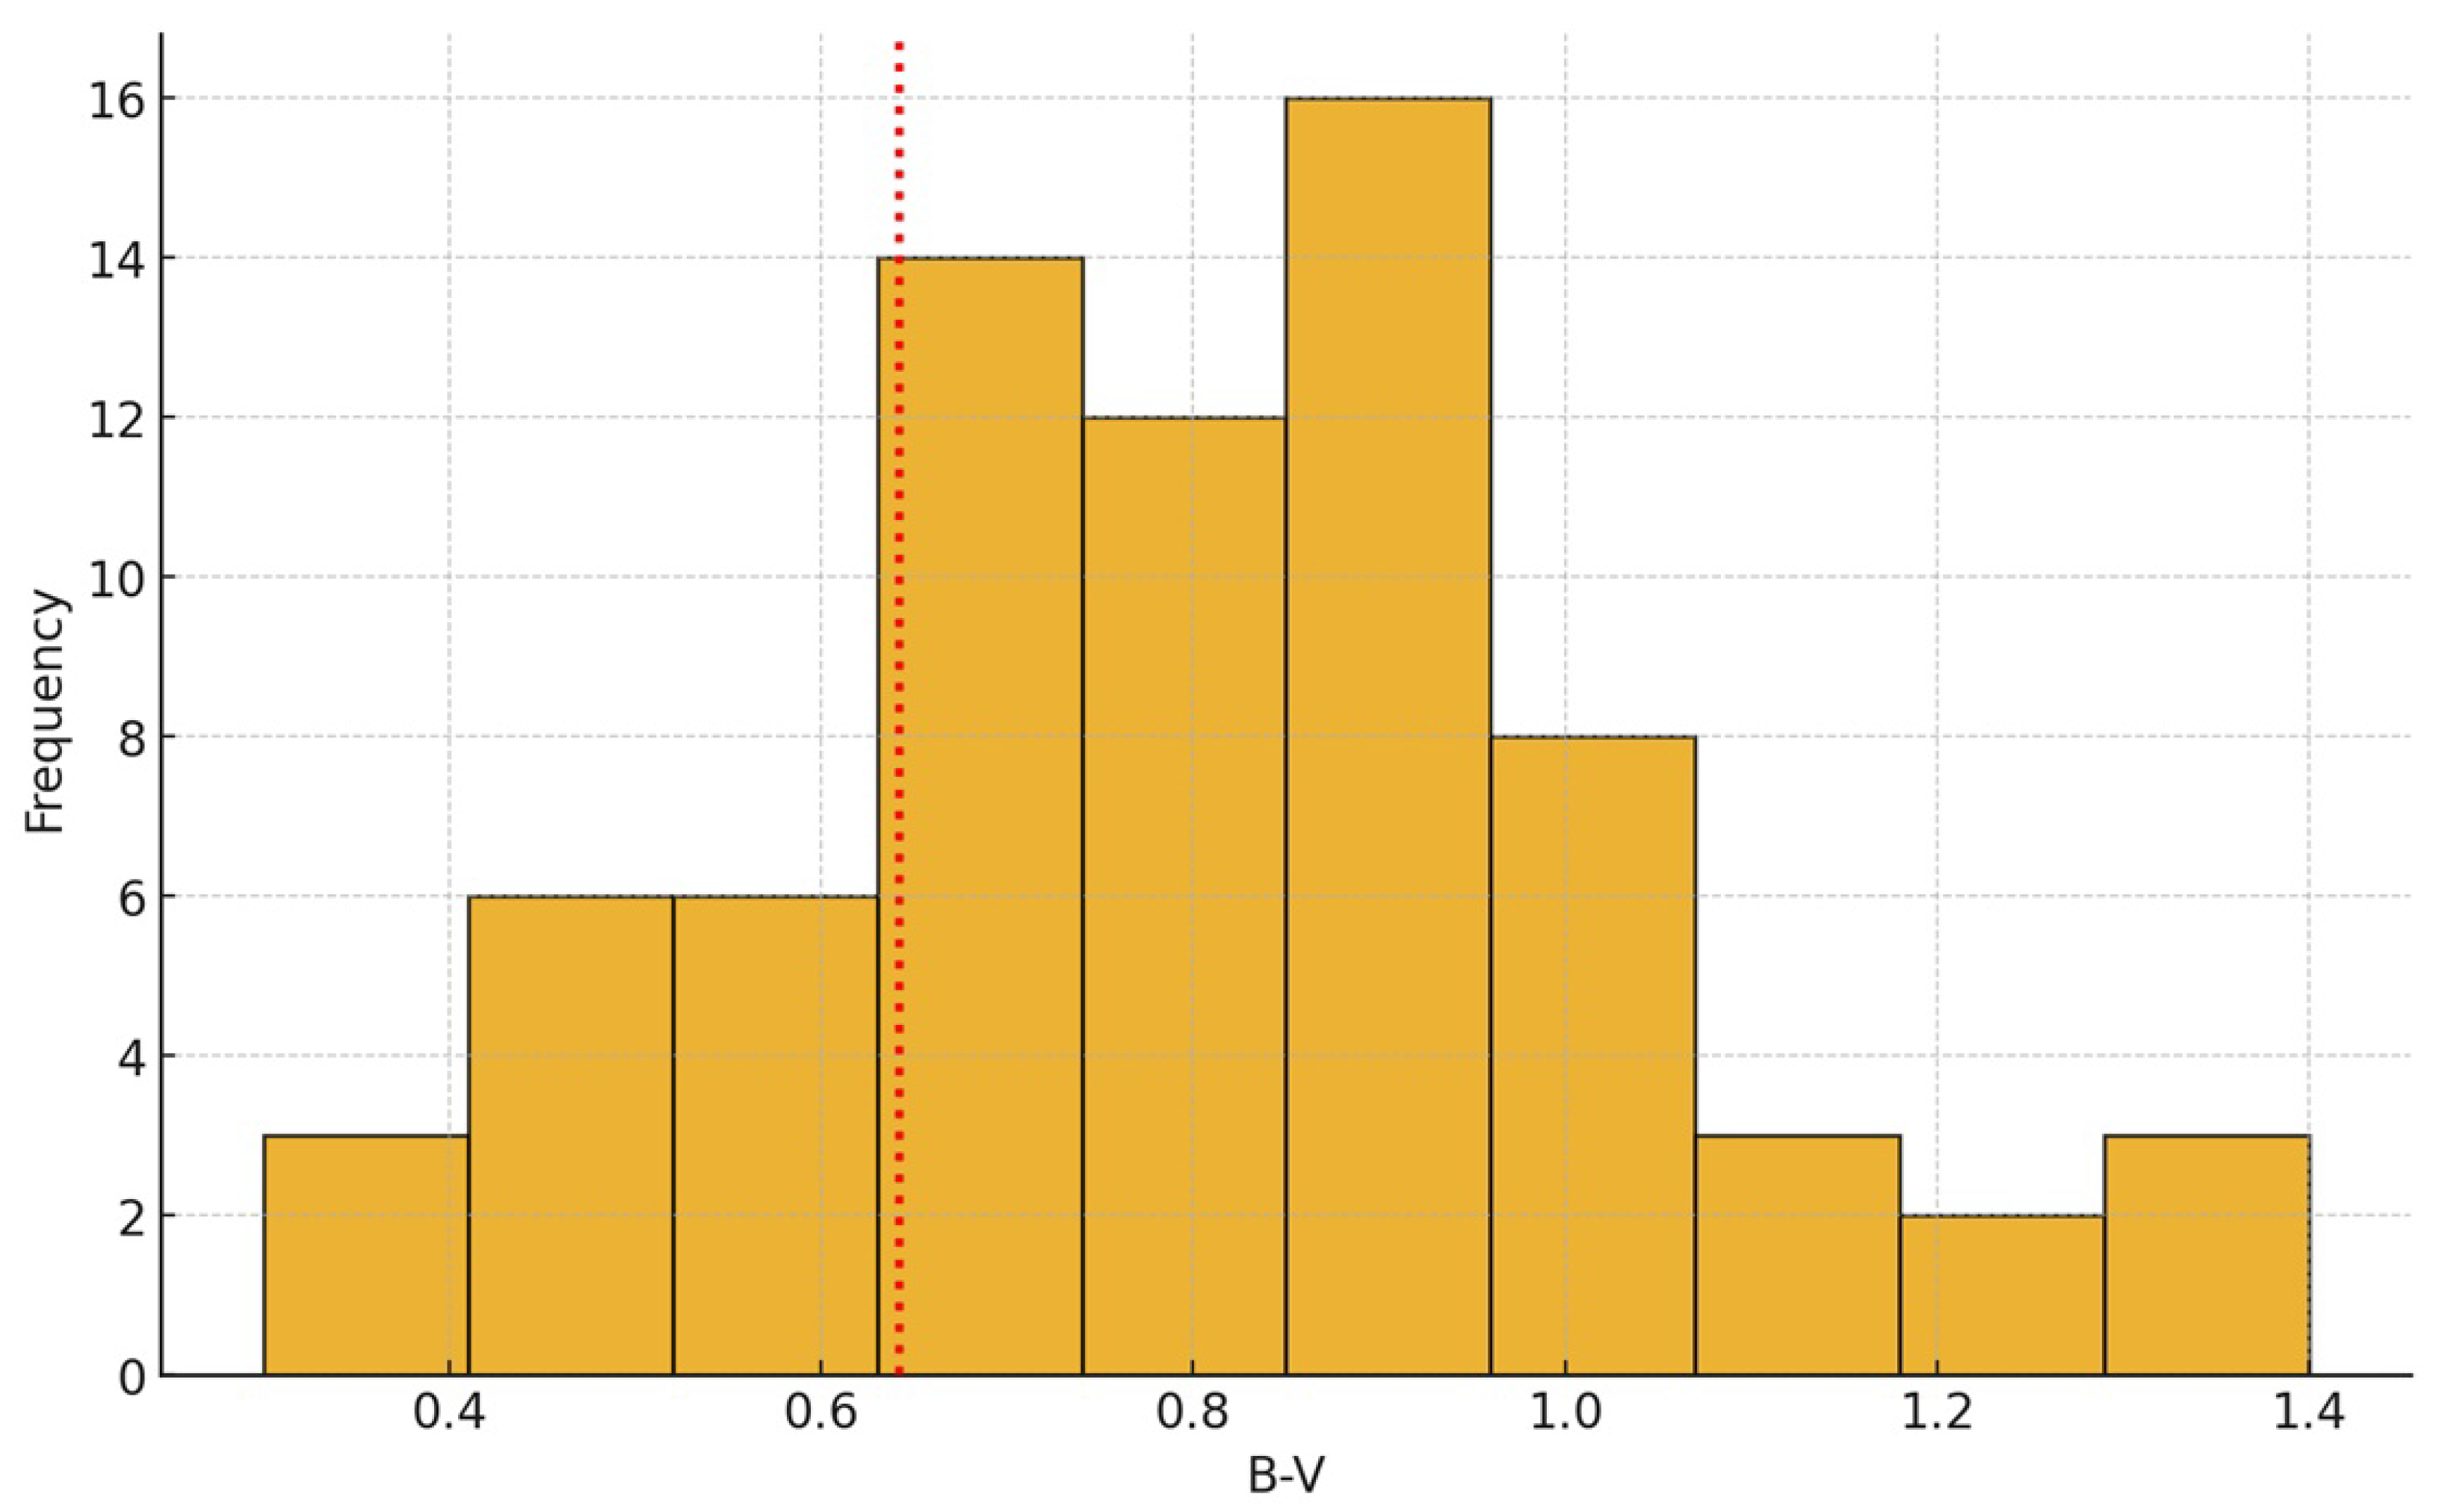
The color distributions are redder than solar (Figure A8). For N = 42 , the medians are B V med = 0.730 with MAD = 0.105 and V R med = 0.430 with MAD = 0.040 . A sign test indicates B V above solar in 29 / 42 cases ( p = 1.95 × 10 2 ) and V R above solar in 38 / 42 cases ( p = 5.65 × 10 8 ). The solar colors lie at the 31st percentile for B V and at the 9.5th percentile for V R , in agreement with the histograms that include the solar reference lines.
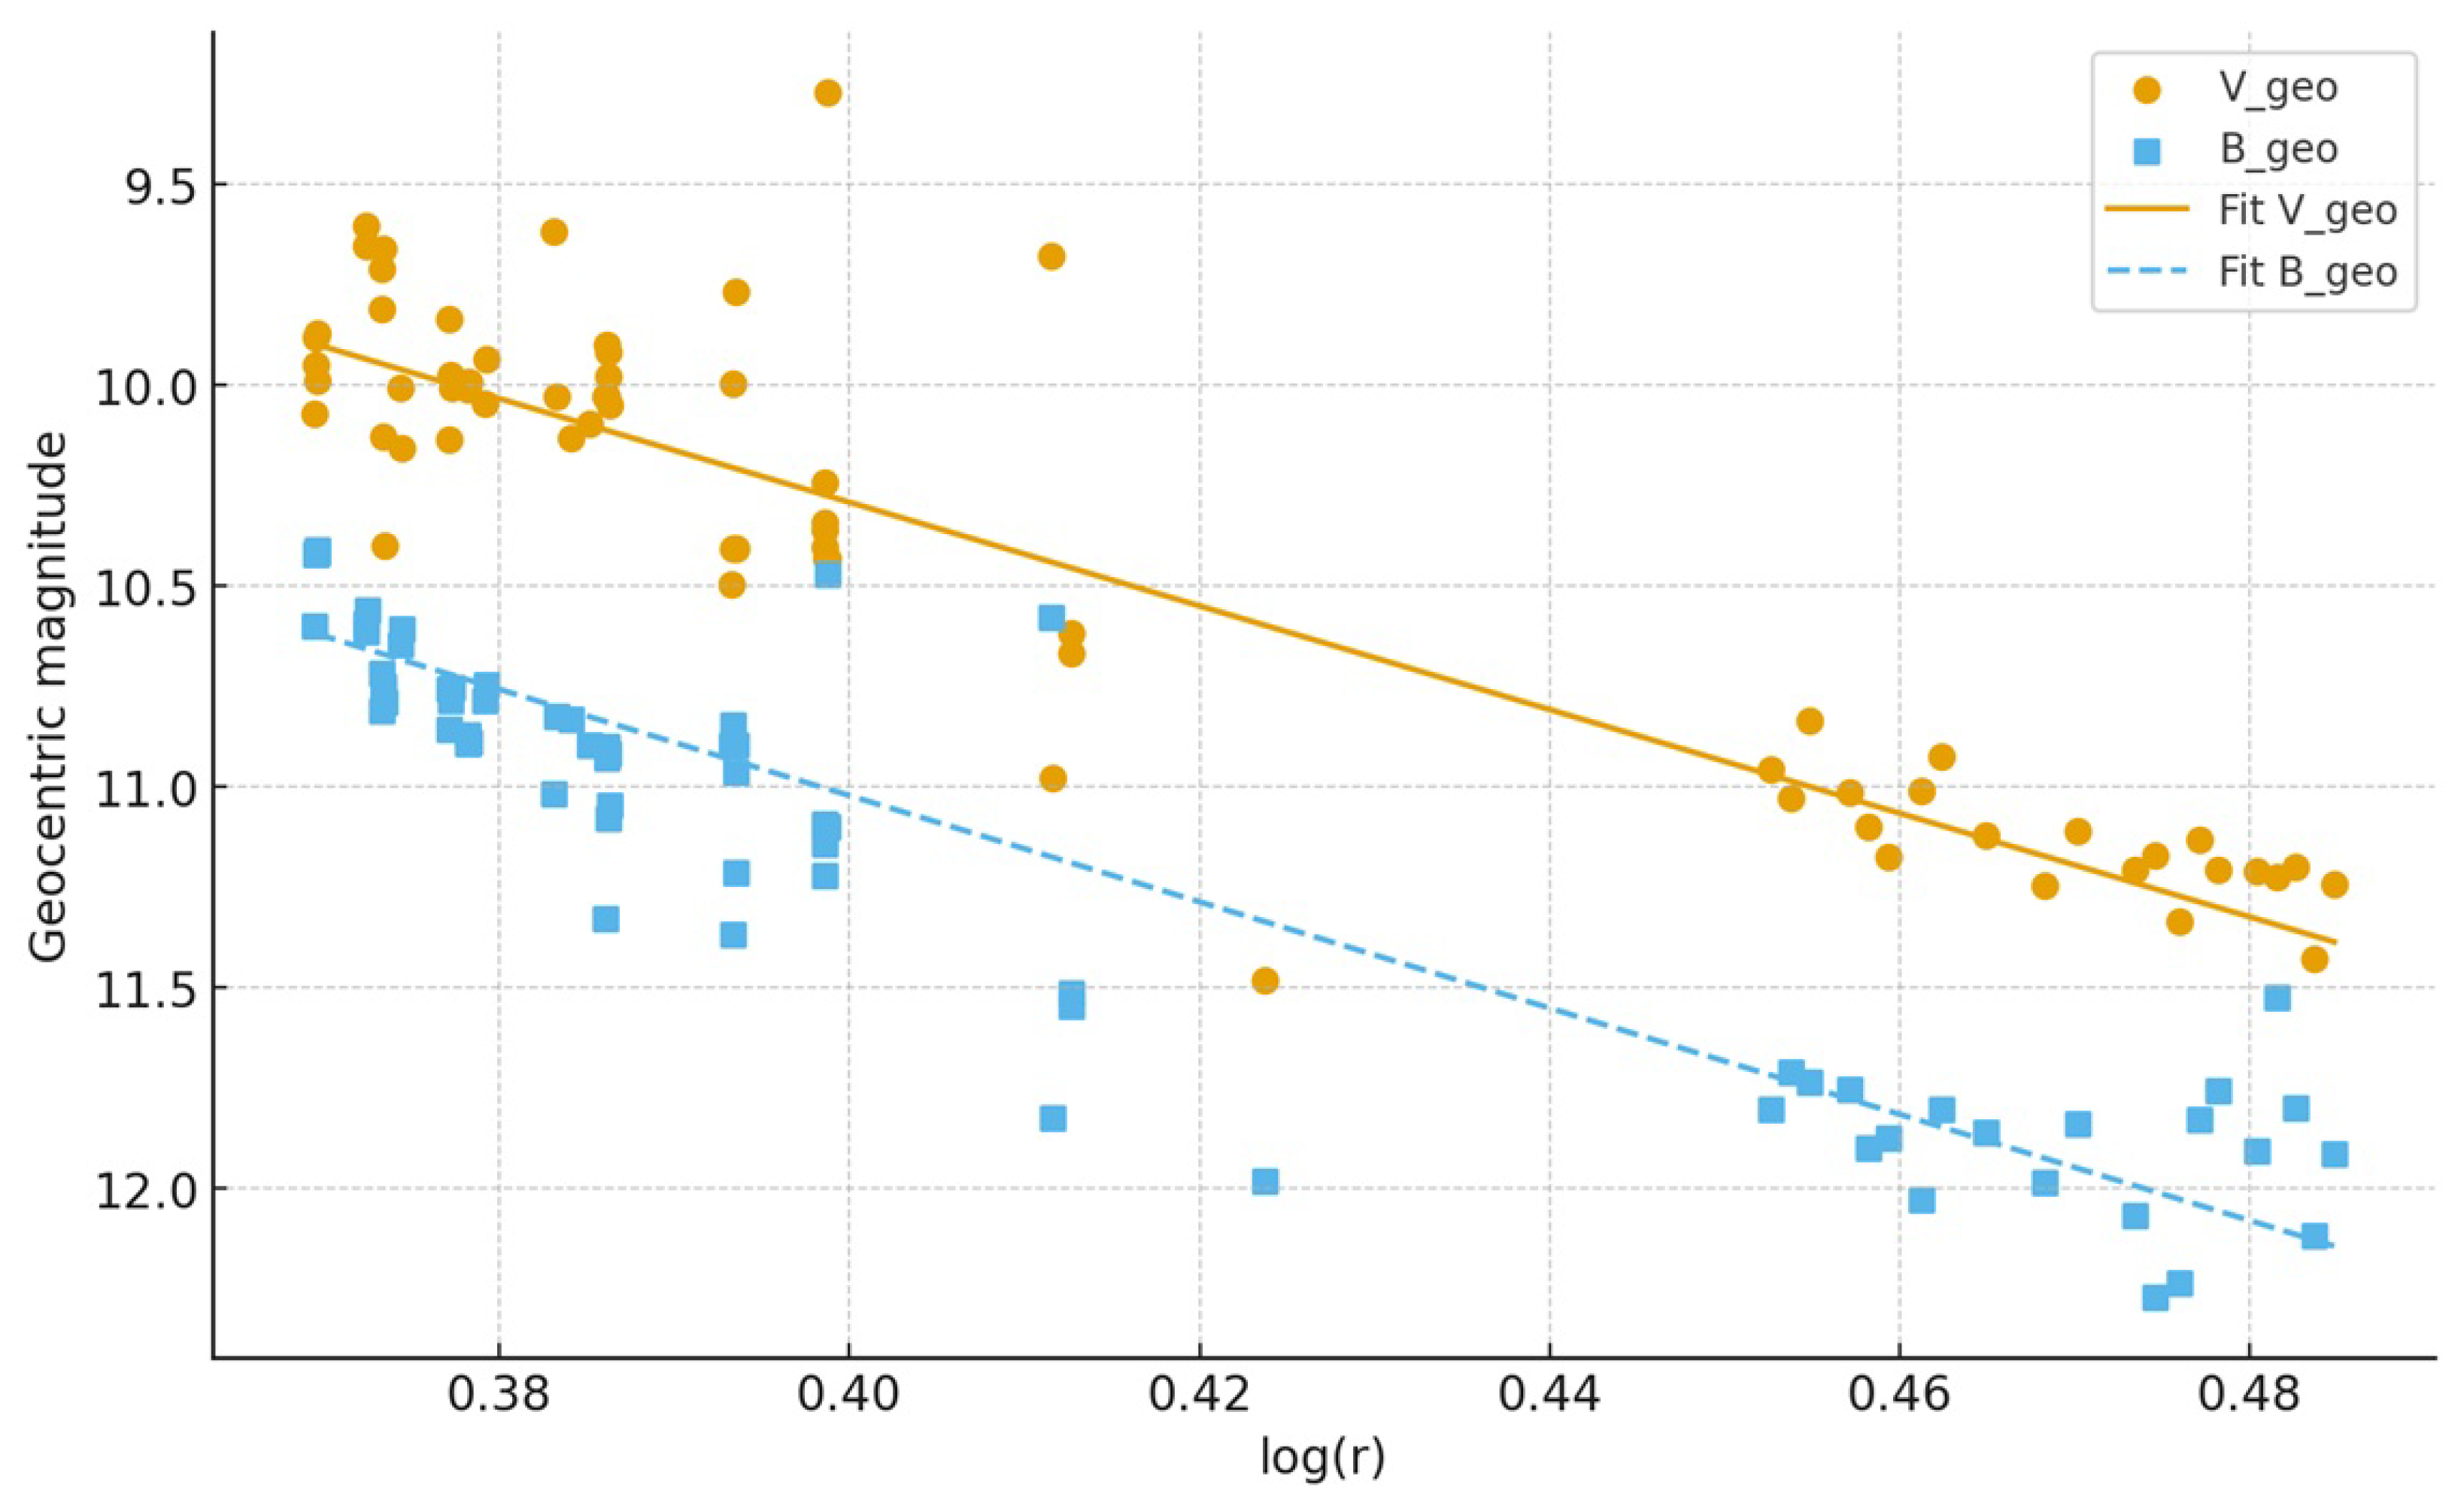
Monotonic relationships with distance were tested with Spearman’s rank correlation. For B V versus r, we obtain ρ = 0.305 and p = 4.98 × 10 2 , which indicates a weak positive correlation. For V R versus r, we obtain ρ = 0.012 and p = 0.938 , which are consistent with no correlation. Weighted linear fits to the reduced magnitudes, m geo = a + b log 10 r , quantify the photometric behavior (Figure A9):
B geo : a = 11.1807 ± 0.3276 , b = + 1.4454 ± 0.9040 , V geo : a = 11.3901 ± 0.1671 , b = 0.9779 ± 0.4524 , R geo : a = 10.8625 ± 0.2691 , b = 0.6811 ± 0.7521 .
From these fits, we formed two diagnostics. First, absolute color proxies at r = 1 au from the intercepts give Abs ( B V ) = a B a V = 0.209 ± 0.368 and Abs ( V R ) = a V a R = + 0.528 ± 0.317 . The V R proxy agrees with the sample median within 1 σ . The B V proxy is poorly constrained because b B and b V have opposite signs, which makes the extrapolation to r = 1 au sensitive to slope uncertainties. Second, color slope indices Δ n ( b 1 b 2 ) / 2.5 translate fit slopes into differential heliocentric color dependences. We find Δ n ( B V ) = 0.969 ± 0.404 , which corresponds to b B b V = 2.5 Δ n = 2.42 ± 1.01 > 0 and indicates that B V increases with log 10 r . We also find Δ n ( V R ) = 0.119 ± 0.351 , which is statistically indistinguishable from zero and supports the null Spearman result for V R .
The synthesis of all tests is coherent. The coma is redder than the Sun in both colors. B V shows a weak but statistically significant heliocentric trend that is consistent across the Spearman test, the Δ n index, and the weighted linear fits, whereas V R remains approximately constant with r. A plausible physical interpretation is that the short-wavelength side of the spectrum is more sensitive to activity variations, such as gas contamination affecting the B band or a heliocentric evolution of the dust size distribution, while the continuum from V to R remains dust-dominated and stable over the sampled heliocentric range, in line with mid-infrared SOFIA/FORCAST observations showing a dust-dominated coma of fractally solid, carbon-rich grains in C/2012 K1 (PANSTARRS) [33]. Near-infrared Keck/NIRSPEC spectroscopy further shows that comet PANSTARRS is a dynamically new Oort Cloud comet with a chemically complex mixture of primary volatiles, with CH3OH and C2H6 enriched and several other species depleted relative to the median Oort-cloud population [34], reinforcing the view that color–distance trends in the blue are controlled by the interplay between gas emission and a dust-dominated continuum.

3.6. C/2012 S1 (ISON)

The V R data for comet ISON analyzed here were extracted from Table 9 in Betzler et al. [10]. These observations were obtained between 21 November 2012 (UT 0.4951) and 22 October 2013 (UT 0.2479), corresponding to a heliocentric distance range from 5.640 to 1.220 au in the pre-perihelion phase, before the destruction of the object. The V magnitudes were measured but not published on that occasion; they remained in our internal archive and are used here for the first time, as listed in Table A6 and Table A7.
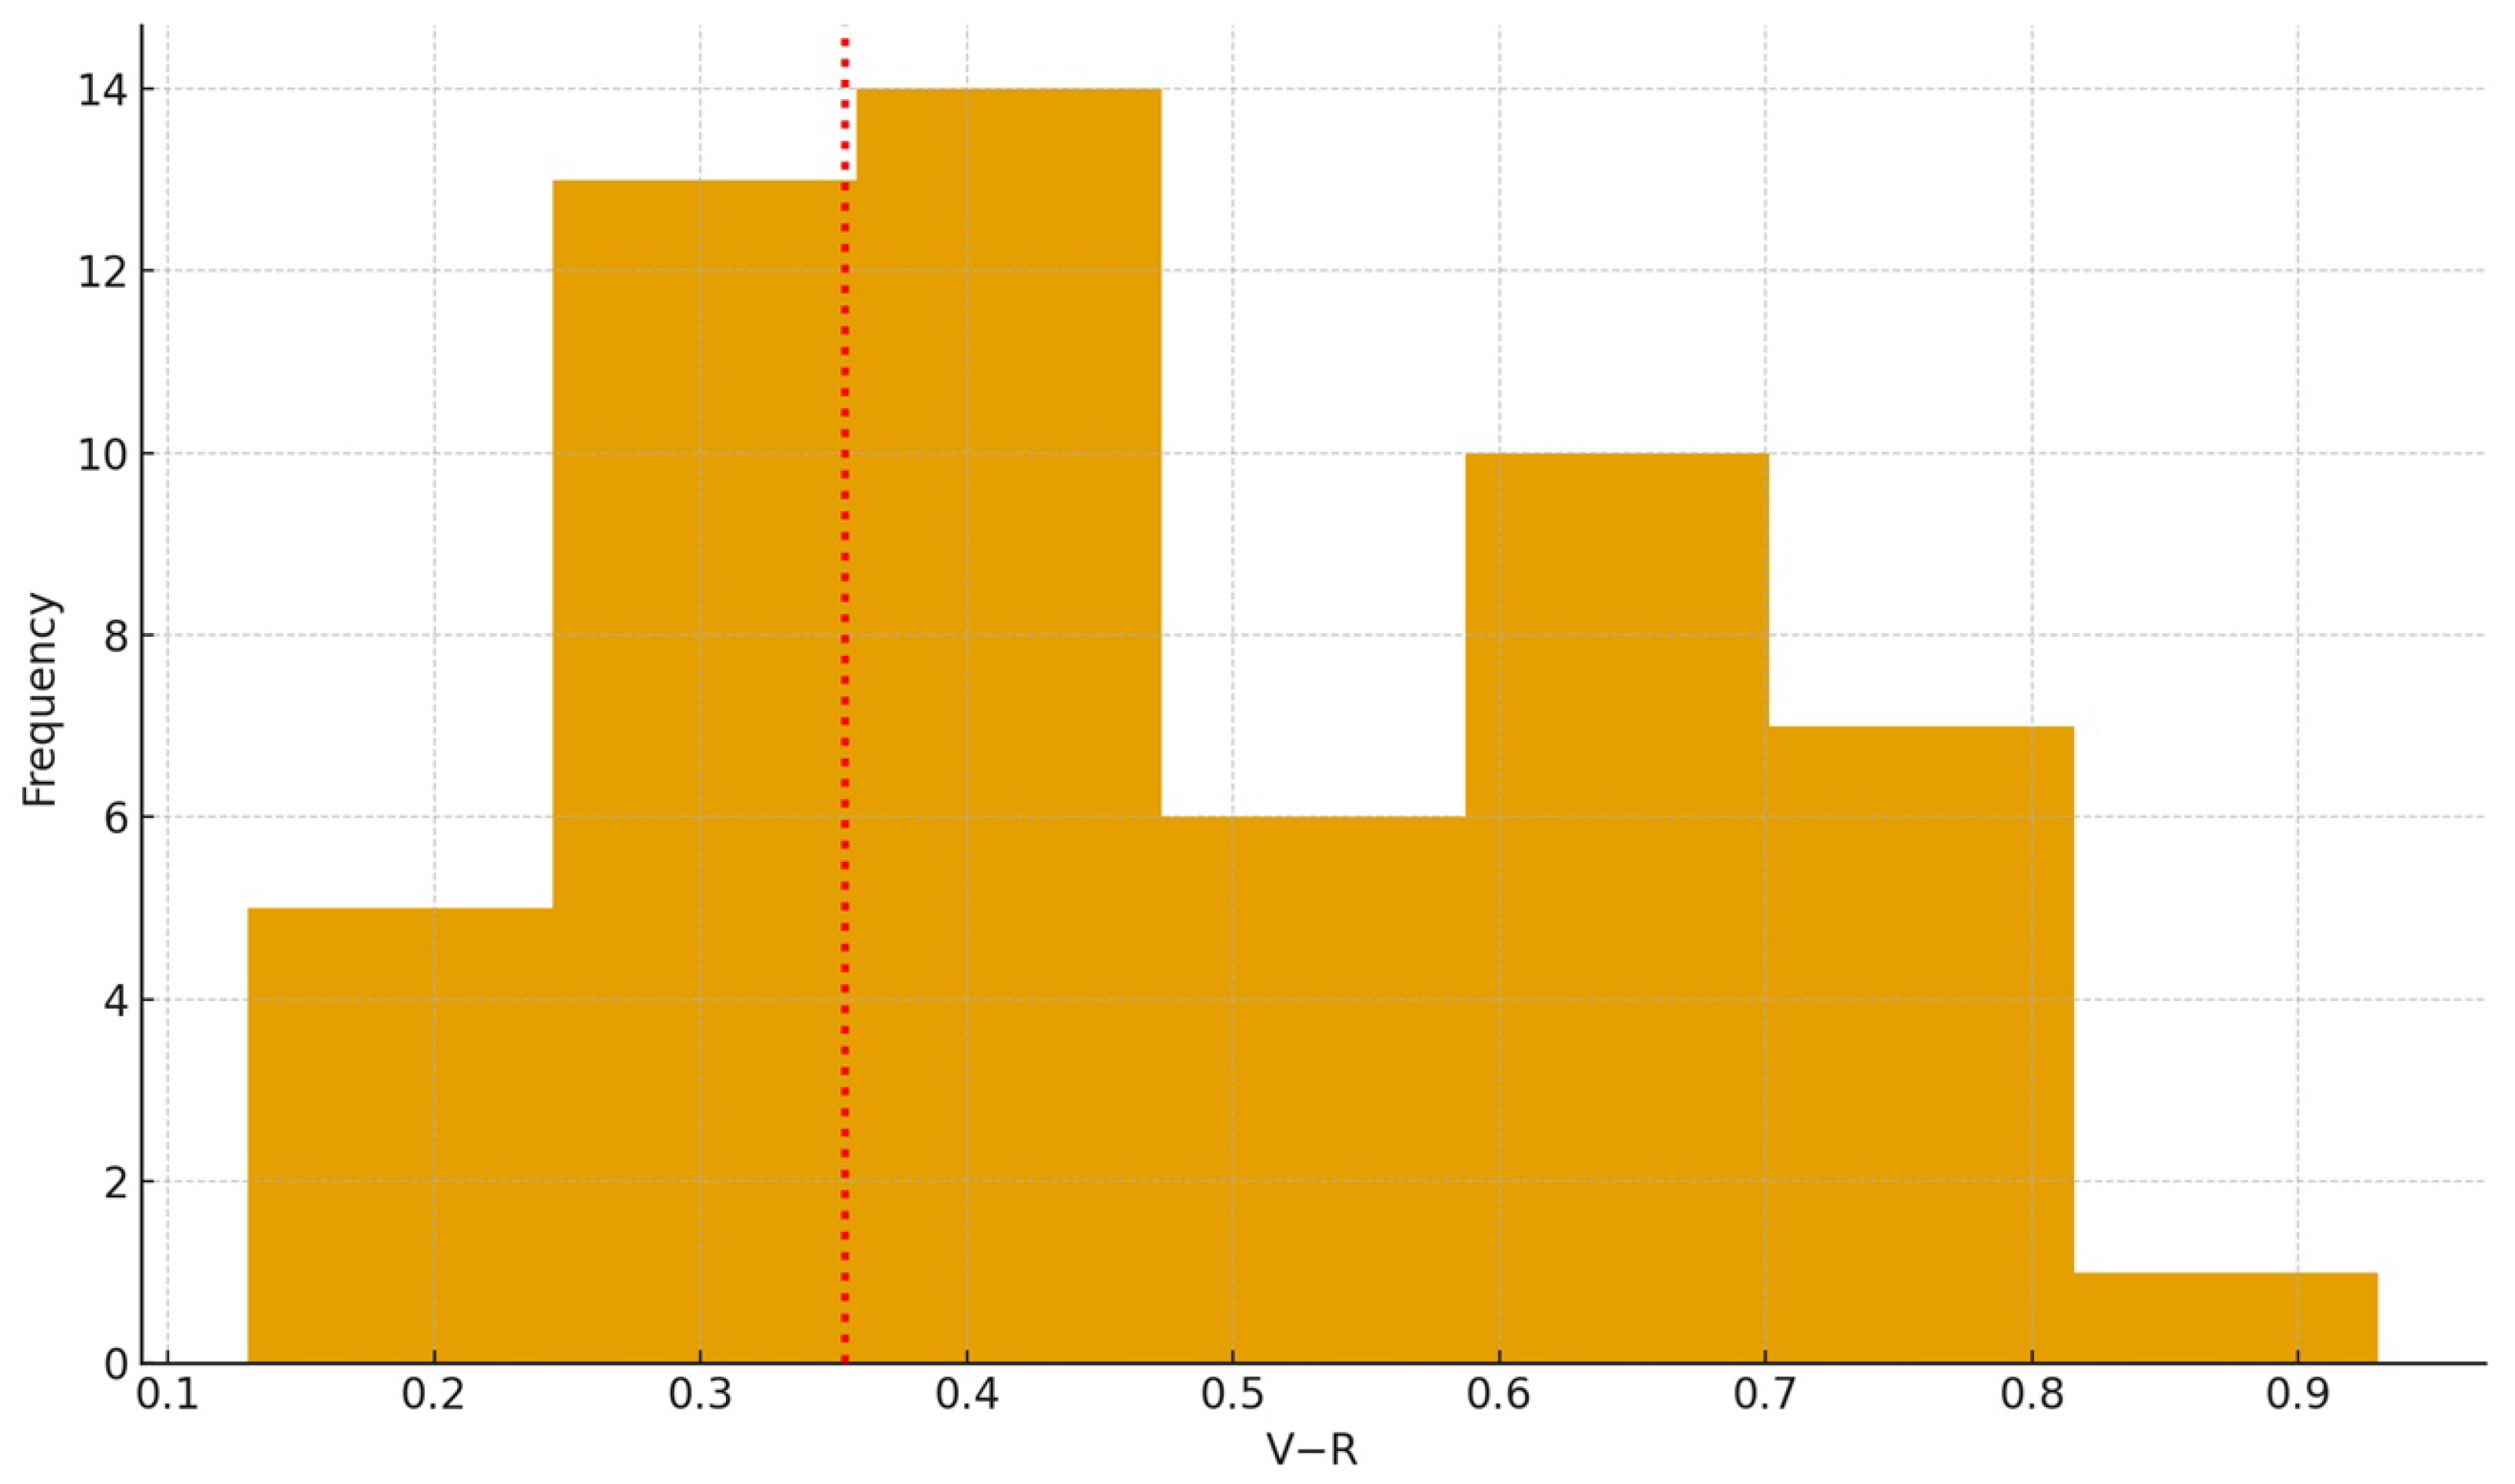
The distribution of the observed V R colors is moderately broad, with median ( V R ) ˜ = 0.42 and MAD = 0.13 , and the histogram demonstrates that most measurements lie redward of the solar reference (Figure A10). Adopting ( V R ) = 0.354 ± 0.010 , the solar color falls between the first quartile and the median (about the 32nd percentile), indicating that the coma is systematically redder than the Sun. Such reddening is naturally interpreted as arising from a dust-dominated continuum whose reflectance increases toward longer wavelengths, consistent with the intense dust environment and large mass of solid particles inferred for ISON from Monte Carlo dust-tail modeling [35].
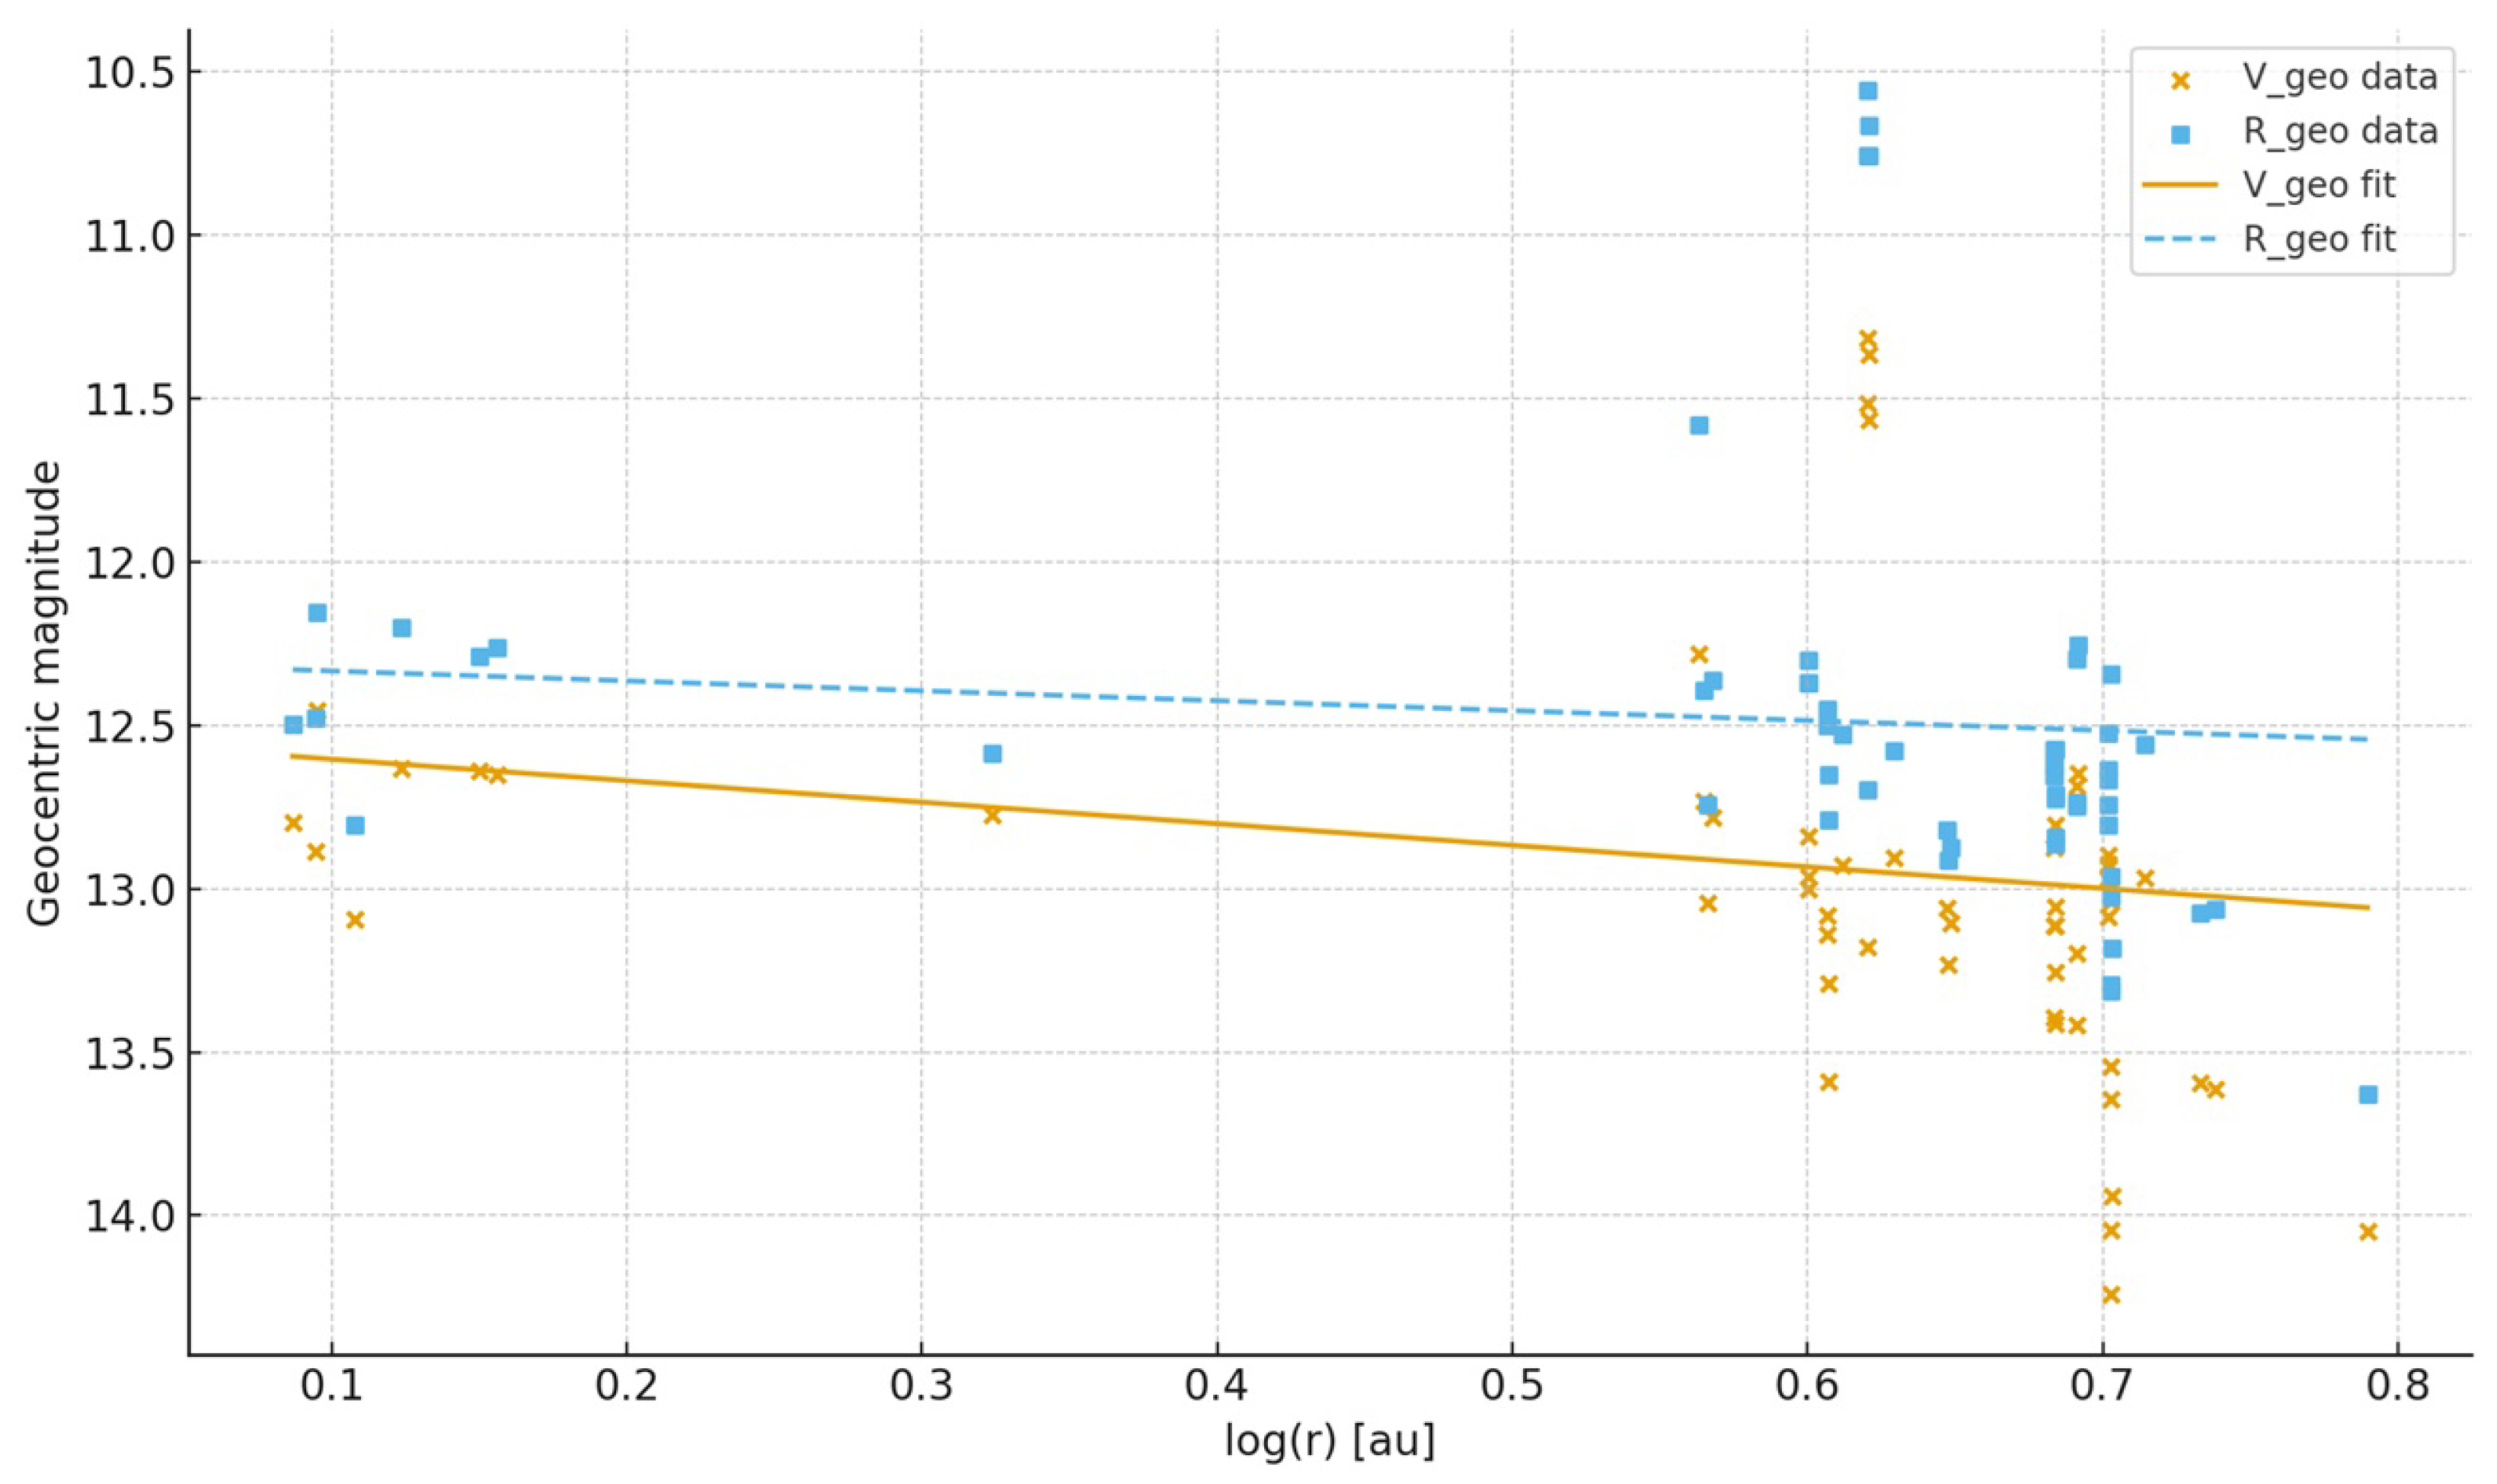
To test for systematic color evolution with heliocentric distance, we examined the correlation between ( V R ) and r using Spearman’s rank test. The result, ρ S = 0.15 with p = 0.27 , does not reject the null hypothesis of no monotonic correlation, indicating that any trend of color with distance is statistically insignificant within the precision of the present dataset. We then quantified the heliocentric dependence of the geocentric magnitudes by fitting linear relations of the form m geo = a + b log 10 r , using the photometric uncertainties d V and d R as weights and propagating them into the fitted parameters (Figure A11). The resulting coefficients are a V = 12.54 ± 0.32 and b V = 0.66 ± 0.51 for V geo , and a R = 12.30 ± 0.29 and b R = 0.30 ± 0.47 for R geo . The positive slopes are compatible with the expected brightening as the comet approaches the Sun, but their relatively large uncertainties indicate that the data do not tightly constrain the detailed radial dependence.
From these linear relations, we derived two synthetic color diagnostics. The “absolute” coma color traced by the intercepts is
( V R ) abs = a V a R = 0.23 ± 0.43 ,
while the differential color gradient, defined from b = 2.5 n , is
Δ n ( V R ) = b V b R 2.5 = 0.14 ± 0.28 .
Both diagnostics are statistically consistent with a constant color: ( V R ) abs encompasses both the solar value and the observed median, and Δ n ( V R ) is compatible with zero within 1 σ . Combined with the non-significant Spearman coefficient, this shows that, although the coma is systematically redder than the Sun, its V R color remains approximately stable over the sampled heliocentric range, suggesting that the dominant dust population and its size distribution do not undergo strong variations during the observed phase of the apparition.

3.7. C/2013 R1 (Lovejoy)

We analyzed the color evolution of comet C/2013 R1 by comparing the B V and V R indices measured before and after perihelion, at t p = 22 December 2013 0.73312175 (Table A8 and Table A9).
Before perihelion ( n = 31 ), the median colors are B V = 0.76 with MAD = 0.06 and V R = 0.27 with MAD = 0.09 . After perihelion ( n = 31 ), the median colors become B V = 0.69 with MAD = 0.12 and V R = 0.34 with MAD = 0.05 . In the pre-perihelion sample, the solar B V lies below the first quartile of the cometary distribution, whereas the solar V R falls in the third quartile, indicating that the coma is systematically redder than the Sun in B V and bluer in V R . After perihelion, the solar B V falls in the second quartile and the solar V R remains in the third quartile, so the coma becomes only mildly redder than solar in B V and moves closer to solar colors in V R . These behaviors are illustrated in Figure A12 and Figure A13.
To test for color changes with heliocentric distance, we applied the Spearman rank correlation between each color index and r, computed separately for the pre- and post-perihelion subsets. No significant monotonic trends are detected. Before perihelion, we find ρ = 0.17 ( p = 0.36 ) for B V vs. r and ρ = + 0.14 ( p = 0.44 ) for V R vs. r. After perihelion, we obtain ρ = 0.28 ( p = 0.13 ) for B V vs. r and ρ = 0.12 ( p = 0.53 ) for V R vs. r. In all cases, | ρ | < 0.3 and p > 0.05 , indicating that, within each orbital branch, the color indices do not follow a smooth monotonic dependence on heliocentric distance.
We then tested whether the color distributions differ between the two orbital branches using the Mann–Whitney U test. For B V , we obtain U = 608.0 with p 0.074 , which is statistically marginal and suggests at most a weak tendency for redder B V values before perihelion. For V R , the test yields U = 316.5 with p 0.021 , indicating a significant shift: the coma is systematically bluer than solar before perihelion and becomes closer to solar (and redder than the pre-perihelion distribution) after perihelion.
Taken together, the two tests are consistent and complementary. The absence of significant Spearman correlations shows that the color evolution is not governed by a simple monotonic function of heliocentric distance within each branch. Instead, the Mann–Whitney results reveal that V R undergoes a discrete change in its distribution across perihelion, while B V remains broadly stable within uncertainties. This pattern favors a scenario in which the compositional or grain-size properties in the coma, particularly in the red spectral range, are reorganized around perihelion, producing two quasi-stationary color regimes rather than a continuous color–distance trend. Our results can be interpreted in the broader context of the activity pattern of C/2013 R1. Narrow-band photometry and imaging obtained with the TRAPPIST telescope by Opitom et al. [36] reveal an asymmetric evolution of gas and dust production rates about perihelion and show that OH, NH, and C2 track the dust, whereas CN decouples from the dust and is more directly linked to HCN outgassing. Further constraints on the gas component of C/2013 R1 are provided by the high-resolution near-infrared spectroscopy of the CN red system obtained with WINERED on the Araki 1.3 m telescope [37]. Their fluorescence modeling shows that the CN emission can be reproduced by a combination of a collision-dominated inner coma and a purely fluorescent outer coma, with a mixing ratio of 0 . 94 0.03 + 0.02 : 0 . 06 0.02 + 0.03 , corresponding to a collisional region extending out to 800 –1600 km from the nucleus. No CN isotopologues (13C14N, 12C15N) were detected, and the inferred limits are consistent with typical cometary isotopic ratios (12C/13C ∼ 90, 14N/15N ∼ 150). This indicates that C/2013 R1 is isotopically unremarkable and supports the view that CN behaves as a standard HCN daughter species. Together with the TRAPPIST results, this reinforces our interpretation that the observed change in the V R distribution across perihelion reflects a reconfiguration of the dust and dust-related daughter species, rather than any unusual behavior of the CN-bearing volatiles.

3.8. C/2014 S2 (PANSTARRS)

The B–V color index and V-band magnitudes analyzed in this subsection are taken from Table 1 in [22]. They correspond to the post-perihelion phase of the object’s orbit, with observations obtained between 6 March and 21 June 2016 UT, over a heliocentric distance range of 2.3411–3.0535 au.
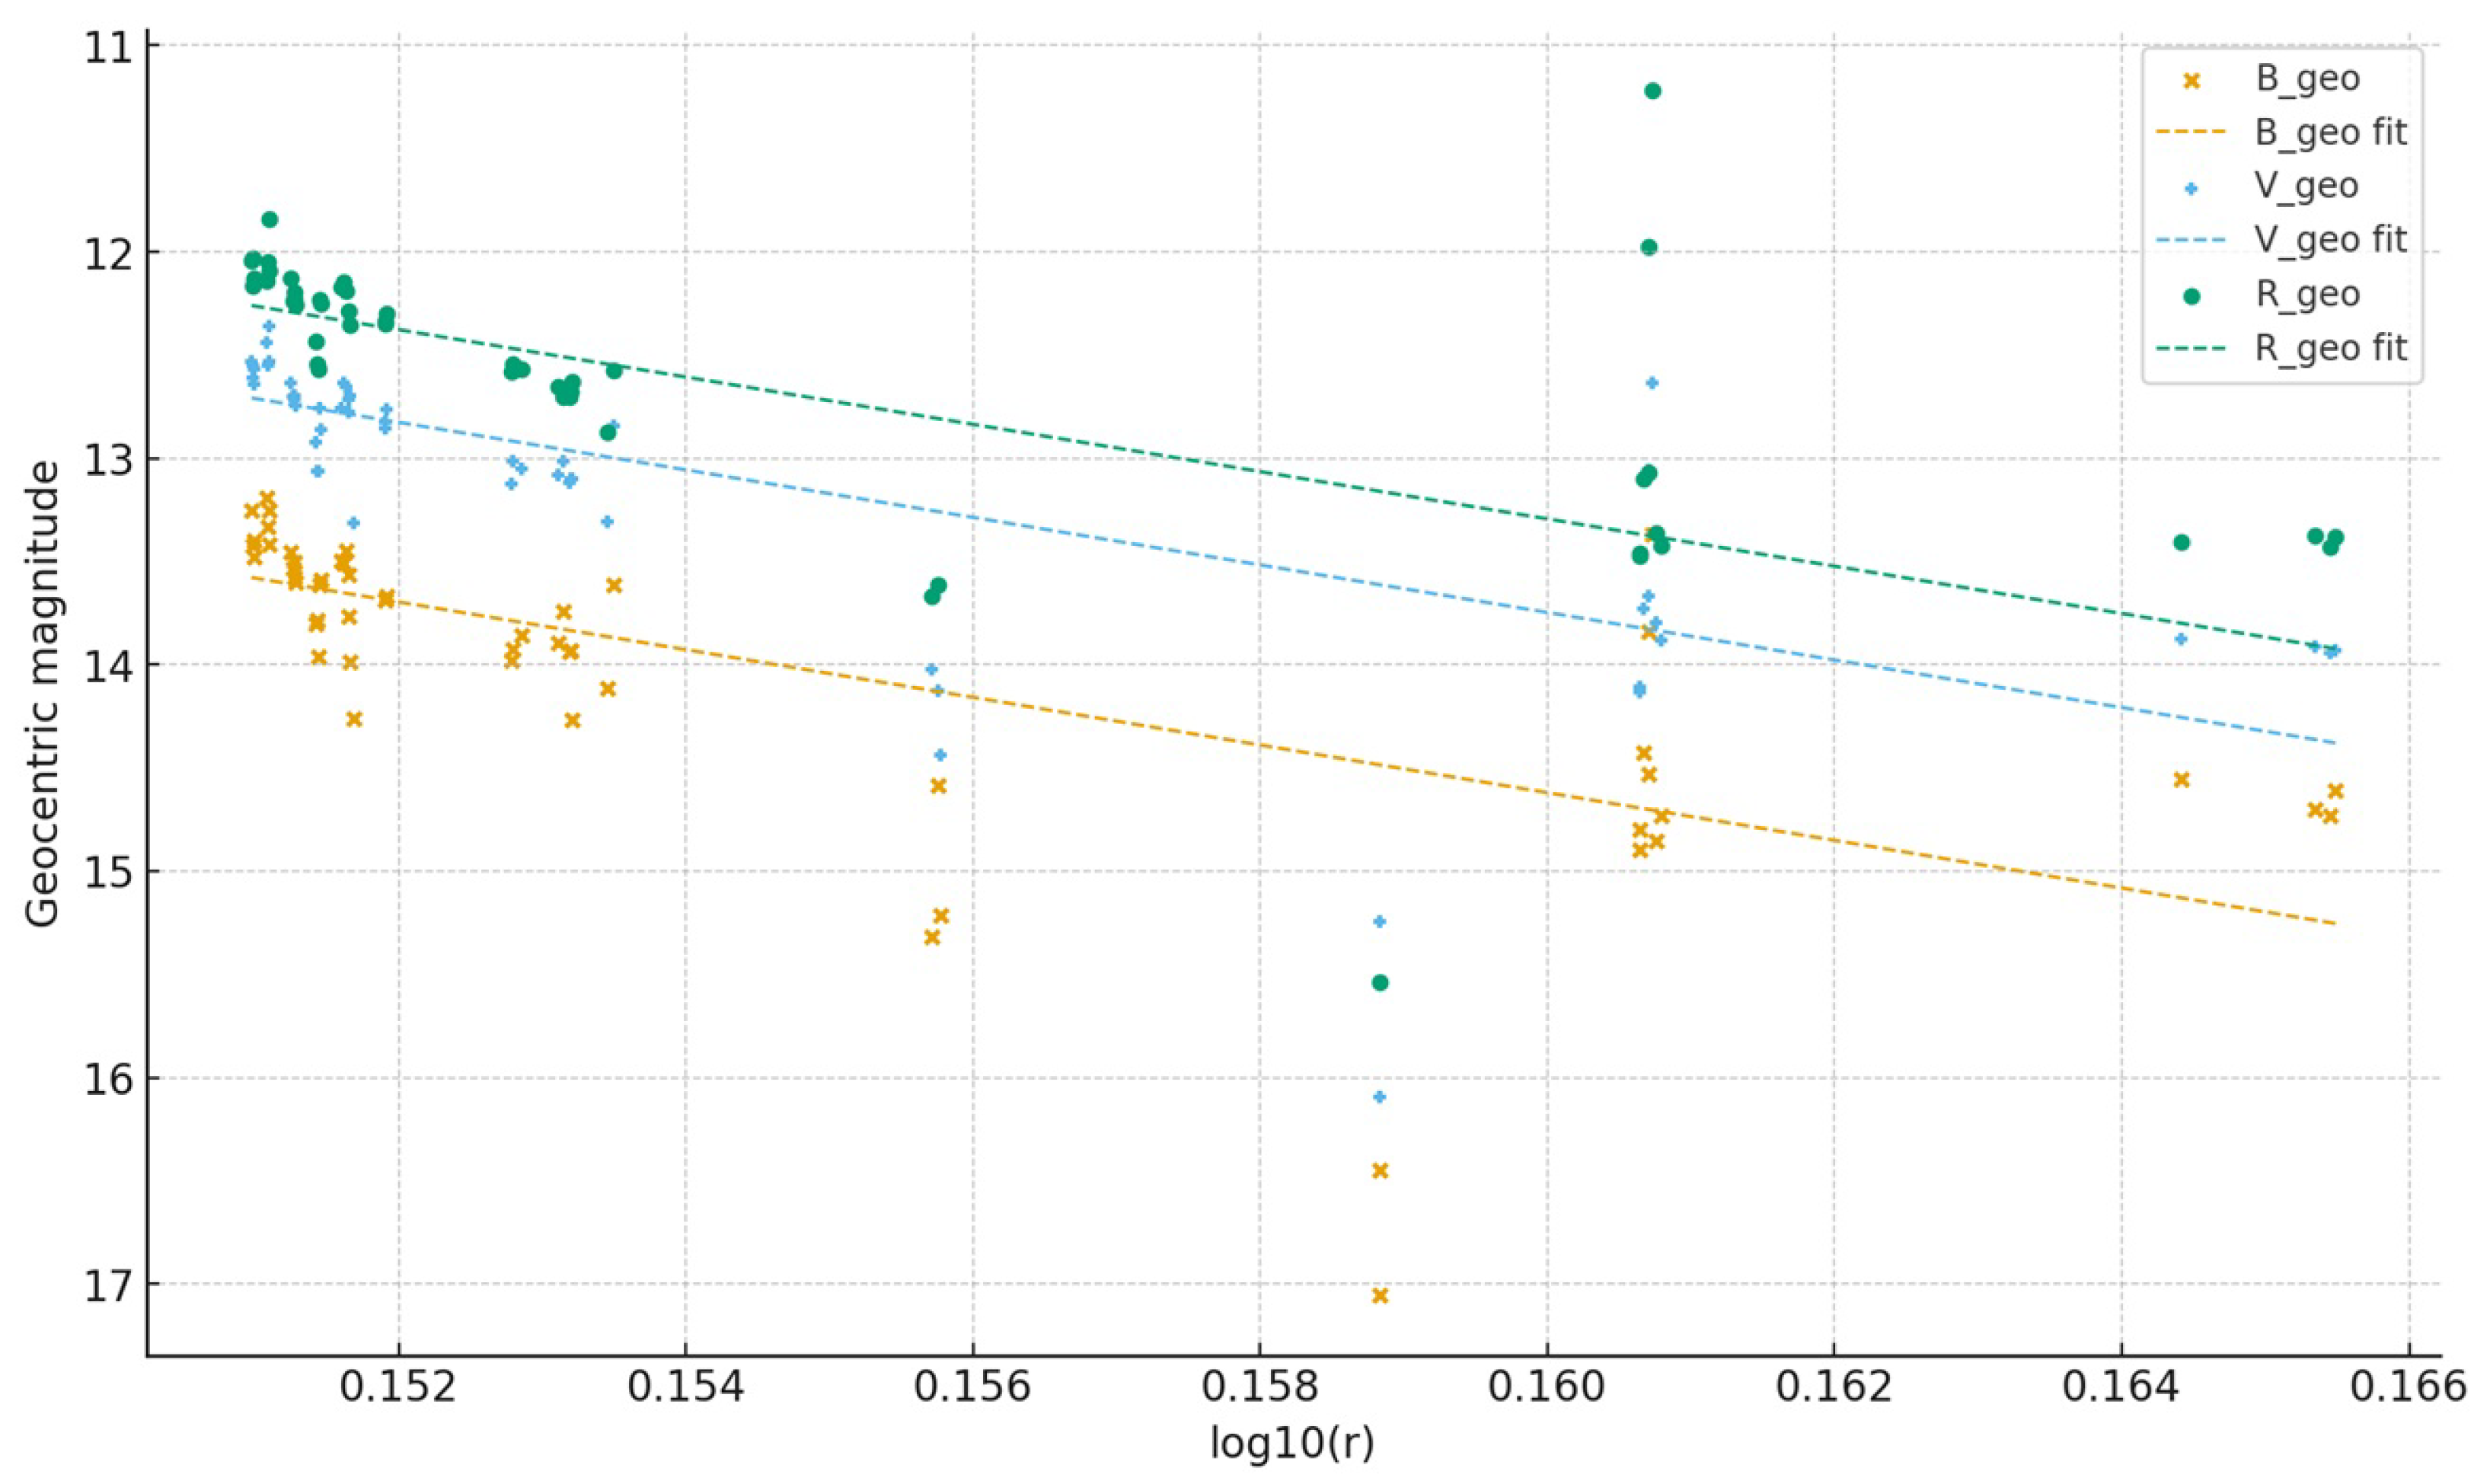
Geocentric magnitudes were computed for the B and V bands, and weighted least-squares fits of these geocentric magnitudes as a function of log r were performed using the reported photometric errors as weights. In the V band, the fit yields an intercept of 5.12 ± 0.18 and a slope of 12.92 ± 0.42 . In the B band, the corresponding values are 5.73 ± 0.18 for the intercept and 13.24 ± 0.43 for the slope (Figure 1). The reduced chi-square values are about 33.6 in V and 2.55 in B. The large reduced chi-square, especially in the V band, indicates real short-term variability superimposed on the secular trend, consistent with CO2-driven activity and outbursts reported for this comet [38].
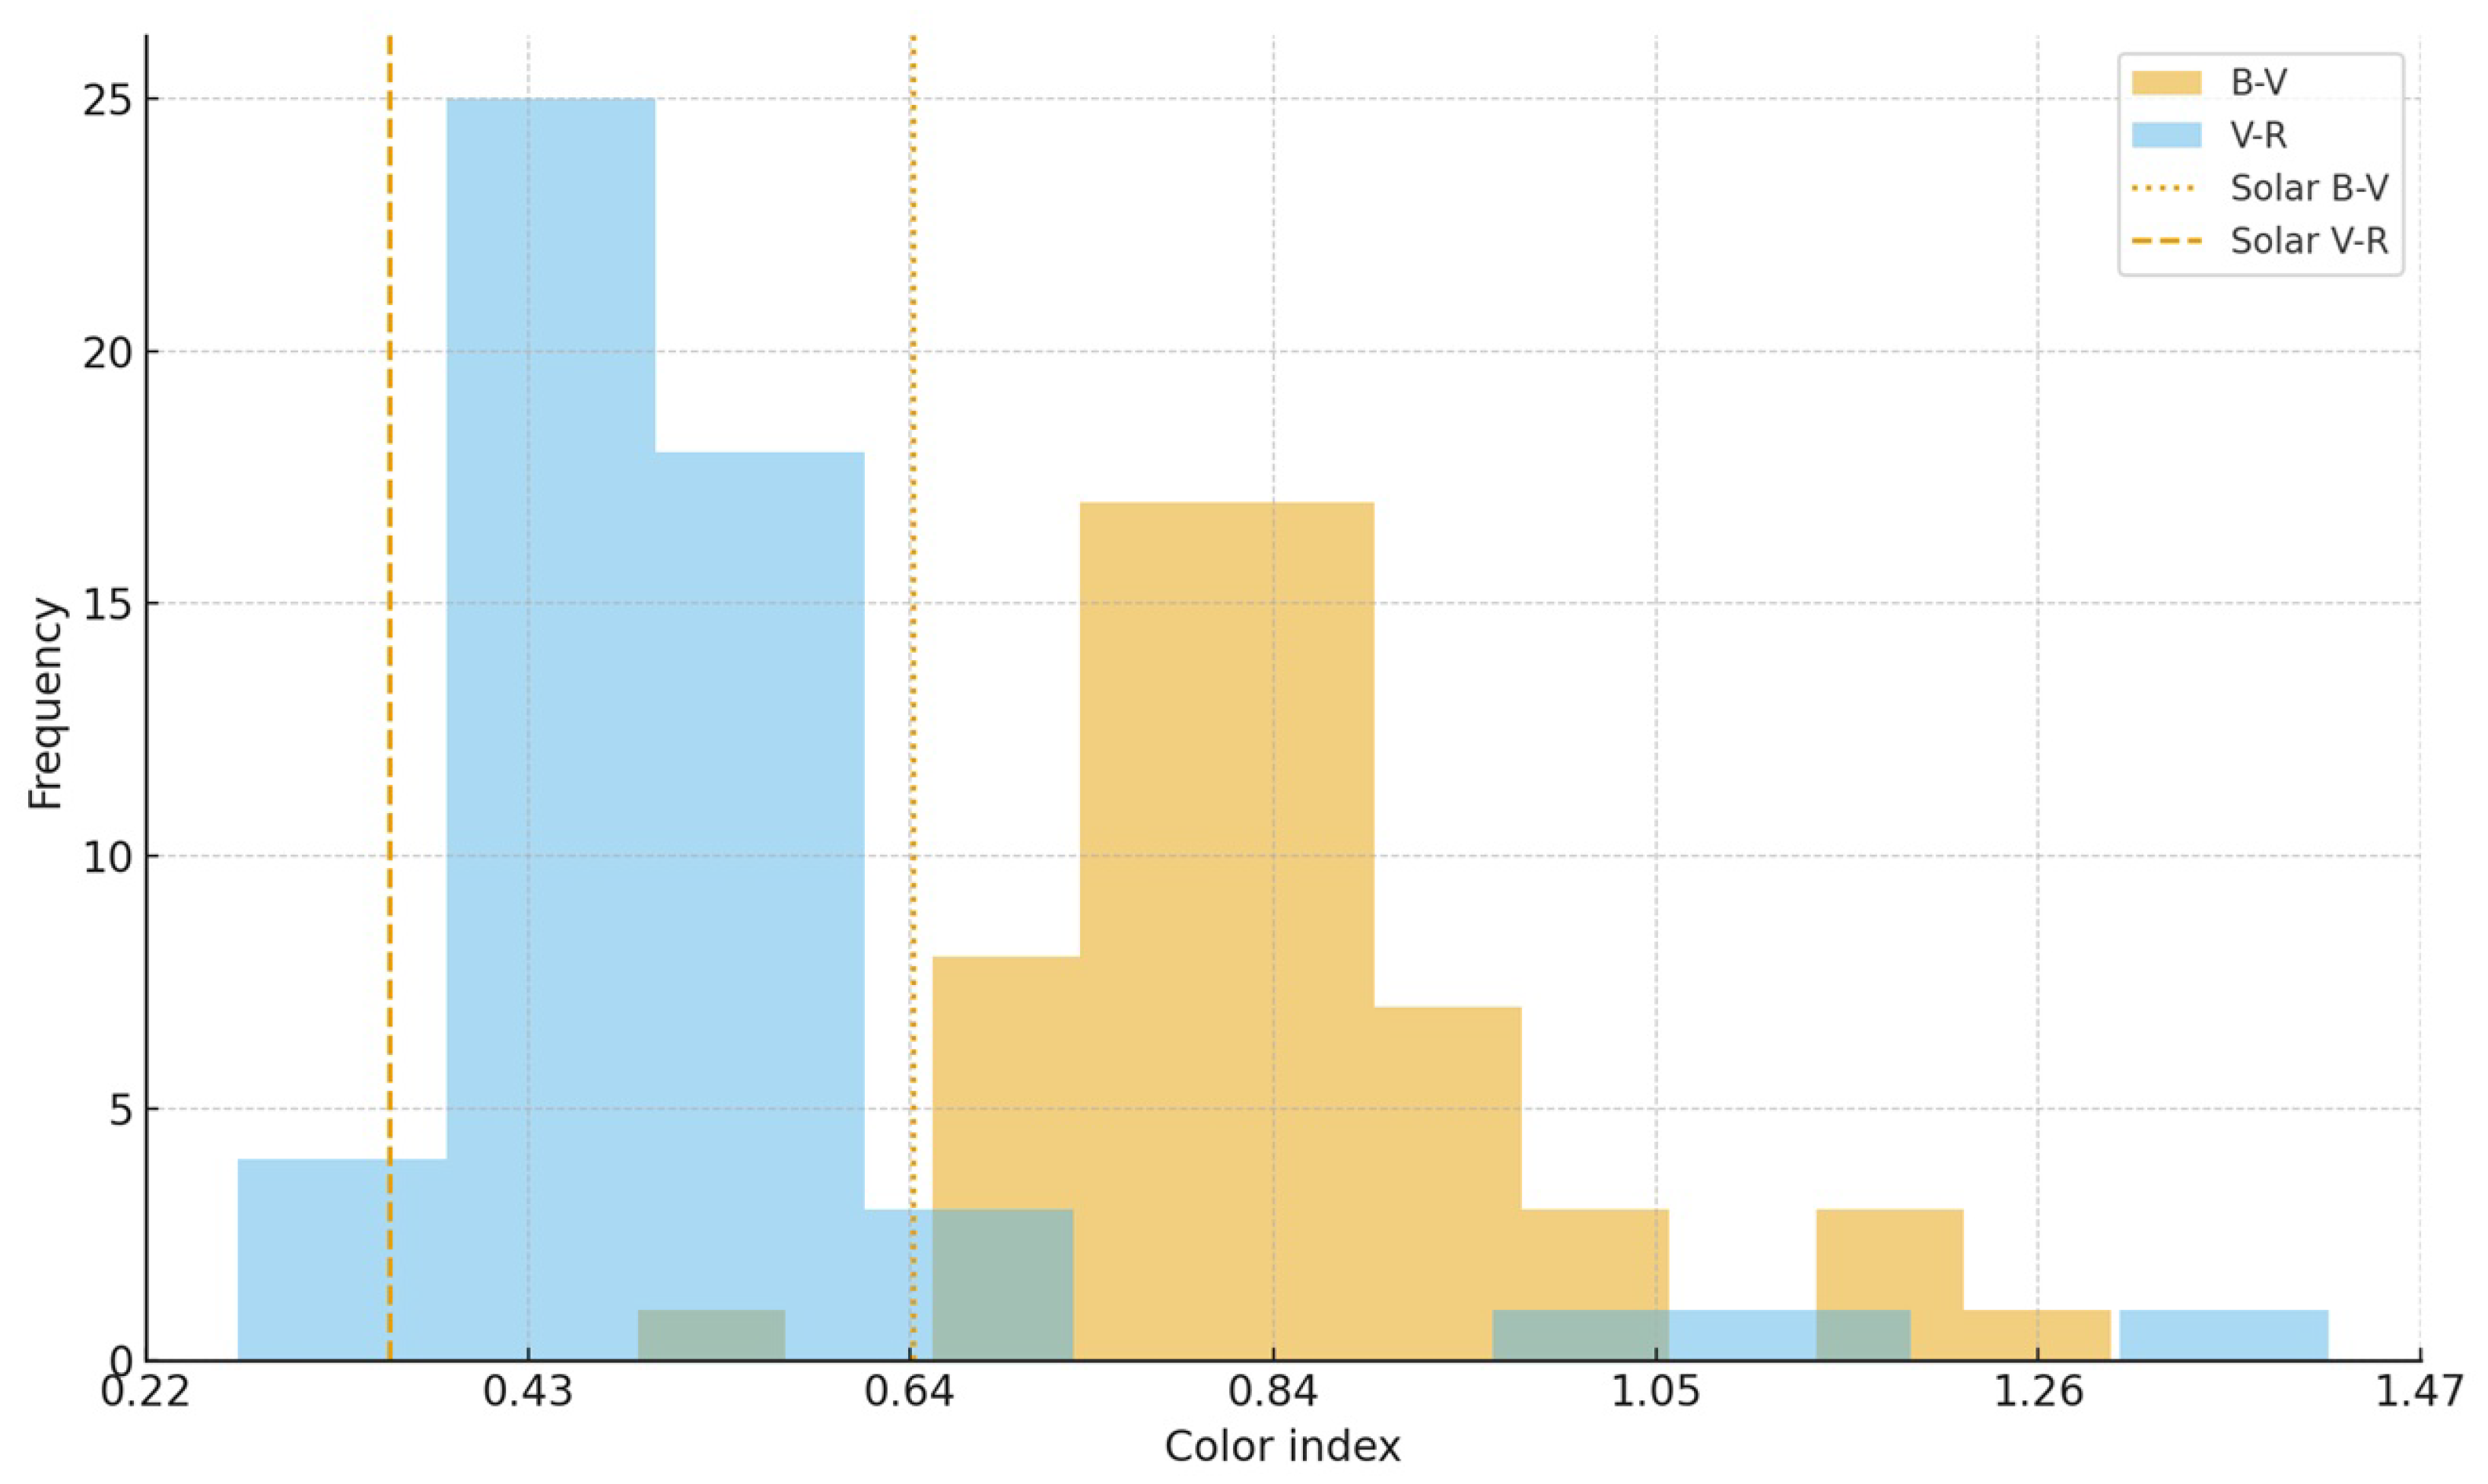
From the fitted intercepts, the absolute color is ( B V ) abs = 0.61 ± 0.25 , which is statistically consistent with both the solar value ( B V ) = 0.642 and the observed color distribution (Figure 2). The difference between the fitted slopes in B and V corresponds to a differential heliocentric index Δ n B V = 0.13 ± 0.24 , which is indistinguishable from zero and indicates no significant color gradient with log r .
These results agree with independent diagnostics. The median observed color is B V = 0.80 with MAD = 0.12 , and the solar color lies in the first quartile of the distribution, showing that the coma is globally redder than the Sun, with high significance. The Spearman rank test between B V and r gives ρ s 0.06 with p 0.64 , ruling out any monotonic correlation between color and heliocentric distance. The nearly identical B and V slopes and the vanishing Δ n B V confirm that the color remains approximately constant over the sampled heliocentric range. Taken together, all diagnostics support a scenario in which the coma of C/2014 S2 maintains a stable, dust-dominated color, moderately redder than solar, without detectable systematic evolution as a function of r.

3.9. C/2020 V2 (ZTF)

For each observational season, we computed the B V , V R , and R I colors from the TRAPPIST B, V, R, and I-band magnitudes listed in Table C1 of Ahuja et al. [23] as simple magnitude differences, and propagated the photometric uncertainties in quadrature, σ X Y = ( σ X 2 + σ Y 2 ) 1 / 2 . Following the convention of the original table, we used the sign of the heliocentric distance r to split the sample into a pre-perihelion subset ( r < 0 , between 11 Janurary 2022 and 19 March 2023) and a post-perihelion subset ( r > 0 , between 26 June 2023 and 13 August 2024).
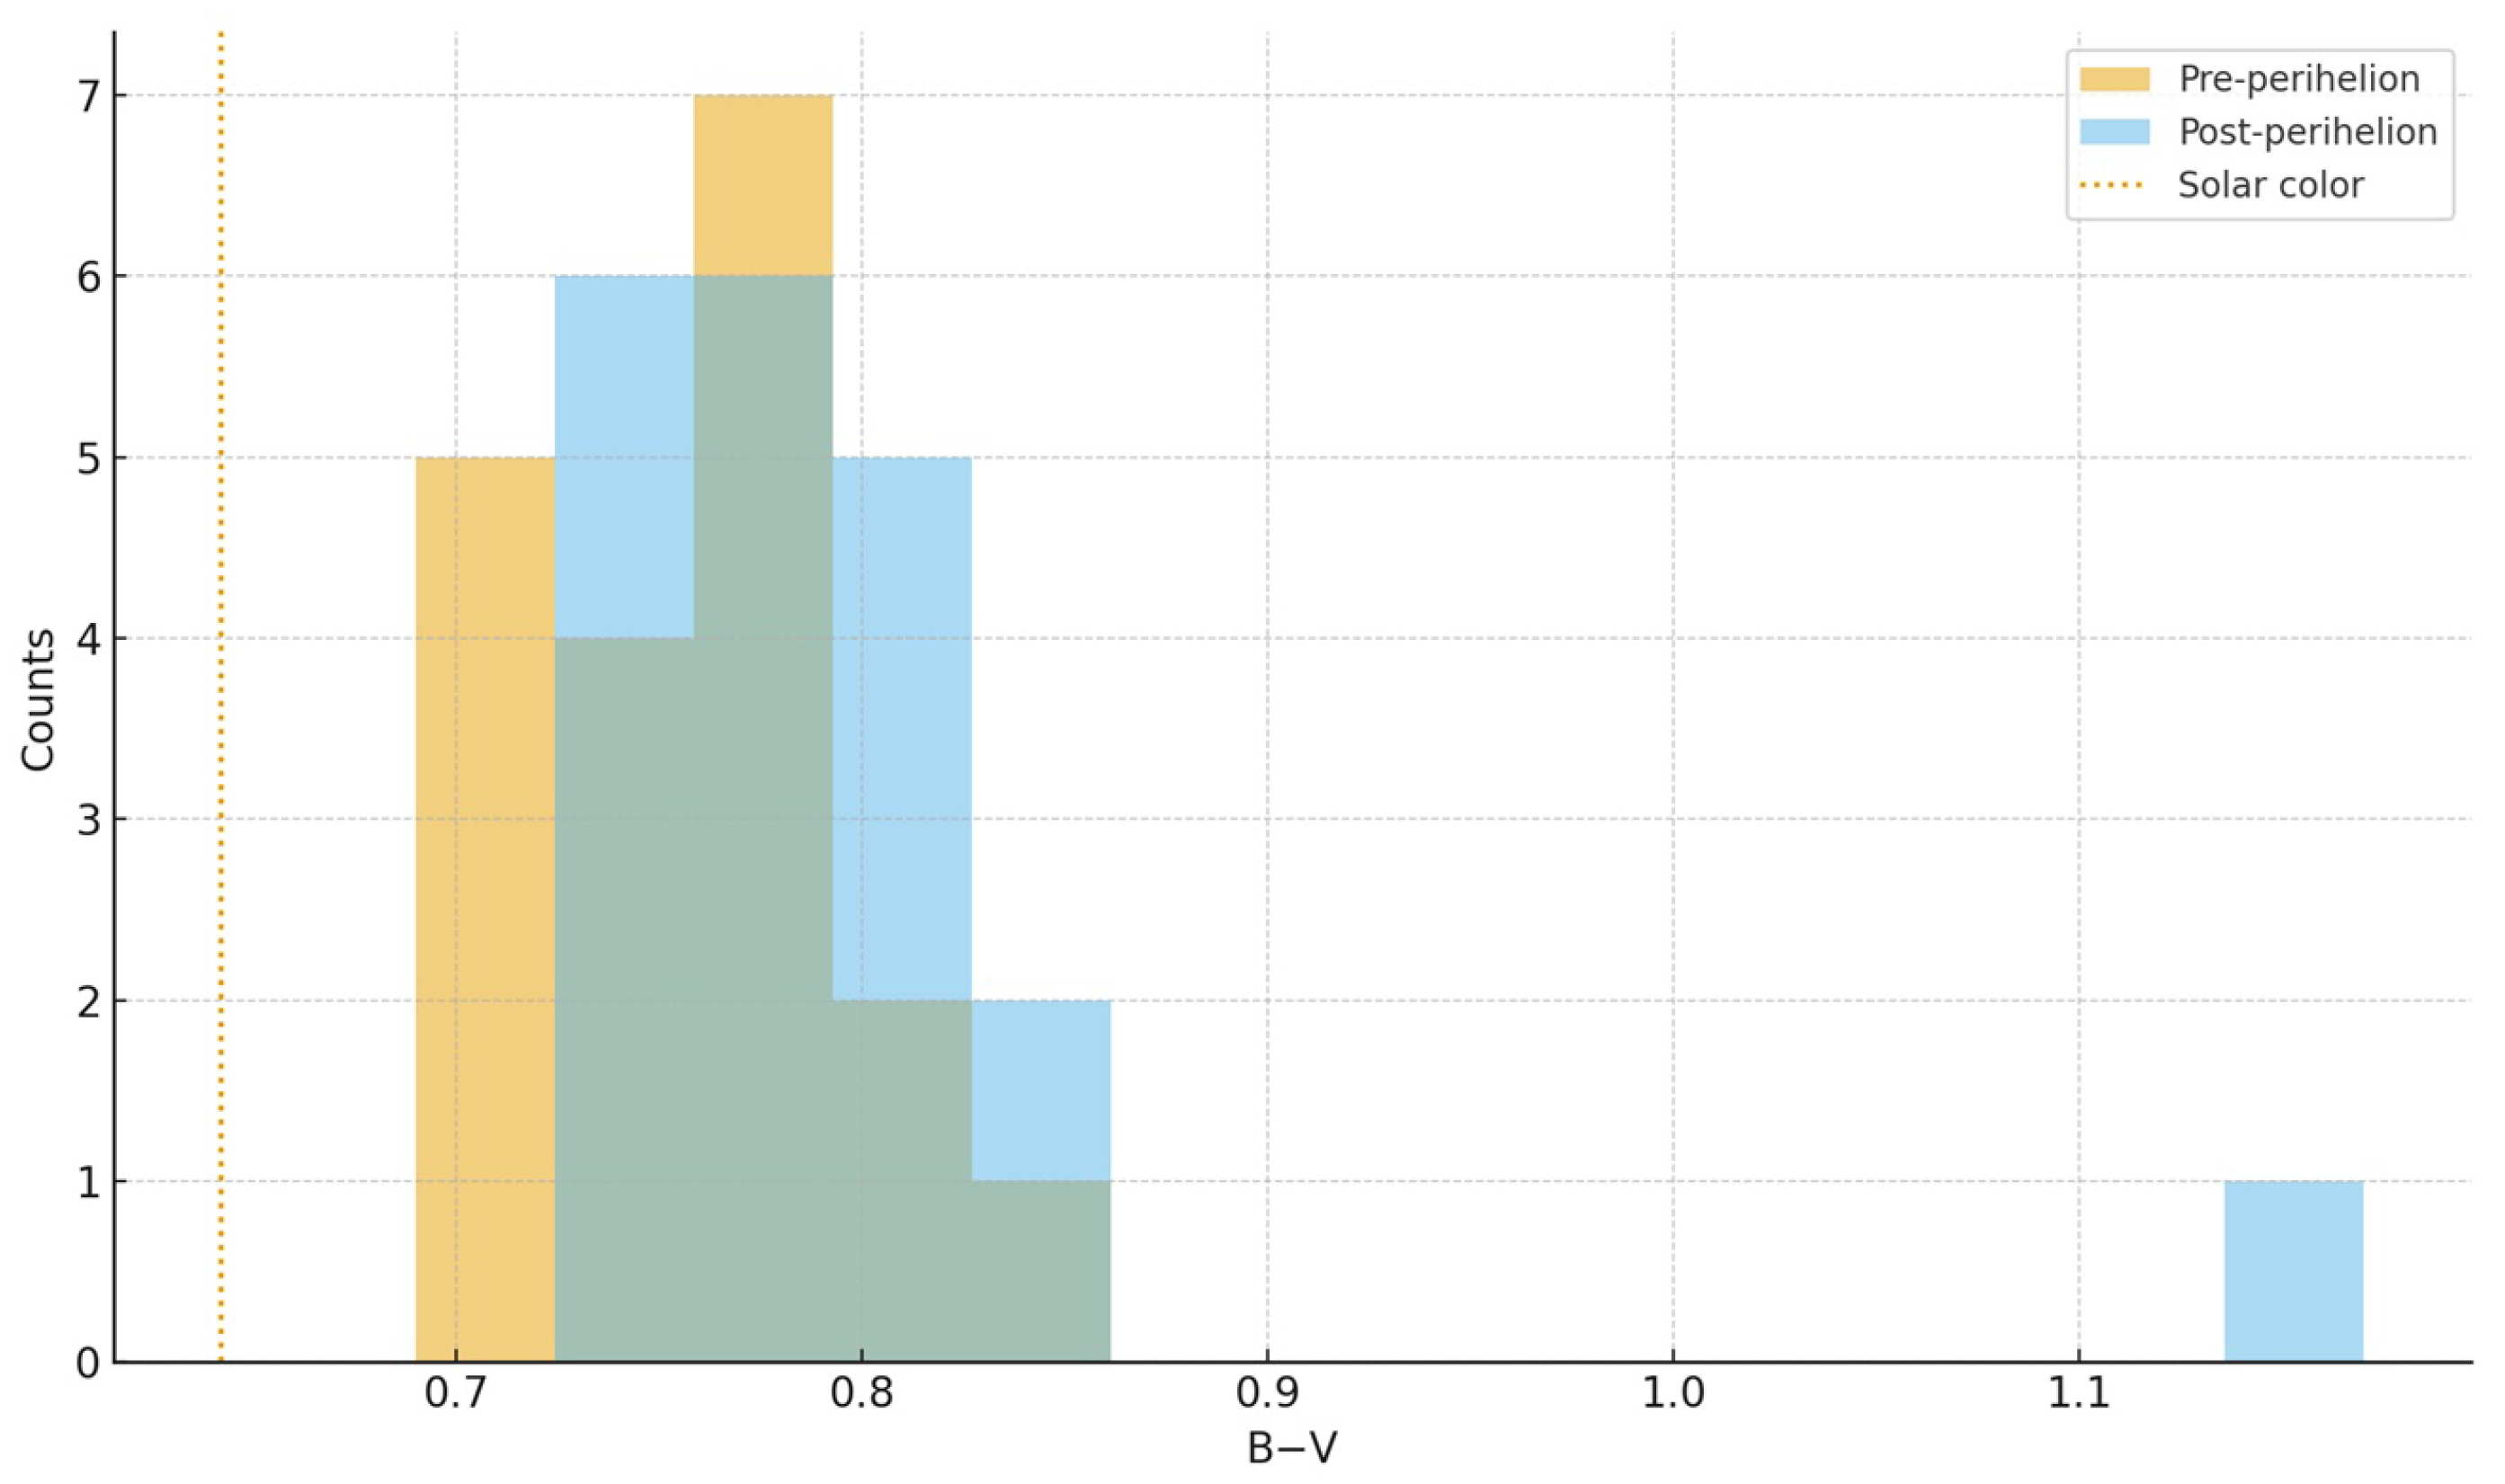
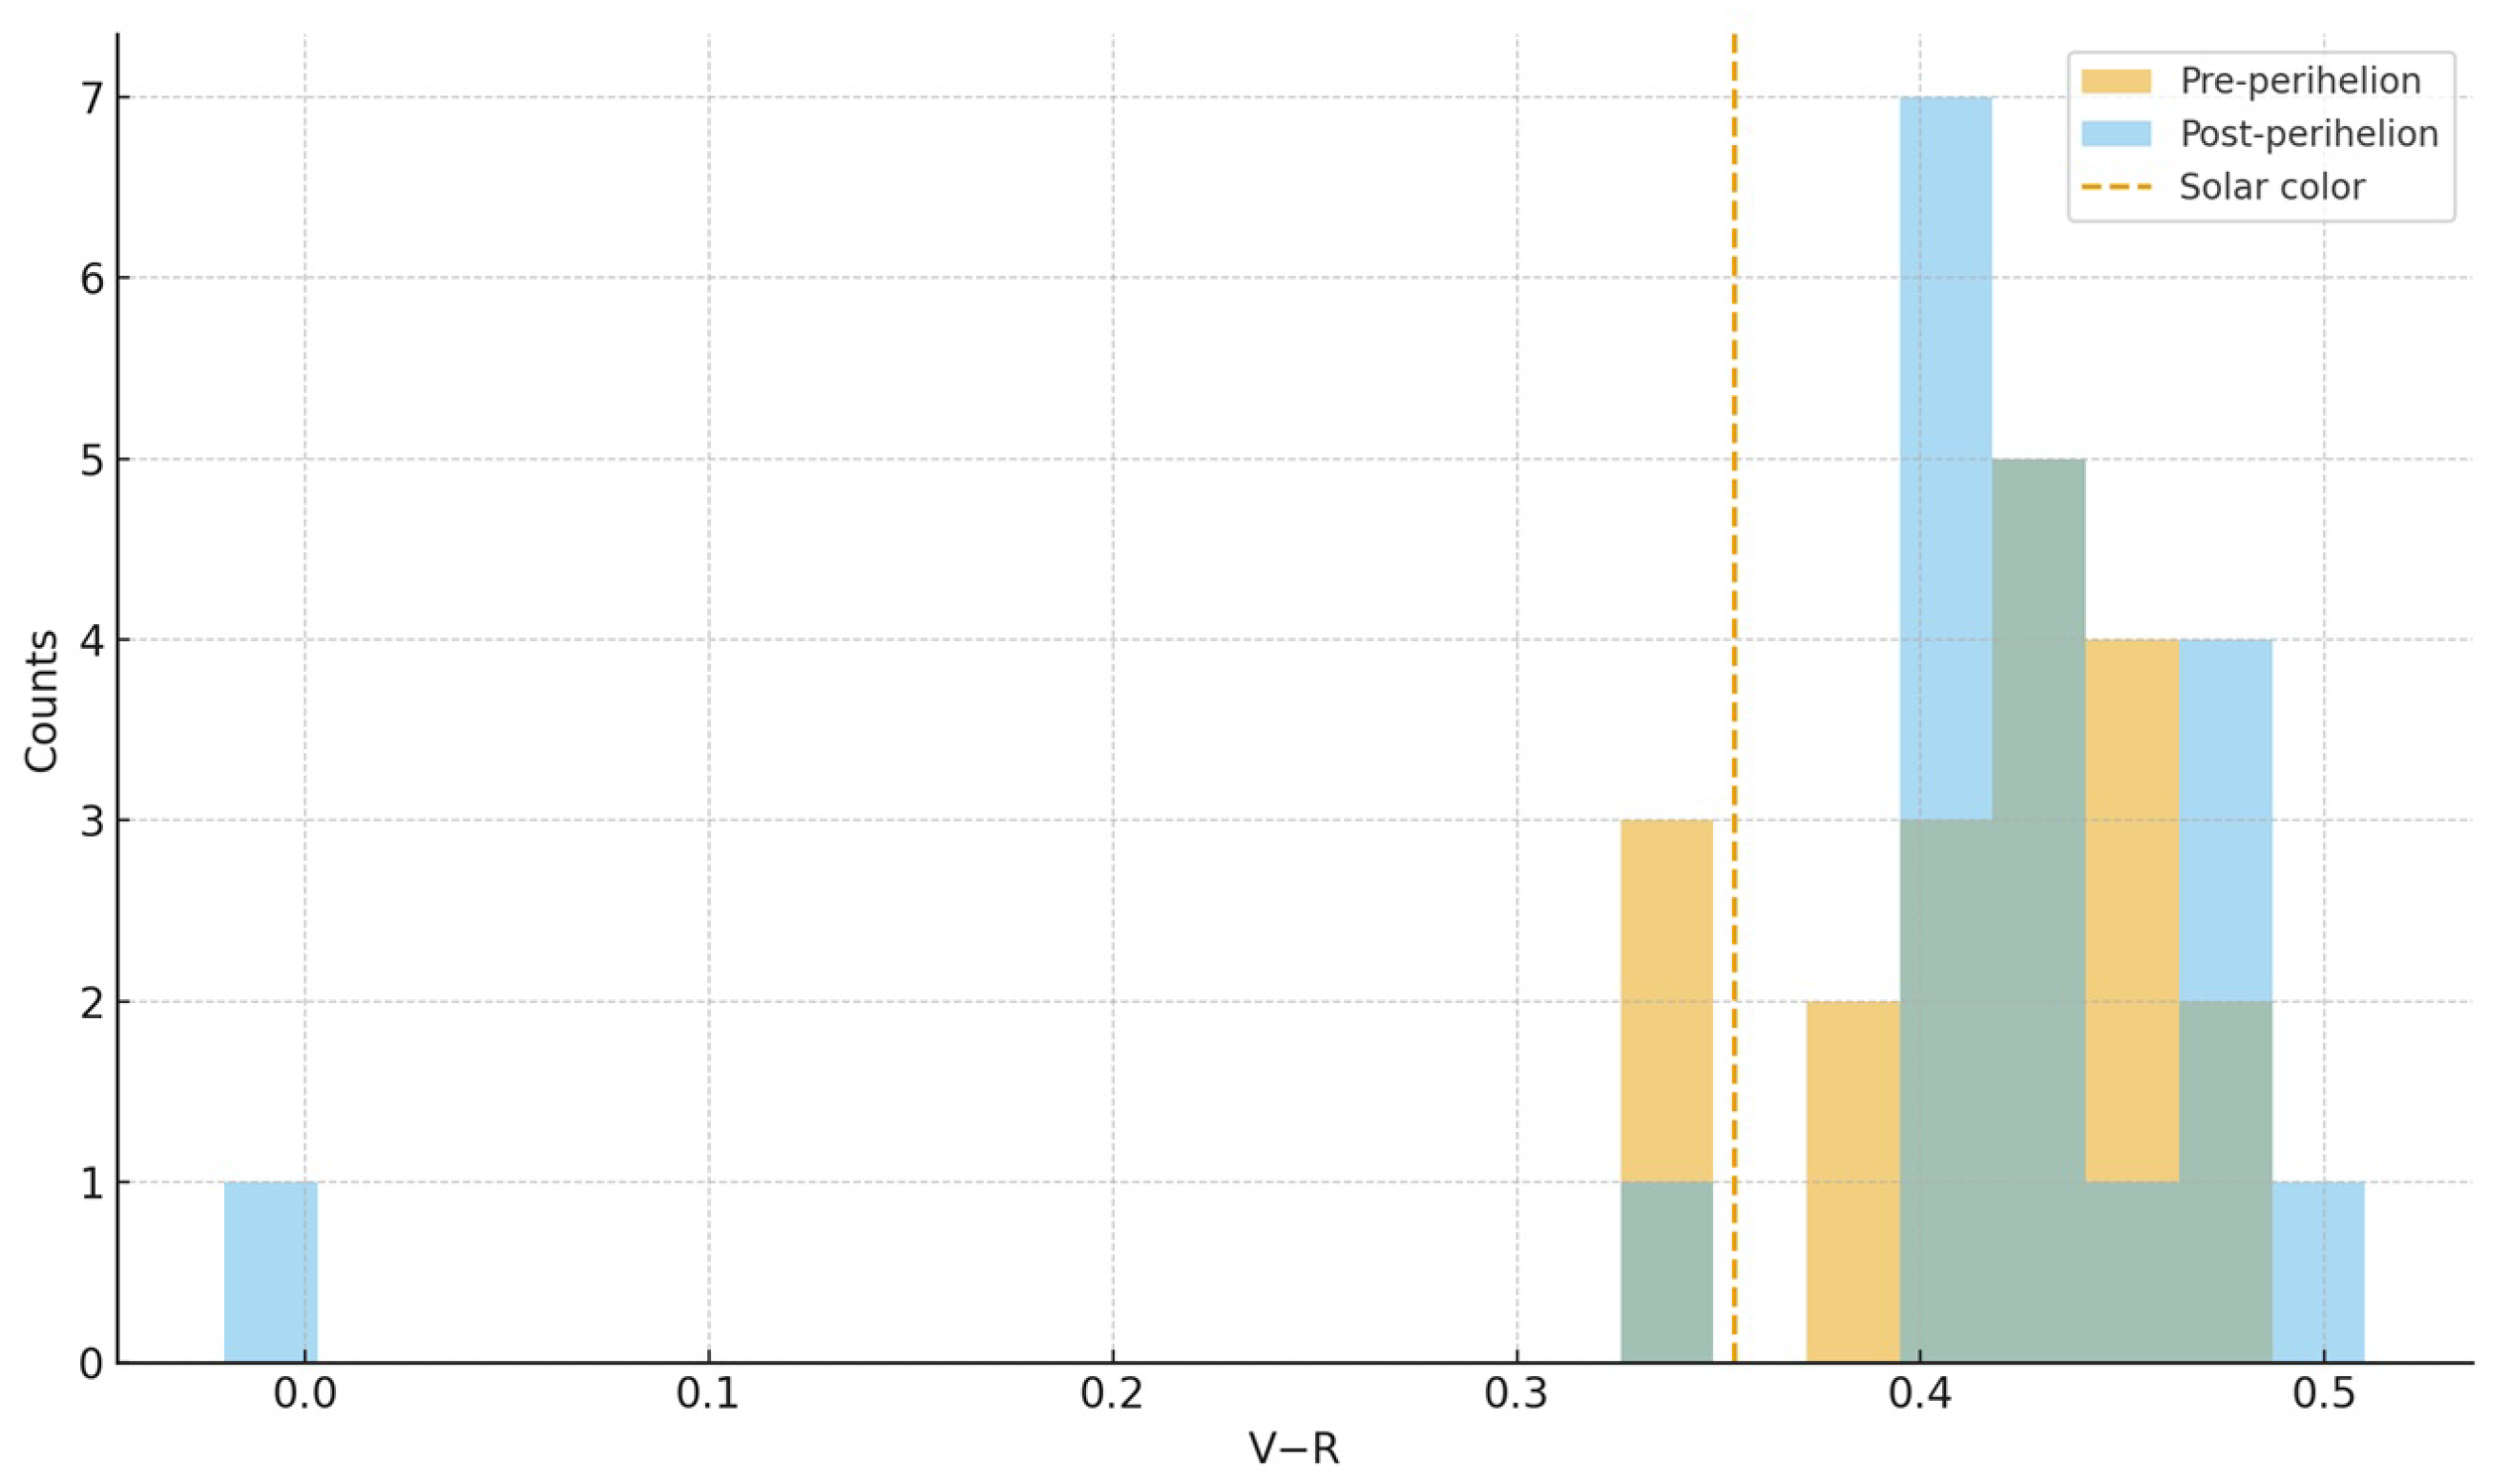
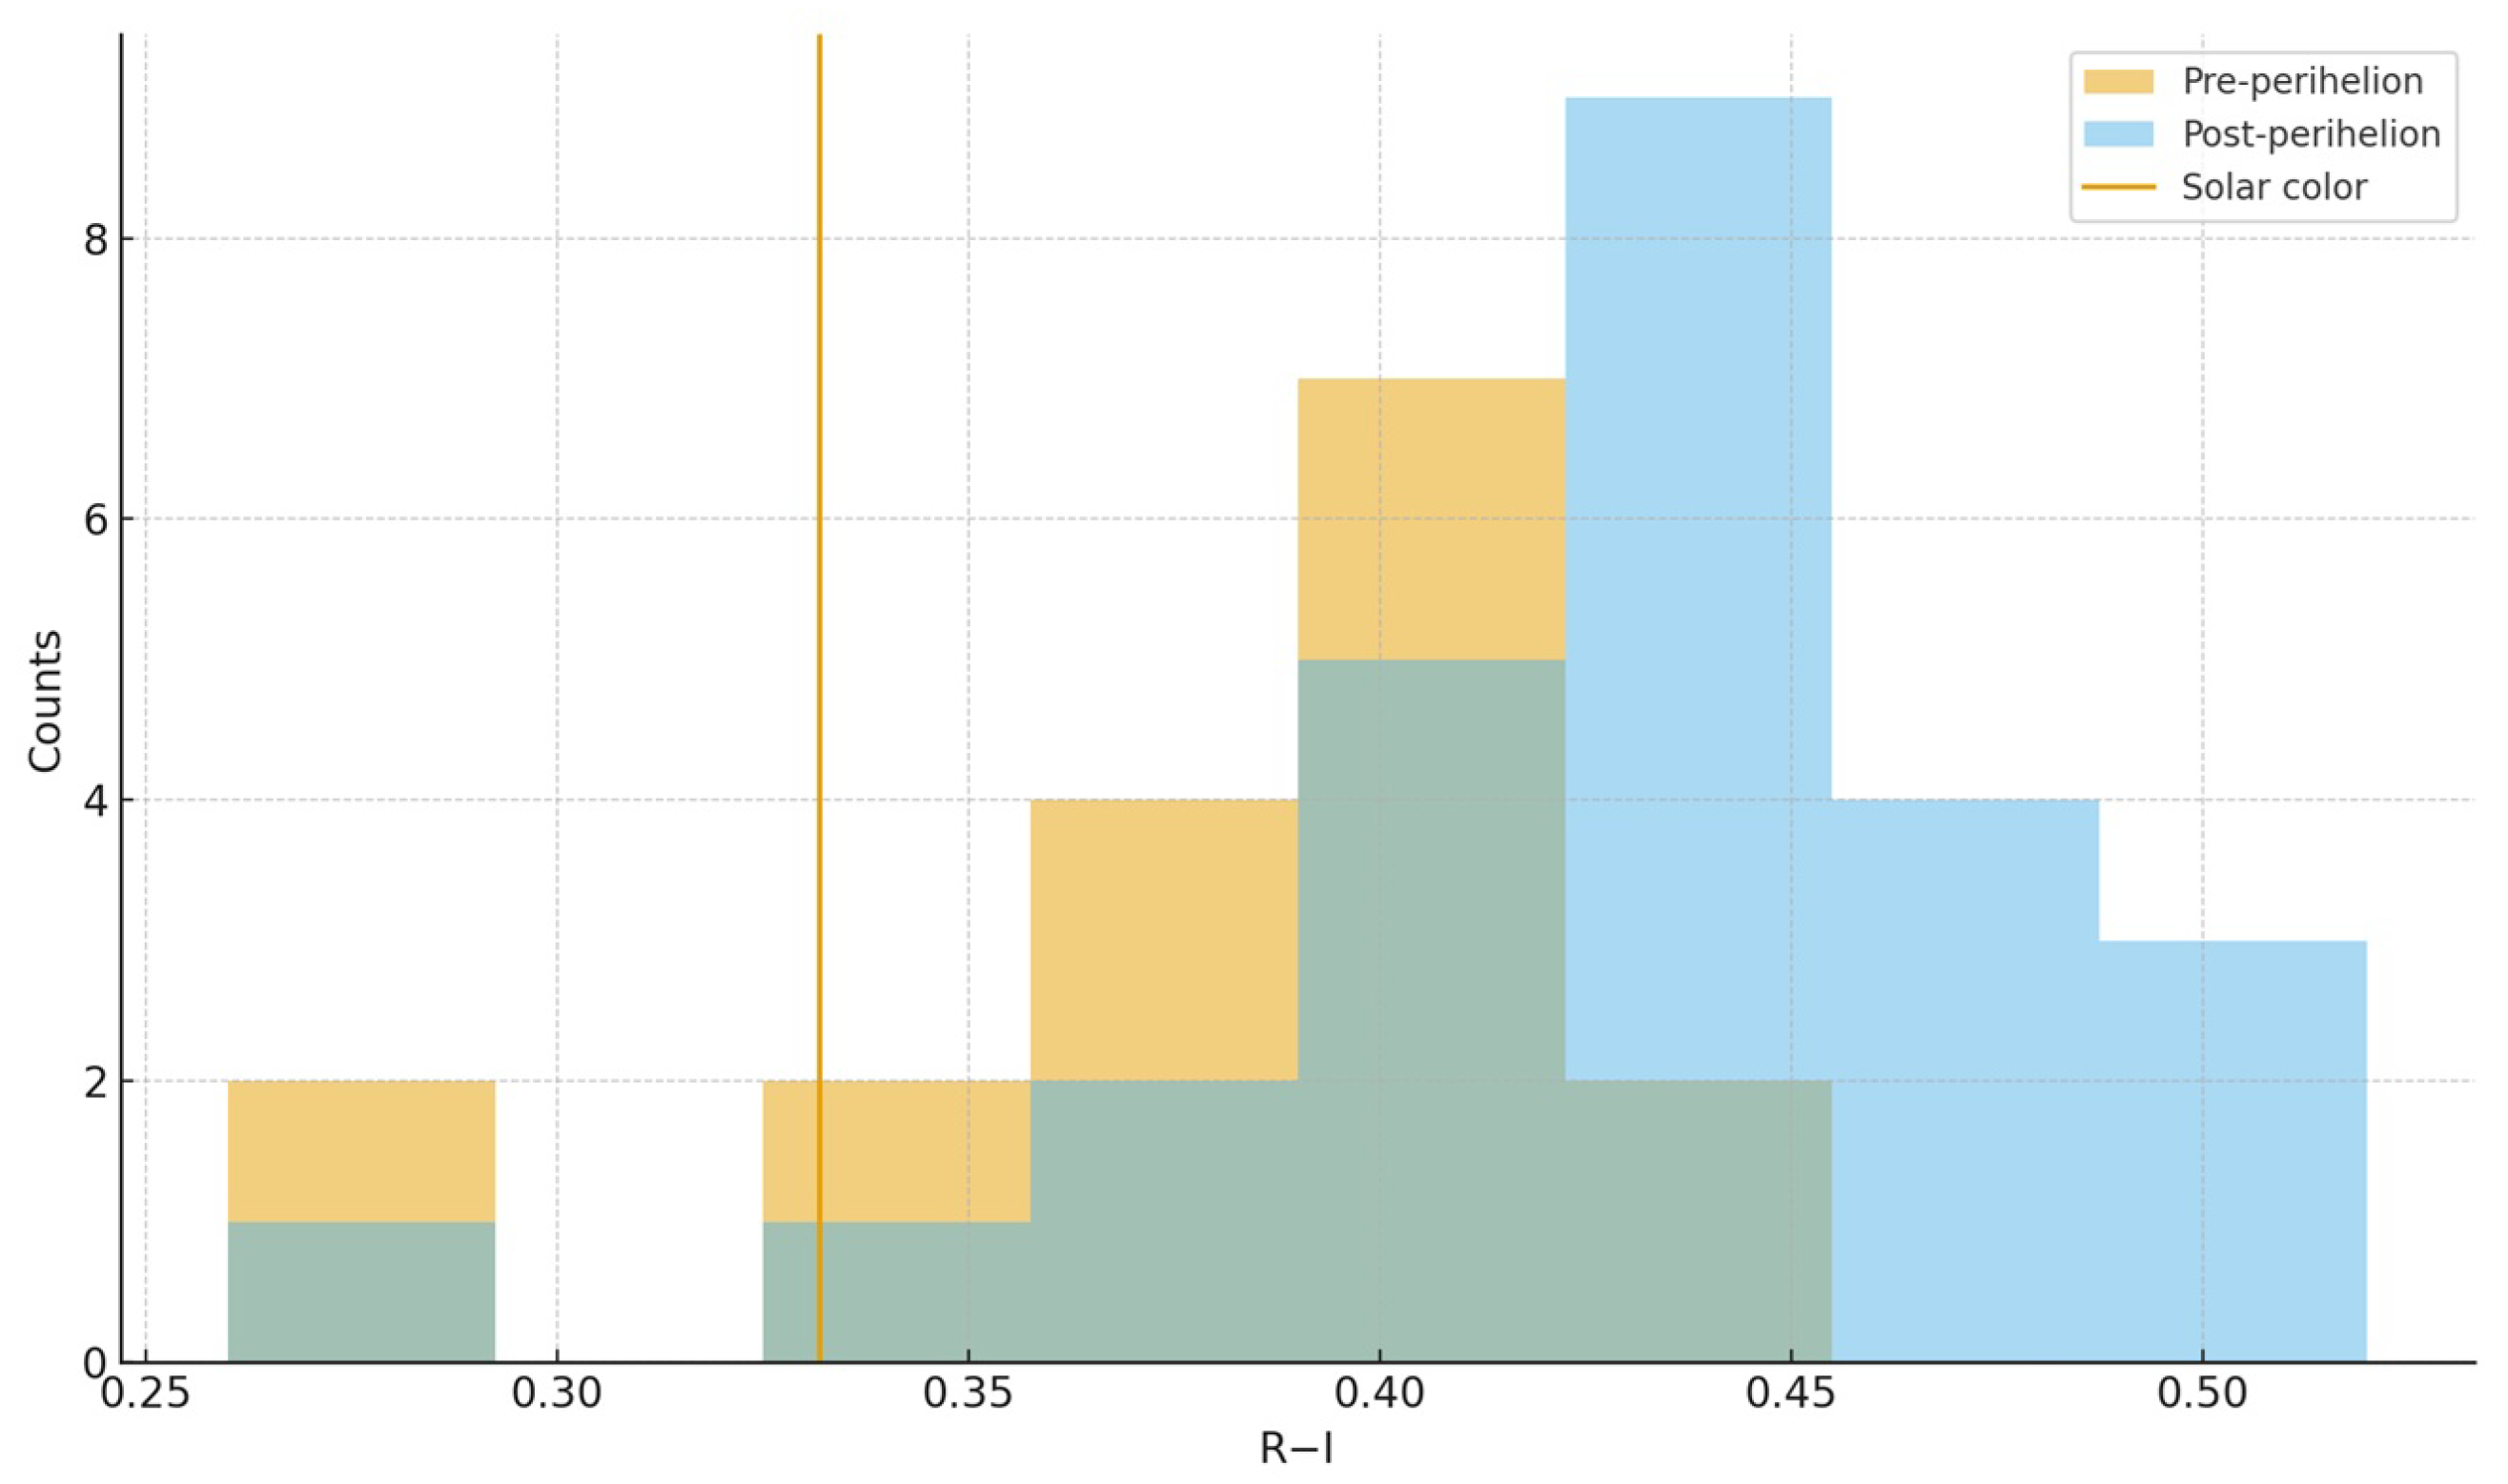
Robust central values were estimated using the median and the median absolute deviation (MAD). Before perihelion, the comet colors are B V = 0.76 with MAD = 0.03 (19 points), V R = 0.42 with MAD = 0.03 (19 points), and R I = 0.39 with MAD = 0.01 (17 points). After perihelion, we obtain B V = 0.77 with MAD = 0.03 (20 points), V R = 0.43 with MAD = 0.02 (20 points), and R I = 0.44 with MAD = 0.02 (25 points, outlier removed). Adopting solar reference colors B V = 0.642 ± 0.016 , V R = 0.354 ± 0.010 , and R I = 0.332 ± 0.008 , the comet is systematically redder than the Sun in all three indices on both sides of perihelion. The excess is of order 0.12 0.13 mag in B V , of order 0.06 0.08 mag in V R , and increases from ∼0.06 mag pre-perihelion to ∼0.11 mag post-perihelion in R I , consistent with a dust-dominated coma (Figure A14, Figure A15 and Figure A16).
We used Spearman’s rank correlation to search for monotonic trends of the colors with heliocentric distance within each orbital branch. Before perihelion, the tests yield ρ = 0.11 ( p = 0.66 , N = 19 ) for B V versus r, ρ = 0.32 ( p = 0.19 , N = 19 ) for V R versus r, and ρ = 0.28 ( p = 0.27 , N = 17 ) for R I versus r. After perihelion, we find ρ = 0.16 ( p = 0.50 , N = 20 ) for B V , ρ = 0.39 ( p = 0.09 , N = 20 ) for V R , and ρ = 0.02 ( p = 0.94 , N = 25 ) for R I . Thus, none of the colors shows a statistically significant monotonic dependence on heliocentric distance within the pre- or post-perihelion branches; the only hint of a trend is a moderate, but still formally non-significant, increase in V R with r after perihelion. We also identified a single physically unusual post-perihelion data point with B V = 1.17 and V R = 0.02 on 13 August 2023. Repeating the Spearman tests with this point removed changes the correlation coefficients only marginally and does not alter any of the above significance statements, indicating that our conclusions are robust against this candidate outlier.
To test for global changes in the color distributions across perihelion, we applied the two-sample Mann–Whitney test to the pre- and post-perihelion subsets. For B V , we obtain U = 131.0 with p 0.10 ( N pre = 19 , N post = 20 ), and for V R we find U = 173.5 with p 0.65 for the same sample sizes. These results confirm that the pre- and post-perihelion distributions of B V and V R are statistically indistinguishable: both indices remain nearly constant around their median values, with no evidence for an abrupt chromatic transition at perihelion. In contrast, for R I , the Mann–Whitney test using the cleaned sample yields U = 77.0 and p 5.3 × 10 4 ( N pre = 17 , N post = 25 ), demonstrating a highly significant shift toward redder R I values after perihelion.
These photometric trends are consistent with the spectroscopic monitoring of comet C/2020 V2 (ZTF) carried out with the TRAPPIST telescopes between December 2022 and August 2023, which revealed OH, CN, C2, and C3 emission on 15 December 2022 [39], and OH, CN, and C2 still present by 29 August 2023 [40], as well as sodium-emission lines detected in January 2023 [41]. Since the strongest gas bands (including C2 and C3) fall in the blue and green, and the Na D doublet lies within the V passband, substantial changes in the gas emission would be expected to drive noticeable variations in the blue-sensitive colors B V and V R . The fact that our broadband colors remain nearly constant in these indices, while R I alone becomes significantly redder after perihelion, suggests that the spectroscopically observed evolution of the gas has only a modest impact on the continuum-dominated broadband colors. The dominant photometric effect is instead a change in the dust component at longer wavelengths, most likely reflecting an evolution in the dust size distribution and/or composition near perihelion.
Taken together, the Spearman and Mann–Whitney tests paint a coherent picture. Within each orbital branch, the absence of significant Spearman correlations indicates that the comet’s colors do not evolve smoothly with heliocentric distance over the sampled range. However, the Mann–Whitney test reveals a clear change in the overall level of the R I color between the pre- and post-perihelion regimes, while B V and V R remain stable. In other words, the cometary coma is persistently redder than the Sun in all bands, but its reddening in the red–near-IR color R I increases after perihelion and then stays approximately constant with r. This behavior suggests a change in the dust population or size distribution near perihelion that primarily affects the longer-wavelength continuum, without producing a corresponding shift in the bluer color indices.

3.10. 1P/Halley (1986)

Color indices for comet Halley were analyzed separately before and after perihelion to characterize the chromatic evolution of the coma. The color indices were derived from the B, V, and R magnitudes available in [42]. The pre-perihelion dataset spans from Δ T = 0 to 138.68 d with respect to JD 2446298.44375 (20 August 1985 (UT 0.94)), corresponding to heliocentric distances 2.86 r 0.92 au, whereas the post-perihelion measurements sample the range 1.63 r 5.86 au. The sample therefore comprises 53 measurements obtained before perihelion and 13 after perihelion. The analyzed data were obtained at the Sanglokh Observatory (Tajikistan, former USSR).
To probe possible heliocentric trends, we computed Spearman’s rank correlation coefficient between each color index and the heliocentric distance r, analyzing the pre- and post-perihelion subsamples independently. Before perihelion, B V shows only a weak, statistically marginal trend with distance ( ρ 0.24 , p 0.086 , N = 53 ), indicating no robust monotonic reddening or bluening with r in this phase. In contrast, V R displays a moderate and significant correlation with distance ( ρ + 0.40 , p 2.9 × 10 3 , N = 53 ), with redder V R values at larger r. After perihelion, B V again exhibits only a suggestive but not statistically significant trend ( ρ + 0.50 , p 0.085 , N = 13 ), largely limited by the small sample size. The behavior of V R after perihelion is markedly different: the correlation with r is very strong and highly significant ( ρ + 0.93 , p 4.7 × 10 6 , N = 13 ), showing that the coma becomes progressively redder in V R as the comet recedes from the Sun.
We then asked whether there is a global shift in color between the pre- and post-perihelion phases, independent of any trend with r. For this purpose, we applied the Mann–Whitney U test to compare the distributions before and after perihelion. For B V , the median color increases from 0.66 in the pre-perihelion sample to 0.72 in the post-perihelion sample. The Mann–Whitney test yields U 157.5 and p 2.6 × 10 3 (two-sided), indicating a statistically significant difference: the coma is globally redder in B V after perihelion than before. For V R , both pre- and post-perihelion medians are ≃0.48. The corresponding Mann–Whitney statistic is U 277 with p 0.28 , so the V R distributions on the two sides of perihelion are statistically indistinguishable despite the strong intra-phase correlations with r.
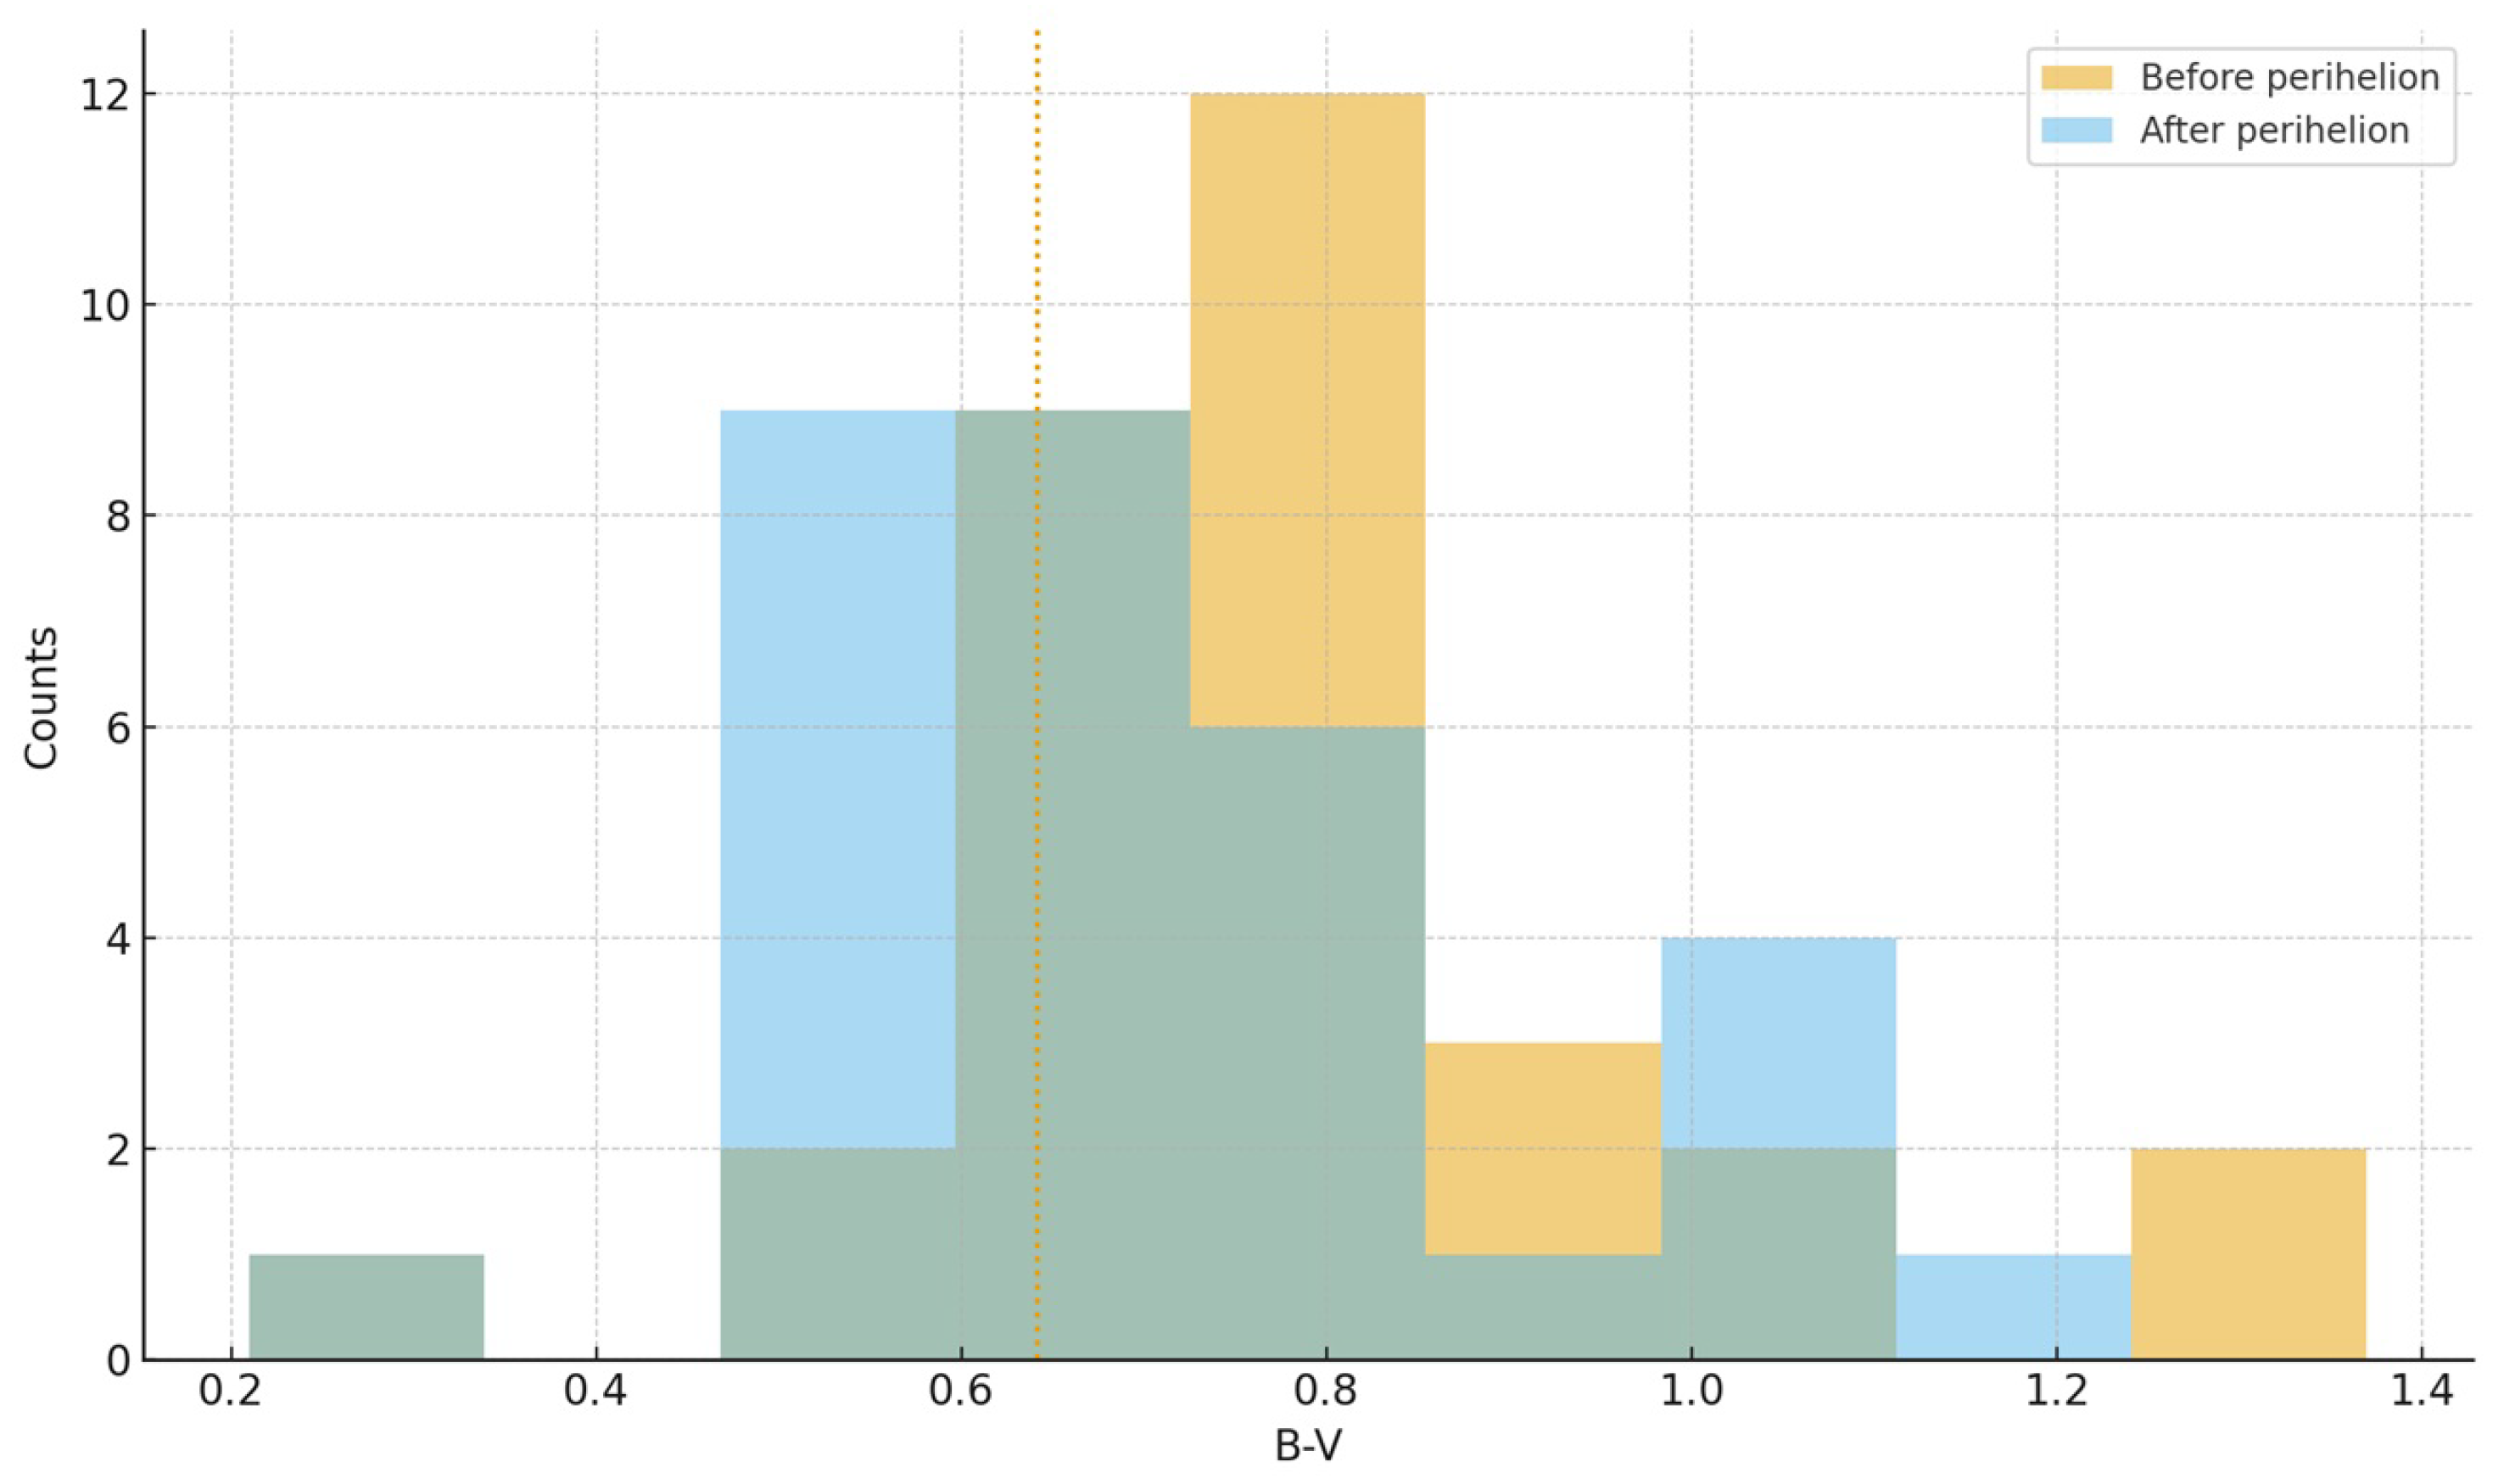
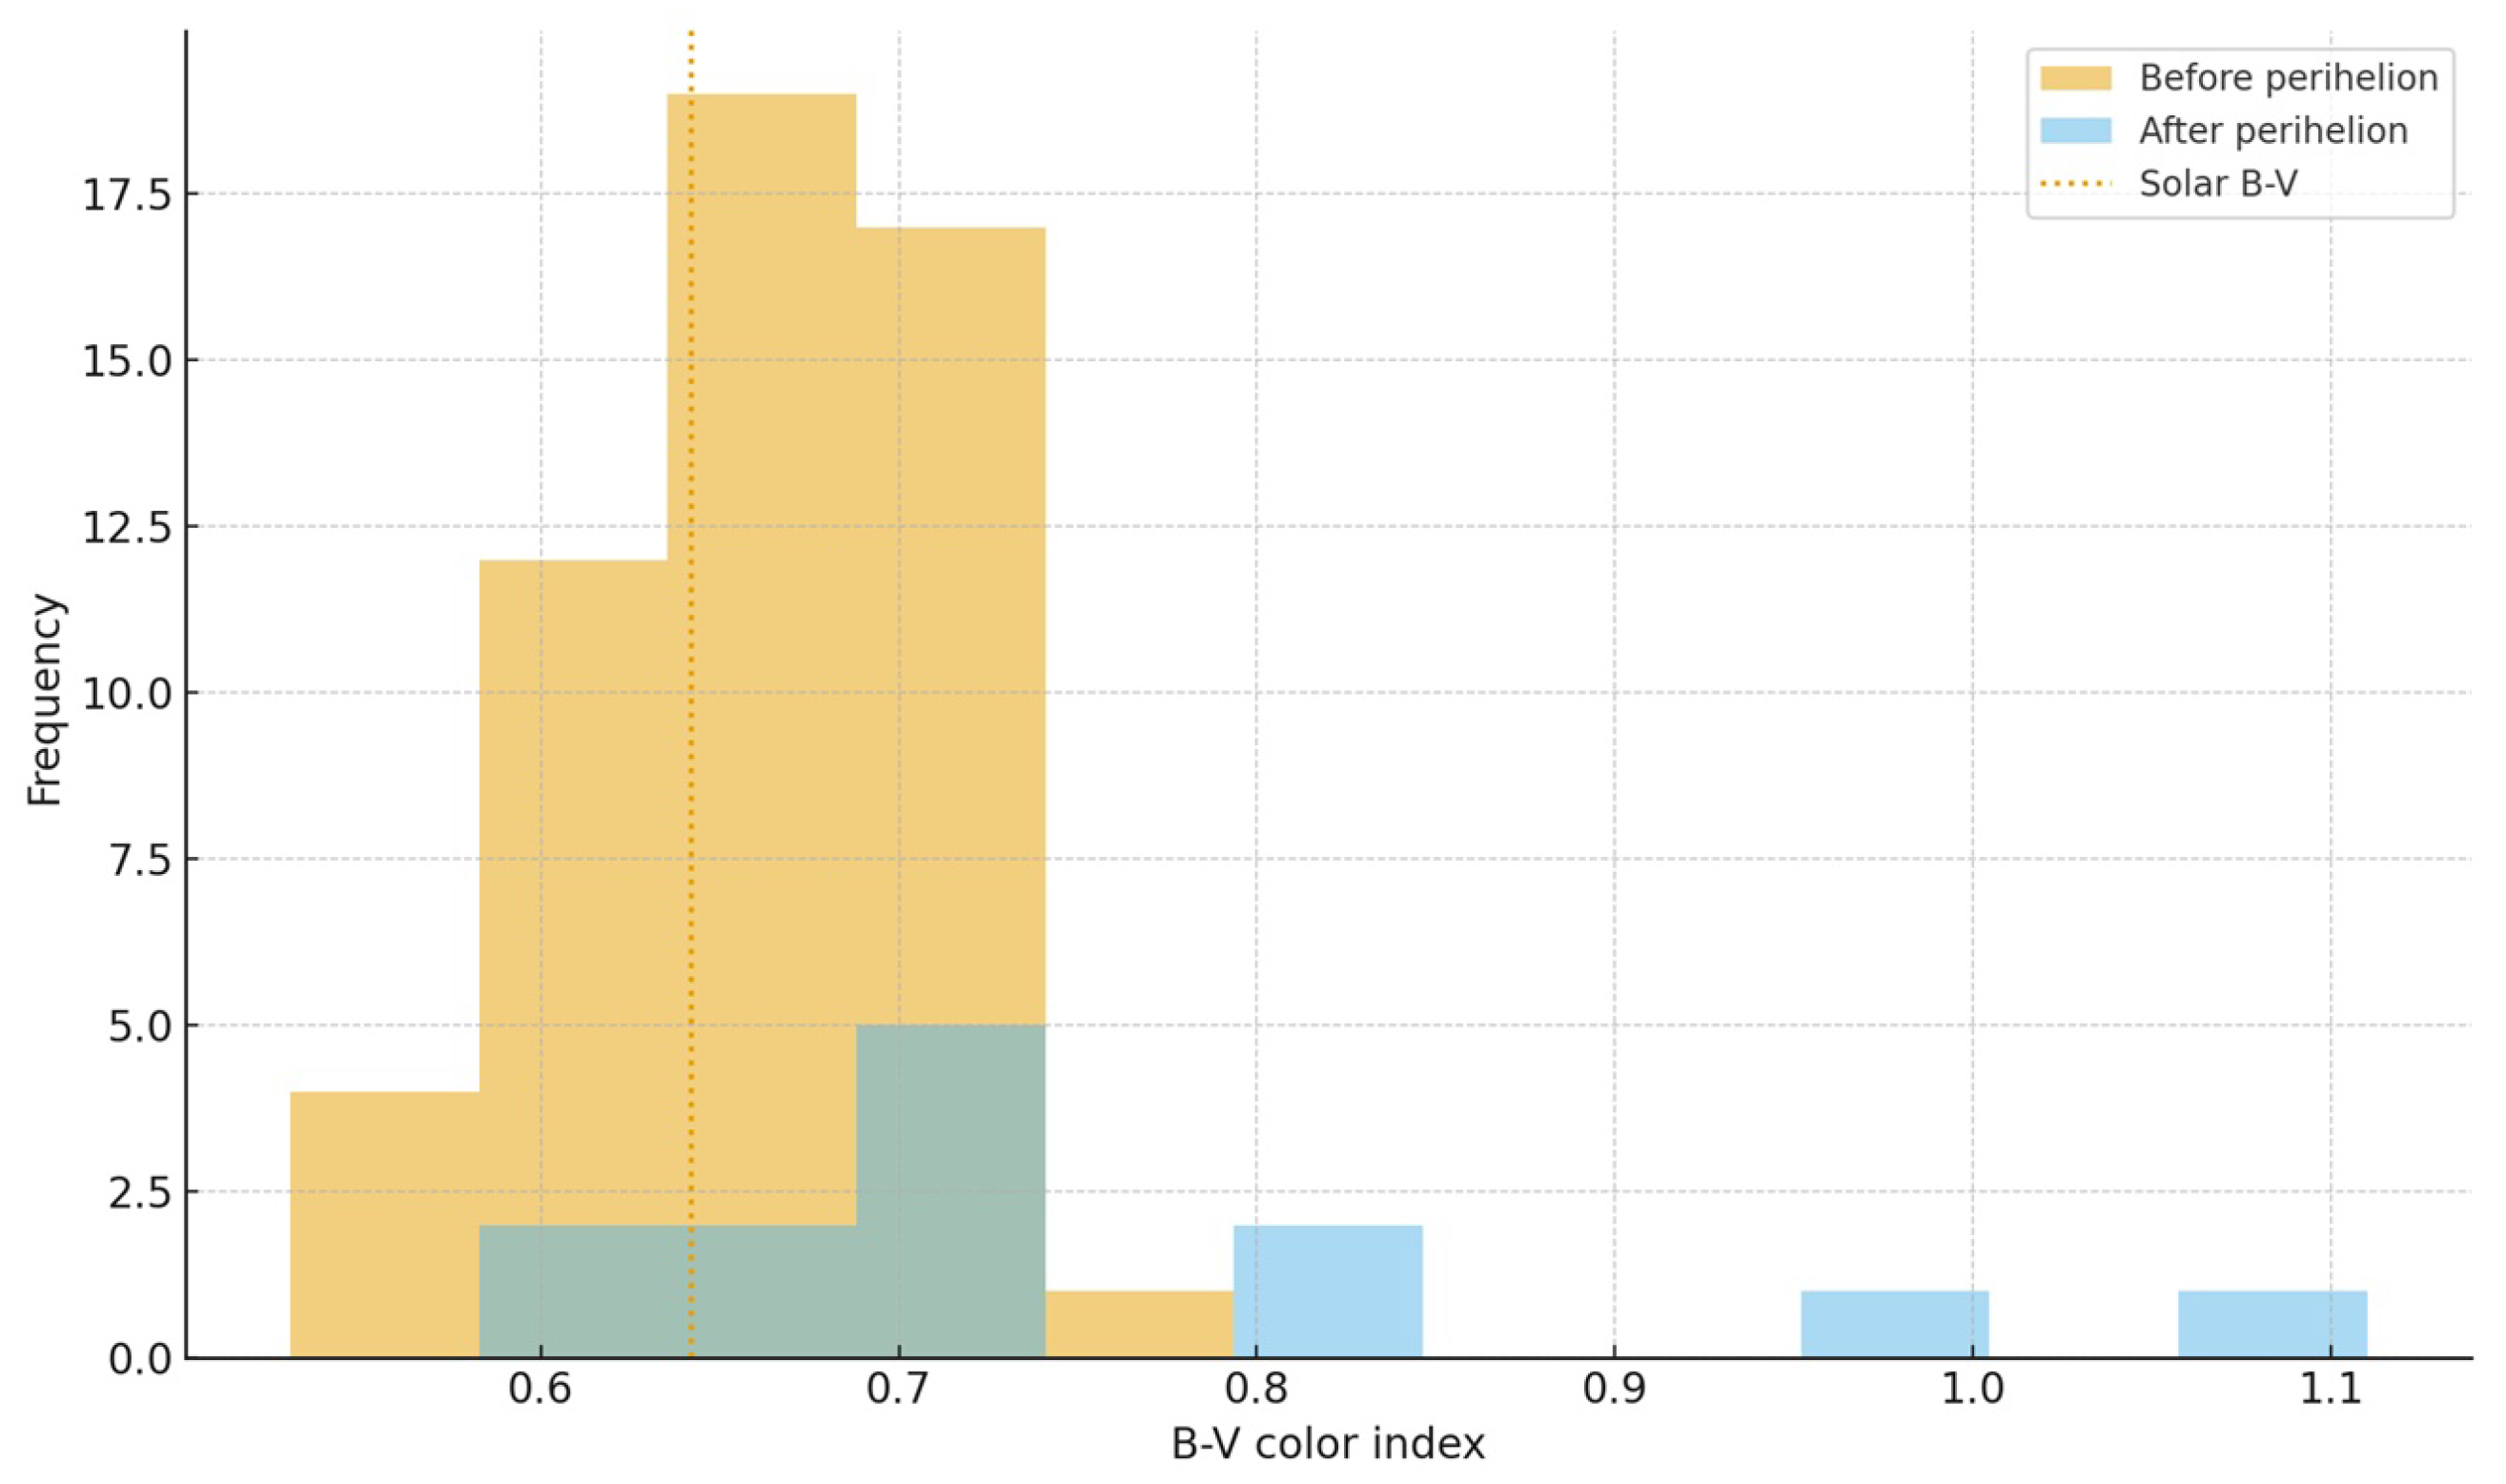
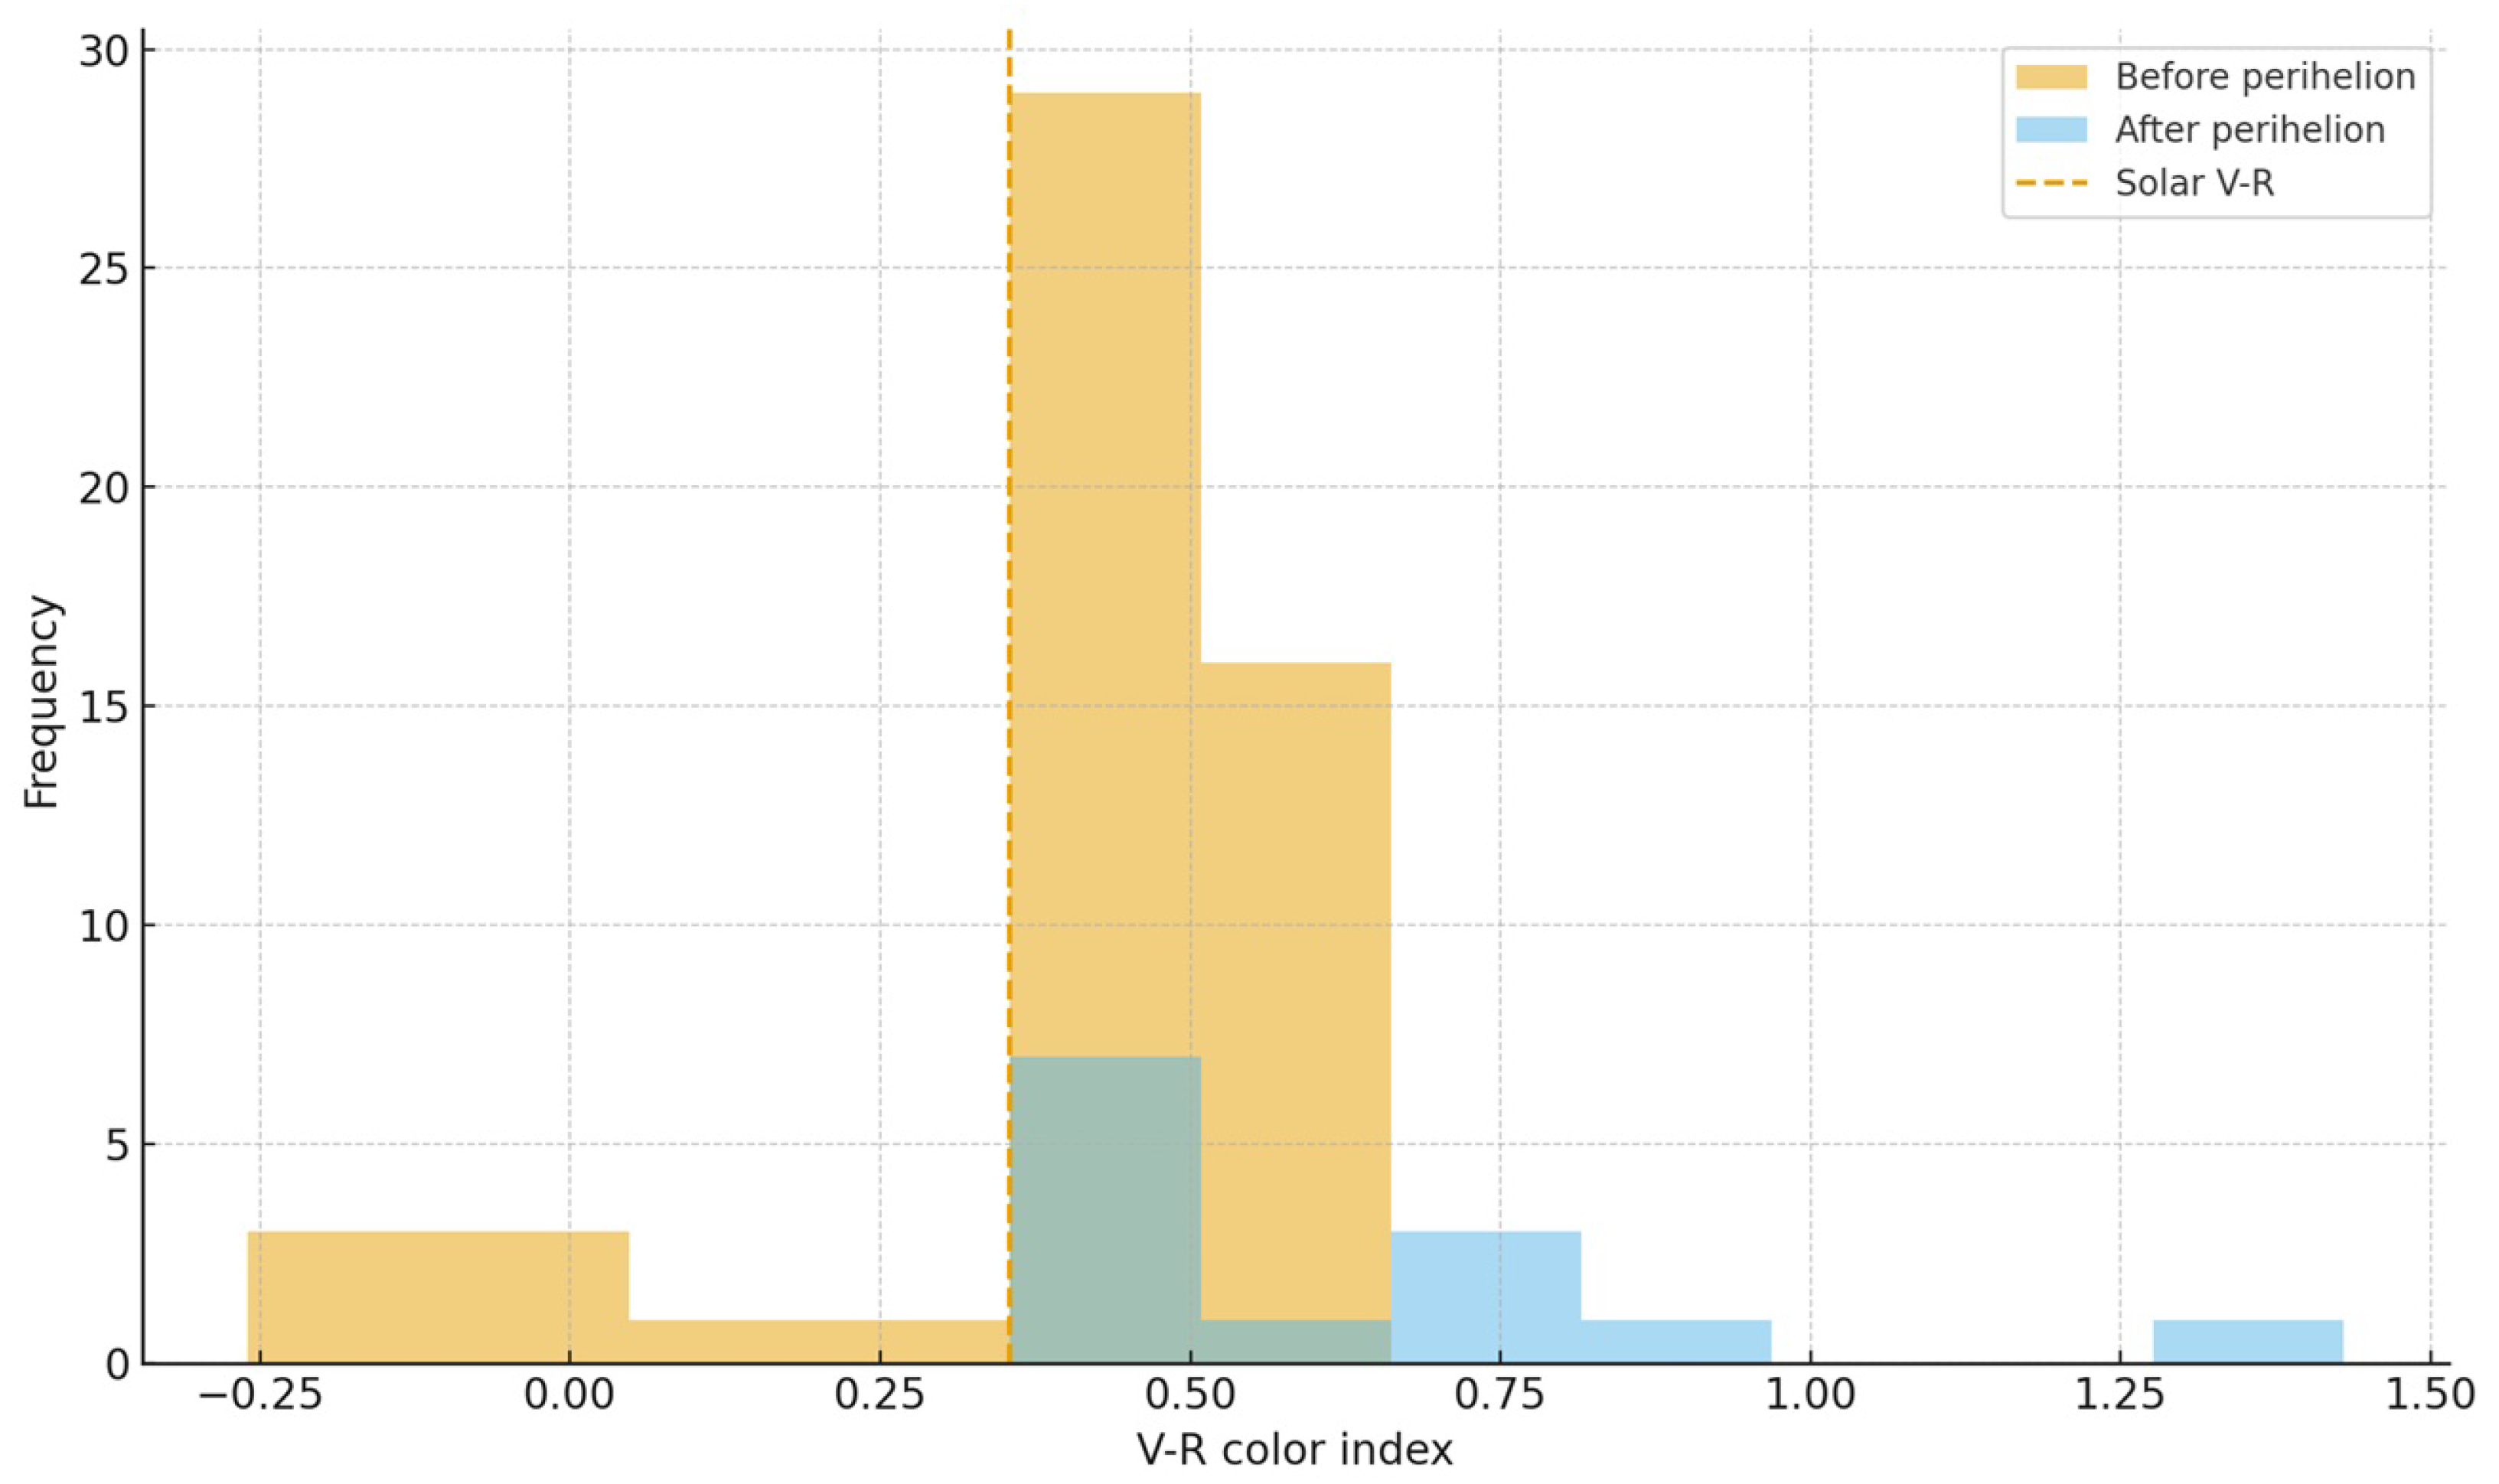
The comparison with the solar reference colors reinforces the picture of a systematically red coma. Before perihelion, the solar B V lies between the first quartile and the median of the cometary distribution, while after perihelion it falls below the first quartile (Figure A17). Thus, Halley is already slightly redder than the Sun in B V before perihelion and becomes clearly redder afterward. For V R , the solar color is below the first quartile in the pre-perihelion sample and even bluer than the minimum measured V R value after perihelion; in both phases, the vast majority of measurements have V R > V R (Figure A18). Histograms with the pre- and post-perihelion data overplotted, together with vertical lines marking the solar colors, visually confirm that the coma is predominantly redder than the Sun in both indices, with only a few very blue V R values near perihelion and a tail of very red V R values at large r after perihelion.
Taken together, these diagnostics show that Halley’s coma is persistently redder than the solar continuum and that its color evolution is not described by a single simple trend. The B V index does not show a strong monotonic dependence on r within each orbital branch, but it undergoes a significant global reddening when comparing pre- and post-perihelion distributions. The V R index, on the other hand, is dominated by a strong radial gradient: it reddens with increasing r on both sides of perihelion, yet its overall distributions before and after perihelion are statistically compatible. In other words, B V primarily encodes a step-like change across perihelion, whereas V R traces a continuous reddening with distance. This combination suggests that different physical components (e.g., dust continuum versus gas emission contaminating the passbands) may contribute in distinct ways to the two color indices along Halley’s orbit.

Relation to DBCP Polarimetric Data

Published polarimetric measurements of comet Halley, as compiled in the Database of Comet Polarimetry (DBCP) [43], provide an independent constraint on the properties of the dust coma over a heliocentric range comparable to that covered by our color data. These observations show that the degree of linear polarization in continuum filters generally decreases as the comet recedes from the Sun, with the trend being particularly marked in the blue continuum and also present, though somewhat weaker, in the red. This behavior is usually interpreted as the combined effect of the changing phase angle along the orbit and of possible variations in the relative contributions of different dust populations, such as changes in the size distribution or porosity of the grains.
Although the photometric and polarimetric datasets are not simultaneous and were obtained with different instrumental setups, their global radial behaviors are qualitatively consistent. Our analysis indicates that the coma becomes redder in V R with increasing r, especially post-perihelion, while remaining systematically redder than the Sun in both B V and V R . At the same time, the polarimetric data indicate a decline in the continuum polarization at larger heliocentric distances. Taken together, these trends suggest that the low-polarization states observed at larger r tend to coincide with redder V R colors, in line with a scenario where more absorbing and/or larger dust particles become relatively more important as the comet moves away from the Sun. Given the lack of strictly simultaneous measurements and the strong dependence of polarization on phase angle, we regard this agreement as qualitative rather than as a direct point-by-point correlation between color and polarization.
Ref. [44] analyzed systematic photometric and polarimetric observations of comet 1P/Halley and derived, among other results, the phase-angle dependence of the dust color using the narrow-band continuum index B C R C . The color B C R C was found to systematically decrease with increasing phase angle, indicating that the dust becomes bluer at larger α , an effect interpreted as a decrease in the mean dust-particle size as the comet approaches the Sun. This result shows explicitly that Halley’s dust color depends not only on heliocentric distance but also on phase angle, so that any trend in broadband indices such as B V and V R with r inevitably mixes distance and phase effects. In combination with the phase-dependent color changes reported by Rosenbush and the decrease of continuum polarization with r seen in the DBCP data, the reddening of V R with increasing r found here is qualitatively consistent with a scenario in which the relative contribution of more absorbing and/or larger grains increases as the comet recedes from the Sun. This connection must therefore remain qualitative, but it reinforces the interpretation of Halley’s persistently red coma as a manifestation of evolving dust populations rather than a purely geometric effect.
Additional constraints on the nature of Halley’s dust are provided by the polarimetric modeling of Sen et al. [45], who combined their IHW and broadband measurements with other published data to derive a comprehensive phase- and wavelength-dependent polarization curve for the comet. Assuming Mie-type scattering by spherical grains, they showed that the observed polarization can be reproduced by a power-law size distribution extending from submicron to tens of microns (roughly 10 3 –20 µm), similar to the distribution proposed by [46], together with complex refractive indices that vary with wavelength. The required refractive indices imply moderately absorbing, low-albedo particles, consistent with a mixture of silicate and carbonaceous materials. When combined with our finding that Halley’s coma is persistently redder than the Sun in B V and V R and that V R reddens with increasing r, the Sen et al. modeling supports a picture in which the red continuum colors and the relatively low continuum polarization both arise from dust populations dominated by absorbing grains with a broad size distribution. In this framework, the evolution of the color indices along the orbit reflects changes in the relative contribution of different portions of the size spectrum, rather than a wholesale change in composition.

3.11. 4P/Faye (1991)

The B V color indices and V-band magnitudes used in this work are taken from Table 1 in Grothues [24]. The observations span 9 November 1991 to 22 January 1992 and cover both pre- and post-perihelion orbital phases, for heliocentric distances between 1.595 and 1.734 au.
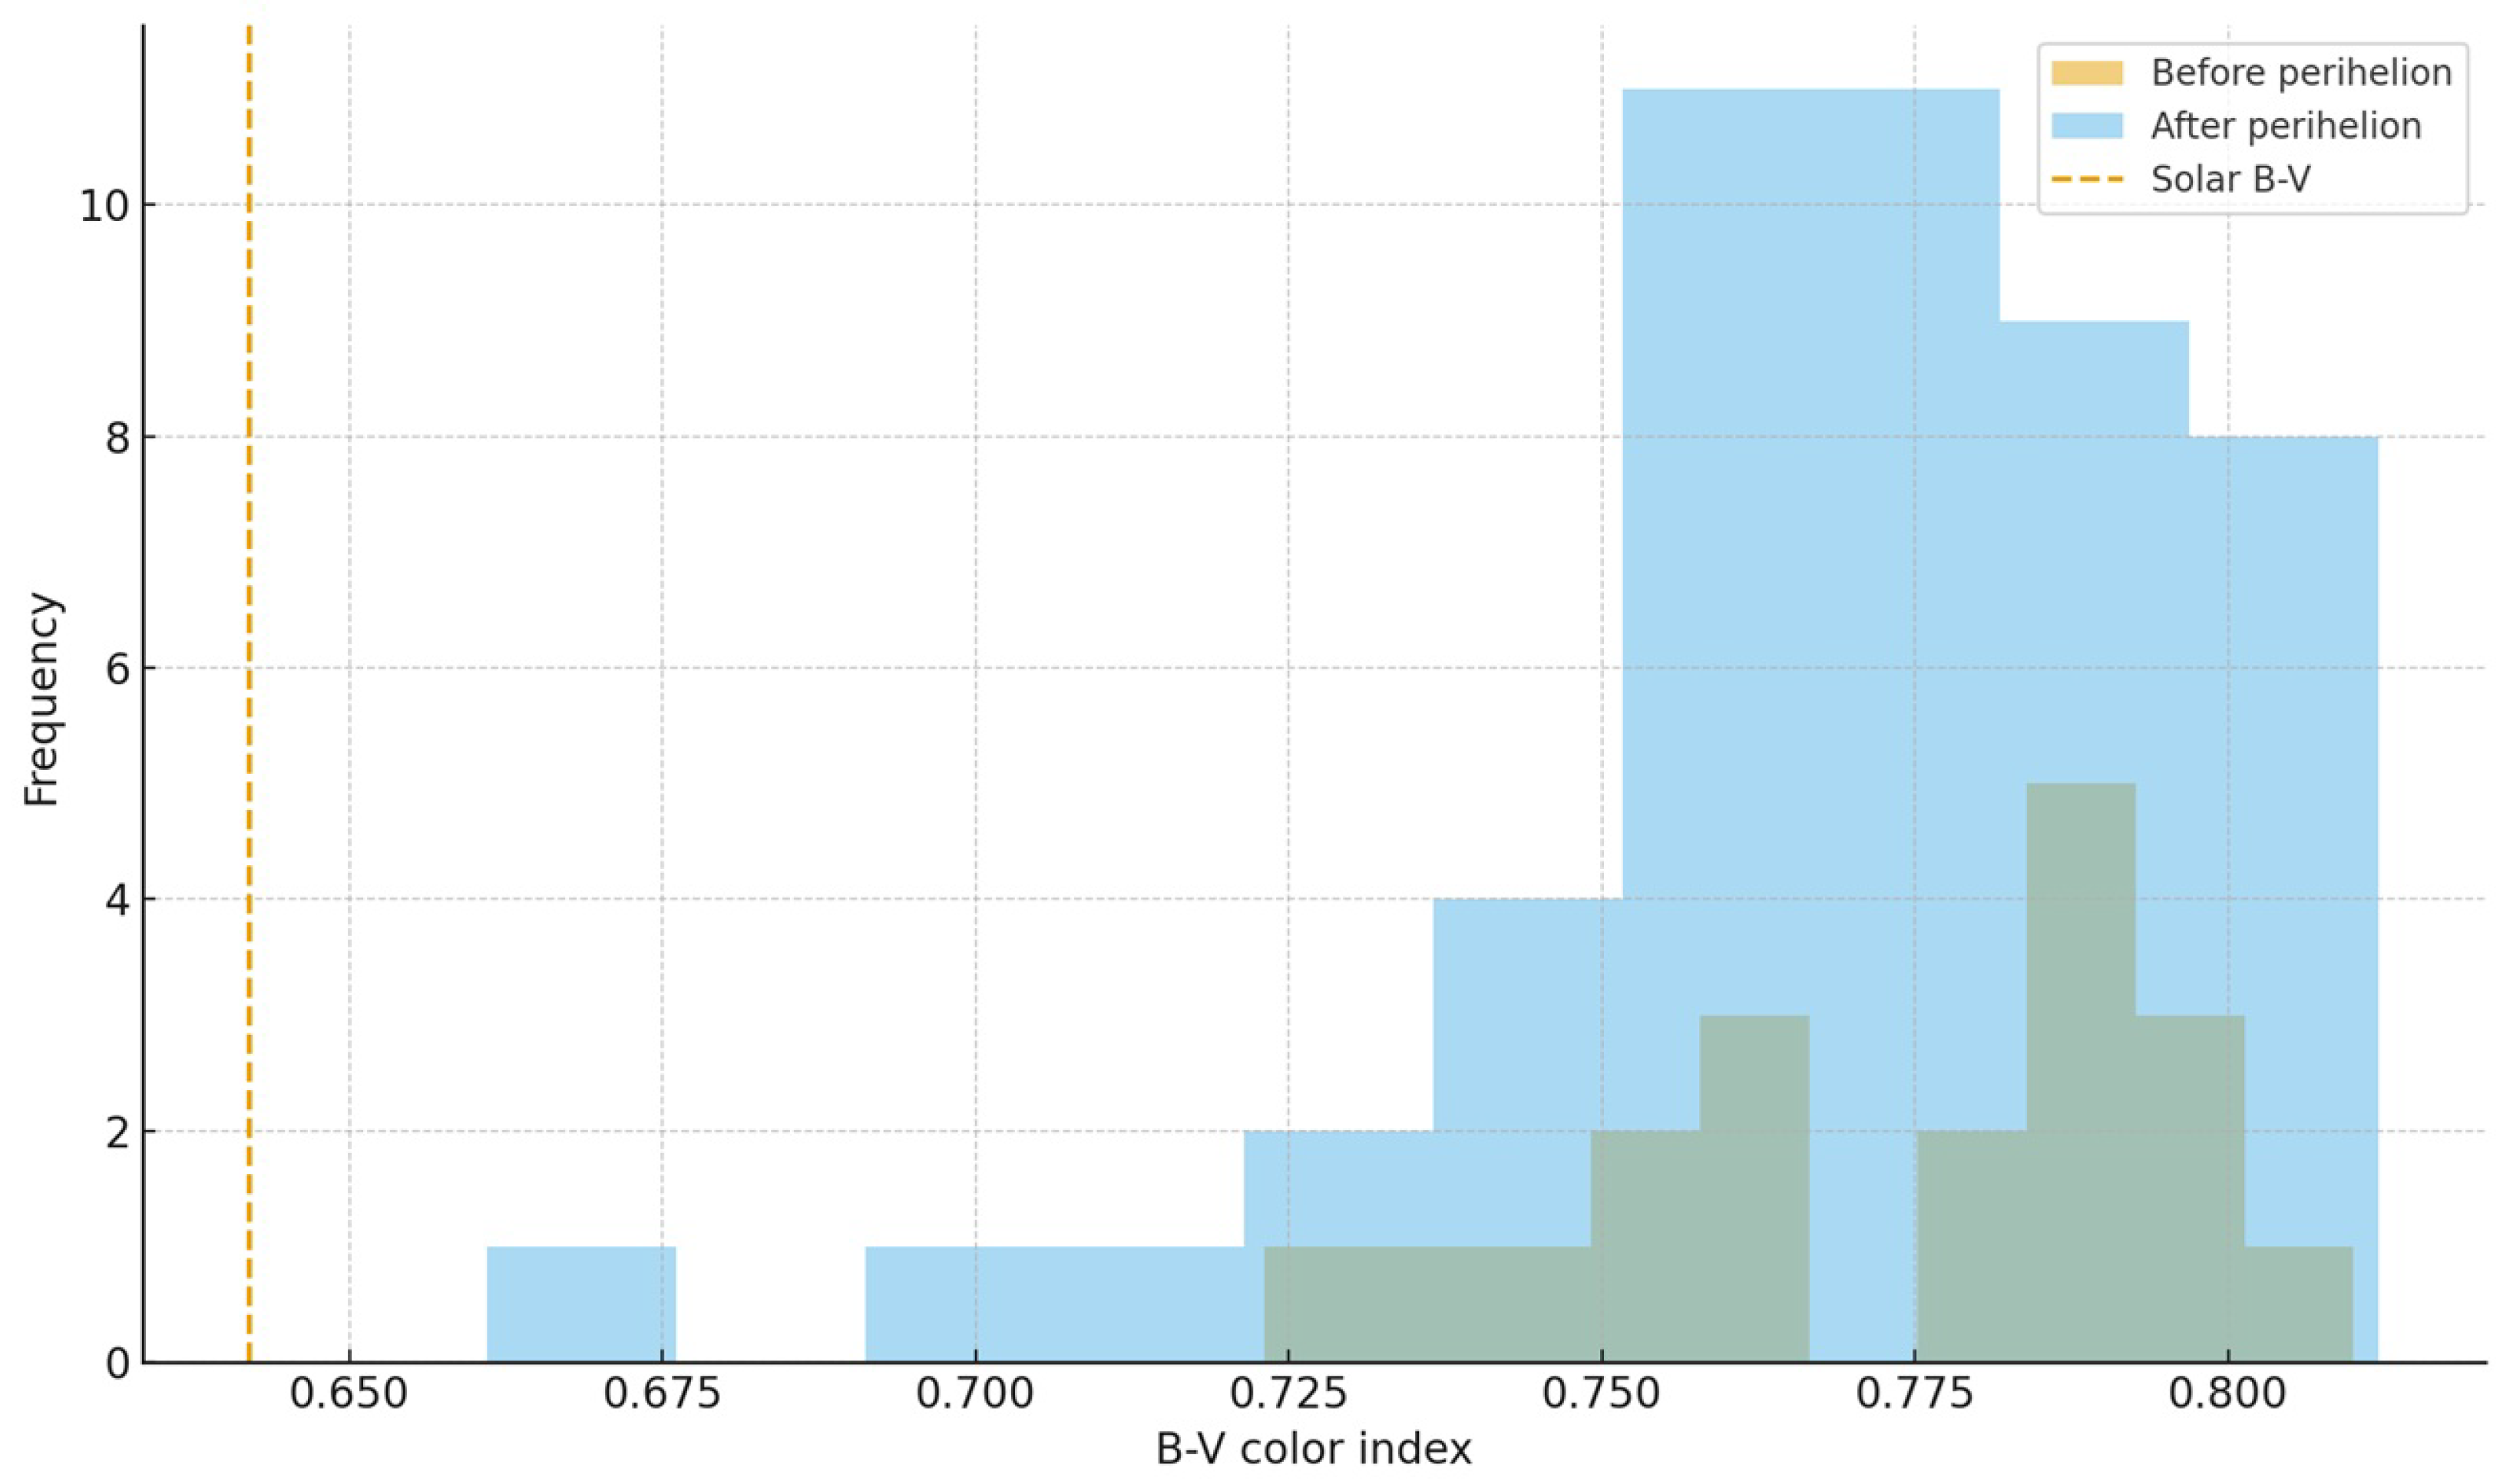
The B V color index of comet 4P/Faye was analyzed as a function of heliocentric distance by splitting the dataset into two subsamples: pre-perihelion ( t p < 0 , N = 19 ) and post-perihelion ( t p > 0 , N = 48 ), where t p is the time in days from perihelion at 1991 Nov 16.1843. Before perihelion, the colors are consistently red, with median B V = 0.783 , MAD = 0.017 , and first and third quartiles Q 1 0.758 and Q 3 0.790 . After perihelion, the distribution remains similarly red, with median B V = 0.775 , MAD = 0.016 , and quartiles Q 1 0.759 and Q 3 0.788 . In both phases, the solar color B V = 0.642 ± 0.016 lies below the minimum measured cometary values ( 0.723 before and 0.661 after perihelion), i.e., well below the first quartile. Thus, Faye’s coma is systematically redder than the Sun, independently of orbital phase.
To search for monotonic trends with heliocentric distance in each phase, we applied Spearman’s rank correlation test between B V and r. Before perihelion, we obtain ρ S = 0.4595 with p 4.78 × 10 2 ( N = 19 ), indicating a moderate positive correlation that is marginally significant at the 5 % level: within the limited pre-perihelion range, B V tends to increase weakly with r. After perihelion, ρ S = 0.1813 with p 0.217 ( N = 48 ) indicates a weak and statistically insignificant correlation, so no robust color–distance trend is detected in the post-perihelion data. At most, the results suggest a mild chromatic gradient confined to the pre-perihelion arc, while the post-perihelion colors are consistent with being approximately constant as the comet recedes.
The global comparison of color levels before and after perihelion was carried out with the Mann–Whitney test applied to the two B V samples. For N before = 19 and N after = 48 , we obtain U = 485.5 and p 0.687 , indicating no statistically significant shift between the two distributions. This agrees with the nearly identical medians and the strongly overlapping quartile ranges. Overall, the rank correlations and the two-sample test are consistent: there is no evidence for an abrupt chromatic transition at perihelion, and any heliocentric color evolution is subtle compared with the intrinsic dispersion of the data. The overplotted histograms for the pre- and post-perihelion samples (Figure A19), with a vertical line marking the solar color, visually reinforce this result: all cometary measurements cluster in a narrow red range well to the red of the Sun in both orbital phases, indicating a persistently dust-dominated, reddened coma.
Independent evidence that 4P/Faye’s near-nucleus environment is dust-dominated comes from the detection of a very long dust trail in the 2006 return. Sarugaku et al. [47] showed that the trail, detected over 10 ° along the orbit at optical wavelengths, is reproduced well by a dust-ejection model in which centimeter-sized particles, released in previous apparitions, dominate the trail brightness. Their inferred size distribution indices for the ejected and trail grains ( 3.5 and 1.9 , respectively) imply a strong contribution from large, long-lived particles. This picture is fully consistent with the persistently red and nearly phase-independent B V colors derived here, which indicate a stable, dust-dominated coma with negligible gas-induced color variations over the sampled heliocentric range.

3.12. 41P/Tuttle-Giacobini-Kresak (2017)

We investigated the behavior of the color index B V of comet 41P as a function of heliocentric distance by splitting the dataset at perihelion, adopted as JD peri = 2457856.25299223653 (12 April 2017 (UT 0.75299224)). The pre-perihelion subsample ( JD < JD peri ) contains 59 measurements, while the post-perihelion subsample ( JD JD peri ) contains 17 such points (Table A10, Table A11 and Table A12).
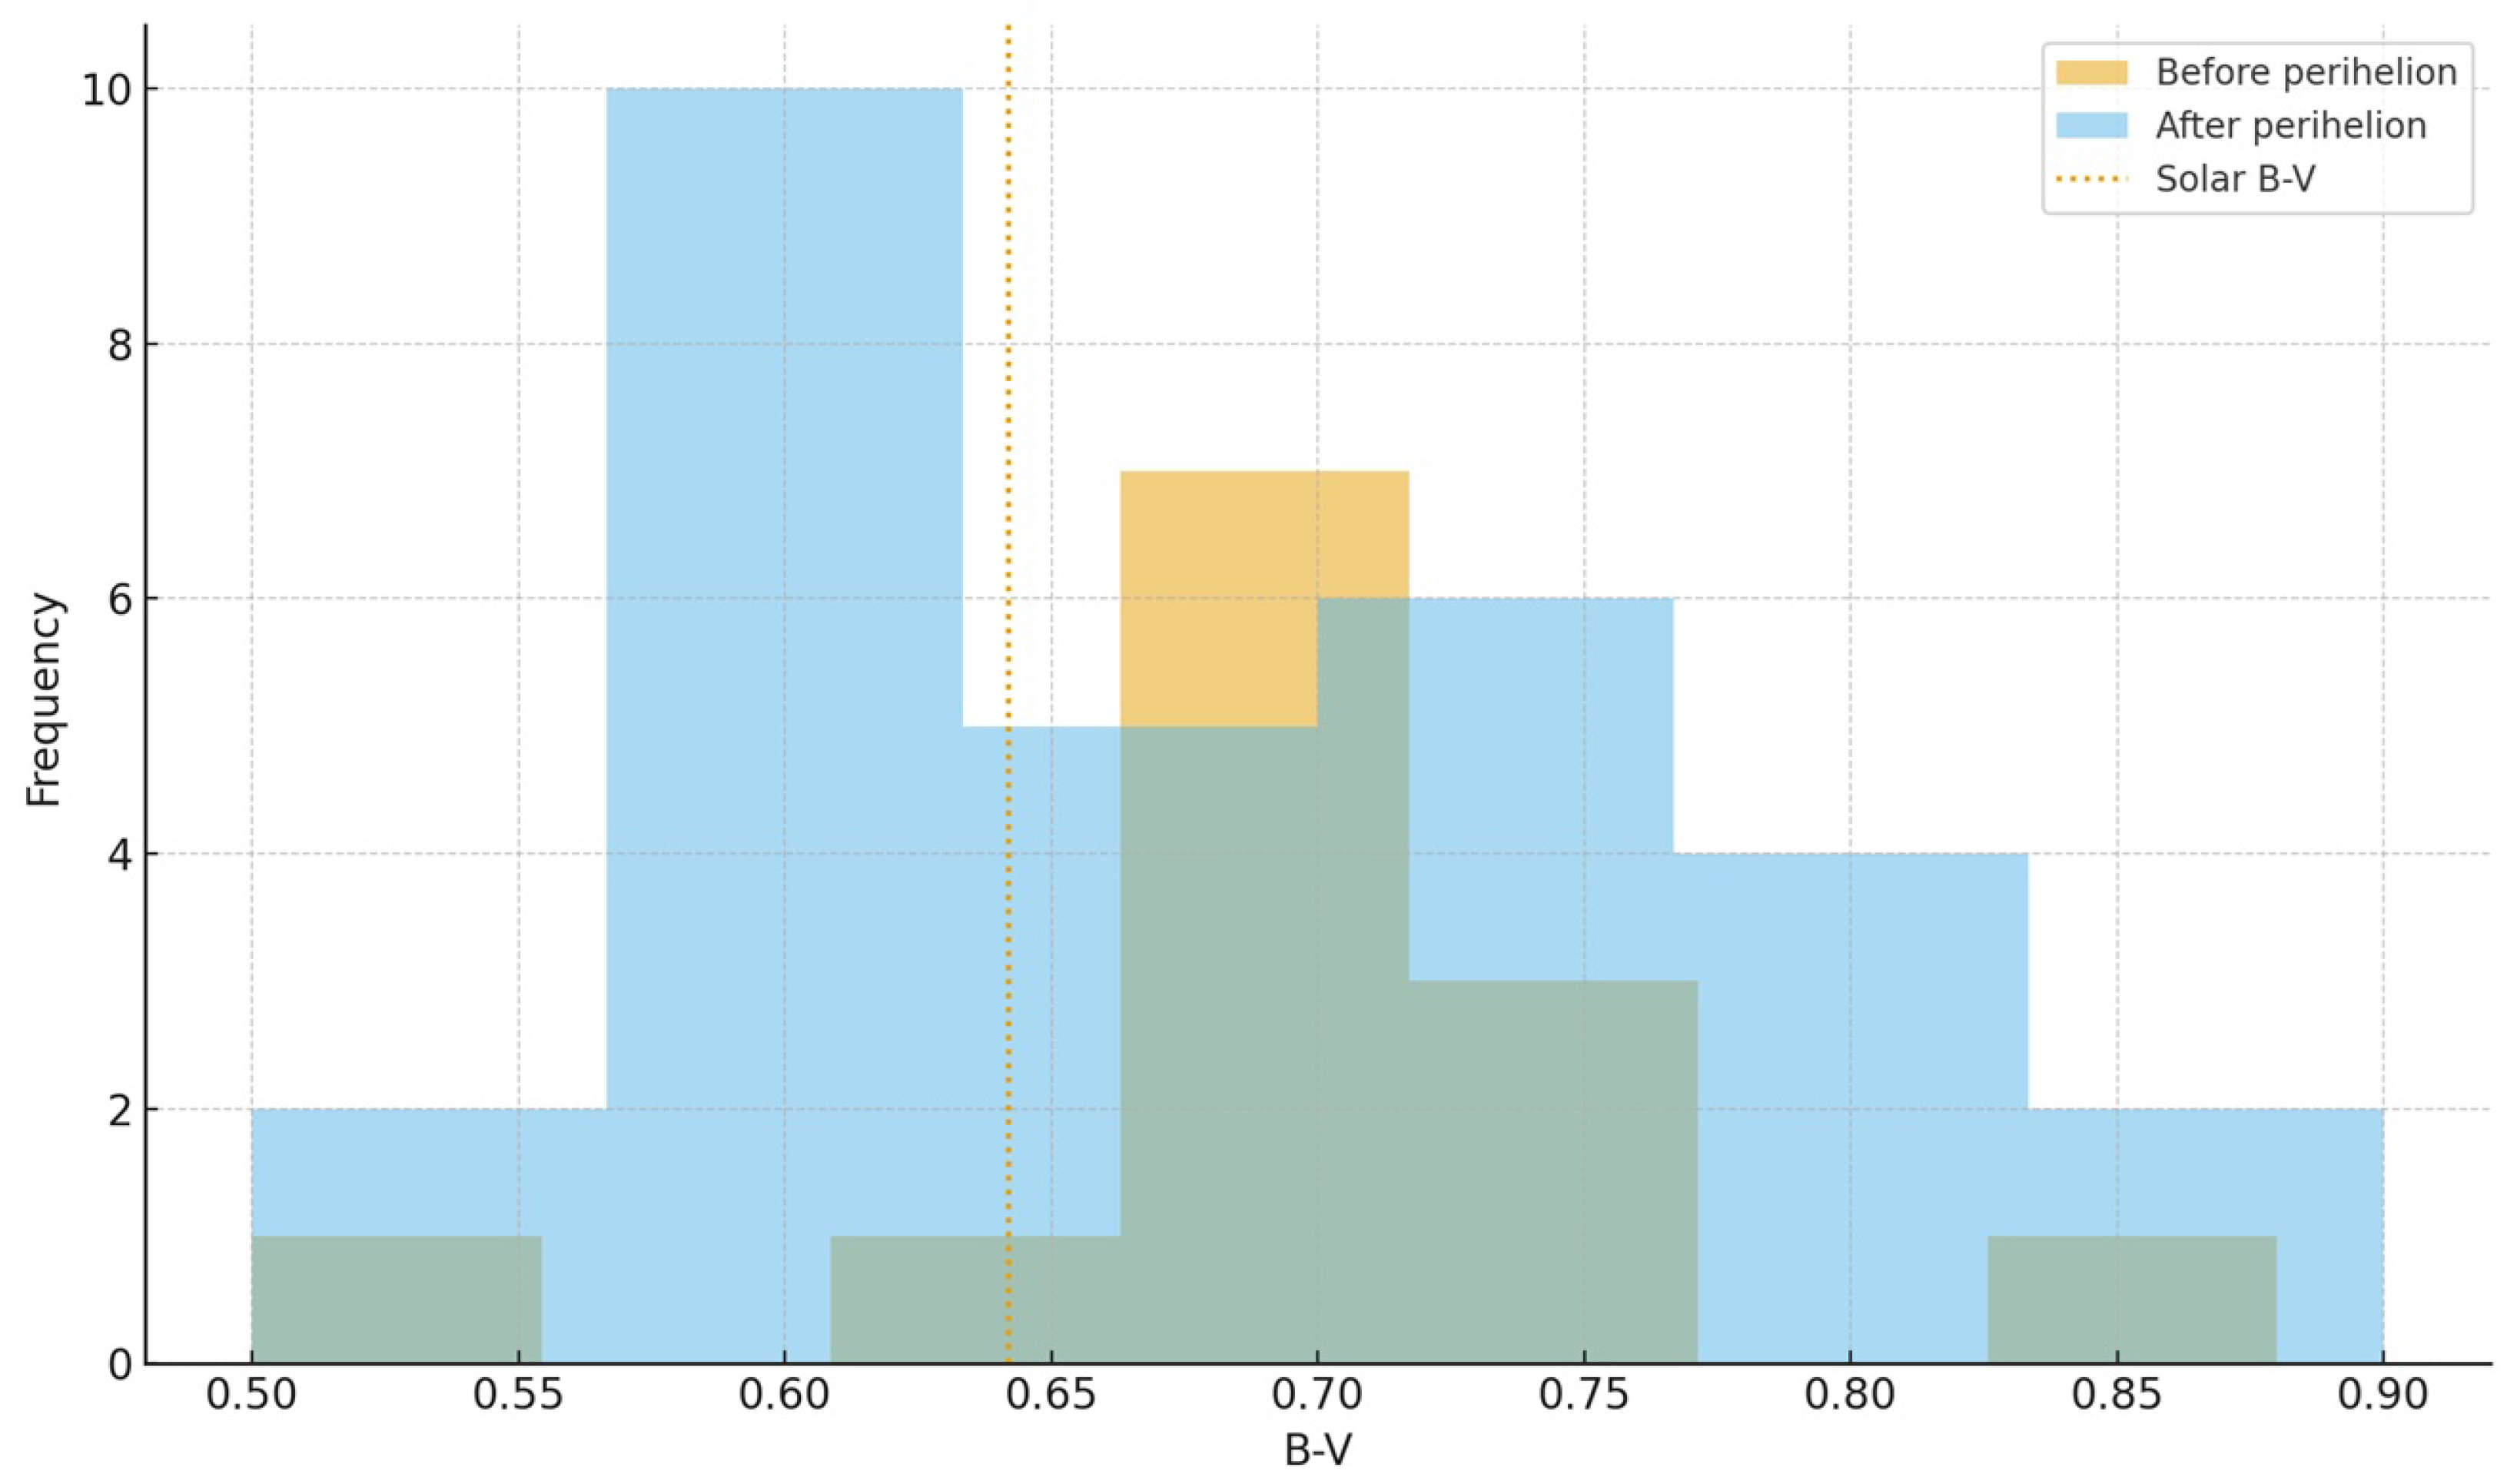
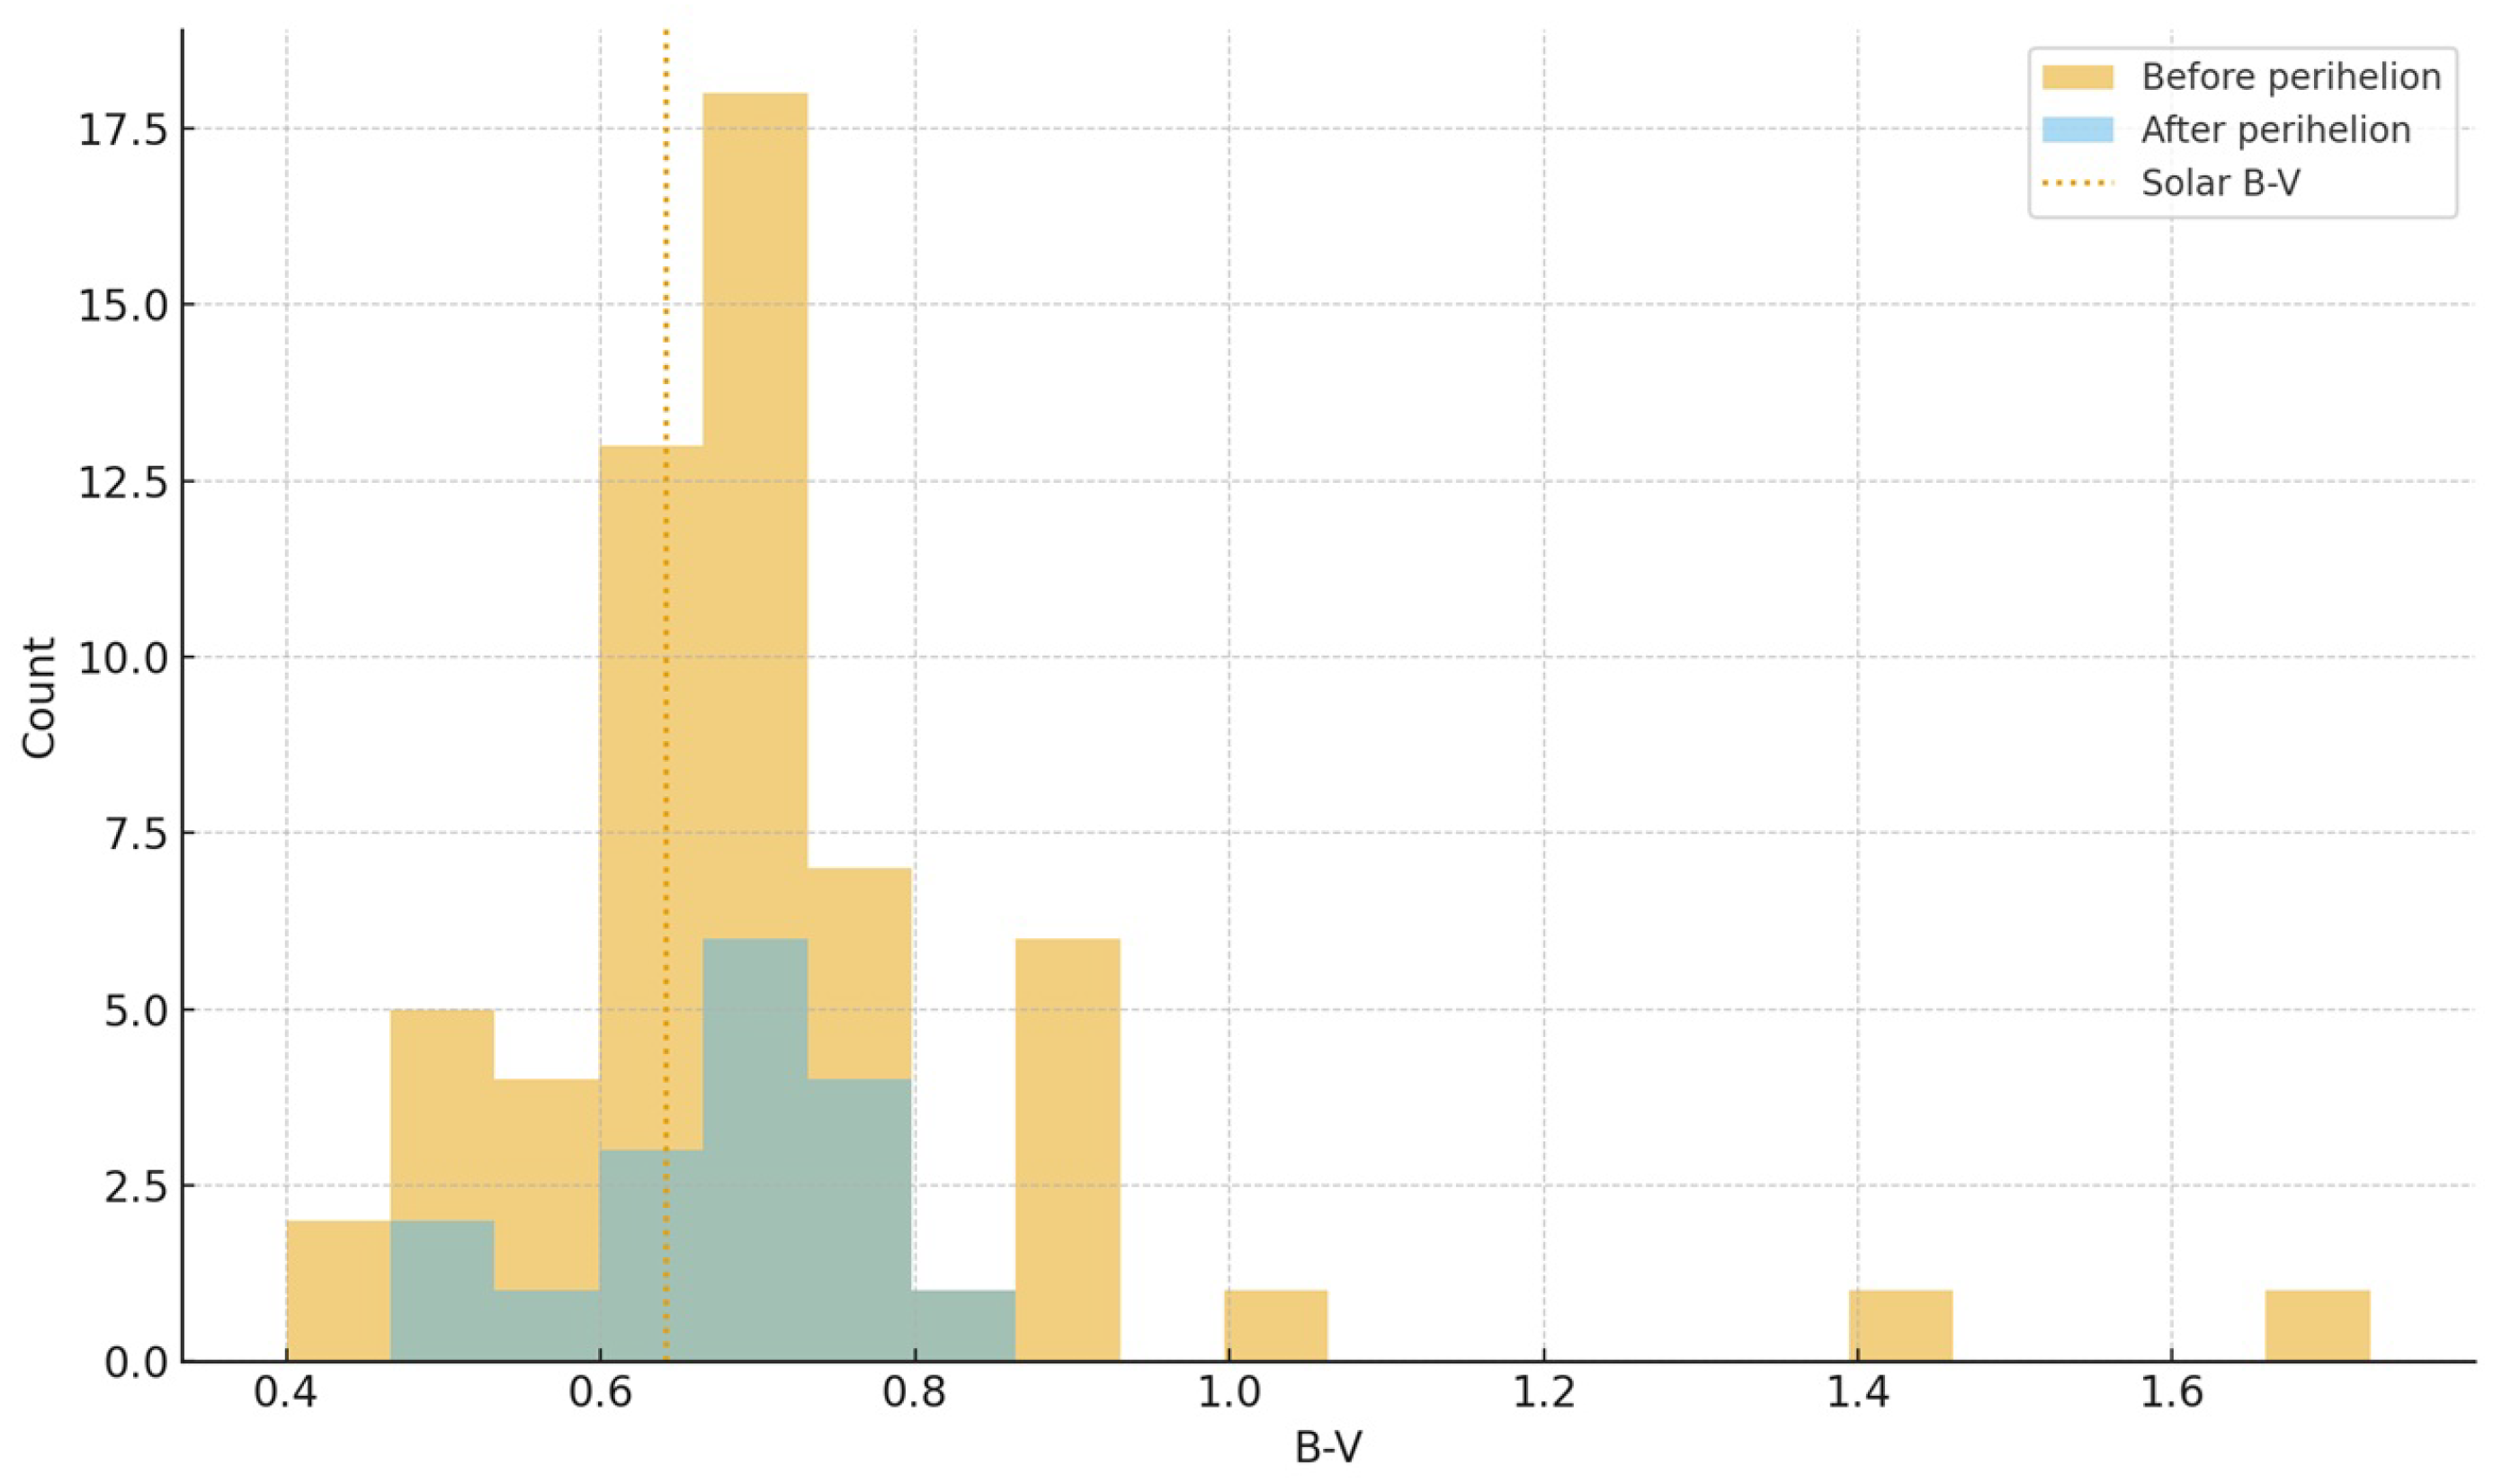
For each subsample, we computed robust descriptive statistics. Before perihelion, the median color is B V = 0.68 with MAD = 0.08 ; after perihelion, the median is B V = 0.69 with MAD = 0.07 . In both regimes, the solar color lies between the first quartile and the median, indicating that the coma is slightly redder than the Sun, but not extremely so (Figure A20).
To search for monotonic trends of color with heliocentric distance, we applied non-parametric correlation tests between B V and r. Before perihelion, Spearman’s rank coefficient is ρ = 0.233 with a two-sided p 0.076 , and Kendall’s τ = 0.172 with p 0.058 . Both statistics suggest only a weak positive correlation that is marginal at the 10% level and not significant at the conventional 5% level. A robust Theil–Sen regression of B V on r in the same interval yields a positive slope of order 1 mag au 1 , but with a 95% confidence interval that still includes zero, reinforcing that any reddening with increasing r is at best tentative. After perihelion, all diagnostics are fully consistent with the absence of a trend: Spearman and Kendall coefficients remain small ( ρ 0.25 , τ 0.20 ) with large p-values ( p 0.33 and p 0.28 ), and the Theil–Sen slope has a wide confidence interval that comfortably spans zero.
We then compared the color distributions before and after perihelion using the Mann–Whitney test. The statistic U = 543.5 with a two-sided p 0.60 indicates no statistically significant difference between the two samples, in agreement with their nearly identical medians. This result is visually supported by the overplotted histograms of B V (Figure A20), where the pre- and post-perihelion distributions largely overlap and the vertical dotted line marking B V falls in the same relative region of both histograms (between the first quartile and the median). Taken together, the non-parametric correlations, the robust regression, and the Mann–Whitney comparison paint a coherent picture: throughout the observed range in heliocentric distance, comet 41P exhibits a coma that is consistently slightly redder than the Sun, with no statistically significant change across perihelion and at most a marginal indication of a weak reddening trend with increasing r in the pre-perihelion leg.
Independent pre-perihelion observations of the inner coma of 41P provide an additional piece of context. Using Johnson–Cousins V and R filters and apertures sampling the inner ∼2000 km, Luk’yanyk et al. [48] reported fast and significant color variations between 2017 January and April, with the color slope S changing from blue [ S ( 10.15 ± 3.43 ) % ( 0.1   μ m ) 1 ] to distinctly red [ S ( 16.48 ± 4.27 ) % ( 0.1   μ m ) 1 ] within a single day. Their modeling with agglomerated debris particles indicates a mixture of at least two dust components (Mg-rich silicates and organics or Mg–Fe silicates) in the inner coma. Our B V measurements, obtained with larger apertures and sparser temporal sampling, are therefore likely to average over such rapid, small-scale color changes. The nearly time-invariant, slightly red B V distribution that we derive for 41P should thus be interpreted as a global, large-aperture property of the coma, and does not exclude the presence of pronounced short-term color variability in the innermost regions.
Further support for a globally red dust coma in 41P comes from quasi-simultaneous photometric, spectroscopic, and polarimetric observations obtained before the 2017 perihelion passage with the 6 m BTA telescope [49]. Using SDSS g and r filters and a medium-band continuum filter, these authors derived an Af ρ of order 50 cm in the red domain and reported a typical red color from the measured g r index. Their long-slit spectra show strong gas-emission bands (CN, C2, C3, NH2) superposed on the dust continuum, yet the color slope inferred from spectroscopy is in good agreement with that derived from broadband photometry, indicating that the global color is a robust tracer of the dust component. In addition, their polarization map does not reveal dramatic variations of the linear polarization with cometocentric distance, suggesting a relatively steady coma at that epoch. Taken together with our B V statistics and with the fast inner-coma color changes reported by Luk’yanyk et al. [48], these results reinforce the view that 41P exhibits a moderately active, slightly red dust coma whose detailed color may vary on short timescales in the innermost regions, while remaining globally stable when averaged over larger apertures and over the heliocentric range sampled here.

3.13. 63P/Wild 1 (2013)

The V magnitudes and V R color indices analyzed here were extracted from Tables 1 and 2 in Betzler et al. [11]. These observations were obtained between 19 March 2013 (UT 0.461) and 12 June (UT 0.181), corresponding to a heliocentric distance range from 1.960 to 2.045 au, and cover both the pre- and post-perihelion parts of the orbit (with perihelion at T p = 10 April 2013 0.538 and q = 1.96088 au). The B V color indices corresponding to these epochs are not listed in those tables; instead, we computed them from the original, previously unpublished reductions.
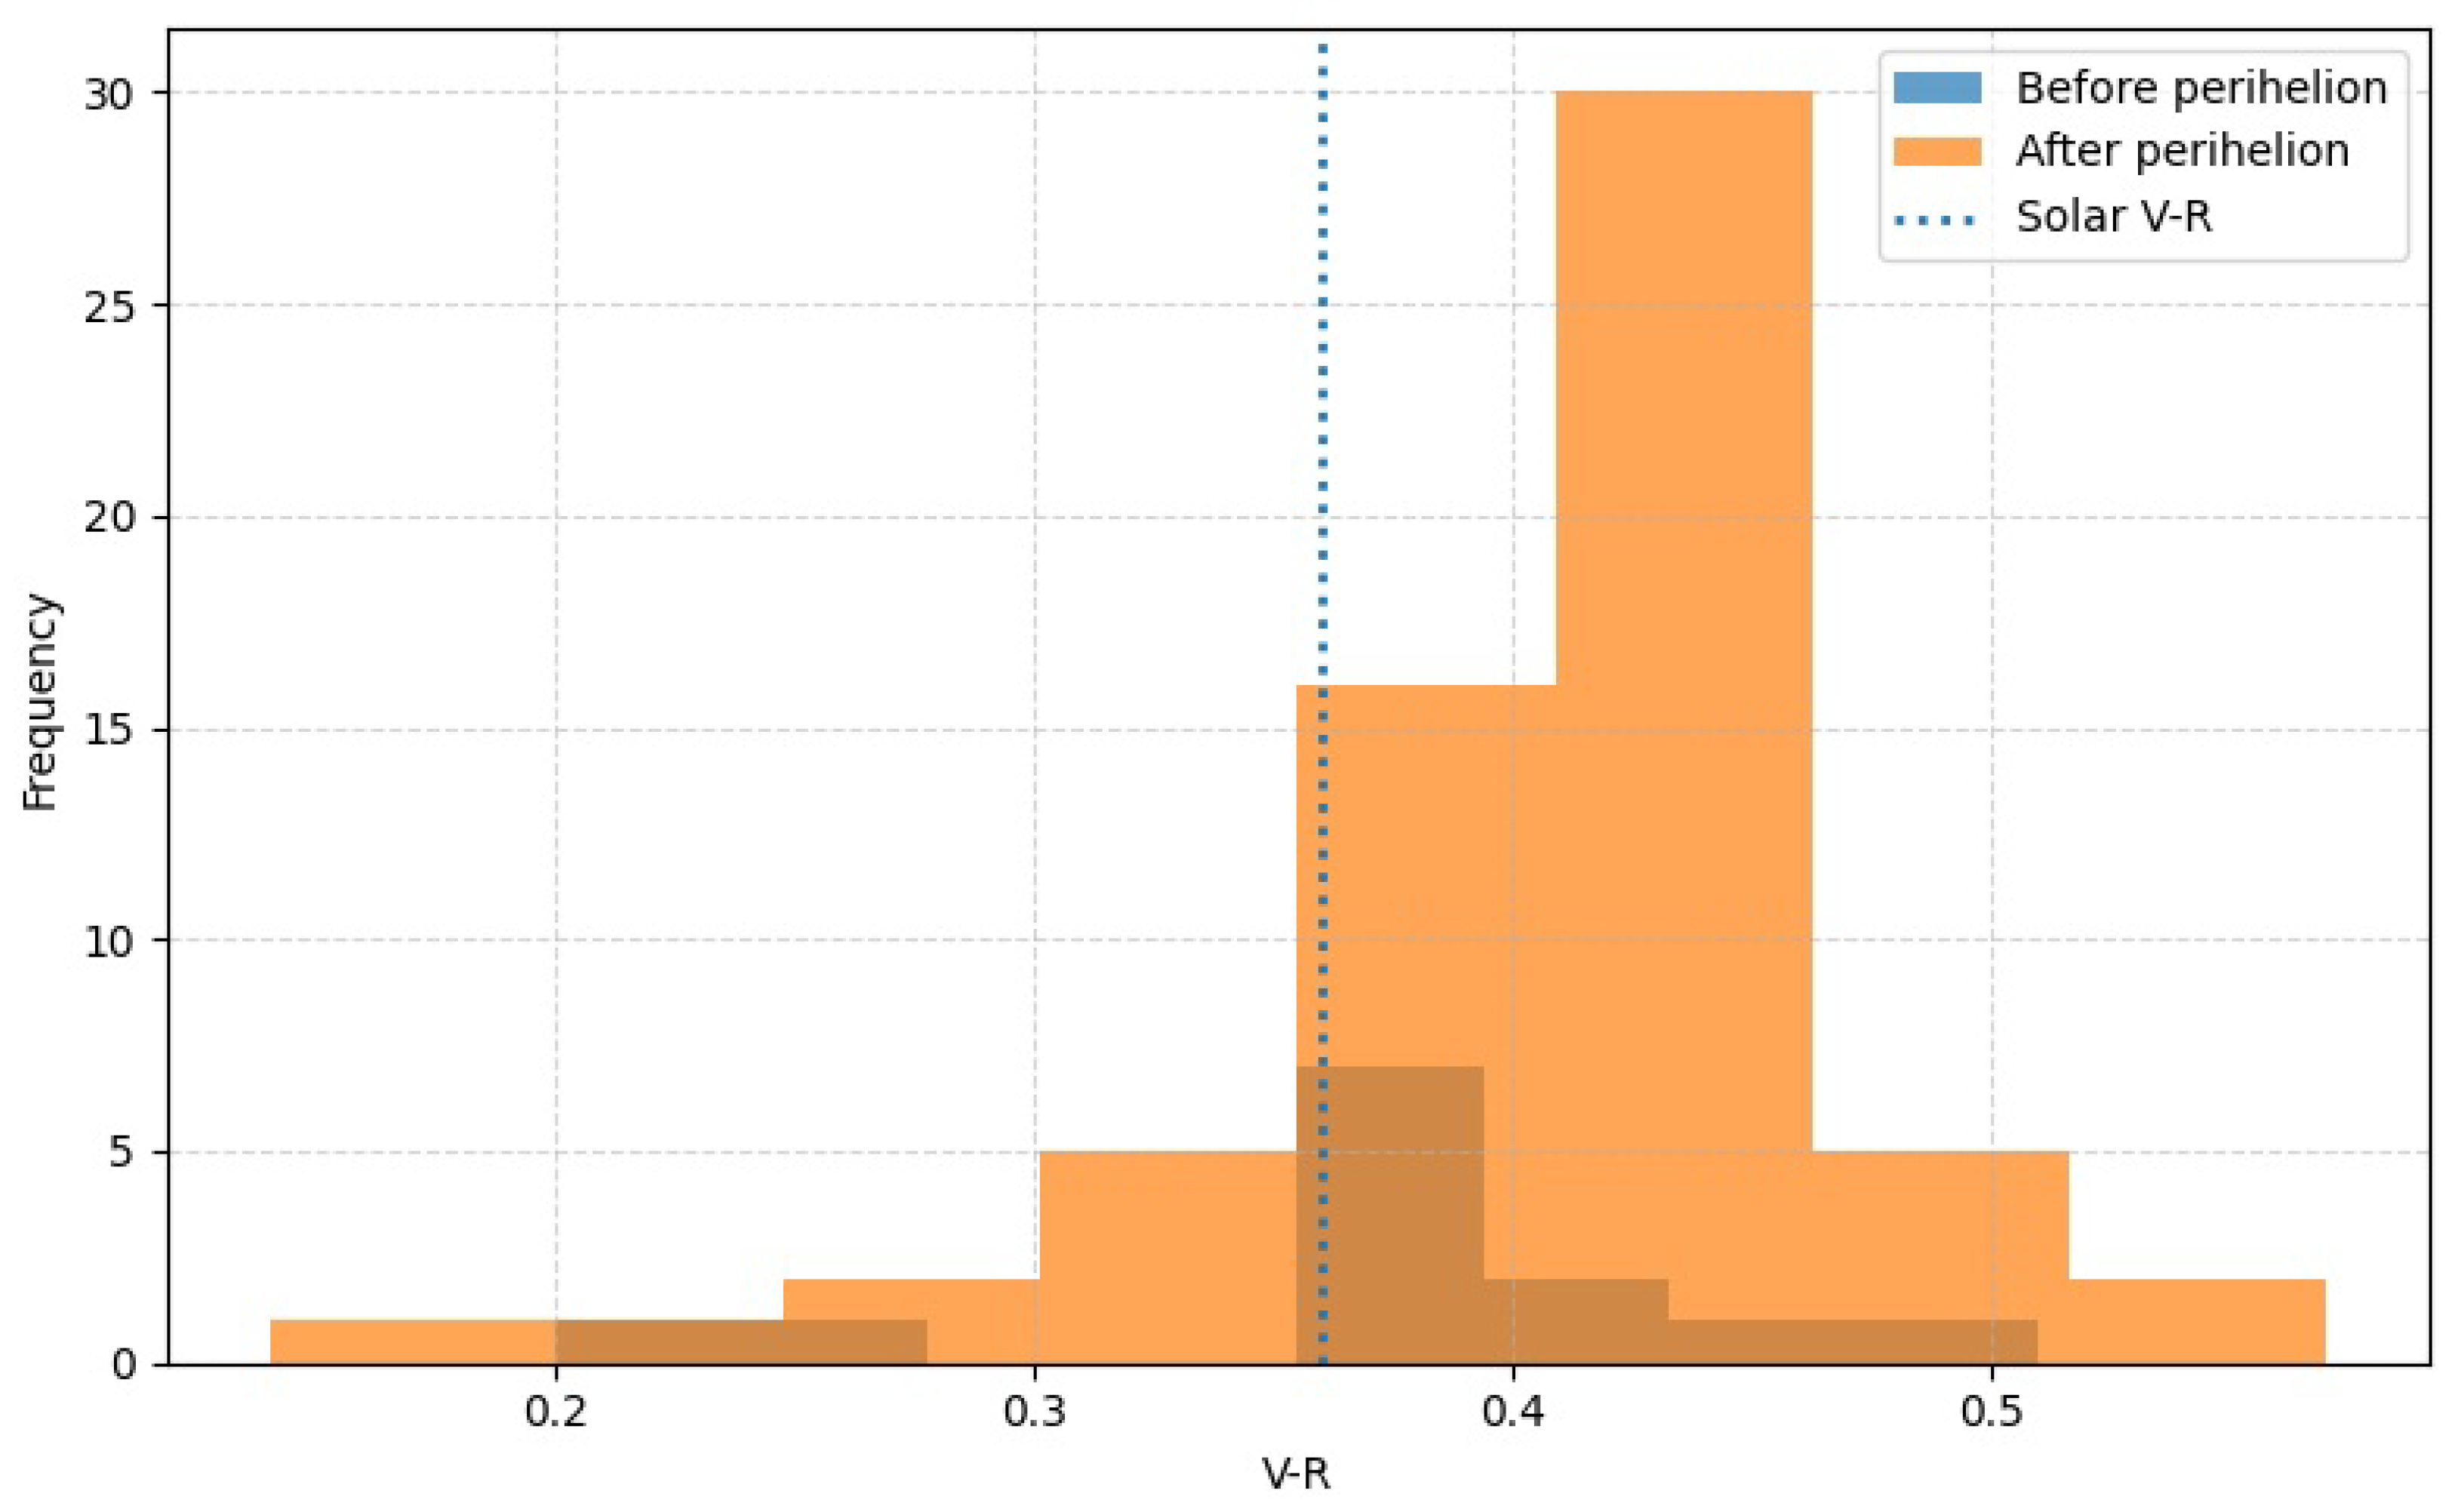
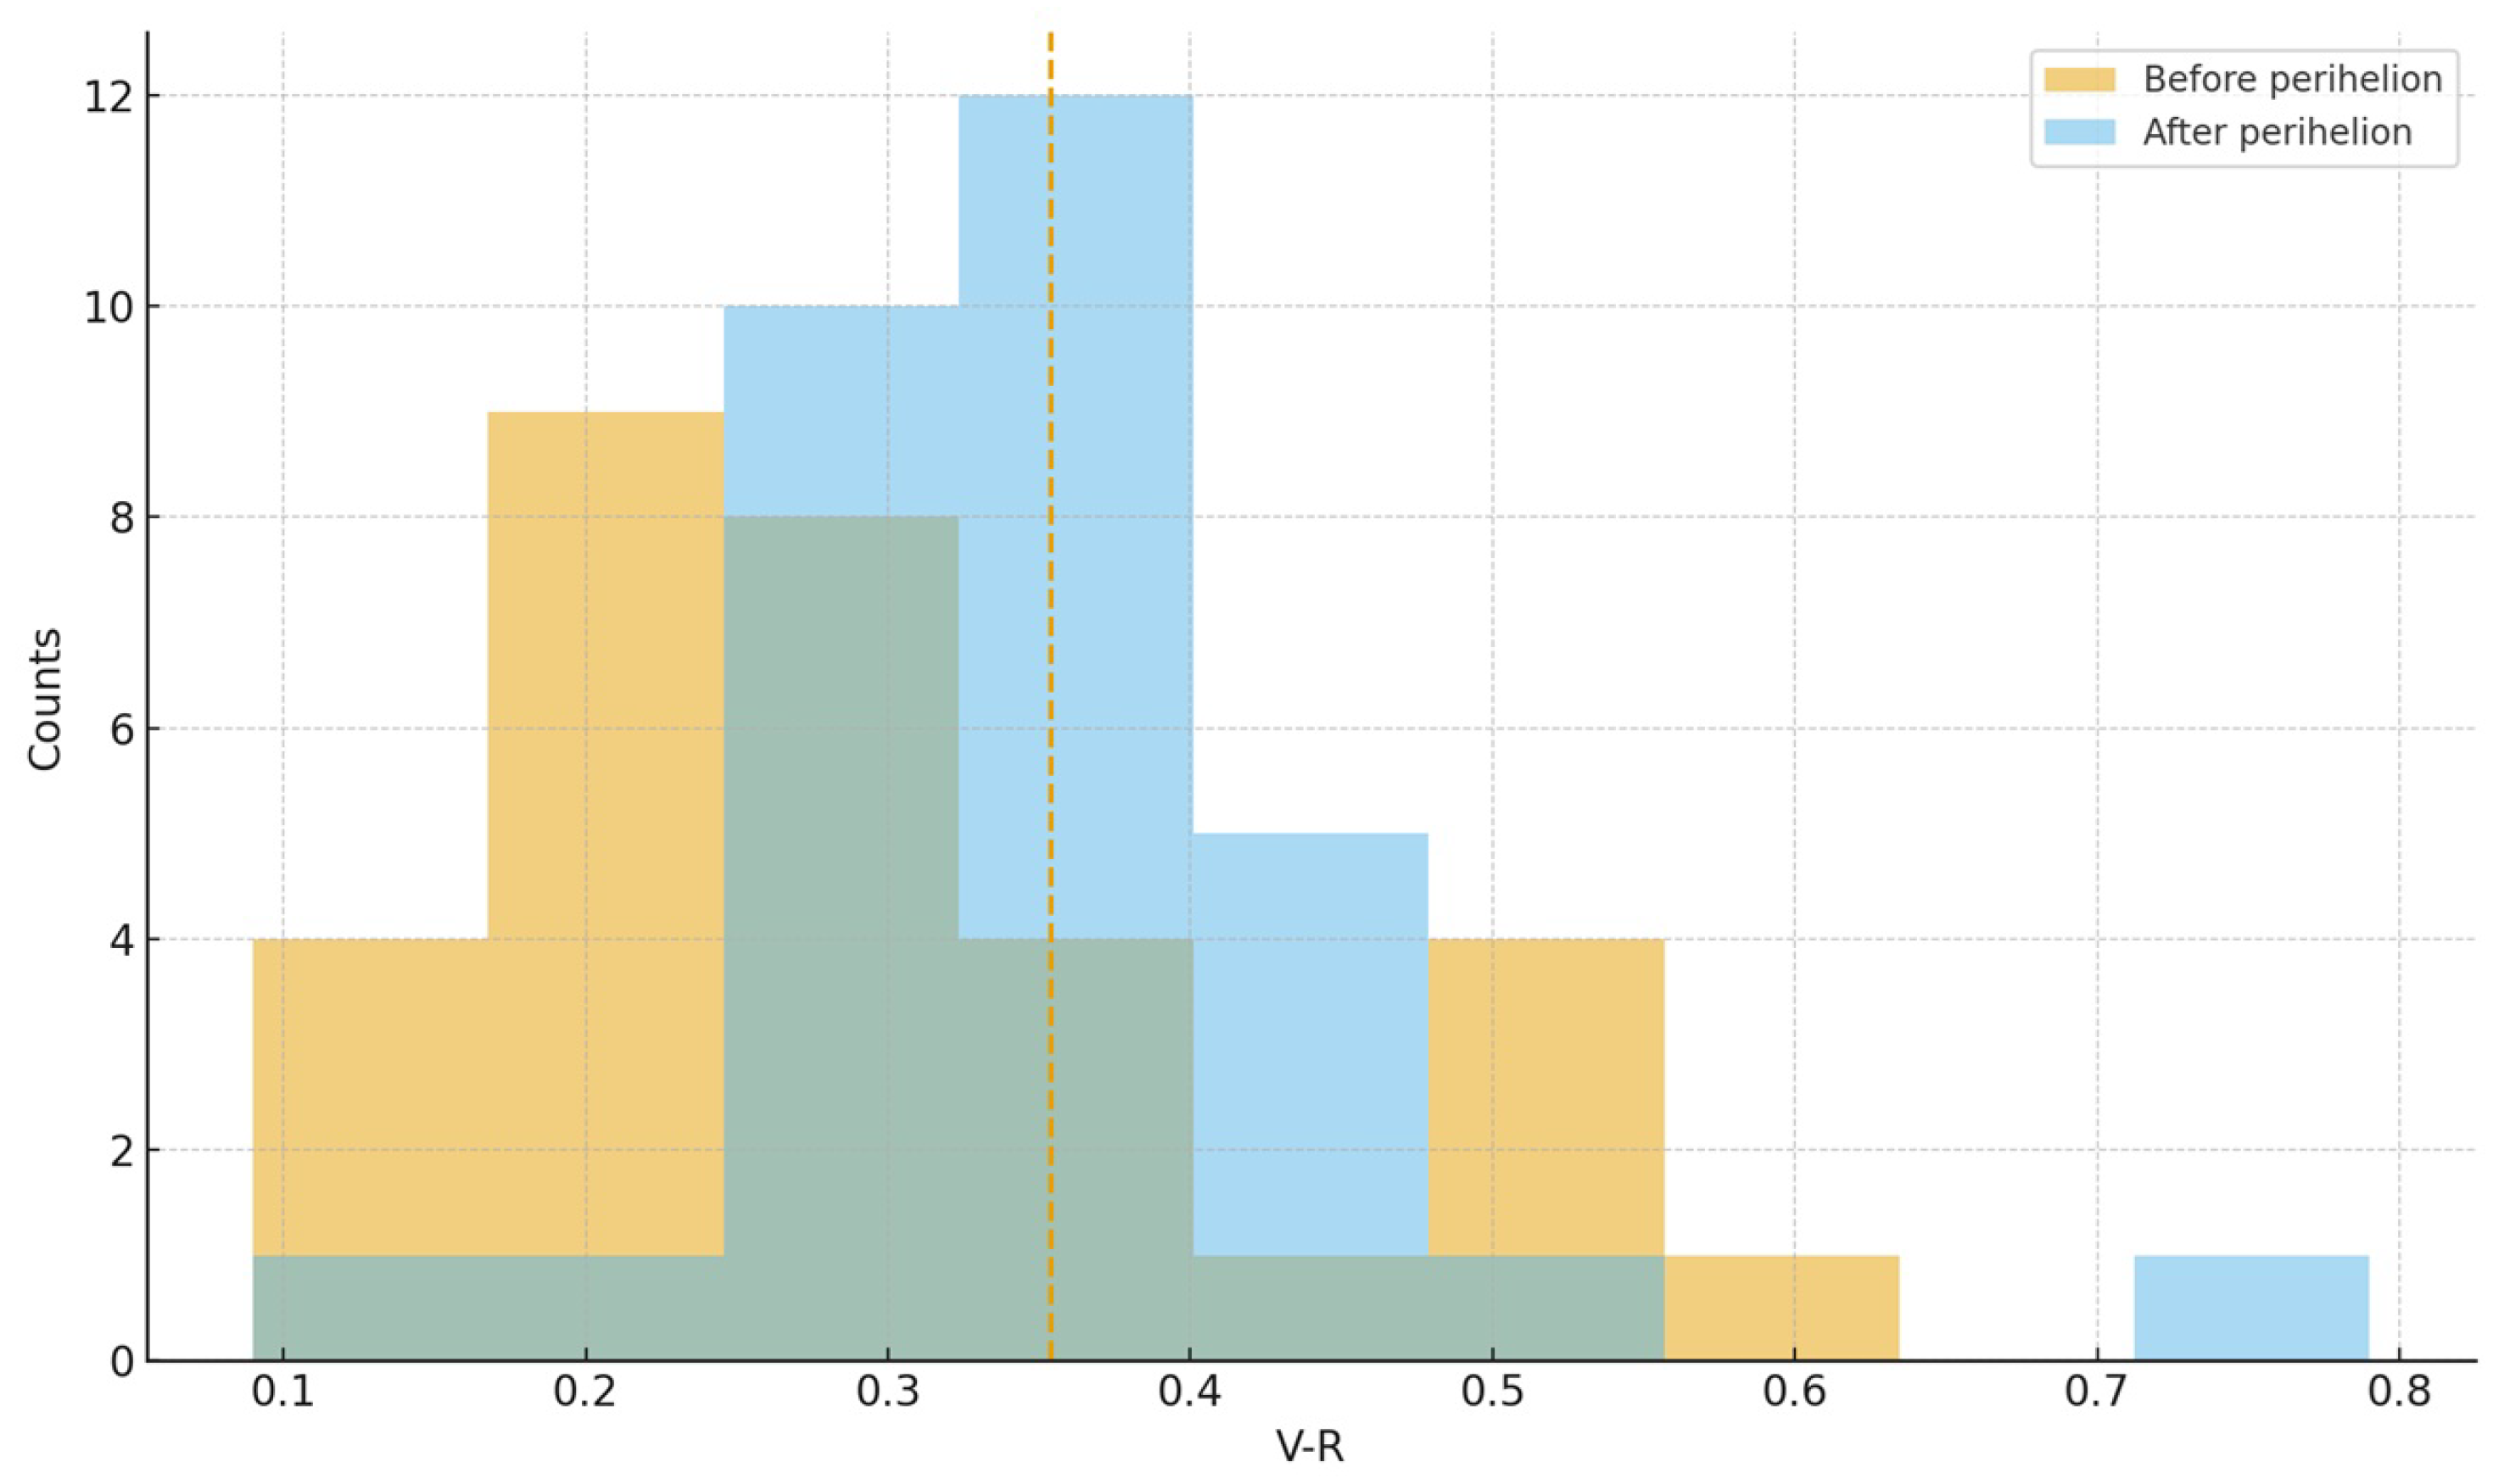
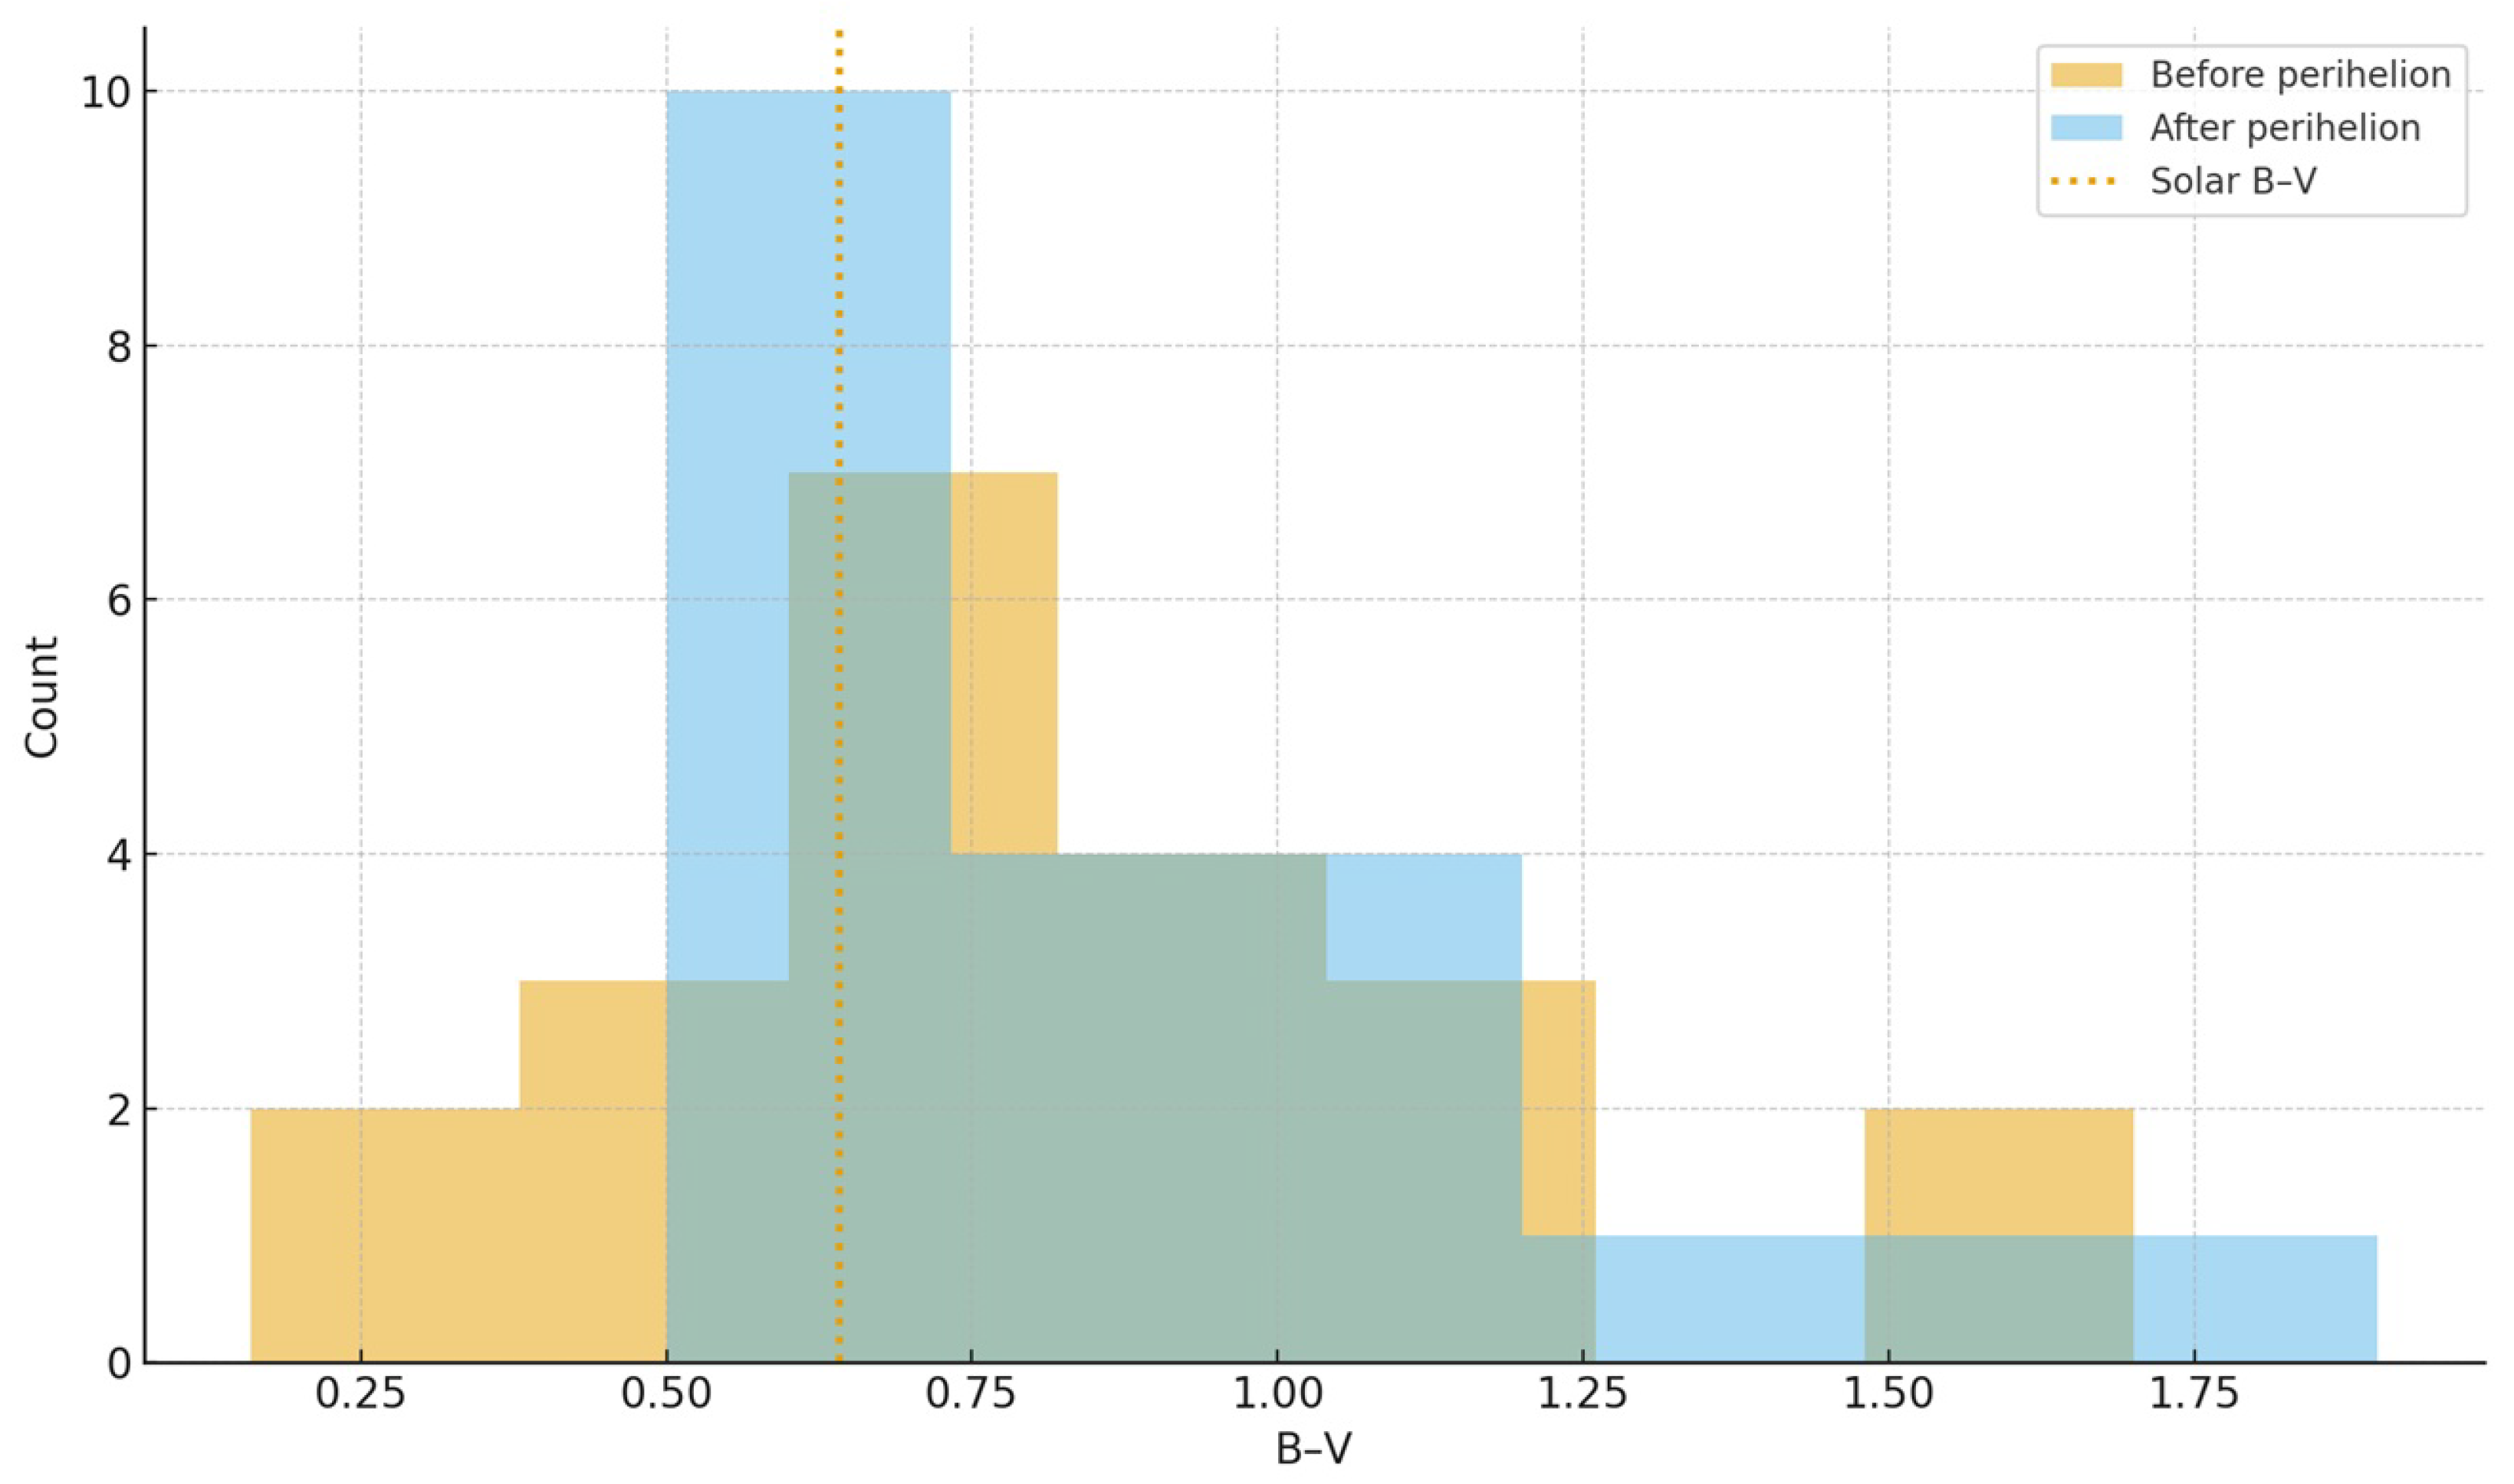
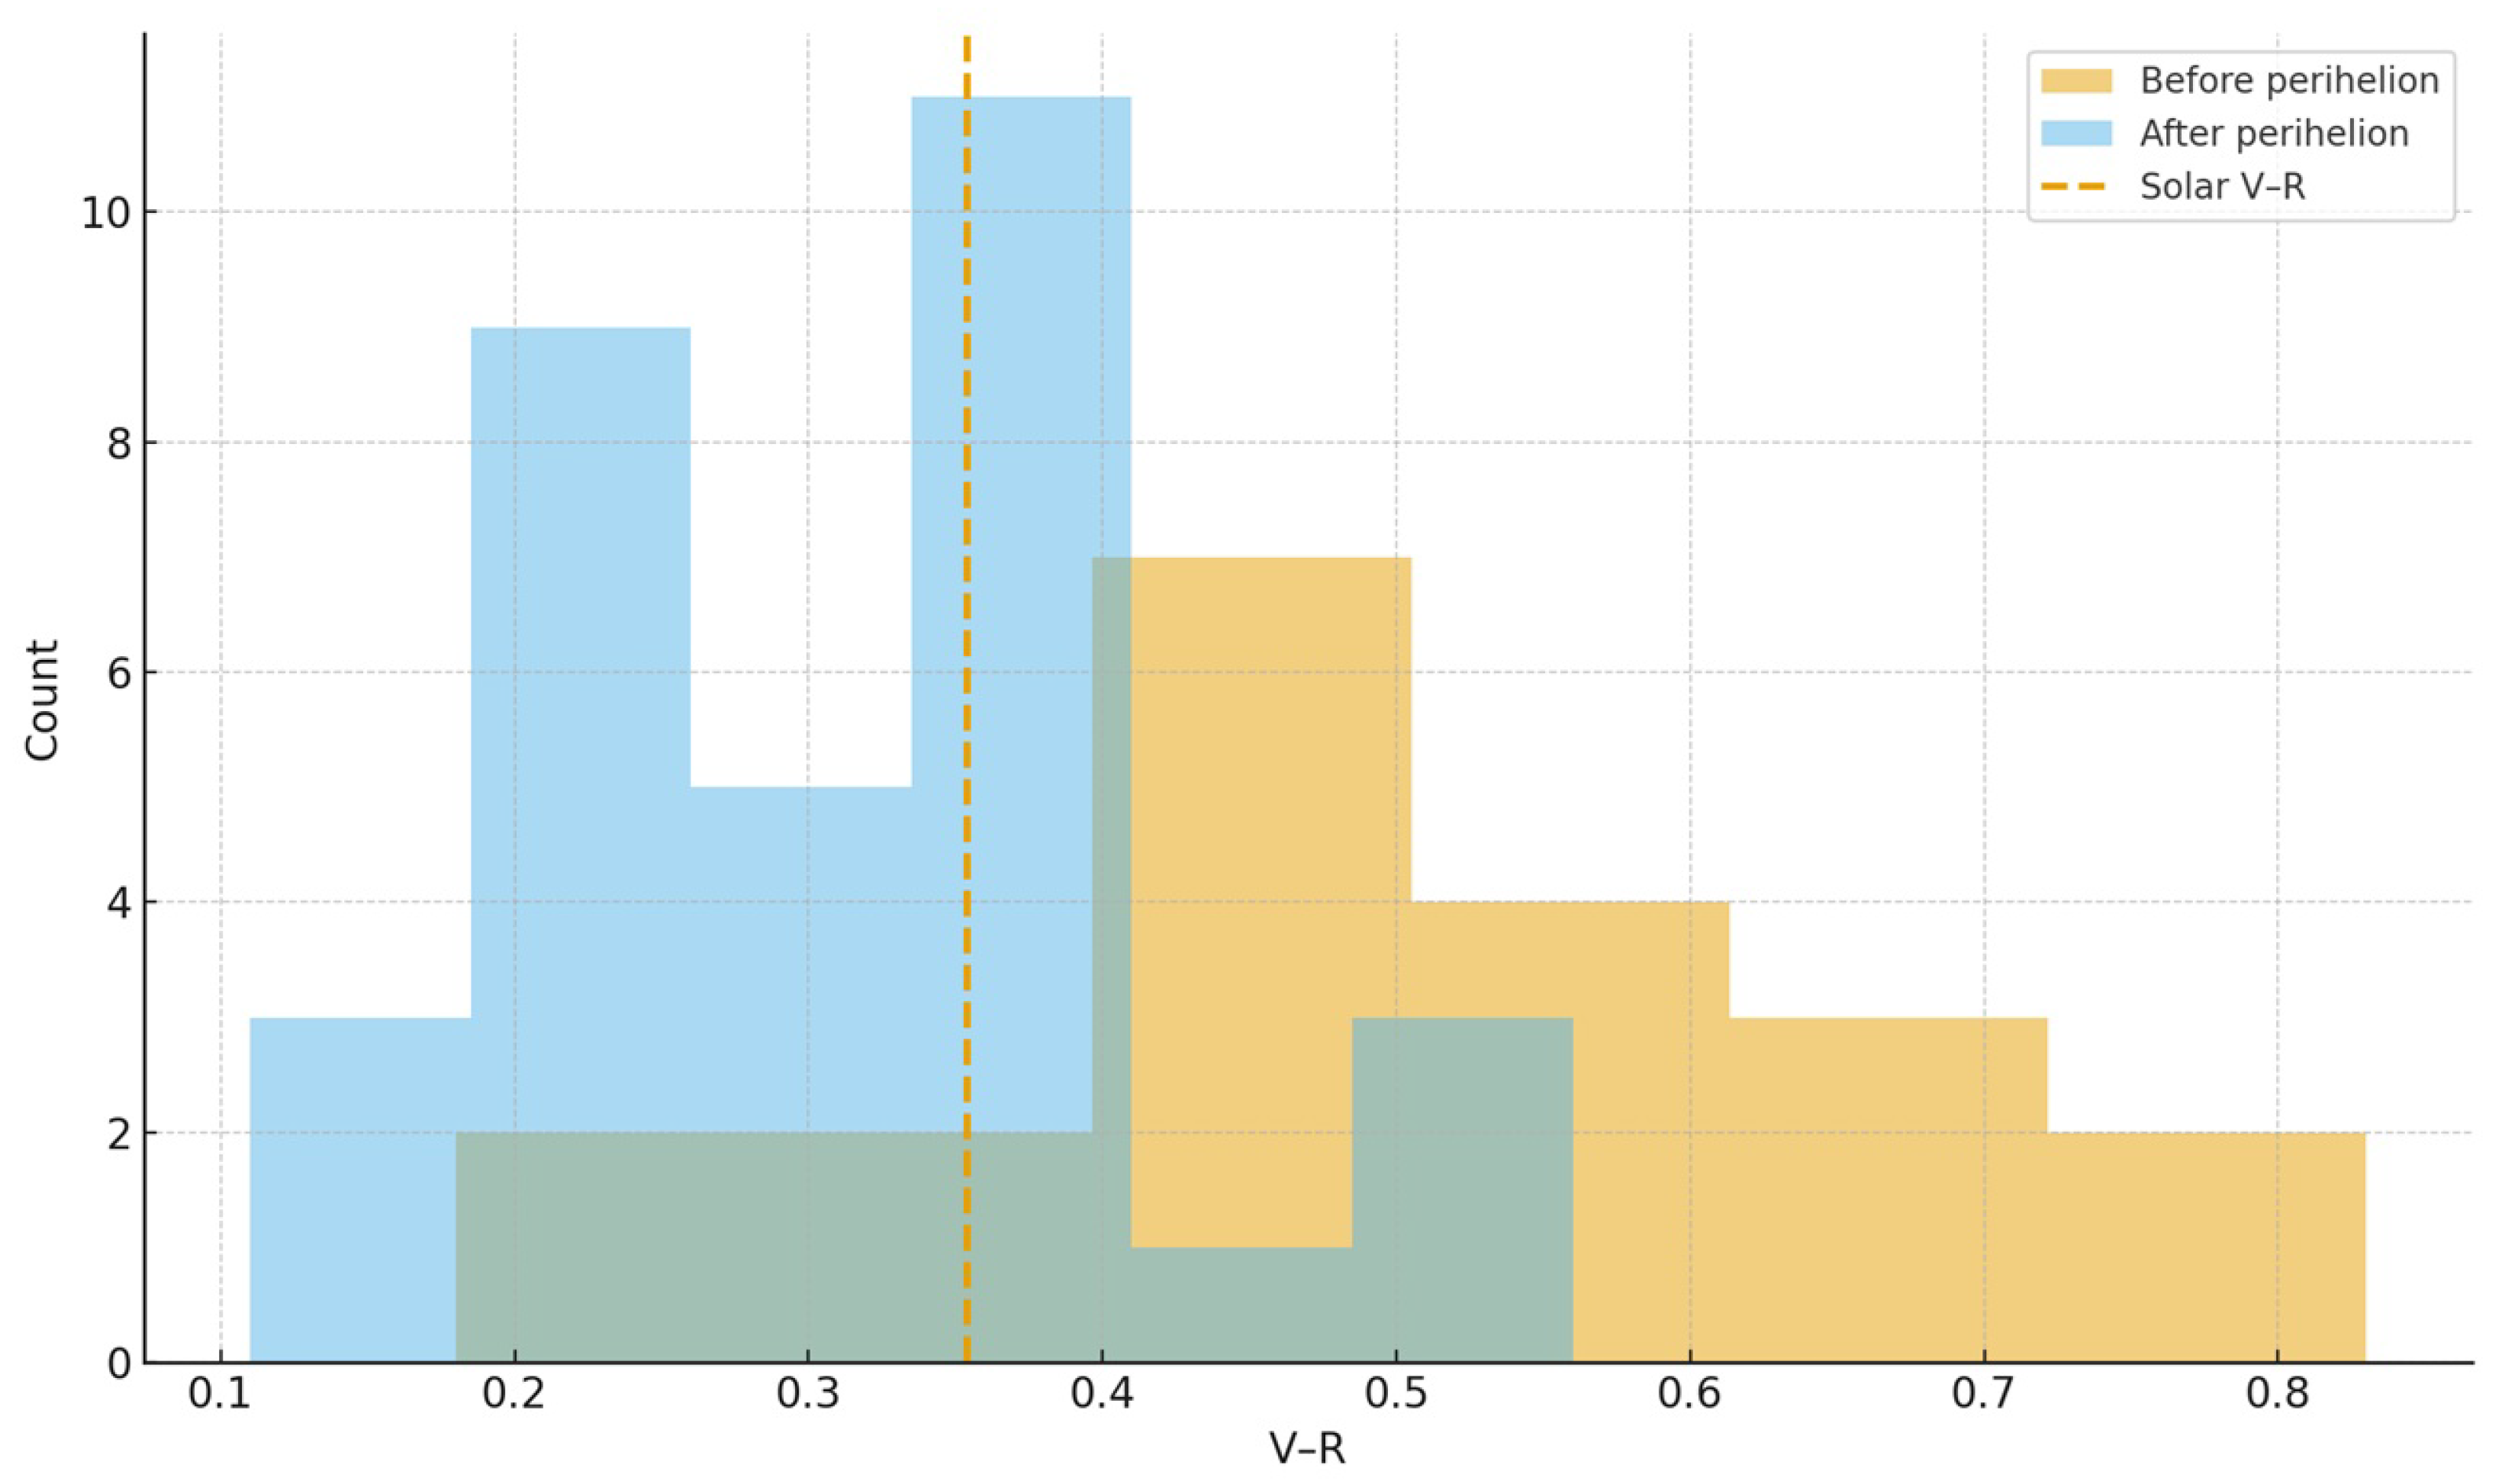
The color distribution of 63P was examined by separating the dataset into two subsets corresponding to epochs before and after perihelion (Figure A21 and Figure A22). For each phase, we analyzed the behavior of the broadband colors B V and V R as a function of heliocentric distance r and compared them with the solar reference colors ( B V ) = 0.642 ± 0.016 and ( V R ) = 0.354 ± 0.010 .
For B V , the comet is consistently redder than the Sun in both phases. Before perihelion, the median color is B V = 0.70 with MAD = 0.20 ( n = 21 ), while after perihelion the median increases to B V = 0.84 with MAD = 0.24 ( n = 21 ). A Mann–Whitney test comparing the two distributions yields U = 181 and p 0.32 , indicating that the apparent difference in median B V is not statistically significant at conventional levels. Spearman rank tests within each phase detect no significant correlation between B V and r (before perihelion ρ s = 0.22 , p 0.34 ; after perihelion ρ s = + 0.19 , p 0.41 ). Taken together, these results show that the B V color of 63P remains approximately stable with heliocentric distance over the observed range and consistently redder than the solar continuum, with no evidence for a systematic color–distance trend.
The behavior of V R is markedly different. Before perihelion, the distribution is clearly shifted to redder values, with median V R = 0.495 and MAD = 0.105 ( n = 20 ), well above the solar value, characterizing a dust-dominated, reddened coma. After perihelion, the distribution becomes significantly bluer, with median V R = 0.325 and MAD = 0.08 ( n = 32 ), clustered around or slightly below the solar color. The Mann–Whitney test confirms that this shift is highly significant ( U = 530.5 , p 7.7 × 10 5 ), demonstrating a genuine change in the V R color regime between the two phases. However, as in B V , Spearman tests within each phase show no significant monotonic dependence of V R on r (before perihelion ρ s = + 0.23 , p 0.32 ; after perihelion ρ s = + 0.17 , p 0.36 ). The overplotted histograms of V R before and after perihelion, with the solar V R indicated, visualize this pattern as two approximately flat (in r) but offset regimes: a pre-perihelion population systematically redder than the Sun and a post-perihelion population close to or slightly bluer than solar.
In combination, the rank-correlation and two-sample tests indicate that the color evolution of 63P is not governed by a smooth heliocentric gradient. Instead, the data support a step-like transition in V R around perihelion, while B V remains consistently red. This pattern is consistent with a change in the relative contributions of dust and gas (or in dust properties) between the pre- and post-perihelion activity regimes, rather than with gradual color changes driven solely by varying heliocentric distance.
Our pre-perihelion median V R color, 0.495 with MAD = 0.105 , is in excellent agreement with the HST measurement ( V R ) = 0.50 ± 0.05 obtained for 63P at r h = 2.27 au outbound [50], which also yielded ( R I ) = 0.42 ± 0.04 and a faint, canonical coma. This independent data point confirms that 63P can exhibit a dust-dominated, reddened continuum at certain phases of its activity cycle. However, the single HST epoch does not constrain the step-like transition in V R that we infer from our multi-epoch 2013 observations; instead, it samples the red regime, whereas our post-perihelion 2013 colors cluster near the solar value.

3.14. 168P/Hergenrother (2012)

We analyzed the post-outburst optical behavior of comet 168P using CCD photometry obtained between 6 October 2012 0.00 and 4 November 2012 0.34, i.e., several days after perihelion (1 October 2012) and following the major outburst and subsequent fragmentation episode [51]. The measurements are listed in Table A13 and Table A14.
The color distributions are characterized by robust statistics. For all measurements with valid indices, we obtain median values of B V = 0.83 with MAD = 0.06 ( n = 57 ) and V R = 0.49 with MAD = 0.03 ( n = 53 ). Adopting solar colors B V = 0.642 ± 0.016 and V R = 0.354 ± 0.010 , the Sun lies in the extreme blue tail of both distributions, below the first quartile for B V and V R . Thus, throughout the monitored interval, the coma is systematically redder than the Sun in both colors, consistent with a dust-dominated spectrum (Figure A23).
We tested for color evolution as a function of heliocentric distance using Spearman’s rank correlation. For B V versus r, we obtain ρ = 0.12 with p 0.39 ( n = 57 ); for V R versus r, we obtain ρ = 0.20 with p 0.14 ( n = 53 ). In both cases, the correlations are statistically insignificant, indicating that within the narrow heliocentric range sampled the observed reddening is essentially constant.
We fit geocentric magnitudes with weighted least squares, adopting m geo = a + b log 10 r and weights w = 1 / σ m 2 (Figure A24). Best-fit parameters are B geo ( n = 55 ): a = 3.86 ± 2.52 , b = 115.52 ± 16.48 ; V geo ( n = 56 ): a = 4.68 ± 2.07 , b = 115.18 ± 13.52 ; R geo ( n = 52 ): a = 5.04 ± 2.10 , b = 114.58 ± 13.70 . The slopes are mutually consistent across bands. The corresponding effective heliocentric exponents n = b / 2.5 are very large ( n 45 ), far above canonical steady-state values, reflecting rapid post-outburst fading over a small range in r.
From the intercepts, we obtain “absolute” colors ( B V ) abs = a B a V = 0.82 ± 3.26 and ( V R ) abs = a V a R = 0.36 ± 2.95 , which add no constraint beyond consistency with the measured medians. Heliocentric color gradients are Δ n B V = ( b B b V ) / 2.5 = 0.14 ± 8.53 and Δ n V R = ( b V b R ) / 2.5 = 0.24 ± 7.70 , both fully consistent with zero, implying an essentially achromatic decline across B, V, and R.
Integral-field spectroscopy including comet 168P indicates strong volatile depletion, with carbon-chain and ammonia-bearing species unusually weak relative to CN [52]. Such depletion minimizes gas contamination in broadband B and V, providing independent support for dust-dominated colors and the nearly color-independent fading inferred above.
Taken together, these results indicate that, during the period starting on 6 October 2012, comet 168P exhibits (i) a coma systematically redder than the Sun, characteristic of a dust-rich environment, and (ii) a rapid but nearly color-independent fading. The post-outburst evolution is thus dominated by a global decrease in scattering cross-section, without measurable changes in the average dust color within the probed heliocentric interval.

4. Conclusions

We have carried out a uniform statistical analysis of color-distance relations for a sample of 14 comets observed over extensive orbital arcs. Using robust estimators (median and MAD), non-parametric correlation tests (Spearman’s rank), and a two-sample test (Mann–Whitney), we find that cometary comae do not exhibit a single universal pattern of chromatic evolution with heliocentric distance. Instead, the sample naturally separates into three broad behavioral classes. A subset of objects displays statistically significant color gradients with r in at least one color index, typically in the blue sensitive bands, consistent with a gradual evolution in the balance between gas emission and dust continuum along the orbit. At the other extreme, several comets show colors that are systematically redder than the Sun but statistically consistent with being constant, both with heliocentric distance and across perihelion, within the uncertainties of the available data. Between these two extremes, we identify a third class of “step comets”, in which the dominant chromatic signature is a discrete change of the color level between pre- and post-perihelion, rather than a smooth monotonic trend with r.
Table 2 provides a compact summary of the main results for all 14 comets, including the assigned behavioral class (I–III) and which color indices exhibit statistically significant gradients with r, step-like pre-/post-level shifts, or flat behavior within uncertainties. Within this framework, the 14 comets in our sample can be organized as follows. The “gradient comets” (Class I) are C/1969 Y1 (Bennett), C/2012 K1 (PANSTARRS), 4P/Faye, 1P/Halley, and C/2010 S1 (LINEAR). In Bennett, the statistically significant color gradient is confined to the ultraviolet-sensitive U B index, while B V remains effectively flat with r, showing that the chromatic evolution is strongly concentrated in the shortest wavelengths. In C/2012 K1, a weak but significant positive correlation of B V with r, supported by a clearly non-zero differential index Δ n ( B V ) , indicates a genuine, albeit modest, reddening in the blue color, whereas V R is consistent with being constant. Faye exhibits a marginally significant pre perihelion gradient in B V that disappears after perihelion, illustrating a branch-limited color evolution on top of a persistently red dust continuum. Halley shows one of the clearest examples of radial color evolution: V R reddens with increasing r both before and after perihelion, with strong Spearman correlations, while B V undergoes a statistically significant level shift across perihelion. Finally, C/2010 S1 is a hybrid case in which post perihelion data reveal strong negative correlations of both B V and V R with r, combined with a measurable change in median color across perihelion; in this comet, the chromatic evolution is dominated by a post perihelion blueing toward smaller r, most pronounced in B V .
The “step comets” (Class II) comprise 63P/Wild 1, C/2013 R1 (Lovejoy), and C/2020 V2 (ZTF). In 63P, both B V and V R show no significant Spearman correlation with r within each orbital branch, yet the V R distributions before and after perihelion differ at high significance, with a dust reddened pre-perihelion regime and a post-perihelion regime clustered around solar colors. C/2013 R1 shows a similar pattern in the red color: the Spearman tests do not reveal robust monotonic trends, but the Mann–Whitney test indicates a statistically significant shift in V R across perihelion, whereas B V remains broadly stable within uncertainties. C/2020 V2 (ZTF) provides the clearest case of a step isolated in the red near-infrared: B V and V R are nearly constant and uncorrelated with r on both sides of perihelion, while R I becomes significantly redder after perihelion, with the Mann–Whitney test showing a highly significant level shift and no evidence for a smooth gradient within each branch. In all these objects, the statistical tests show that the primary effect is a change in the overall color level between orbital regimes, rather than a continuous color gradient with heliocentric distance within each branch.
The remaining objects fall into the “flat comets” (Class III): C/2012 S1 (ISON), C/2014 S2, C/2012 J1 (Catalina), C/2011 L4 (PANSTARRS), 168P/Hergenrother, and 41P/Tuttle-Giacobini-Kresák. In ISON, the studied color ( V R ) shows no significant correlation with r, and the regression slopes are poorly constrained, so the data are consistent with a single, essentially constant color regime. C/2014 S2 and C/2011 L4 are post-perihelion samples with stable, clearly redder-than-solar B V and V R colors, non-significant Spearman coefficients, and differential indices Δ n consistent with zero, indicating dust-dominated comae with no detectable color gradients over the sampled radial range. C/2012 J1 shows moderately red B R but nearly solar V R , and neither color exhibits a significant rank correlation with r; attempts to derive absolute colors and Δ n from geocentric magnitude fits are dominated by extrapolation errors due to the very short baseline in r, so the robust conclusion is that both indices are effectively constant within the uncertainties. For 168P, observed in the weeks following a strong outburst and fragmentation episode, the colors are again systematically redder than solar and stable with r; the heliocentric exponents derived from light-curve fits are very large but nearly identical across B, V, and R, yielding Δ n values indistinguishable from zero and pointing to a rapid, almost achromatic fading. In 41P, both pre- and post-perihelion B V distributions have nearly identical medians, the Mann–Whitney test finds no significant pre-/post-perihelion difference, and Spearman/Kendall tests indicate at most a marginal pre-perihelion trend, with regression slopes whose confidence intervals include zero; the comet is slightly redder than the Sun at all sampled distances, but with no statistically robust color evolution.
An important outcome of this work is that slope-based diagnostics, such as absolute colors and differential color indices, help to confirm or refute color gradients suggested by non-parametric tests. Absolute colors derived from the intercepts of the geocentric magnitude laws m geo = a + b log 10 r (for example, ( B V ) 0 = a B a V and ( V R ) 0 = a V a R ) provide a check on whether the activity corrected colors remain redder than solar and are consistent with the distribution medians. In flat comets such as C/2014 S2, C/2011 L4, and 168P, the absolute colors agree with the observed medians and reinforce the conclusion that the coma is redder than the Sun but does not evolve significantly with r. Differential heliocentric indices Δ n = ( b 1 b 2 ) / 2.5 translate slope differences into color exponents and are particularly useful to distinguish true gradients from statistical noise. In gradient comets like C/2012 K1 and Bennett, the relevant Δ n values are significantly non-zero in the indices where Spearman finds a correlation (for example, Δ n ( B V ) for K1 and Δ n ( U B ) for Bennett), whereas in flat comets they are consistent with zero, and in step comets they remain small within each branch, reflecting the fact that the main chromatic signal is a level change across perihelion rather than a continuous slope.
These three empirical behaviors are not interpreted as random scatter, but as distinct observational signatures that plausibly map onto different coma-physics regimes. In the “gradient” class, statistically significant trends are most often detected in blue-sensitive indices, consistent with a varying gas-to-dust contribution along the orbit (including the possibility of broadband contamination by gas emissions) and/or changes in the short-wavelength dust component. In “flat” comets, colors remain persistently redder than solar and statistically consistent with being constant over the sampled heliocentric-distance range, which is compatible with dust-dominated comae whose effective scattering properties do not measurably evolve at our precision. In “step” comets, the dominant signal is a discrete color-level shift between pre- and post-perihelion branches with little or no monotonic trend within each branch, suggesting a perihelion-triggered change in the dominant dust population (e.g., size distribution, porosity, or composition) and/or episodic activity that reorganizes the coma.
We stress that broadband colors alone cannot uniquely determine parameters such as nucleus size or evolutionary state (“pristine” versus “old”), and any link to dust/gas ratios remains model-dependent without simultaneous spectroscopic constraints. Nevertheless, the three-class scheme provides a compact, statistically defined taxonomy to compare apparitions and to select targets for follow-up. Notably, each class in our sample includes both long- and short-period comets, indicating that dynamical family alone does not determine the observed color–distance behavior and pointing instead to object-specific coma physics and activity state as primary drivers. Future work combining strictly contemporaneous spectroscopy (gas production rates), polarimetry, and phase-function-controlled dust measurements will allow these physically motivated interpretations to be tested quantitatively.
Taken together, these results point to a picture in which broadband colors are reliable tracers of whether a coma is dust-dominated and systematically redder than the Sun, but are not, in general, governed by simple, universal color distance laws. Gradients in the bluer indices can be understood in terms of evolving gas-to-dust ratios or changes in the short wavelength dust contribution, whereas post-perihelion color steps, often most pronounced at longer wavelengths, suggest discrete changes in dust size distribution, porosity, or composition triggered by perihelion heating or episodic activity. The absence of strong, ubiquitous correlations with r, combined with the prevalence of step-like behavior in some objects and flat behavior in others, implies that interpreting cometary colors requires multi epoch coverage and a statistical framework that explicitly distinguishes gradients from regime changes, combining rank-based tests with slope based diagnostics such as absolute colors and differential indices. Future work extending this analysis to larger samples and combining broadband colors with simultaneous spectroscopy and polarimetry will be essential to link these empirical classes to specific physical mechanisms in cometary dust and gas.
We examined whether the three behavioral classes show simple associations with dynamical family (LPC/HTC/JFC), perihelion distance q, and the heliocentric-distance coverage of the measurements (Table 1). Within this limited 14-comet sample, no robust one-to-one mapping emerges: each class contains objects from more than one dynamical family and spans a wide range of q and r coverage. The most consistent pattern is wavelength-dependent rather than dynamical: “gradient” behavior is more often detected in blue/UV-sensitive indices, whereas “step” behavior is most evident as pre-/post-perihelion level shifts, frequently in red to near-IR indices. Given the small sample size and heterogeneous observing circumstances, we treat these cross-comet comparisons as qualitative and leave a larger-sample correlation study for future work.
Uniform activity proxies are not available for all objects in a consistent form; therefore, we do not attempt a quantitative activity–class correlation and restrict ourselves to a qualitative gas-versus-dust interpretation of the color behavior.


Author Contributions

Conceptualization, A.S.B.; methodology, A.S.B.; software, O.F.d.S.; data curation, I.d.S.D. and A.B.d.S.; formal analysis, A.S.B.; investigation, A.S.B.; writing—original draft preparation, A.S.B.; writing—review and editing, A.S.B.; visualization, A.S.B.; supervision, A.S.B. All authors have read and agreed to the published version of the manuscript.

Funding

This research received no external funding.

Data Availability Statement

The magnitude and color data analyzed in this study are either available in the cited references or are included in the tables of this manuscript to ensure full reproducibility of our statistical results.

Acknowledgments

The authors would like to thank the Centro de Tecnologia of the Universidade Federal do Recôncavo da Bahia at the Cruz das Almas Campus for providing access to its computer cluster, which was used for the photometric reduction of some of the comet datasets obtained by robotic observatories. The analyses presented in this work were carried out using scientific computing tools in Python, including the libraries NumPy, SciPy, and Matplotlib. The authors thank the open-source community for the development and maintenance of these essential packages. This publication makes use of data products from the Two Micron All Sky Survey, which is a joint project of the University of Massachusetts and the Infrared Processing and Analysis Center/California Institute of Technology, funded by the National Aeronautics and Space Administration and the National Science Foundation. The authors would like to express their sincere gratitude to the three anonymous reviewers for their constructive comments and valuable suggestions, which greatly improved the quality and clarity of this manuscript.

Conflicts of Interest

The authors declare no conflicts of interest.

Appendix A. Individual-Comet Tables and Diagnostic Plots

Appendix A.1. C/1969 Y1 (Bennett)

Figure A1. Relationship between the color indices U B (diamonds) and B V (circles) and the heliocentric distance r of C/1969 Y1 (Bennett) between March and April 1970. Error bars indicate 1 σ photometric uncertainties.
Universe 12 00065 g0a1
Figure A2. Geocentric magnitudes m geo = m 5 log 10 Δ of C/1969 Y1 (Bennett) in the U (triangles), B (squares), and V (circles) bands as a function of log 10 ( r ) , together with the weighted least-squares linear fits (solid lines) used to derive the absolute magnitudes and activity indices.
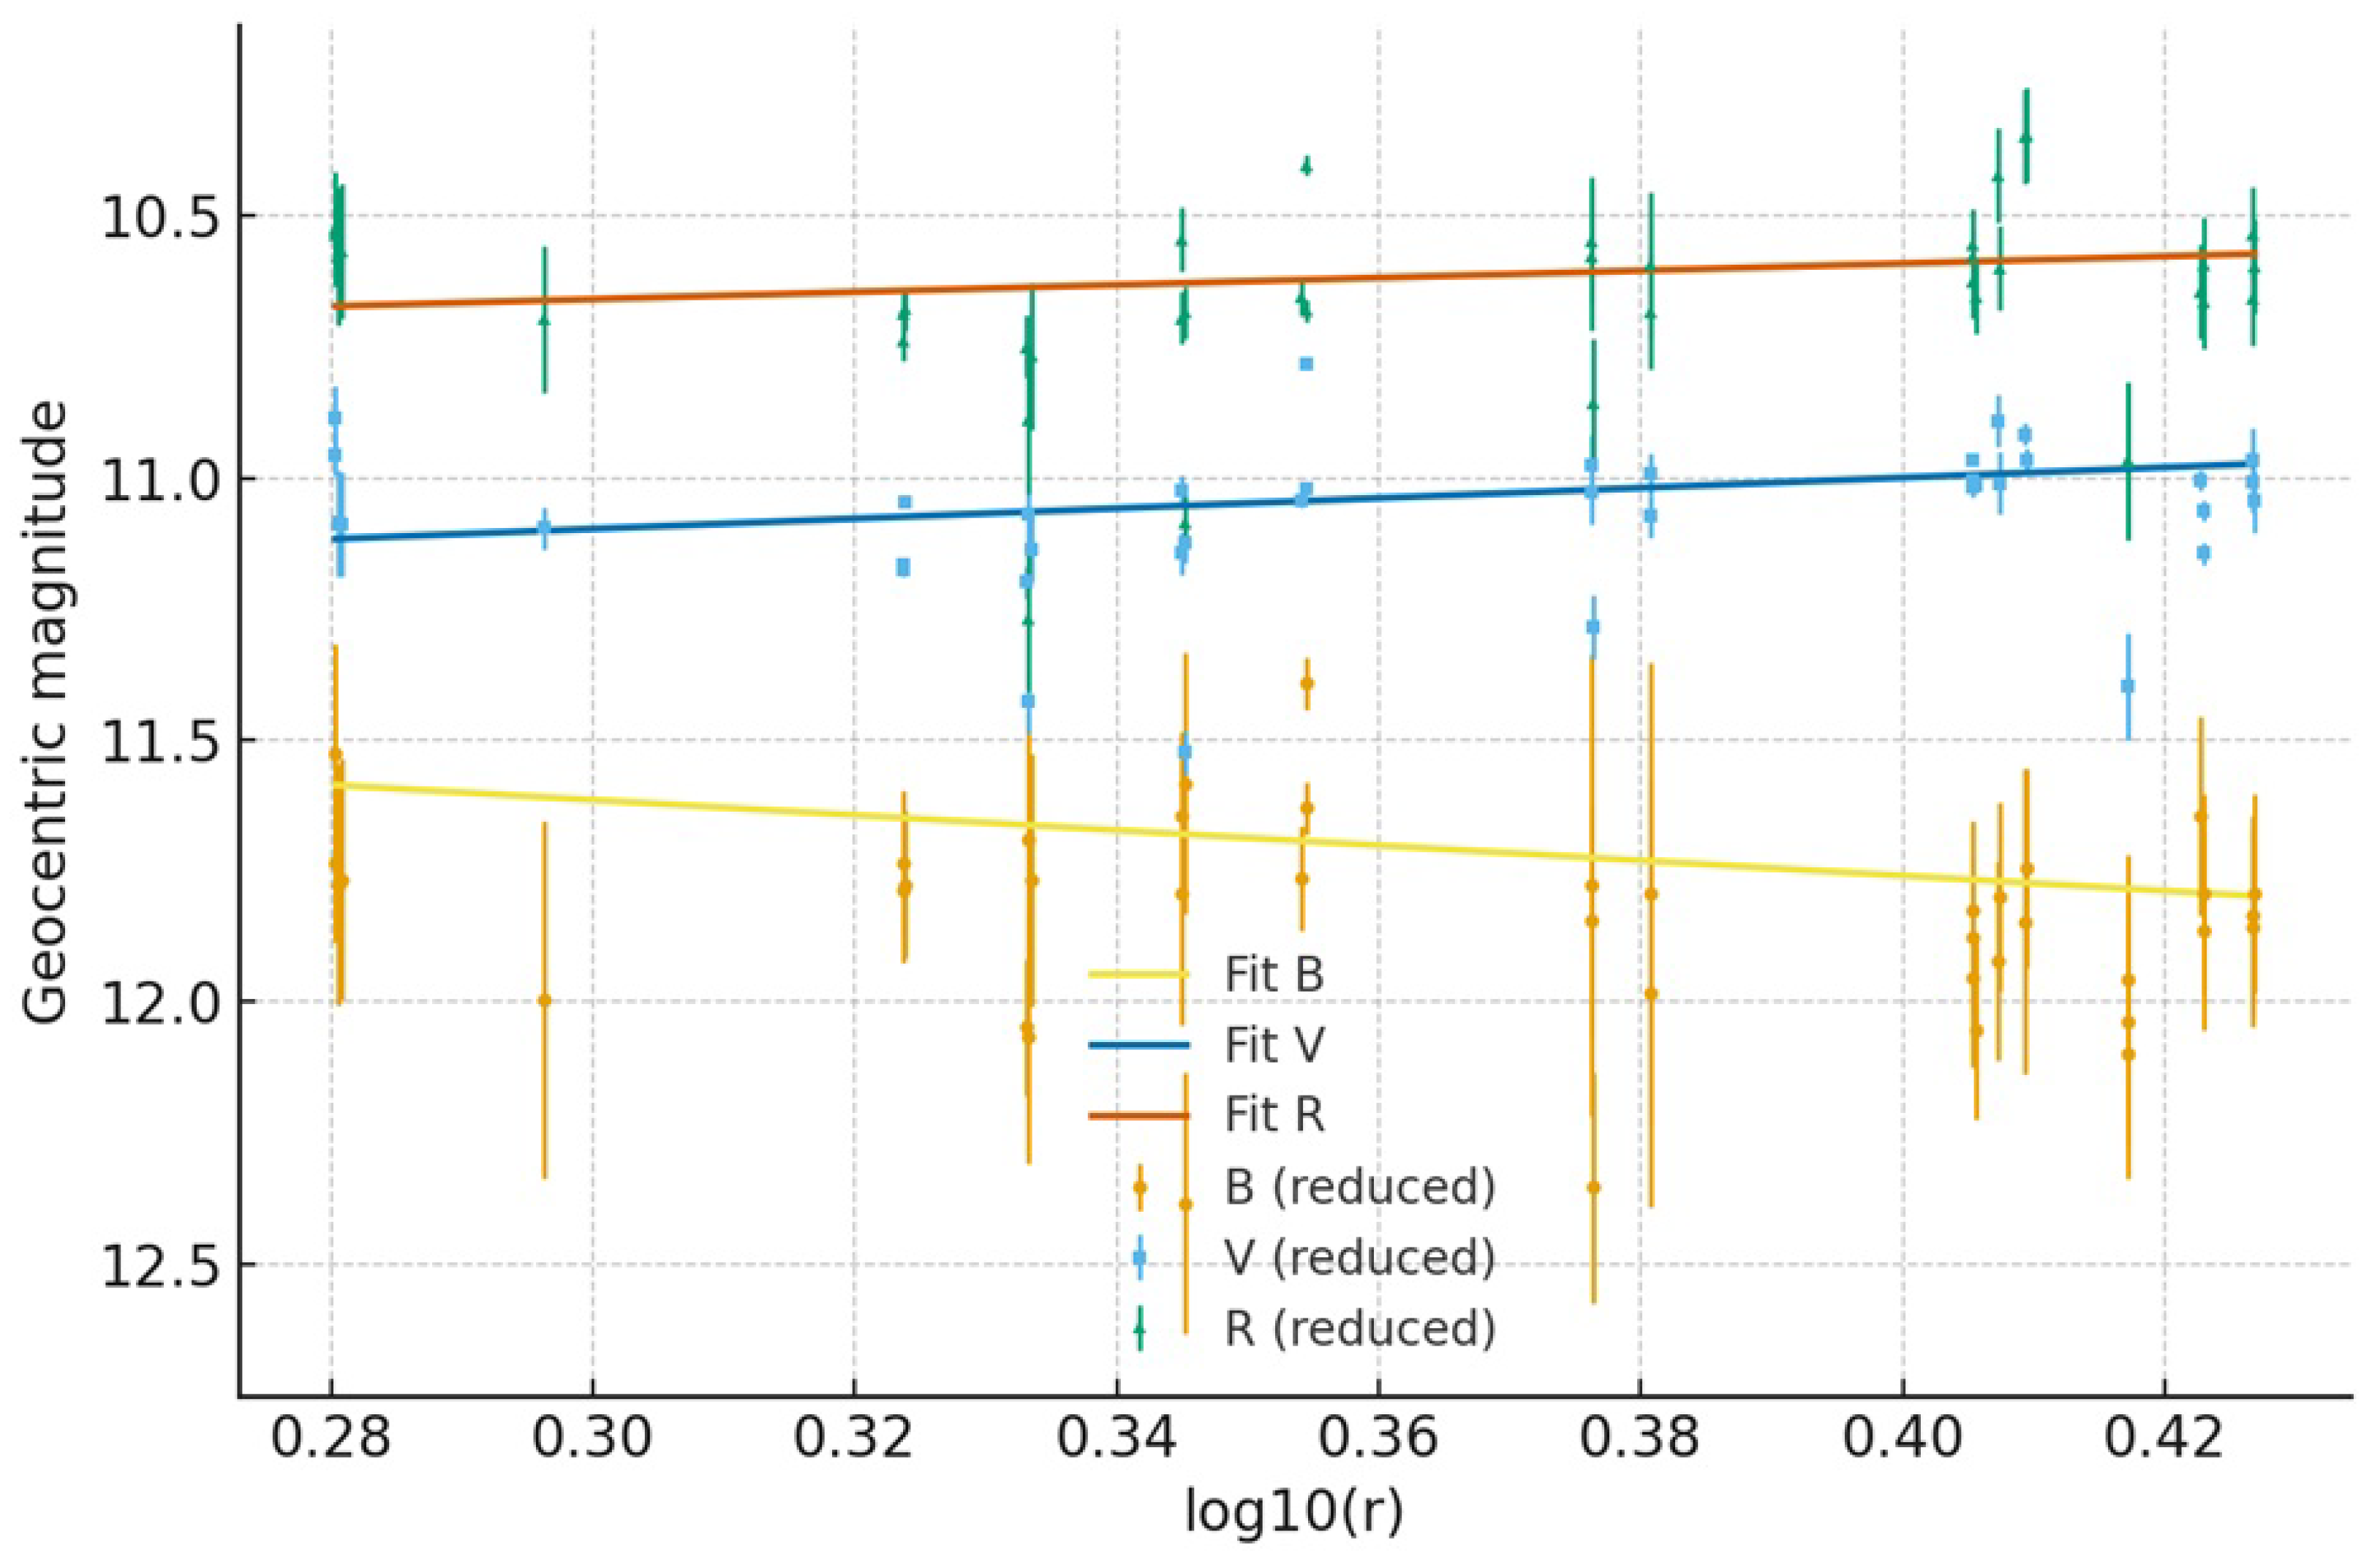
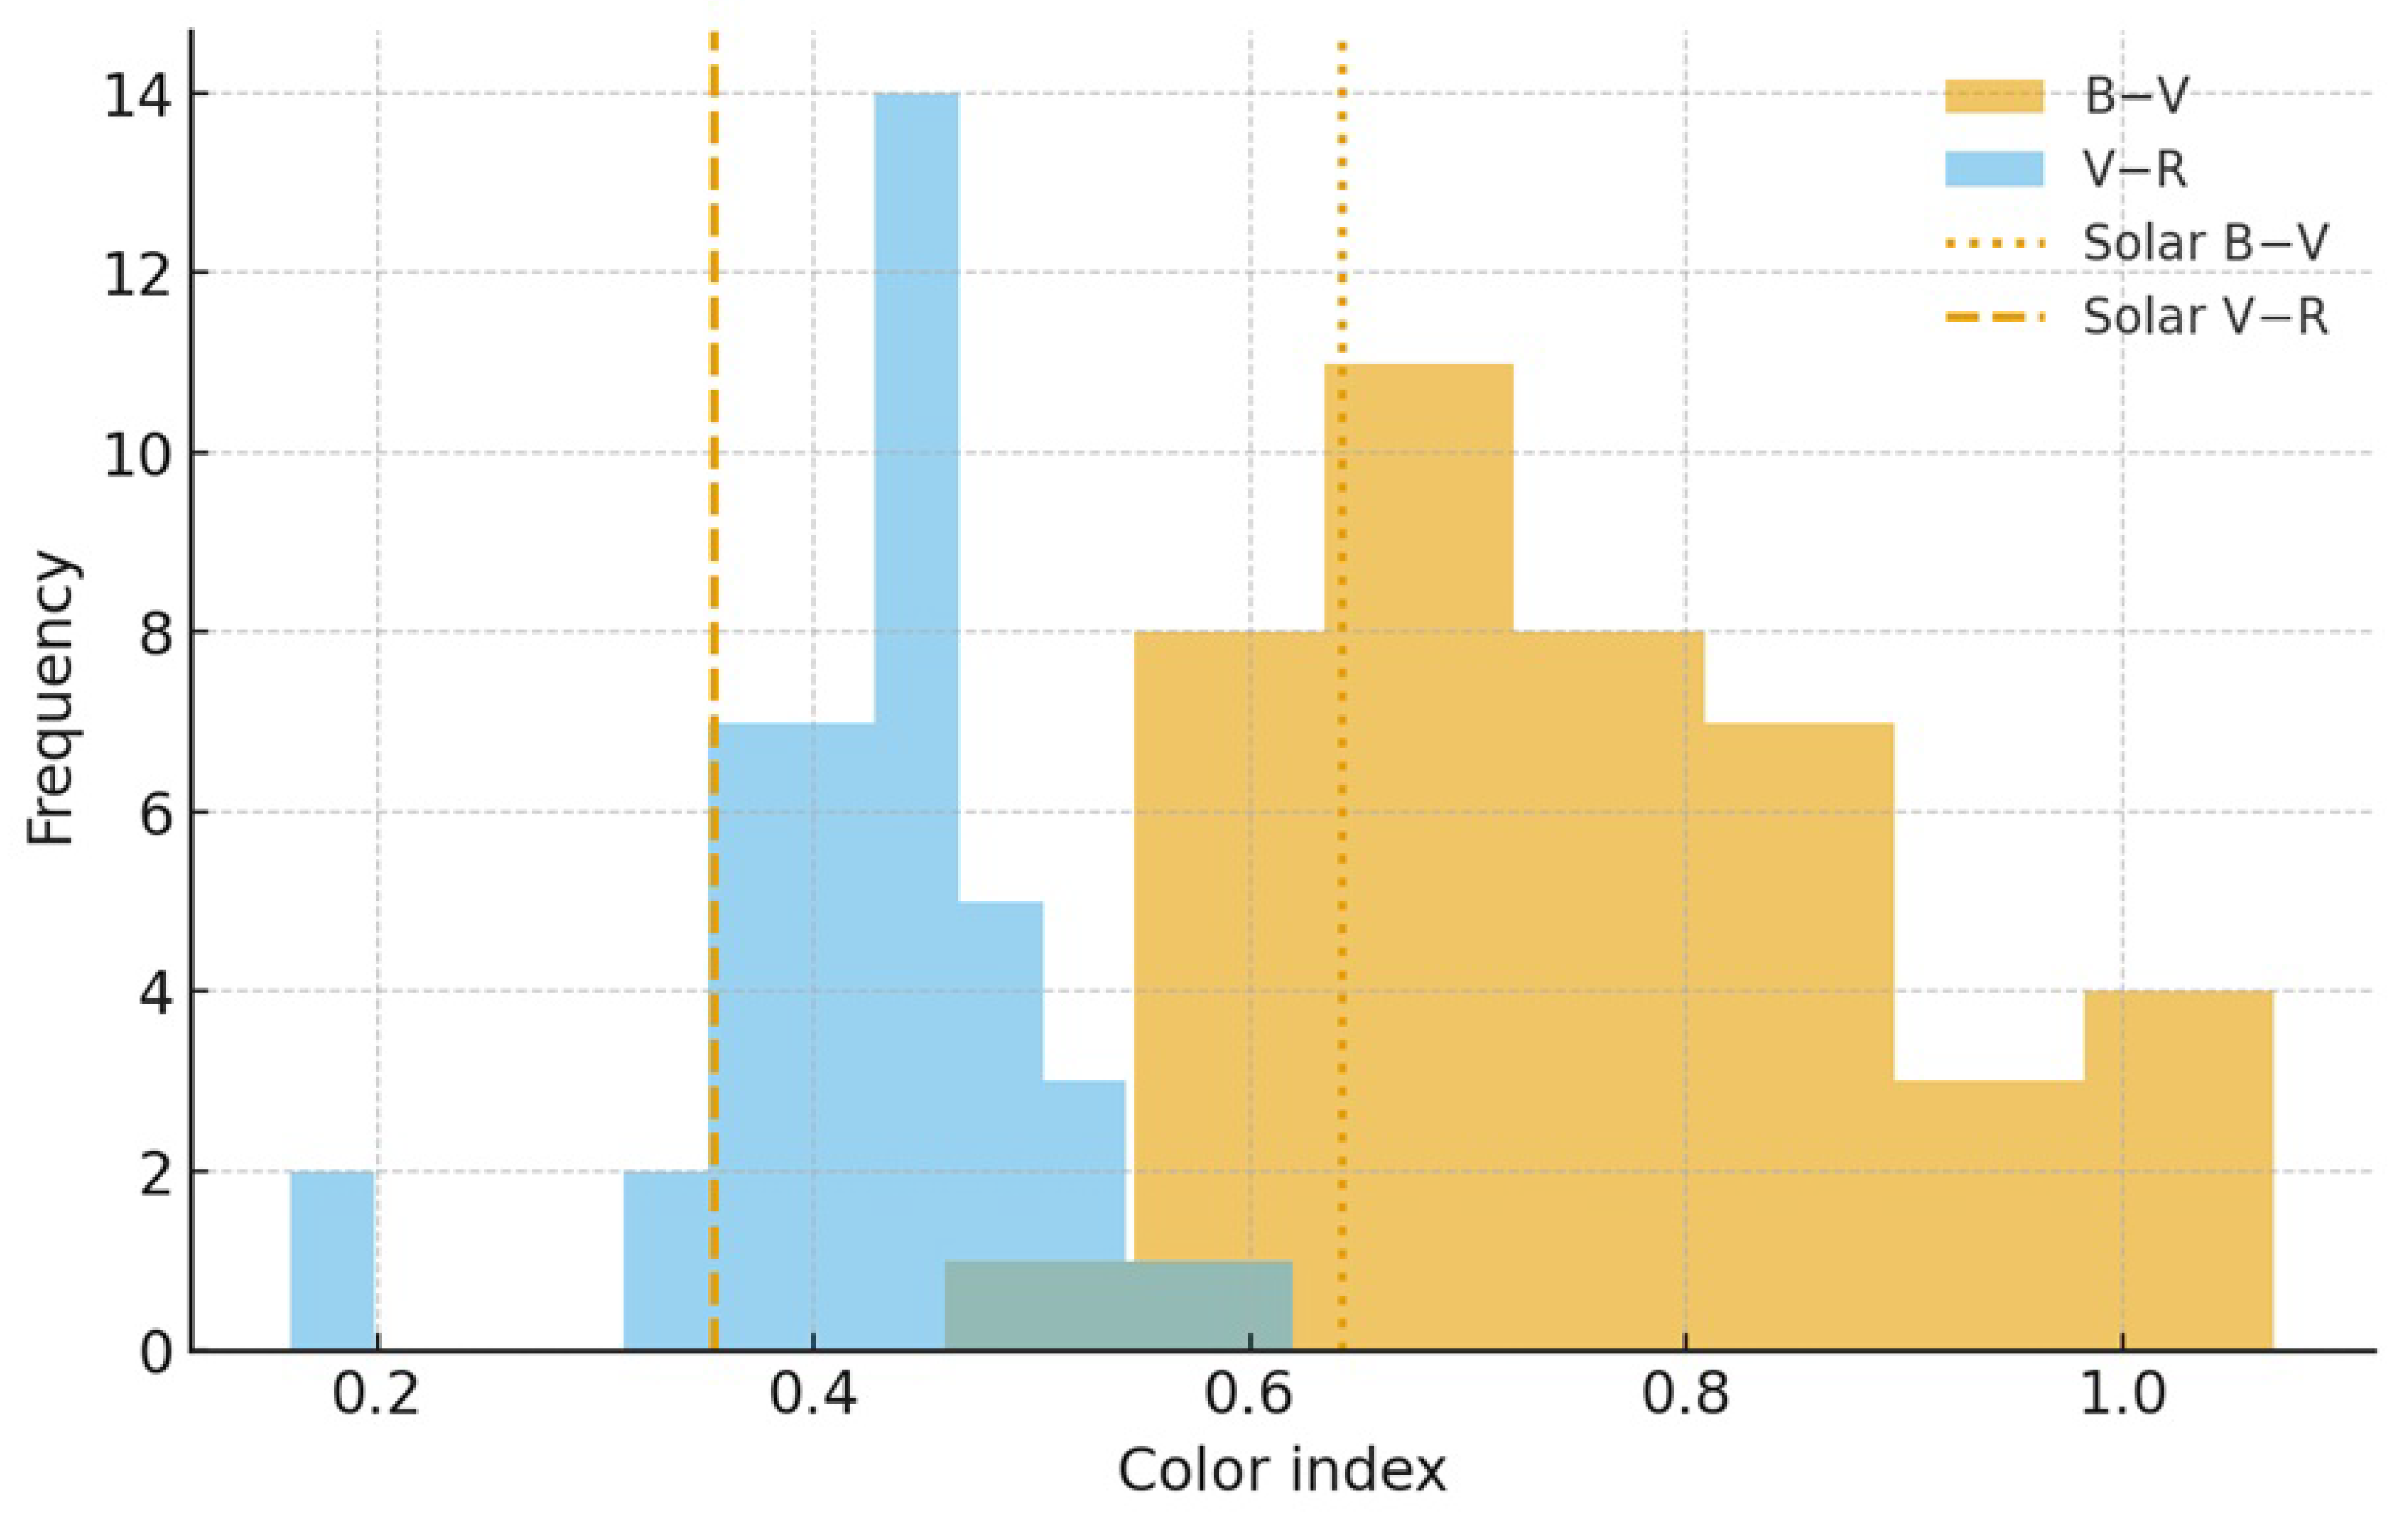
Universe 12 00065 g0a2

Appendix A.2. C/2010 S1 (LINEAR)

Figure A3. Distribution of B V color indices of comet C/2010 S1 (LINEAR) before and after perihelion. The dotted vertical line marks the solar color B V = 0.642 .
Universe 12 00065 g0a3
Figure A4. Distribution of V R color indices of comet C/2010 S1 (LINEAR) before and after perihelion. The dashed vertical line marks the solar color V R = 0.354 .
Universe 12 00065 g0a4
Table A1. Color indices of comet C/2010 S1 (LINEAR) before perihelion.
JD B V V R Vr [AU] α [°]
2456140.71361 0.67 ± 0.09 0.37 ± 0.05 14.70 ± 0.07 6.2499.1
2456140.75535 0.70 ± 0.06 0.37 ± 0.04 14.74 ± 0.08 6.2499.1
2456140.79657 0.70 ± 0.07 0.40 ± 0.04 14.63 ± 0.06 6.2499.1
2456140.83852 0.77 ± 0.05 0.37 ± 0.04 14.71 ± 0.07 6.2499.1
2456140.89413 0.71 ± 0.09 0.36 ± 0.04 14.73 ± 0.06 6.2499.1
2456140.96337 0.62 ± 0.08 0.26 ± 0.05 14.32 ± 0.07 6.2499.1
2456141.46391 0.50 ± 0.10 0.51 ± 0.05 14.37 ± 0.03 6.2479.1
2456141.50455 0.88 ± 0.06 0.20 ± 0.10 14.30 ± 0.10 6.2479.1
2456236.58759 0.77 ± 0.06 0.47 ± 0.07 13.80 ± 0.20 6.0619.3
2456236.63038 0.71 ± 0.09 0.36 ± 0.05 14.00 ± 0.20 6.0619.3
2456236.65003 0.70 ± 0.10 0.38 ± 0.05 14.00 ± 0.20 6.0619.3
2456236.69222 0.68 ± 0.05 0.41 ± 0.05 14.00 ± 0.20 6.0619.3
2456236.71270 0.75 ± 0.07 0.38 ± 0.04 14.00 ± 0.20 6.0619.3
Table A2. Color indices of comet C/2010 S1 (LINEAR) after perihelion (Part 1).
JD B V V R Vr [AU] α [°]
2456454.57547 0.86 ± 0.07 0.38 ± 0.04 14.50 ± 0.10 5.9029.7
2456454.61686 0.82 ± 0.10 0.45 ± 0.06 14.60 ± 0.10 5.9029.7
2456454.65875 0.62 ± 0.07 0.43 ± 0.03 14.59 ± 0.08 5.9029.7
2456457.48843 0.75 ± 0.08 0.45 ± 0.03 14.23 ± 0.07 5.9029.6
2456457.52309 0.66 ± 0.07 13.99 ± 0.08 5.9039.6
2456457.56502 0.70 ± 0.10 0.45 ± 0.03 14.48 ± 0.09 5.9039.6
2456457.61029 0.60 ± 0.10 0.38 ± 0.04 14.47 ± 0.06 5.9039.6
2456457.65200 0.78 ± 0.08 0.43 ± 0.03 14.54 ± 0.08 5.9039.6
2456458.60053 0.66 ± 0.06 0.46 ± 0.03 14.51 ± 0.06 5.9039.5
2456458.64268 0.73 ± 0.08 0.48 ± 0.04 14.56 ± 0.07 5.9039.5
2456458.68489 0.82 ± 0.07 0.48 ± 0.03 14.58 ± 0.04 5.9039.5
2456458.72696 0.69 ± 0.07 0.47 ± 0.03 14.63 ± 0.05 5.9039.5
2456458.76927 0.70 ± 0.06 0.45 ± 0.03 14.64 ± 0.04 5.9039.5
2456459.48270 0.71 ± 0.06 0.41 ± 0.03 14.54 ± 0.05 5.9039.5
2456459.52394 0.78 ± 0.06 0.48 ± 0.03 14.58 ± 0.04 5.9039.5
2456459.56611 0.74 ± 0.06 0.44 ± 0.03 14.57 ± 0.05 5.9039.5
2456459.60819 0.76 ± 0.06 0.47 ± 0.03 14.61 ± 0.05 5.9039.5
2456459.65028 0.70 ± 0.06 0.41 ± 0.03 14.61 ± 0.04 5.9039.5
2456459.69240 0.69 ± 0.06 0.41 ± 0.03 14.62 ± 0.05 5.9039.5
2456461.49519 0.65 ± 0.04 0.41 ± 0.03 14.51 ± 0.05 5.9039.4
2456461.53686 0.70 ± 0.06 0.42 ± 0.03 14.53 ± 0.04 5.9039.4
2456461.57898 0.68 ± 0.05 0.44 ± 0.03 14.57 ± 0.04 5.9039.4
2456461.62096 0.67 ± 0.05 0.45 ± 0.03 14.58 ± 0.05 5.9039.4
2456461.66296 0.69 ± 0.05 0.44 ± 0.03 14.56 ± 0.04 5.9039.4
2456461.70495 0.67 ± 0.04 0.44 ± 0.03 14.55 ± 0.04 5.9039.4
2456470.47647 0.65 ± 0.06 0.36 ± 0.03 14.55 ± 0.06 5.9078.8
2456470.51865 0.67 ± 0.07 0.37 ± 0.03 14.58 ± 0.05 5.9078.8
2456470.56073 0.61 ± 0.07 0.35 ± 0.03 14.60 ± 0.06 5.9078.8
2456470.60279 0.69 ± 0.07 0.38 ± 0.04 14.64 ± 0.05 5.9078.8
2456470.64496 0.69 ± 0.07 0.36 ± 0.03 14.63 ± 0.05 5.9078.8
Notes: “−” indicates no measurement available.
Table A3. Color indices of comet C/2010 S1 (LINEAR) after perihelion (Part 2).
JD B V V R Vr [AU] α [°]
2456471.81663 0.38 ± 0.05 14.20 ± 0.10 5.9069.0
2456471.85818 0.42 ± 0.07 14.00 ± 0.10 5.9069.0
2456471.90062 0.45 ± 0.06 14.10 ± 0.10 5.9069.0
2456474.45042 0.56 ± 0.04 14.40 ± 0.30 5.9078.8
2456474.49209 0.64 ± 0.09 0.38 ± 0.05 14.30 ± 0.30 5.9078.8
2456474.53385 0.67 ± 0.09 0.57 ± 0.04 13.80 ± 0.30 5.9078.8
2456474.58949 0.60 ± 0.10 0.44 ± 0.08 14.30 ± 0.20 5.9078.8
2456474.66539 0.70 ± 0.20 0.39 ± 0.06 14.20 ± 0.20 5.9078.8
2456491.49309 0.75 ± 0.06 0.42 ± 0.03 14.72 ± 0.05 5.9307.9
2456491.53499 0.71 ± 0.06 0.39 ± 0.03 14.73 ± 0.05 5.9307.9
2456491.57736 0.63 ± 0.06 0.39 ± 0.03 14.77 ± 0.05 5.9307.9
2456491.61949 0.69 ± 0.06 0.39 ± 0.03 14.79 ± 0.05 5.9307.9
2456491.66179 0.72 ± 0.07 0.39 ± 0.03 14.79 ± 0.05 5.9307.9
2456494.45371 0.65 ± 0.05 0.41 ± 0.03 14.88 ± 0.05 5.9337.7
2456494.49578 0.65 ± 0.06 0.42 ± 0.03 14.89 ± 0.05 5.9337.7
2456494.53786 0.63 ± 0.06 0.40 ± 0.03 14.92 ± 0.05 5.9337.7
2456494.57977 0.75 ± 0.06 0.42 ± 0.03 14.89 ± 0.05 5.9337.7
2456497.50721 0.68 ± 0.05 0.43 ± 0.03 15.00 ± 0.05 5.9367.5
2456497.54893 0.65 ± 0.06 0.41 ± 0.03 15.00 ± 0.05 5.9367.5
2456497.59100 0.69 ± 0.06 0.41 ± 0.03 14.99 ± 0.05 5.9367.5
2456497.63296 0.73 ± 0.06 0.42 ± 0.03 14.98 ± 0.05 5.9367.5
2456500.45015 0.57 ± 0.08 0.37 ± 0.03 14.20 ± 0.20 5.9197.6
2456500.49222 0.60 ± 0.10 0.46 ± 0.05 14.30 ± 0.20 5.9197.6
2456500.56463 0.34 ± 0.04 14.20 ± 0.10 5.9197.6
2456500.60679 0.60 ± 0.20 0.34 ± 0.03 14.20 ± 0.20 5.9197.6
2456533.38829 0.50 ± 0.10 0.22 ± 0.09 13.90 ± 0.20 5.9437.9
2456533.45009 0.25 ± 0.04 13.70 ± 0.10 5.9437.9
2456533.49154 0.28 ± 0.06 13.96 ± 0.06 5.9437.9
2456533.53338 0.50 ± 0.20 0.14 ± 0.06 13.78 ± 0.05 5.9437.9
2456533.57539 0.31 ± 0.03 13.99 ± 0.05 5.9437.9
2456579.32166 0.58 ± 0.03 0.43 ± 0.03 14.43 ± 0.04 5.9909.6
2456579.42221 0.69 ± 0.06 0.33 ± 0.03 14.48 ± 0.06 5.9919.6
2456778.72478 0.60 ± 0.20 0.38 ± 0.06 15.50 ± 0.06 6.3839.0
Notes: “−” indicates no measurement available.

Appendix A.3. C/2011 L4 (PANSTARRS)

Figure A5. Distributions of the color indices B V (orange) and V R (blue) for comet C/2011 L4 (PANSTARRS). The vertical dashed line marks the solar color B V = 0.642 and the vertical dotted line marks the solar color V R = 0.354 . The solar colors lie in the first quartile of both distributions, indicating that comet C/2011 L4 (PANSTARRS) is systematically redder than the Sun.
Universe 12 00065 g0a5
Figure A6. Geocentric magnitudes B geo , V geo , and R geo of comet C/2011 L4 (PANSTARRS) as a function of log 10 ( r ) . Points show the weighted data in each band, and solid, dashed, and dash-dotted lines show the corresponding weighted least-squares fits m geo = a + b log 10 ( r ) . The similar slopes in the three filters indicate no statistically significant color evolution with heliocentric distance over the observed range.
Universe 12 00065 g0a6
Table A4. Photometry of comet C/2011 L4 (PANSTARRS) (Part 1).
JD B V V R Vr (au)
2456446.67604 0.70 ± 0.30 0.43 ± 0.04 12.70 ± 0.20 1.87199
2456459.67601 0.80 ± 0.10 0.51 ± 0.08 13.00 ± 0.30 2.07912
2456462.83064 0.36 ± 0.13 12.90 ± 0.19 2.12809
2456480.36039 0.84 ± 0.05 0.46 ± 0.04 13.14 ± 0.09 2.39217
2456480.36120 0.89 ± 0.09 0.40 ± 0.05 13.11 ± 0.11 2.39218
2456480.40363 0.77 ± 0.06 0.55 ± 0.04 13.19 ± 0.09 2.39280
2456480.44141 0.90 ± 0.07 0.43 ± 0.04 13.14 ± 0.10 2.39336
2456480.44141 0.96 ± 0.08 0.42 ± 0.03 13.17 ± 0.10 2.39336
2456480.48463 0.94 ± 0.15 0.51 ± 0.05 13.15 ± 0.09 2.39400
2456480.48463 0.90 ± 0.09 0.47 ± 0.05 13.18 ± 0.07 2.39400
2456480.52594 0.84 ± 0.03 0.43 ± 0.05 13.22 ± 0.11 2.39460
2456480.52594 0.88 ± 0.05 0.43 ± 0.05 13.20 ± 0.08 2.39460
2456480.56678 1.02 ± 0.15 0.44 ± 0.04 13.17 ± 0.08 2.39520
2456480.56737 0.91 ± 0.07 0.44 ± 0.04 13.18 ± 0.06 2.39521
2456482.36302 0.92 ± 0.05 0.53 ± 0.06 13.24 ± 0.07 2.42154
2456482.40412 0.92 ± 0.07 13.31 ± 0.04 2.42214
2456482.44587 0.83 ± 0.04 0.51 ± 0.03 13.21 ± 0.06 2.42275
2456482.48747 0.79 ± 0.09 0.47 ± 0.04 13.16 ± 0.07 2.42336
2456482.53016 0.89 ± 0.08 0.54 ± 0.09 13.24 ± 0.05 2.42398
2456483.63244 0.83 ± 0.09 0.54 ± 0.03 13.28 ± 0.06 2.44008
2456483.67519 0.78 ± 0.05 0.51 ± 0.03 13.24 ± 0.06 2.44070
2456483.84126 1.20 ± 0.20 0.60 ± 0.10 13.40 ± 0.10 2.44312
2456505.40844 0.40 ± 0.20 14.40 ± 0.10 2.74927
2456505.45037 0.70 ± 0.20 14.50 ± 0.20 2.74985
2456505.49196 0.60 ± 0.20 0.44 ± 0.04 14.60 ± 0.20 2.75042
2456505.69042 0.90 ± 0.10 0.43 ± 0.08 13.80 ± 0.10 2.75317
2456510.66611 0.80 ± 0.40 0.52 ± 0.03 14.10 ± 0.07 2.82163
2456510.66611 1.21 ± 0.05 0.54 ± 0.03 14.09 ± 0.07 2.82163
2456513.48816 0.33 ± 0.07 14.40 ± 0.20 2.86014
2456513.61594 1.00 ± 0.20 0.95 ± 0.08 14.40 ± 0.10 2.86188
Notes: “−” indicates no measurement available.
Table A5. Photometry of comet C/2011 L4 (PANSTARRS) (Part 2).
JD B V V R Vr (au)
2456513.65262 0.70 ± 0.10 0.48 ± 0.04 13.90 ± 0.10 2.86238
2456513.69495 0.80 ± 0.10 0.48 ± 0.05 13.97 ± 0.07 2.86295
2456513.73596 0.73 ± 0.09 0.37 ± 0.05 13.88 ± 0.07 2.86351
2456514.39847 0.90 ± 0.10 0.46 ± 0.03 14.60 ± 0.10 2.87251
2456514.43958 0.99 ± 0.07 0.48 ± 0.03 14.70 ± 0.08 2.87307
2456514.48162 0.45 ± 0.06 14.70 ± 0.20 2.87364
2456516.39471 1.36 ± 0.10 14.71 ± 0.23 2.89956
2456516.43611 0.90 ± 0.28 0.23 ± 0.11 14.63 ± 0.25 2.90012
2456519.39102 0.91 ± 0.21 0.41 ± 0.10 14.51 ± 0.20 2.93996
2456530.38454 0.74 ± 0.08 0.51 ± 0.08 15.20 ± 0.10 3.08612
2456530.40514 0.70 ± 0.20 0.55 ± 0.02 15.00 ± 0.20 3.08639
2456530.42603 0.50 ± 0.10 0.67 ± 0.03 15.50 ± 0.10 3.08666
2456530.44656 0.54 ± 0.03 15.30 ± 0.10 3.08693
2456530.46773 1.10 ± 0.10 0.38 ± 0.02 15.20 ± 0.10 3.08721
2456535.37744 1.10 ± 0.40 0.40 ± 0.10 15.20 ± 0.20 3.15148
2456535.37744 1.10 ± 0.40 0.40 ± 0.10 15.20 ± 0.20 3.15148
2456535.39780 0.80 ± 0.20 0.49 ± 0.08 15.30 ± 0.20 3.15175
2456535.39780 0.80 ± 0.20 0.49 ± 0.08 15.30 ± 0.20 3.15175
2456535.41907 0.70 ± 0.20 0.90 ± 0.10 15.20 ± 0.20 3.15202
2456535.41907 0.70 ± 0.20 0.90 ± 0.10 15.20 ± 0.20 3.15202
2456535.45014 0.93 ± 0.09 0.48 ± 0.08 15.10 ± 0.20 3.15243
2456535.45014 0.93 ± 0.09 0.48 ± 0.08 15.10 ± 0.20 3.15243
2456535.60351 0.53 ± 0.05 14.74 ± 0.09 3.15443
2456535.68596 0.90 ± 0.10 0.36 ± 0.04 14.72 ± 0.09 3.15550
2456544.38727 0.52 ± 0.05 15.40 ± 0.10 3.26793
2456544.40853 0.70 ± 0.30 0.60 ± 0.10 15.60 ± 0.20 3.26820
2456544.42934 0.42 ± 0.05 15.40 ± 0.20 3.26847
2456549.37039 1.30 ± 0.46 0.82 ± 0.36 13.31 ± 0.83 3.33154
2456579.31877 0.85 ± 0.12 0.37 ± 0.03 16.02 ± 0.06 3.70302
2456579.33539 0.98 ± 0.14 16.36 ± 0.16 3.70322
Notes: “−” indicates no measurement available.

Appendix A.4. C/2012 J1 (Catalina)

Figure A7. Histograms of the B R and V R color indices for comet C/2012 J1 (Catalina). The shaded bars show the distributions of the cometary colors, while the vertical dotted and dashed lines indicate the adopted solar colors B R and V R , respectively.
Universe 12 00065 g0a7

Appendix A.5. C/2012 K1 (PANSTARRS)

Figure A8. Distributions of the cometary color indices B V and V R for comet C/2012 K1 (PANSTARRS). Dotted and dashed vertical lines indicate the solar colors.
Universe 12 00065 g0a8
Figure A9. Geocentric magnitudes in the B, V, and R bands as a function of log 10 ( r ) for comet C/2012 K1 (PANSTARRS), with weighted linear fits overplotted. The vertical axis is inverted so that brighter magnitudes appear higher.
Universe 12 00065 g0a9

Appendix A.6. C/2012 S1 (ISON)

Figure A10. Distribution of the ( V R ) color index for comet C/2012 S1 (ISON). The dotted vertical line marks the solar color ( V R ) = 0.354 .
Universe 12 00065 g0a10
Figure A11. Geocentric magnitudes V geo and R geo of comet C/2012 S1 (ISON) as a function of log 10 ( r ) , where r is the heliocentric distance in au. Points show the observations and lines represent the weighted linear fits V geo = a V + b V log 10 ( r ) and R geo = a R + b R log 10 ( r ) .
Universe 12 00065 g0a11
Table A6. Comet C/2012 S1 (ISON): Julian Date (JD), ( V R ) color index, V magnitude, and heliocentric distance r.
JD V R Vr (au)
2456205.14161 0.420 ± 0.030 18.080 ± 0.040 6.161
2456273.44080 0.550 ± 0.010 16.960 ± 0.020 5.470
2456279.82690 0.520 ± 0.030 16.880 ± 0.010 5.410
2456301.09972 0.410 ± 0.010 16.090 ± 0.040 5.180
2456313.58925 0.760 ± 0.040 17.000 ± 0.100 5.046
2456313.63072 0.930 ± 0.040 17.300 ± 0.100 5.046
2456313.67229 0.700 ± 0.040 16.100 ± 0.100 5.045
2456313.79688 0.580 ± 0.040 16.600 ± 0.100 5.044
2456313.84025 0.750 ± 0.040 17.100 ± 0.100 5.043
2456313.87957 0.620 ± 0.040 16.700 ± 0.100 5.043
2456314.63120 0.340 ± 0.050 16.140 ± 0.040 5.035
2456314.67288 0.130 ± 0.050 15.990 ± 0.040 5.034
2456314.75644 0.300 ± 0.050 16.020 ± 0.040 5.034
2456314.79771 0.400 ± 0.050 15.980 ± 0.040 5.033
2456314.88003 0.260 ± 0.050 15.950 ± 0.040 5.032
2456325.66559 0.390 ± 0.080 15.670 ± 0.020 4.915
2456325.77584 0.390 ± 0.080 15.710 ± 0.020 4.913
2456325.81780 0.670 ± 0.080 16.440 ± 0.020 4.913
2456325.90126 0.460 ± 0.080 16.220 ± 0.020 4.912
2456333.27539 0.410 ± 0.020 16.270 ± 0.020 4.831
2456333.35868 0.230 ± 0.020 15.820 ± 0.020 4.830
2456333.40068 0.390 ± 0.020 16.130 ± 0.020 4.829
2456333.44185 0.550 ± 0.020 16.430 ± 0.020 4.829
2456333.48343 0.340 ± 0.020 16.070 ± 0.020 4.829
2456333.70683 0.460 ± 0.090 16.130 ± 0.060 4.826
2456333.74919 0.300 ± 0.090 15.890 ± 0.060 4.826
2456333.78969 0.770 ± 0.090 16.410 ± 0.060 4.825
Table A7. Comet C/2012 S1 (ISON): same as Table A6, continued.
JD V R Vr (au)
2456367.37984 0.230 ± 0.060 16.170 ± 0.030 4.450
2456367.58844 0.320 ± 0.060 16.300 ± 0.200 4.444
2456367.71505 0.240 ± 0.050 16.130 ± 0.030 4.440
2456383.63777 0.330 ± 0.050 16.020 ± 0.070 4.257
2456390.59524 0.810 ± 0.030 14.700 ± 0.020 4.176
2456390.63622 0.700 ± 0.030 14.500 ± 0.020 4.174
2456390.67815 0.760 ± 0.030 14.450 ± 0.020 4.174
2456390.71968 0.760 ± 0.030 14.650 ± 0.020 4.173
2456390.44213 0.480 ± 0.030 16.310 ± 0.020 4.173
2456397.61296 0.400 ± 0.020 16.080 ± 0.060 4.090
2456401.32285 0.800 ± 0.020 16.750 ± 0.030 4.046
2456401.36374 0.640 ± 0.020 16.450 ± 0.030 4.045
2456401.60567 0.630 ± 0.070 16.240 ± 0.010 4.042
2456401.65174 0.640 ± 0.070 16.300 ± 0.030 4.042
2456406.32814 0.630 ± 0.040 16.170 ± 0.020 3.985
2456406.34461 0.540 ± 0.040 16.010 ± 0.020 3.985
2456406.38637 0.590 ± 0.040 16.130 ± 0.020 3.984
2456429.61866 0.420 ± 0.040 15.970 ± 0.020 3.696
2456430.61975 0.300 ± 0.030 16.230 ± 0.020 3.683
2456431.62405 0.340 ± 0.050 15.920 ± 0.020 3.671
2456432.62253 0.700 ± 0.100 15.470 ± 0.080 3.658
2456540.72080 0.190 ± 0.030 15.060 ± 0.040 2.107
2456577.69764 0.390 ± 0.050 13.950 ± 0.060 1.432
2456578.70446 0.350 ± 0.030 13.900 ± 0.090 1.412
2456582.69742 0.430 ± 0.020 13.740 ± 0.050 1.329
2456584.98235 0.290 ± 0.020 14.110 ± 0.020 1.281
2456586.69709 0.300 ± 0.100 13.400 ± 0.100 1.244
2456586.72767 0.410 ± 0.030 13.830 ± 0.030 1.243
2456587.72803 0.300 ± 0.020 13.700 ± 0.020 1.221

Appendix A.7. C/2013 R1 (Lovejoy)

Figure A12. Distribution of the B V color index of Comet C/2013 R1 (Lovejoy) before (orange) and after (blue) perihelion. The dotted vertical line marks the solar color B V = 0.642 . The histograms highlight the systematically redder pre-perihelion colors and the mild convergence toward solar values after perihelion.
Universe 12 00065 g0a12
Figure A13. Distribution of the V R color index of Comet C/2013 R1 (Lovejoy) before (orange) and after (blue) perihelion. The dashed vertical line marks the solar color V R = 0.354 . The figure shows that the coma is bluer than solar before perihelion and shifts to values consistent with or slightly above the solar color after perihelion.
Universe 12 00065 g0a13
Table A8. Color indices B V and V R , V magnitude, and heliocentric distance r for Comet C/2013 R1 (Lovejoy) before perihelion. Uncertainties are given as ± 1 σ .
JD B V V R Vr (au)
2456594.2289240.860 ± 0.0700.270 ± 0.04011.920 ± 0.0801.287
2456597.7000930.710 ± 0.0800.400 ± 0.10012.100 ± 0.1001.242
2456597.9305320.730 ± 0.0300.630 ± 0.07011.120 ± 0.1001.239
2456598.1889350.640 ± 0.0500.360 ± 0.02011.850 ± 0.0401.236
2456598.2227200.530 ± 0.0300.390 ± 0.03011.960 ± 0.0201.235
2456598.9074190.700 ± 0.0500.320 ± 0.03011.780 ± 0.0301.227
2456600.6913690.770 ± 0.0400.290 ± 0.03011.870 ± 0.0301.207
2456600.7372450.720 ± 0.0600.280 ± 0.05011.780 ± 0.0501.206
2456601.7059720.720 ± 0.0300.210 ± 0.02011.870 ± 0.0301.195
2456601.7368170.740 ± 0.0200.230 ± 0.02011.900 ± 0.0201.195
2456601.8548030.740 ± 0.0500.260 ± 0.04011.970 ± 0.0501.193
2456602.6979970.780 ± 0.0800.270 ± 0.05011.900 ± 0.0601.183
2456602.7377780.700 ± 0.0700.270 ± 0.05011.910 ± 0.0501.182
2456603.7061810.660 ± 0.0300.230 ± 0.02011.960 ± 0.0301.171
2456603.7426020.750 ± 0.0300.240 ± 0.02011.930 ± 0.0301.171
2456604.7305560.750 ± 0.0500.260 ± 0.03011.960 ± 0.0401.160
2456604.7677670.730 ± 0.0400.250 ± 0.02012.010 ± 0.0301.160
2456605.7454630.780 ± 0.0400.280 ± 0.02012.020 ± 0.0301.149
2456605.7825110.760 ± 0.0300.280 ± 0.02012.020 ± 0.0301.149
2456606.7405320.770 ± 0.0200.280 ± 0.02012.080 ± 0.0201.139
2456606.7773610.770 ± 0.0200.280 ± 0.02012.060 ± 0.0201.138
2456607.7124760.790 ± 0.0300.290 ± 0.02012.150 ± 0.0301.128
2456607.7492940.790 ± 0.0300.300 ± 0.02012.140 ± 0.0301.127
2456609.7100690.730 ± 0.0200.280 ± 0.02012.340 ± 0.0201.108
2456609.7467940.730 ± 0.0200.280 ± 0.02012.320 ± 0.0201.107
2456611.7073720.790 ± 0.0300.290 ± 0.02012.550 ± 0.0301.089
2456611.7440970.800 ± 0.0300.290 ± 0.02012.550 ± 0.0301.088
2456613.7057870.800 ± 0.0300.300 ± 0.02012.810 ± 0.0301.070
2456613.7425000.800 ± 0.0300.300 ± 0.02012.800 ± 0.0301.069
2456615.7062150.800 ± 0.0300.310 ± 0.02013.050 ± 0.0301.052
Table A9. Color indices B V and V R , V magnitude, and heliocentric distance r for Comet C/2013 R1 (Lovejoy) after perihelion. Uncertainties are given as ± 1 σ .
JD B V V R Vr (au)
2456721.7185070.780 ± 0.0500.310 ± 0.04012.900 ± 0.2001.519
2456728.7286690.320 ± 0.0700.340 ± 0.01013.430 ± 0.0301.613
2456728.7491671.000 ± 0.2000.160 ± 0.01013.390 ± 0.0801.614
2456732.7490510.500 ± 0.2000.430 ± 0.09013.200 ± 0.2001.667
2456736.7212961.040 ± 0.0200.400 ± 0.02013.850 ± 0.2001.721
2456744.7128470.620 ± 0.0500.350 ± 0.04014.130 ± 0.0501.829
2456744.7433100.640 ± 0.0500.350 ± 0.04014.170 ± 0.0601.829
2456748.7131940.620 ± 0.0800.350 ± 0.06014.300 ± 0.0701.885
2456748.7424880.640 ± 0.0800.330 ± 0.06014.270 ± 0.0701.885
2456750.7098380.650 ± 0.0400.360 ± 0.03014.320 ± 0.0401.913
2456750.7400220.660 ± 0.0400.360 ± 0.03014.330 ± 0.0401.913
2456752.7125170.650 ± 0.0600.360 ± 0.04014.380 ± 0.0501.942
2456752.7429280.660 ± 0.0600.360 ± 0.04014.390 ± 0.0501.942
2456754.7089000.650 ± 0.0500.370 ± 0.04014.470 ± 0.0501.971
2456754.7392700.670 ± 0.0500.370 ± 0.04014.470 ± 0.0501.971
2456756.7120600.640 ± 0.0400.350 ± 0.03014.560 ± 0.0402.000
2456756.7424190.640 ± 0.0400.350 ± 0.03014.570 ± 0.0402.001
2456758.7102780.650 ± 0.0400.360 ± 0.03014.680 ± 0.0402.030
2456758.7407290.660 ± 0.0400.370 ± 0.03014.680 ± 0.0402.030
2456760.7100690.660 ± 0.0400.360 ± 0.03014.780 ± 0.0402.060
2456760.7404510.660 ± 0.0400.360 ± 0.03014.790 ± 0.0402.060
2456762.7081480.660 ± 0.0600.360 ± 0.04014.890 ± 0.0502.090
2456762.7385530.670 ± 0.0600.360 ± 0.04014.900 ± 0.0502.090
2456764.7064090.670 ± 0.0400.370 ± 0.03015.010 ± 0.0402.121
2456764.7367590.680 ± 0.0400.370 ± 0.03015.010 ± 0.0402.121
2456766.7046530.670 ± 0.0500.370 ± 0.04015.110 ± 0.0502.152
2456766.7349880.680 ± 0.0500.370 ± 0.04015.110 ± 0.0502.152
2456768.7028680.680 ± 0.0500.370 ± 0.04015.220 ± 0.0502.183
2456768.7331710.690 ± 0.0500.370 ± 0.04015.220 ± 0.0502.183
2456770.7013190.690 ± 0.0600.380 ± 0.05015.340 ± 0.0602.215

Appendix A.8. C/2020 V2 (ZTF)

Figure A14. Histogram of the B V color of comet C/2020 V2 (ZTF) before and after perihelion. The vertical dotted line indicates the solar color B V .
Universe 12 00065 g0a14
Figure A15. Histogram of the V R color of comet C/2020 V2 (ZTF) before and after perihelion. The vertical dashed line indicates the solar color V R .
Universe 12 00065 g0a15
Figure A16. Histogram of the R I color of comet C/2020 V2 (ZTF) before and after perihelion. The vertical solid line indicates the solar color R I .
Universe 12 00065 g0a16

Appendix A.9. 1P/Halley (1986)

Figure A17. Histogram of the B V color index for comet 1P/Halley, showing the distributions before and after perihelion. The vertical dotted line marks the solar color B V = 0.642 .
Universe 12 00065 g0a17
Figure A18. Histogram of the V R color index for comet 1P/Halley, showing the distributions before and after perihelion. The vertical dashed line marks the solar color V R = 0.354 .
Universe 12 00065 g0a18

Appendix A.10. 4P/Faye (1991)

Figure A19. Histograms of the B V color index of comet 4P/Faye before and after perihelion. The vertical dashed line marks the solar color B V = 0.642 .
Universe 12 00065 g0a19

Appendix A.11. 41P/Tuttle–Giacobini–Kres Ák (2017)

Figure A20. Histograms of the B V color index of comet 41P/Tuttle–Giacobini–Kresak before (filled bars) and after (hatched bars) perihelion. The vertical dotted line marks the solar color B V = 0.642 .
Universe 12 00065 g0a20
Table A10. Photometric data of comet 41P/Tuttle–Giacobini–Kresak before perihelion (first part).
JDV B V r (au)
2457815.7702000 13.31 ± 0.05 0.79 ± 0.03 1.178566
2457819.8110000 13.37 ± 0.02 0.53 ± 0.10 1.155044
2457819.8129283 13.34 ± 0.03 0.60 ± 0.11 1.155033
2457820.8120718 13.10 ± 0.08 0.70 ± 0.11 1.149492
2457820.8163194 13.14 ± 0.05 0.89 ± 0.10 1.149468
2457822.8404630 12.72 ± 0.09 0.75 ± 0.11 1.138595
2457822.8436516 12.84 ± 0.09 0.79 ± 0.08 1.138578
2457823.8177836 13.22 ± 0.06 1.40 ± 0.20 1.133519
2457823.8193750 13.16 ± 0.05 1.00 ± 0.20 1.133511
2457825.8170000 12.95 ± 0.09 0.72 ± 0.05 1.123503
2457825.8223000 13.15 ± 0.03 0.64 ± 0.07 1.123477
2457825.8597000 13.26 ± 0.03 0.59 ± 0.05 1.123294
2457825.8615000 13.41 ± 0.03 0.47 ± 0.05 1.123285
2457826.8927000 12.96 ± 0.03 0.60 ± 0.03 1.118323
2457827.7330000 12.97 ± 0.04 0.68 ± 0.03 1.114382
2457827.7347000 12.95 ± 0.03 0.71 ± 0.02 1.114374
2457827.8083000 12.98 ± 0.03 0.93 ± 0.03 1.114034
2457827.8100000 13.03 ± 0.03 0.78 ± 0.08 1.114026
2457828.7784000 13.12 ± 0.03 0.69 ± 0.06 1.109611
2457828.7813000 13.10 ± 0.05 0.65 ± 0.06 1.109598
2457828.8110000 13.10 ± 0.05 0.64 ± 0.02 1.109464
2457828.8127000 12.96 ± 0.05 0.76 ± 0.02 1.109457
2457829.7730000 13.19 ± 0.09 0.80 ± 0.10 1.105209
2457829.7752000 13.21 ± 0.06 0.92 ± 0.09 1.105199
2457830.7528819 13.25 ± 0.02 0.64 ± 0.07 1.101005
2457830.7548264 13.14 ± 0.02 0.79 ± 0.04 1.100997
2457831.7568519 12.99 ± 0.06 0.64 ± 0.06 1.096839
2457831.7589236 13.08 ± 0.02 0.65 ± 0.07 1.096830
2457832.7572338 13.04 ± 0.06 0.70 ± 0.07 1.092831
Table A11. Photometric data of comet 41P/Tuttle–Giacobini–Kresak before perihelion (second part).
JDV B V r (au)
2457832.7595023 13.06 ± 0.06 0.71 ± 0.05 1.092822
2457832.8219444 12.80 ± 0.04 0.75 ± 0.04 1.092577
2457832.8237616 12.84 ± 0.03 0.87 ± 0.04 1.092570
2457833.7583681 12.93 ± 0.08 0.67 ± 0.07 1.088966
2457833.7605903 12.95 ± 0.06 0.65 ± 0.05 1.088958
2457833.8178000 12.84 ± 0.05 0.67 ± 0.09 1.088741
2457834.7974653 12.96 ± 0.06 0.60 ± 0.10 1.085112
2457834.7992940 12.96 ± 0.06 0.60 ± 0.10 1.085106
2457835.7561227 12.85 ± 0.11 0.70 ± 0.11 1.081701
2457835.7581713 12.85 ± 0.11 0.70 ± 0.11 1.081694
2457835.7983565 12.82 ± 0.03 0.67 ± 0.07 1.081554
2457835.8001505 12.82 ± 0.03 0.67 ± 0.07 1.081547
2457837.7593866 12.80 ± 0.06 0.52 ± 0.09 1.075028
2457837.7613426 12.81 ± 0.03 0.52 ± 0.09 1.075022
2457837.8017245 12.97 ± 0.07 0.59 ± 0.10 1.074894
2457837.8061921 12.97 ± 0.07 0.59 ± 0.10 1.074880
2457838.8079000 12.88 ± 0.01 0.58 ± 0.02 1.071786
2457844.7959375 12.76 ± 0.02 0.71 ± 0.05 1.056703
2457844.7977431 12.76 ± 0.02 0.71 ± 0.05 1.056700
2457846.6111227 12.11 ± 0.03 1.73 ± 0.68 1.053321
2457846.7121643 13.11 ± 0.01 0.53 ± 0.02 1.053150
2457847.8002660 12.60 ± 0.20 0.90 ± 0.20 1.051414
2457847.8029861 12.60 ± 0.20 0.90 ± 0.20 1.051410
2457849.7138600 12.78 ± 0.07 0.70 ± 0.10 1.048863
2457849.7161570 12.83 ± 0.07 0.70 ± 0.10 1.048860
2457851.5319900 12.82 ± 0.08 0.65 ± 0.08 1.047036
2457851.5340394 12.82 ± 0.08 0.65 ± 0.08 1.047035
2457853.8026790 12.93 ± 0.09 0.40 ± 0.10 1.045580
2457853.8061921 12.93 ± 0.09 0.40 ± 0.10 1.045579
2457854.8781000 13.02 ± 0.05 0.67 ± 0.04 1.045212
Table A12. Photometric data of comet 41P/Tuttle–Giacobini–Kresak after perihelion.
JDV B V r (au)
2457857.7941000 12.84 ± 0.04 0.61 ± 0.08 1.045255
2457857.7960000 12.92 ± 0.06 0.60 ± 0.05 1.045256
2457859.8030000 12.80 ± 0.03 0.48 ± 0.05 1.046171
2457863.7810300 12.77 ± 0.02 0.69 ± 0.08 1.050101
2457863.7826042 12.77 ± 0.02 0.69 ± 0.08 1.050103
2457864.8285000 12.92 ± 0.04 0.75 ± 0.07 1.051599
2457864.8300810 12.92 ± 0.04 0.75 ± 0.07 1.051602
2457865.7523000 12.90 ± 0.50 0.61 ± 0.08 1.053080
2457866.7573000 12.93 ± 0.02 0.76 ± 0.09 1.054858
2457866.7588773 12.93 ± 0.02 0.76 ± 0.09 1.054861
2457867.7593000 13.12 ± 0.03 0.67 ± 0.20 1.056803
2457867.7609028 13.12 ± 0.03 0.67 ± 0.20 1.056806
2457874.8396000 13.25 ± 0.02 0.59 ± 0.03 1.075324
2457874.8417000 13.28 ± 0.01 0.52 ± 0.03 1.075331
2457875.7599000 13.37 ± 0.06 0.69 ± 0.20 1.078326
2457875.7622917 13.37 ± 0.06 0.69 ± 0.20 1.078334
2457876.7542000 13.24 ± 0.03 0.82 ± 0.05 1.081716

Appendix A.12. 63P/Wild 1 (2013)

Figure A21. Overlaid histograms of the B V color for comet 63P/Wild 1 before and after perihelion. The vertical dotted line indicates the solar B V , and the legend distinguishes the “Before perihelion” and “After perihelion” samples.
Universe 12 00065 g0a21
Figure A22. Overlaid histograms of the V R color for comet 63P/Wild 1 before and after perihelion. The vertical dashed line indicates the solar V R , and the legend distinguishes the “Before perihelion” and “After perihelion” samples.
Universe 12 00065 g0a22

Appendix A.13. 168P/Hergenrother (2012)

Figure A23. Distributions of the B V and V R color indices for comet 168P/Hergenrother. The two histograms are overplotted, and vertical lines indicate the adopted solar colors ( B V = 0.642 as a dotted line and V R = 0.354 as a dashed line). The cometary coma remains systematically redder than the Sun in both indices over the observed interval.
Universe 12 00065 g0a23
Figure A24. Geocentric magnitudes B geo , V geo , and R geo of comet 168P/Hergenrother as a function of log 10 ( r ) , together with the corresponding weighted linear fits ( m geo = a + b log 10 r ) in each filter. The ordinate axis is inverted (brighter magnitudes upward). The similar slopes in B, V, and R show that the strong post-outburst fading is essentially achromatic within the sampled heliocentric range.
Universe 12 00065 g0a24
Table A13. Photometry of comet 168P/Hergenrother (Part 1).
JD B V V R Vr (au)
2456206.501262 0.71 ± 0.05 0.49 ± 0.02 10.73 ± 0.04 1.415715
2456206.543183 0.45 ± 0.06 10.81 ± 0.07 1.415730
2456206.577697 0.87 ± 0.01 0.52 ± 0.05 10.75 ± 0.04 1.415743
2456206.619387 0.84 ± 0.02 0.51 ± 0.04 10.84 ± 0.05 1.415758
2456206.660694 0.83 ± 0.05 0.44 ± 0.05 10.77 ± 0.06 1.415774
2456207.380012 0.74 ± 0.17 0.30 ± 0.19 10.65 ± 0.09 1.416068
2456207.420324 0.78 ± 0.10 0.50 ± 0.02 10.76 ± 0.06 1.416086
2456207.461910 0.89 ± 0.07 0.52 ± 0.03 10.57 ± 0.06 1.416105
2456207.506690 0.89 ± 0.07 0.44 ± 0.06 10.74 ± 0.07 1.416125
2456208.480162 0.82 ± 0.02 0.50 ± 0.03 10.86 ± 0.03 1.416609
2456208.570312 0.83 ± 0.02 0.47 ± 0.01 10.93 ± 0.03 1.416658
2456208.620613 0.79 ± 0.05 0.52 ± 0.01 10.94 ± 0.04 1.416686
2456208.639838 0.88 ± 0.05 0.47 ± 0.01 10.92 ± 0.03 1.416696
2456208.681782 0.86 ± 0.04 0.49 ± 0.03 10.97 ± 0.05 1.416720
2456209.453252 0.89 ± 0.08 0.49 ± 0.04 11.16 ± 0.09 1.417178
2456209.493912 0.76 ± 0.03 0.48 ± 0.03 11.30 ± 0.10 1.417203
2456209.535451 0.85 ± 0.03 0.54 ± 0.03 11.30 ± 0.20 1.417229
2456209.576956 0.90 ± 0.08 0.48 ± 0.03 11.00 ± 0.10 1.417256
2456209.619016 0.78 ± 0.02 0.56 ± 0.03 11.10 ± 0.10 1.417283
2456210.297396 0.70 ± 0.10 0.59 ± 0.03 11.01 ± 0.08 1.417739
2456210.381435 0.90 ± 0.30 0.50 ± 0.10 10.89 ± 0.05 1.417799
2456210.421725 0.81 ± 0.06 1.417827
2456210.463727 0.79 ± 0.08 0.46 ± 0.06 10.91 ± 0.03 1.417857
2456210.546146 0.85 ± 0.07 10.97 ± 0.09 1.417917
2456210.554653 0.99 ± 0.08 0.50 ± 0.05 11.03 ± 0.09 1.417923
2456210.587986 1.30 ± 0.08 0.34 ± 0.08 10.95 ± 0.04 1.417947
2456210.719495 0.95 ± 0.03 11.57 ± 0.05 1.418044
2456211.623866 0.80 ± 0.10 0.52 ± 0.03 11.13 ± 0.08 1.418750
2456211.644421 0.90 ± 0.20 0.48 ± 0.04 11.10 ± 0.08 1.418767
Notes: “−” indicates no measurement available.
Table A14. Photometry of comet 168P/Hergenrother (Part 2).
JD B V V R Vr (au)
2456211.665440 0.90 ± 0.10 0.46 ± 0.04 11.04 ± 0.05 1.418785
2456214.634282 0.86 ± 0.09 0.54 ± 0.06 11.45 ± 0.08 1.421625
2456214.670231 0.91 ± 0.02 0.47 ± 0.02 11.34 ± 0.04 1.421664
2456214.838576 0.81 ± 0.02 0.48 ± 0.01 11.38 ± 0.04 1.421849
2456215.588704 0.81 ± 0.05 0.43 ± 0.01 11.43 ± 0.03 1.422704
2456215.671123 0.73 ± 0.07 0.31 ± 0.09 11.36 ± 0.06 1.422800
2456215.795868 0.82 ± 0.33 0.43 ± 0.02 11.47 ± 0.03 1.422948
2456215.821053 0.83 ± 0.04 0.43 ± 0.03 11.45 ± 0.04 1.422978
2456215.838808 1.17 ± 0.28 0.48 ± 0.12 11.45 ± 0.07 1.422999
2456216.516863 0.81 ± 0.15 0.43 ± 0.02 11.67 ± 0.06 1.423829
2456216.613750 0.78 ± 0.05 0.27 ± 0.03 11.21 ± 0.02 1.423951
2456221.553380 1.20 ± 0.30 0.40 ± 0.03 12.50 ± 0.20 1.431243
2456221.638299 0.49 ± 0.04 0.49 ± 0.02 12.60 ± 0.10 1.431387
2456221.678947 0.78 ± 0.03 12.91 ± 0.08 1.431456
2456226.932296 1.20 ± 0.10 13.85 ± 0.07 1.441550
2456226.934792 1.00 ± 0.07 0.52 ± 0.02 14.70 ± 0.10 1.441555
2456229.612315 0.77 ± 0.11 0.65 ± 0.12 12.80 ± 0.16 1.447582
2456229.612581 0.69 ± 0.09 0.66 ± 0.06 12.78 ± 0.13 1.447582
2456229.651181 0.70 ± 0.04 0.63 ± 0.14 12.40 ± 0.33 1.447674
2456229.692917 0.87 ± 0.18 0.60 ± 0.16 12.34 ± 0.51 1.447772
2456229.694560 0.78 ± 0.41 1.08 ± 0.59 11.73 ± 0.79 1.447776
2456229.736146 0.73 ± 0.22 1.42 ± 0.48 11.31 ± 0.73 1.447875
2456229.776100 1.05 ± 0.48 0.44 ± 0.05 12.47 ± 0.24 1.447969
2456229.777720 0.92 ± 0.11 0.96 ± 0.20 1.447973
2456229.825405 0.85 ± 0.24 0.47 ± 0.02 12.56 ± 0.18 1.448087
2456234.548611 0.68 ± 0.07 0.47 ± 0.03 12.67 ± 0.06 1.460205
2456235.673773 0.79 ± 0.07 0.54 ± 0.06 12.74 ± 0.05 1.463350
2456235.796771 0.80 ± 0.09 0.51 ± 0.04 12.77 ± 0.07 1.463699
2456235.838495 0.68 ± 0.05 0.55 ± 0.06 12.76 ± 0.07 1.463818
Notes: “−” indicates no measurement available.

References

  1. Hughes, D.W. Cosomolgy: Coloured comets. Nature 1984, 309, 407. [Google Scholar] [CrossRef] [Scilit]
  2. Arpigny, C. Spectra of Comets and Their Interpretation. Annu. Rev. Astron. Astrophys. 1965, 3, 351. [Google Scholar] [CrossRef] [Scilit]
  3. Moro, D.; Munari, U. The Asiago Database on Photometric Systems (ADPS). I. Census parameters for 167 photometric systems. Astron. Astrophys. Suppl. Ser. 2000, 147, 361–628. [Google Scholar] [CrossRef] [Scilit]
  4. Meech, K.J.; Svoren, J. Using cometary activity to trace the physical and chemical evolution of cometary nuclei. In Comets II; Festou, M.C., Keller, H.U., Weaver, H.A., Eds.; University of Arizona Press: Tucson, AZ, USA, 2004; p. 317. [Google Scholar]
  5. Spinrad, H. Observations of the red auroral oxygen lines in nine comets. PASP 1982, 94, 1008–1016. [Google Scholar] [CrossRef] [Scilit]
  6. DiSanti, M.A.; Bonev, B.P.; Gibb, E.L.; Paganini, L.; Villanueva, G.L.; Mumma, M.J.; Keane, J.V.; Blake, G.A.; Dello Russo, N.; Meech, K.J.; et al. En Route to Destruction: The Evolution in Composition of Ices in Comet D/2012 S1 (ISON) between 1.2 and 0.34 AU from the Sun as Revealed at Infrared Wavelengths. Astrophys. J. 2016, 820, 34. [Google Scholar] [CrossRef] [Scilit]
  7. Hartmann, W.K.; Cruikshank, D.P. Comet color changes with solar distance. Icarus 1984, 57, 55–62. [Google Scholar] [CrossRef] [Scilit]
  8. Jewitt, D.; Meech, K.J. The Absence of a Color-Distance Trend in Comets. Astron. J. 1988, 96, 1723. [Google Scholar] [CrossRef] [Scilit]
  9. Ney, E.P. Multiband Photometry of Comets Kohoutek, Bennett, Bradfield, and Encke. Icarus 1974, 23, 551–560. [Google Scholar] [CrossRef] [Scilit]
  10. Betzler, A.S.; Almeida, R.S.; Cerqueira, W.J.; Araujo, L.A.; Prazeres, C.J.M.; Jesus, J.N.; Bispo, P.A.S.; Andrade, V.B.; Freitas, Y.A.S.; Betzler, L.B.S. An analysis of the BVRI colors of 22 active comets. Adv. Space Res. 2017, 60, 612–625. [Google Scholar] [CrossRef] [Scilit]
  11. Betzler, A.S.; de Sousa, O.F.; Diepvens, A.; Bettio, T.M. BVR photometry of comets 63P/Wild 1 and C/2012 K1 (PANSTARRS). Astrophys. Space Sci. 2020, 365, 102. [Google Scholar] [CrossRef] [Scilit]
  12. Mazzotta Epifani, E.; Palumbo, P.; Capria, M.T.; Cremonese, G.; Fulle, M.; Colangeli, L. The distant activity of short-period comets-I. Mon. Not. R. Astron. Soc. 2007, 381, 713–722. [Google Scholar] [CrossRef] [Scilit]
  13. Warner, B.D. Initial Results of a Dedicated H-G Project. Minor Planet Bull. 2007, 34, 113–119. [Google Scholar]
  14. Astropy Collaboration; Robitaille, T.P.; Tollerud, E.J.; Greenfield, P.; Droettboom, M.; Bray, E.; Aldcroft, T.; Davis, M.; Ginsburg, A.; Price-Whelan, A.M.; et al. Astropy: A community Python package for astronomy. Astron. Astrophys. Suppl. Ser. 2013, 558, A33. [Google Scholar] [CrossRef] [Scilit]
  15. Spearman, C. The proof and measurement of association between two things. Am. J. Psychol. 1904, 15, 72–101. [Google Scholar] [CrossRef] [Scilit]
  16. Kendall, M.G.; Gibbons, J.D. Rank Correlation Methods, 5th ed.; Edward Arnold: Encino, CA, USA, 1990. [Google Scholar]
  17. Sen, P.K. Estimates of the regression coefficient based on Kendall’s tau. J. Am. Stat. Assoc. 1968, 63, 1379–1389. [Google Scholar] [CrossRef]
  18. Mann, H.B.; Whitney, D.R. On a test of whether one of two random variables is stochastically larger than the other. Ann. Math. Stat. 1947, 18, 50–60. [Google Scholar] [CrossRef] [Scilit]
  19. Holmberg, J.; Flynn, C.; Portinari, L. The colours of the Sun. Mon. Not. R. Astron. Soc. 2006, 367, 449–453. [Google Scholar] [CrossRef] [Scilit]
  20. Bakos, G.A. Photoelectric Observations of Comet Bennett. JRASC 1973, 67, 183. [Google Scholar]
  21. Betzler, A.S.; de Sousa, O.F. Photometric BVR observations of comet C/2012 J1 (Catalina) before and after perihelion. Astron. Nachrichten 2023, 344, e20220084. [Google Scholar] [CrossRef] [Scilit]
  22. Betzler, A.S.; de Sousa, O.F.; Betzler, L.B.S. Photometric Study of Comet C/2014 S2 (PANSTARRS) After the Perihelion. Earth Moon Planets 2018, 122, 53–71. [Google Scholar] [CrossRef] [Scilit]
  23. Ahuja, G.; Aravind, K.; Ganesh, S.; Hmiddouch, S.; Donckt, M.V.; Jehin, E.; Sahu, D.; Sivarani, T. Long-term monitoring of a dynamically new comet C/2020 V2 (ZTF). Mon. Not. R. Astron. Soc. 2025, 543, 1178–1195. [Google Scholar] [CrossRef] [Scilit]
  24. Grothues, H.G. Photometry and direct imaging of comet P/Faye 1991 XXI. Planet. Space Sci. 1996, 44, 625–635. [Google Scholar] [CrossRef] [Scilit]
  25. Vsekhsvyatskii, S.K. Physical Characteristics of Comets; Israel Program for Scientific Translations: Jerusalem, Israel, 1964. [Google Scholar]
  26. Ferrín, I. Secular light curve of Comet 28P/Neujmin 1 and of spacecraft target Comets 1P/Halley, 9P/Tempel 1, 19P/Borrelly, 21P/Giacobinni Zinner, 26P/Grigg Skjellerup, 67P/Churyumov Gerasimenko, and 81P/Wild 2. Icarus 2005, 178, 493–516. [Google Scholar] [CrossRef] [Scilit]
  27. Levison, H.F. Comet Taxonomy. In Completing the Inventory of the Solar System; Rettig, T., Hahn, J.M., Eds.; Astronomical Society of the Pacific Conference Series; Astronomical Society of the Pacific: San Francisco, CA, USA, 1996; Volume 107, pp. 173–191. [Google Scholar]
  28. Migach, I.E.; Shiper, N.M. Study of the spectrum of comet Bennett 1969 i. Probl. Kosm. Fiz. 1976, 11, 122–125. [Google Scholar]
  29. Ivanova, O.V.; Dlugach, J.M.; Afanasiev, V.L.; Reshetnyk, V.M.; Korsun, P.P. CCD polarimetry of distant comets C/2010 S1 (LINEAR) and C/2010 R1 (LINEAR) at the 6-m telescope of the SAO RAS. Planet. Space Sci. 2015, 118, 199–210. [Google Scholar] [CrossRef] [Scilit]
  30. Yang, B.; Keane, J.; Meech, K.; Owen, T.; Wainscoat, R. Multi-wavelength Observations of Comet C/2011 L4 (Pan-STARRS). Astrophys. J. Lett. 2014, 784, L23. [Google Scholar] [CrossRef] [Scilit]
  31. Rosenbush, V.; Ivanova, A.; Kiselev, N.; Afanasiev, V.; Kolesnikov, S.; Shakhovskoy, D. Linear and circular polarimetry of recent comets: Observational results for eight comets. In Asteroids, Comets, Meteors 2014; Helsinki University Printing House: Helsinki, Finland, 2014; p. 450. [Google Scholar]
  32. Ivanova, O.; Shubina, O.; Moiseev, A.; Afanasiev, V. Polarimetric and spectroscopic observations of a dynamically new comet C/2012 J1 (Catalina). Astrophys. Bull. 2015, 70, 349–354. [Google Scholar] [CrossRef] [Scilit]
  33. Woodward, C.E.; Kelley, M.S.P.; Harker, D.E.; Ryan, E.L.; Wooden, D.H.; Sitko, M.L.; Russell, R.W.; Reach, W.T.; de Pater, I.; Kolokolova, L.; et al. SOFIA Infrared Spectrophotometry of Comet C/2012 K1 (Pan-STARRS). ApJ 2015, 809, 181. [Google Scholar] [CrossRef] [Scilit]
  34. Roth, N.X.; Gibb, E.L.; Bonev, B.P.; DiSanti, M.A.; Mumma, M.J.; Villanueva, G.L.; Paganini, L. The Composition of Comet C/2012 K1 (PanSTARRS) and the Distribution of Primary Volatile Abundances among Comets. Astron. J. 2017, 153, 168. [Google Scholar] [CrossRef] [Scilit]
  35. Moreno, F.; Pozuelos, F.; Aceituno, F.; Casanova, V.; Duffard, R.; López-Moreno, J.J.; Molina, A.; Ortiz, J.L.; Santos-Sanz, P.; Sota, A.; et al. On the Dust Environment of Comet C/2012 S1 (ISON) from 12 AU Pre-perihelion to the End of its Activity around Perihelion. ApJ 2014, 791, 118. [Google Scholar] [CrossRef] [Scilit]
  36. Opitom, C.; Jehin, E.; Manfroid, J.; Hutsemékers, D.; Gillon, M.; Magain, P. TRAPPIST photometry and imaging monitoring of comet C/2013 R1 (Lovejoy): Implications for the origin of daughter species. Astron. Astrophys. Suppl. Ser. 2015, 584, A121. [Google Scholar] [CrossRef] [Scilit]
  37. Shinnaka, Y.; Kawakita, H.; Kondo, S.; Ikeda, Y.; Kobayashi, N.; Hamano, S.; Sameshima, H.; Fukue, K.; Matsunaga, N.; Yasui, C.; et al. Near-infrared Spectroscopic Observations of Comet C/2013 R1 (Lovejoy) by WINERED: CN Red-system Band Emission. Astron. J. 2017, 154, 45. [Google Scholar] [CrossRef] [Scilit]
  38. Urasaki, C.; Meech, K.; Keane, J.; Weryk, R.; Bauer, J.; Bufanda, E.; Kleyna, J.; Wainscoat, R.; Schleicher, D.; Cochran, A.; et al. Activity of comet C/2014 S2 (PANSTARRS). In AAS/Division for Planetary Sciences Meeting Abstracts #54; AAS/Division for Planetary Sciences Meeting Abstracts; American Astronomical Society: Washington, DC, USA, 2022; Volume 54, p. 101.07. [Google Scholar]
  39. Jehin, E.; Vander Donckt, M.; Manfroid, J.; Hmiddouch, S.; Moulane, Y.; Jabiri, A.; Benkhaldoun, Z. TRAPPIST comets production rates: C/2022 E3 (ZTF), C/2022 A2 (PANSTARRS), C/2022 U2 (ATLAS), C/2020 V2 (ZTF), C/2021 Y1 (ATLAS), 118P, 81P, and 73P/SW-3. Astron. Telegr. 2022, 15822, 1. [Google Scholar]
  40. Jehin, E.; Moulane, Y.; Manfroid, J.; Donckt, M.V.; Pozuelos, F.; Ferrais, M.; Hutsemekers, D. TRAPPIST comet production rates: 19P/Borrelly, 67P/C-G, 104P/Kowal 2, C/2019 L3 (ATLAS), and C/2021 A1 (Leonard). Astron. Telegr. 2022, 15186, 1. [Google Scholar]
  41. Ochner, P.; Manzini, F.; Oldani, V.; Farina, A.; Reguitti, A.; Andreoli, V.; Mura, A.C.; Albanese, I.; Fiaccadori, L.; Mocellin, G.; et al. ASIACO: Asiago Spectroscopy and Imaging Atlas of COmets. arXiv 2025, arXiv:2505.02988. [Google Scholar] [CrossRef] [Scilit]
  42. A’Hearn, M.F.; Vanysek, V. IHW COMET HALLEY PHOTOMETRIC MAGNITUDES, V2.0, 2006. IHW-C-PPMAG-3-RDR-HALLEY-V2.0. Available online: https://data.nasa.gov/dataset/ihw-comet-halley-photometric-magnitudes-v2-0 (accessed on 13 December 2025).
  43. Kiselev, N.; Shubina, E.; Velichko, S.; Jockers, K.; Rosenbush, V.; Kikuchi, S. Compilation of Comet Polarimetry from Published and Unpublished Sources; urn:nasa:pds:compil-comet:polarimetry::1.0; NASA Planetary Data System: Pasadena, CA, USA, 2017. [Google Scholar]
  44. Rosenbush, V.K. Opposition Effects in Brightness, Color, and Polarization of Comet 1P/Halley: Comparison with Atmosphereless Solar System Bodies. Sol. Syst. Res. 2005, 39, 312–321. [Google Scholar] [CrossRef] [Scilit]
  45. Sen, A.K.; Deshpande, M.R.; Joshi, U.C.; Rao, N.K.; Raveendran, A.V. Polarimetry of Comet P/Halley-Properties of dust. Astron. Astrophys. Suppl. Ser. 1991, 242, 496–502. [Google Scholar]
  46. Mazets, E.P.; Sagdeev, R.Z.; Aptekar, R.L.; Golenetskii, S.V.; Guryan, Y.A.; Dyachkov, A.V.; Ilyinskii, V.N.; Panov, V.N.; Petrov, G.G.; Savvin, A.V.; et al. Dust in Comet p/ Halley from VEGA Observations. A&A 1987, 187, 699. [Google Scholar]
  47. Sarugaku, Y.; Ishiguro, M.; Pyo, J.; Miura, N.; Nakada, Y.; Usui, F.; Ueno, M. Detection of a Long-Extended Dust Trail Associated with Short-Period Comet 4P/Faye in 2006 Return. Publ. Astron. Soc. JPN 2007, 59, L25. [Google Scholar] [CrossRef] [Scilit]
  48. Luk’yanyk, I.; Zubko, E.; Husárik, M.; Ivanova, O.; SvoreÅ, J.; Kochergin, A.; Baransky, A.; Videen, G. Rapid variations of dust colour in comet 41P/Tuttle-Giacobini-Kresák. Mon. Not. R. Astron. Soc. 2019, 485, 4013–4023. [Google Scholar] [CrossRef] [Scilit]
  49. Shubina, O.; Ivanova, O. Quasi-simultaneous observations of comet 41P/Tuttle-Giacobini-Kresak in 2017 apparition. In EPSC-DPS Joint Meeting 2025; Copernicus Publications: Göttingen, Germany, 2025; Volume 2025, p. EPSC–DPS2025–281. [Google Scholar] [CrossRef] [Scilit]
  50. Lamy, P.L.; Toth, I.; Weaver, H.A.; A’Hearn, M.F.; Jorda, L. Properties of the nuclei and comae of 13 ecliptic comets from Hubble Space Telescope snapshot observations. Astron. Astrophys. Suppl. Ser. 2009, 508, 1045–1056. [Google Scholar] [CrossRef] [Scilit]
  51. Sekanina, Z. Temporal Correlation Between Outbursts and Fragmentation Events of Comet 168P/Hergenrother. arXiv 2014, arXiv:1409.7641. [Google Scholar] [CrossRef] [Scilit]
  52. Pierce, D.M.; Cochran, A.L. Examination of Fragment Species in the Comae of Several Comets Using an Integral Field Unit Spectrograph. Planet. Sci. J. 2021, 2, 19. [Google Scholar] [CrossRef] [Scilit]
Figure 1. Geocentric magnitudes V geo and B geo for C/2014 S2 (PANSTARRS) as a function of log r , with weighted linear fits overplotted.
Universe 12 00065 g001
Figure 2. Distribution of the B V color index for C/2014 S2 (PANSTARRS). The vertical dotted line marks the solar color B V = 0.642 .
Universe 12 00065 g002
Table 2. Concise summary of the main color–distance outcomes for each comet. Sample properties (dynamical class, q, coverage, r range, epoch, and provenance) are given in Table 1.
CometGroup U B B V V R R I Key Result (One Line)
C/1969 Y1 (Bennett)IG0n/an/aSignificant relation confined to U B ; B V consistent with flat.
C/2012 K1 (PANSTARRS)In/aG0n/a B V shows a robust monotonic trend; V R remains approximately constant.
4P/FayeIn/aG 0n/aOnly a marginal pre-perihelion gradient in B V ; trend not sustained post-perihelion.
1P/HalleyIn/aSGn/a V R reddens with increasing r; B V shows a significant pre-/post-level shift.
C/2010 S1 (LINEAR)In/aG+SG+Sn/aPost-perihelion branch dominates with a significant trend; measurable median-color offset across perihelion.
63P/Wild 1IIn/a0Sn/aNo robust monotonic trend within branches; V R shifts from redder (pre) to near-solar (post).
C/2013 R1 (Lovejoy)IIn/a0Sn/aStep-like change in V R across perihelion; no robust monotonic trends within branches.
C/2020 V2 (ZTF)IIn/a00SStep isolated in R I (redder post-perihelion); B V and V R nearly constant on both sides.
C/2012 S1 (ISON)IIIn/a00n/aNo significant monotonic trends; colors remain stable within uncertainties.
C/2014 S2 (PANSTARRS)IIIn/a00n/aNo significant monotonic trends; persistently redder-than-solar indices within uncertainties.
C/2012 J1 (Catalina)IIIn/an/a0n/aNo significant color–distance trends; B–R is redder-than-solar, while V–R is nearly solar.
C/2011 L4 (PANSTARRS)IIIn/a00n/aNo significant monotonic trends; weak trends, if any, not robust.
168P/HergenrotherIIIn/a00n/aNo significant monotonic trends in the covered branch; stable colors within uncertainties.
41P/Tuttle–Giacobini–KresákIIIn/a00n/aNo significant monotonic trends; colors broadly stable within uncertainties.
Notes. Group I = “gradient comets” (monotonic trend present in at least one index); Group II = “step comets” (no robust monotonic trend within branches, but a significant pre-/post-level shift); Group III = “flat comets” (no significant monotonic trends and no step within uncertainties). Codes: G = significant monotonic color–r trend (rank tests + robust slope consistent with a non-zero trend); S = significant pre-/post-level shift (Mann–Whitney); 0 = no significant trend/shift; n/a = index not available/used for that comet. Marginal significance as discussed in the text.
Disclaimer/Publisher’s Note: The statements, opinions and data contained in all publications are solely those of the individual author(s) and contributor(s) and not of MDPI and/or the editor(s). MDPI and/or the editor(s) disclaim responsibility for any injury to people or property resulting from any ideas, methods, instructions or products referred to in the content.