Article

Research on Removing Thin Cloud Interference in Solar Flare Monitoring with SMAT-Configured Telescopes

1
State Key Laboratory of Solar Activity and Space Weather, National Astronomical Observatories, Chinese Academy of Sciences, Beijing 100101, China
2
University of Chinese Academy of Sciences, Beijing 100049, China
*
Authors to whom correspondence should be addressed.
Universe 2025, 11(9), 282; https://doi.org/10.3390/universe11090282
Submission received: 26 April 2025 / Revised: 24 July 2025 / Accepted: 14 August 2025 / Published: 22 August 2025
(This article belongs to the Section Solar and Stellar Physics)

Abstract

The precise monitoring of solar flares holds significant scientific value for space mission safety, communication security, and space environment forecasting. The H α line has long been utilized as a tool to extract information about the structure and dynamics of the solar chromosphere and is crucial for observing solar activities such as prominences and flares. However, ground-based H α observations are susceptible to cloud interference, which significantly reduces data reliability and complicates the effective separation of genuine flare signals from cloud modulation effects. To address this challenge, our study proposes a dual-band brightness ratio method tailored to the SMAT configuration, leveraging synchronous observation data from the Huairou SMAT at two wavelengths (photospheric 5324 Å and chromospheric 6562.8 Å). Observational data validation demonstrates that this method can effectively characterize true chromospheric brightness variations. In real observational data, the reconstructed brightness curve successfully recovered the brightness peak of an M1.5 class flare, with the peak position aligning well with the X-ray flux peak. This method enhances the accuracy of flare monitoring under cloudy conditions for SMAT, providing a promising pathway for high-reliability ground-based solar activity observations with this telescope.

1. Introduction

As the closest star to the Earth, the Sun’s activities have far reaching impacts on the Earth’s climate, space environment, and human society. A solar flare is a powerful electromagnetic radiation burst event, and the energy it releases is equivalent to that of billions of one-megaton nuclear bombs exploding simultaneously. These high-energy particles and electromagnetic waves spread out in all directions at extremely high speeds. When they reach the Earth, they have a significant impact on the Earth’s magnetic field, ionosphere, and the entire geomagnetic environment. For example, intense solar winds may cause satellite orbit deviations, damage to electronic devices, and interference with radio communications, and even lead to serious consequences such as power grid failures [1]. Therefore, accurate prediction and real-time monitoring of solar flare activities are of great significance for ensuring spaceflight safety, protecting communication facilities, and maintaining a country’s critical infrastructure.
The H α line is the first spectral line of the hydrogen Balmer series. It corresponds to the light emitted or absorbed when an electron makes a transition between the n = 3 energy level and the n = 2 energy level. Its wavelength is approximately 6562.8 Å, and it is one of the deepest and widest spectral lines in the solar visible spectrum. The H α line has long been used as a tool to extract information about the solar chromospheric structure and dynamics, and it is an important means of observing solar activities such as prominences and flares. The first observation of this spectral line can be traced back to 1869, carried out by Janssen [2] and Lockyer and Frankland [3]. It was not until 1904, with the invention of the spectroheliograph (SHG) and the popularization of photographic technology in daily use, that H α observations could be carried out more extensively.
However, ground-based H α observations are easily affected by the Earth’s atmosphere, which is very unfavorable for flare monitoring and forecasting. The impacts of the atmosphere on solar observations mainly include atmospheric scattering, refraction, absorption, turbulence, and the influence of various weather conditions [4]. Among them, the influence of some weather conditions, such as clouds, is the most significant. Clouds can block or weaken sunlight, seriously affecting the quality of observations [5]. Clouds not only contaminate the structural information in solar images but also change the image brightness, thus causing difficulties in the identification and analysis of flares. This is especially severe when thick clouds block the view, often resulting in the complete loss of solar structural information in the images. Although some means can be used to mitigate the influence of clouds, the characteristics of the processed solar images differ from those of the original images. In contrast, thin cloud occlusion does not completely mask the information in the images, and its impact on the images is relatively small. Therefore, the solar structure can be well restored through appropriate cloud removal methods. However, traditional methods such as homomorphic filtering [6,7], wavelet transform [8,9], and median filtering [10] have obvious limitations. For example, both homomorphic filtering and wavelet transform are based on the principle of frequency domain decomposition, achieving the effect of cloud removal by designing high pass filters to suppress low frequency cloud information. Median filtering belongs to spatial domain nonlinear filtering, where the central pixel value is replaced by the median value of neighboring pixels in a sliding window. Median filtering is sensitive to local statistical characteristics and may mix and smooth the small bright spots of flares with cloud noise. When using the above methods for cloud removal, the de-clouded images will lose some flare information, and the image brightness is changed, failing to reflect the real image brightness changes caused by flares. In general, the above mentioned traditional methods have difficulty distinguishing the differences in brightness changes caused by clouds and flares, and due to the complexity of the algorithms, it is difficult for them to meet the requirements of real-time monitoring.
Solar flares are caused by the sudden release of magnetic energy in the solar atmosphere [11,12]. In rare cases, apart from the enhanced spectral lines formed in the chromosphere and above, solar flares may also exhibit enhanced emission in the visible light continuous spectrum. These flares are referred to as white light flares (WLFs) [13,14]. Since the first observations of WLFs by Carrington (1859) [15] and Hodgson (1859) [16], the number of such events recorded in the literature has been very small compared to the total number of solar flares [17,18]. Moreover, solar activities do not cause significant changes in the solar constant value [19]. Therefore, it can be considered that under normal circumstances, there will be no obvious change in the brightness of the solar photosphere during a flare. Considering that the Solar Magnetic and Activity Telescope (SMAT) has adjacent chromospheric and photospheric telescopes as shown in Figure 1, where the blue arrow points to the chromospheric telescope and the orange arrow points to the photospheric telescope, we propose the hypothesis that the modulation effect of thin clouds on the brightness of the dual-band observation images of the SMAT is consistent.
In summary, this study leverages the special design of the SMAT to overcome the limitations of traditional cloud removal methods. Based on the hypothesis that the modulation effect of clouds on the brightness of the SMAT’s dual-band observation images is consistent, and considering the characteristic that the photospheric brightness does not change significantly during a flare under normal circumstances, a cloud removal method based on the dual-band brightness ratio of the SMAT configuration is proposed.
This paper describes the instruments and data used in our study in Section 2. In Section 3, we propose the hypothesis that the modulation effect of clouds on the brightness of SMAT dual-band observation images is consistent, and introduce a method for removing the influence of thin clouds on the brightness variation observed during SMAT flare monitoring. In Section 4, we validate the reasonableness of the above hypothesis using SMAT observational data, and apply the proposed method to an M1.5 class flare event observed by SMAT. The resulting chromospheric brightness curves with cloud effects removed are presented. Finally, Section 5 provides a discussion and future perspectives.

2. Data

2.1. Instruments

In this study, the simultaneous measurement image data of the solar photosphere and chromosphere were obtained from the Solar Magnetic and Activity Telescope (SMAT) [20] at the Huairou Solar Observing Station (HSOS) of the National Astronomical Observatories, Chinese Academy of Sciences.
The SMAT was put into use at the end of 2005 and consists of two adjacent telescopes. One is used to measure the full disk vector magnetic field of the photosphere, and the other is for full-diskH α chromospheric observations. The full-disk H α telescope operates at a working wavelength of 6562.81 Å, with an aperture size of 20 cm. The bandwidth of the filter is 1/4 Å, and the central wavelength can be adjusted within the range of ±2 Å around the center of the H α spectral line. The CCD camera has a size of 2029 × 2044 pixels, and the spatial resolution is higher than 2 arcseconds. The central wavelength of the filter of the full-disk magnetic field telescope is 5324.19 Å, with a bandwidth of 0.1 Å, and the adjustable range of the central wavelength is ±0.5 Å. Its CCD camera has a size of 992 × 1004 pixels, and the spatial resolution is higher than 5 arcseconds. To conduct a synchronous study on the relationship between the global magnetic field and solar activities, the SMAT is placed with the two telescopes on the same mount. We used the SMAT to synchronously acquire the observational image data of the photosphere (5324 Å) and chromosphere (6562.8 Å), with a time resolution of up to 12 s and an exposure time of 20 ms.

2.2. Data Preprocess

We obtained synchronous image data of the chromosphere and photosphere from the SMAT between 07:26 and 07:52 UTC on 3 July 2024. The time resolution was 12 s, and the exposure time was 20 ms. The time difference between the acquisitions of the two band images was less than 30 ms, confirming a high degree of synchronization between the two SMATs. An M1.5 class solar flare occurred during this observation period. We preprocessed the original data, the steps are shown in Figure 2 and as follows:
  • Convert the image data into grayscale images.
  • Align the images using correlation.
  • Use the Canny edge detection algorithm [21] and the Hough Transform algorithm [22] to identify the solar disk and remove the non-solar parts from the images.
  • Extract the flare-occurring regions from the photospheric and chromospheric images (with the same extraction area).
After preprocessing, we use the flare region with a size of approximately 6 × 6 to calculate the brightness.

3. Methods

Methods for Removing the Influence of Thin Clouds on SMAT

The impacts of the atmosphere on solar observations mainly include atmospheric scattering, refraction, absorption, turbulence, and the influences of various weather conditions. Among them, the influence of some weather conditions, such as clouds, is the most significant. Clouds can block or weaken sunlight, seriously affecting the quality of observations. Since thick clouds can partially or completely obscure the sun, the observed signal cannot be effectively restored. Therefore, we only consider the situation of thin clouds. Thin clouds generally cover a large area and change relatively slowly, and they exhibit low-frequency characteristics in the frequency domain of images.
Based on the dual-band synchronous observation system of the SMAT, we use the 5324 Å band to observe the photosphere and the 6562.8 Å band to observe the chromosphere. Moreover, the fields of view of the two telescopes highly overlap. So, we establish a model for the influence of thin clouds. Assuming that the modulation effect of the cloud layer on the brightness of the two bands is consistent, the brightness of the observed image can be expressed as follows:
P T ( t ) = P ( t ) · T P ( t )
C T ( t ) = C ( t ) · T C ( t )
Among them, P ( t ) and C ( t ) represent the intrinsic brightness of the photosphere and chromosphere under cloud-free conditions, respectively. The modulation effects of the cloud layer on the brightness of the chromospheric image and the photospheric image are T C ( t ) and T P ( t ) , respectively. Then the brightness changes of the photosphere and chromosphere monitored in the presence of clouds are P T ( t ) and C T ( t ) . By comparing the observed brightness changes of the photosphere and chromosphere, we obtain the following:
F ( t ) = C T ( t ) P T ( t ) = C ( t ) · T C ( t ) P ( t ) · T P ( t )
T C ( t ) T P ( t ) = C 1
he obtained F ( t ) is the ratio of C ( t ) to P ( t ) . Under the conditions that the ratio of the thin cloud modulation functions is constant and the photospheric brightness is stable during solar flares, the function is simplified to
F ( t ) = C 1 C 2 · C ( t ) = C 3 · C ( t )
C 1 , C 2 , and C 3 are constants. In a solar flare event, F ( t ) is only linearly related to the intrinsic chromospheric brightness C ( t ) , which effectively eliminates the interference of thin clouds and accurately restores the chromospheric brightness changes caused by the solar flare.

4. Results

Validation of SMAT Observed Data

In Section 3, we propose the hypothesis that thin clouds affect the brightness of both photospheric and chromospheric images observed by SMAT in a consistent manner.
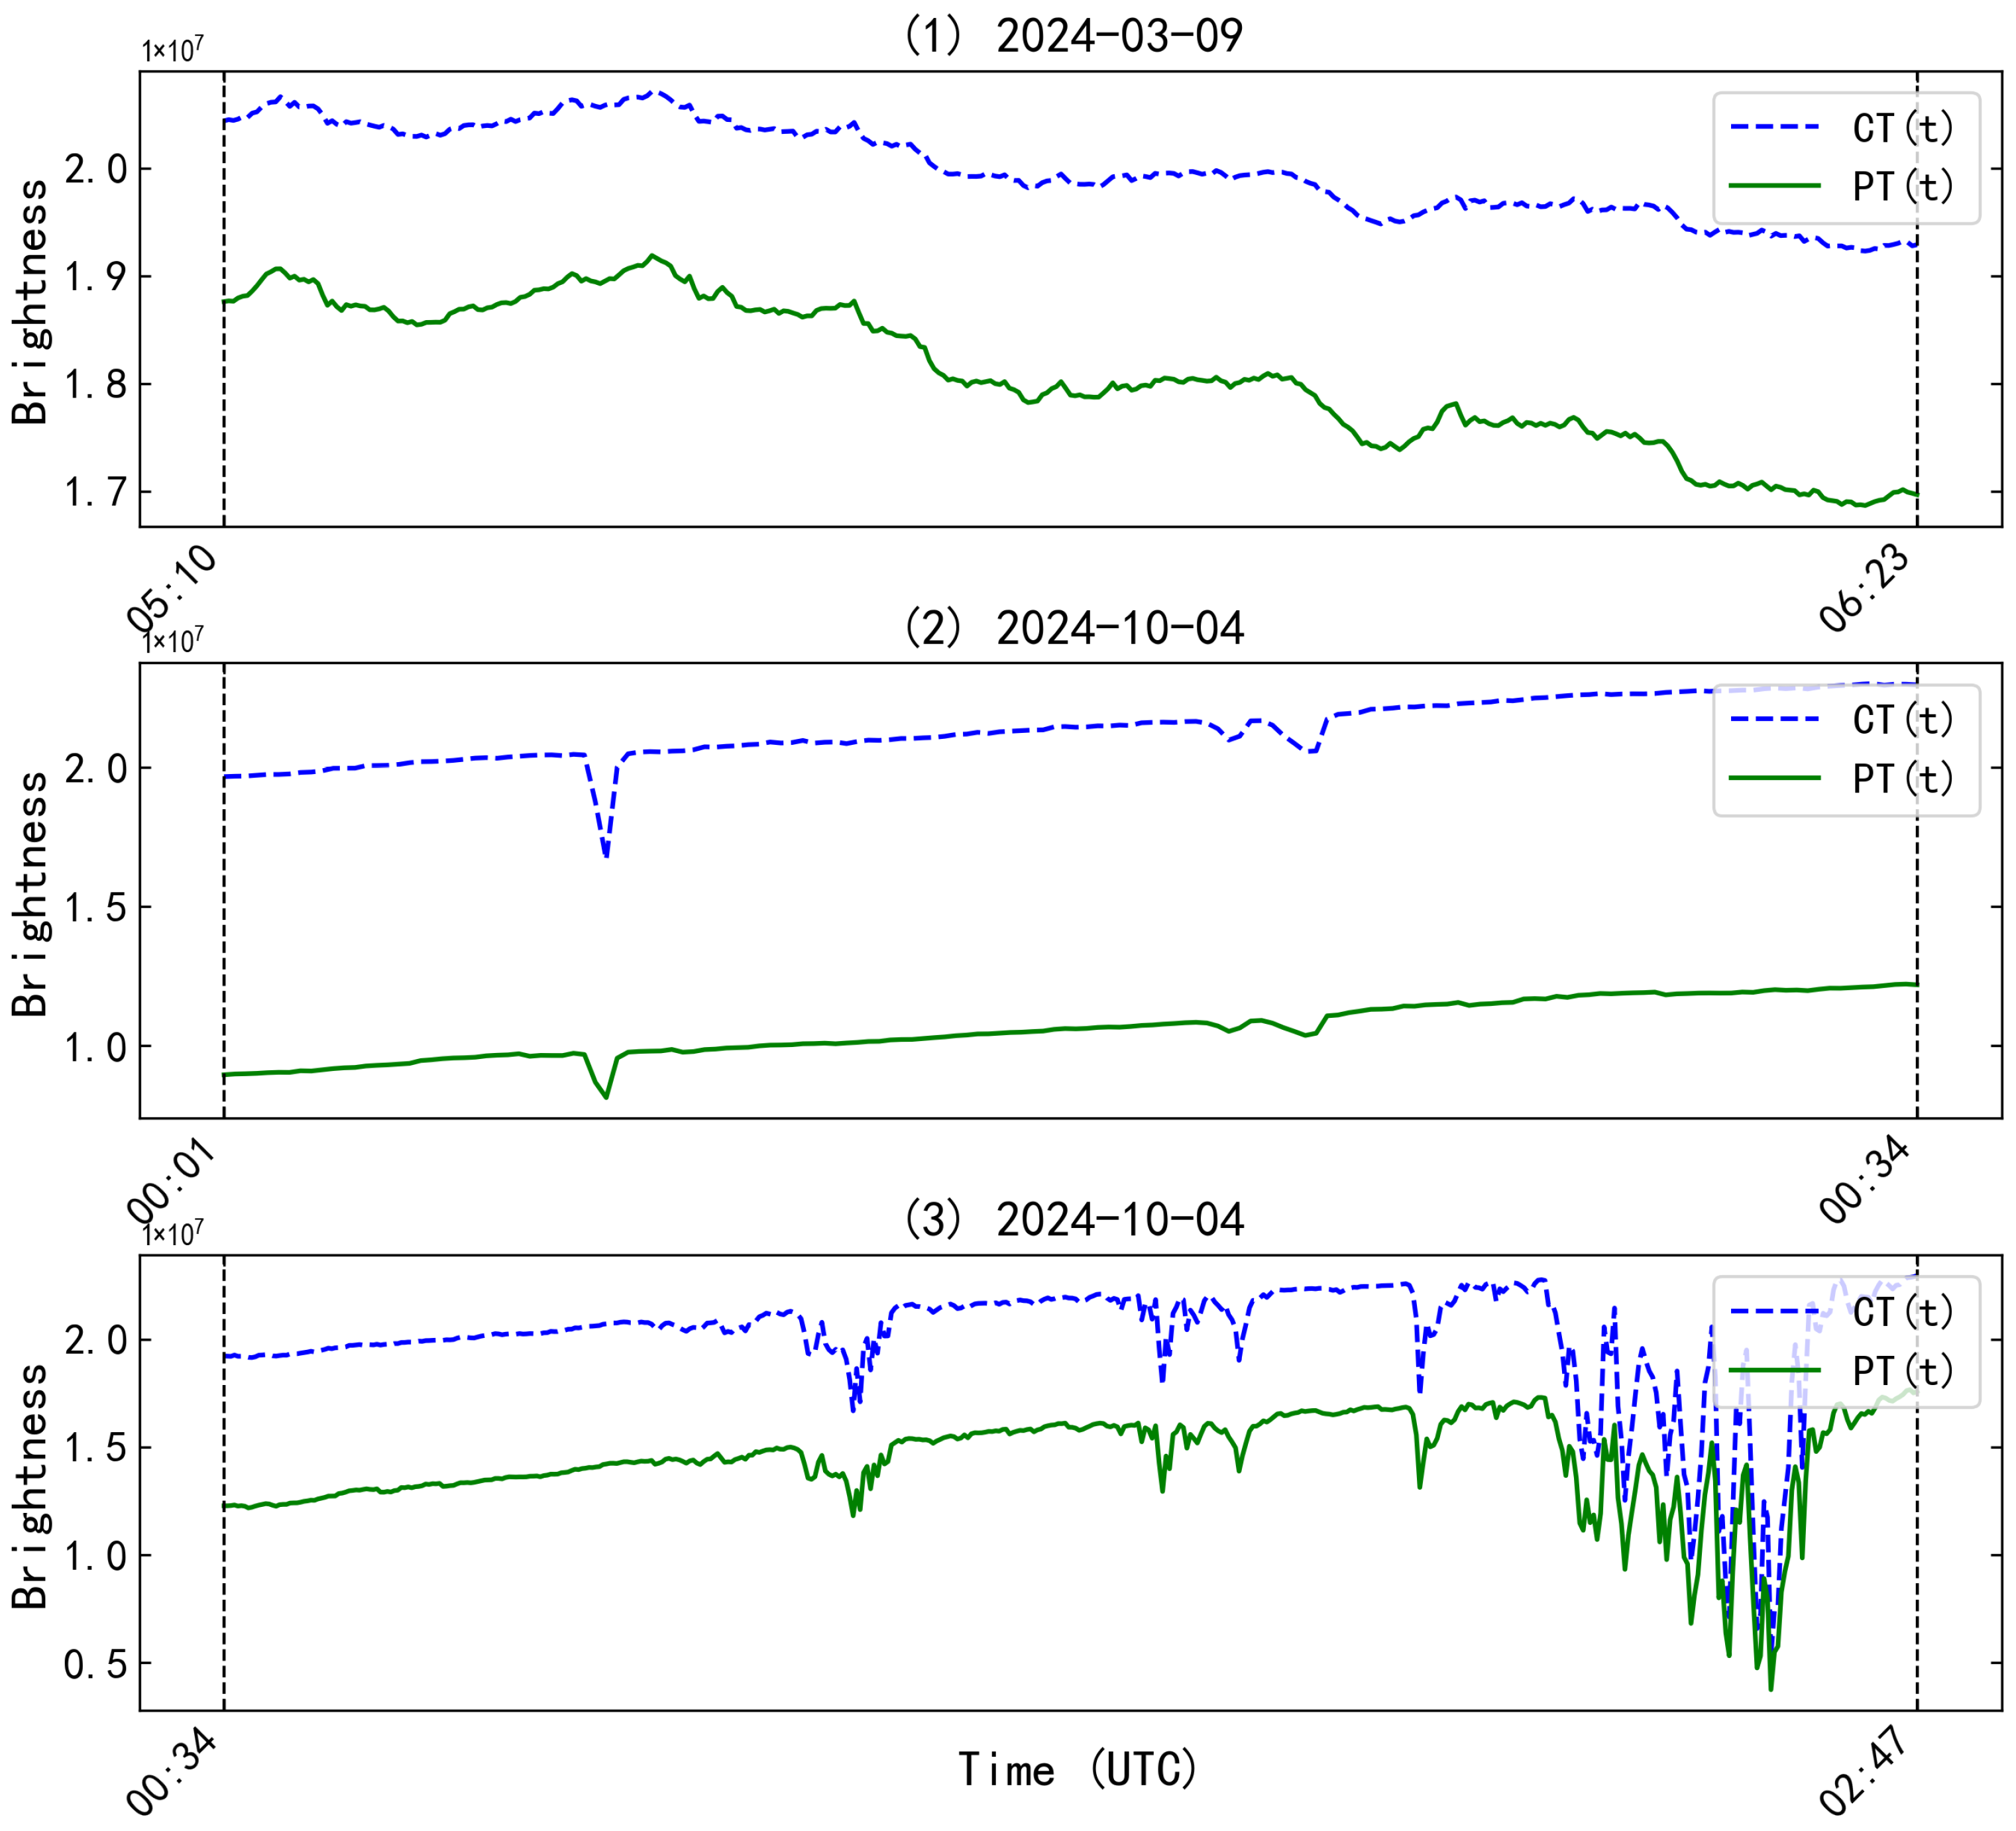
To validate this hypothesis, we analyzed dual-band brightness curves under three different cloud conditions using cloud-contaminated observational data obtained from regions with no flare activity: (1) Thin cloud case: The sky is mostly covered by a relatively continuous and uniformly distributed thin cloud layer, with good overall transparency and no distinct cloud structures or localized dense regions. (2) Intermittent structured cloud case: The sky is predominantly clear, with the occasional passage of small, well-defined cloud structures, causing brief and localized brightness fluctuations. (3) Thick cloud case: The sky is dominated by a thick and extensive cloud cover, resulting in significant obscuration and substantial attenuation of the solar signal, sometimes leading to complete loss of visibility.
As shown in Figure 3, (1) presents the chromospheric and photospheric brightness curves observed by the SMAT telescopes under thin cloud conditions, with no obvious cloud structure or obscuration. Further, (2) shows the impact of occasional passing clouds on the brightness of both the chromosphere and photosphere under clear sky conditions. Finally, (3) illustrates the brightness variation observed under thick cloud coverage. It is evident that, in the presence of clouds, the brightness variations observed by the two SMATs are highly consistent, with strong coherence in their corresponding brightness curve patterns. To further quantify this consistency, we performed Pearson correlation and cross-correlation analyses on the brightness curves under these different conditions, as summarized in Table 1.
The results show that under the thin cloud and partial cloud conditions, the extremely high Pearson correlation coefficients (r > 0.98) confirm that the modulation effect of clouds on the dual-band brightness is highly consistent, indicating that cloud obscuration has a consistent impact on the brightness of the dual-band images observed by SMAT. In contrast, for the thick cloud case, the correlation between the two brightness curves is somewhat reduced due to stronger obscuration. However, the overall variation trends still show good agreement. Moreover, cross-correlation analysis of all three cases reveals zero time lag, confirming the good temporal synchronization between the two SMAT telescopes during observations.
Next, we conduct validation using actual observational data from the SMAT. We obtained image data of an M1.5-class solar flare that occurred on 3 July 2024, as observed using the SMAT. The dataset includes synchronous photospheric (5324 Å) and chromospheric (6562.8 Å) image observations, with a time resolution of approximately 12 s and an exposure time of about 20 ms. Figure 4 presents an example of the actual observational data, which captures an M1.5-class flare occurring under thin cloud conditions, and the corresponding field of view covers an area of approximately 6 × 6 .
As shown in Figure 5, due to the absorption and scattering of sunlight by thin clouds, the brightness curves of both the photospheric and chromospheric images exhibit similar variation trends. Notably, the peak in the chromospheric brightness near the red vertical dashed line is entirely obscured. As a result, it becomes difficult to determine the occurrence of a flare solely based on the brightness curves derived from the raw observational data.
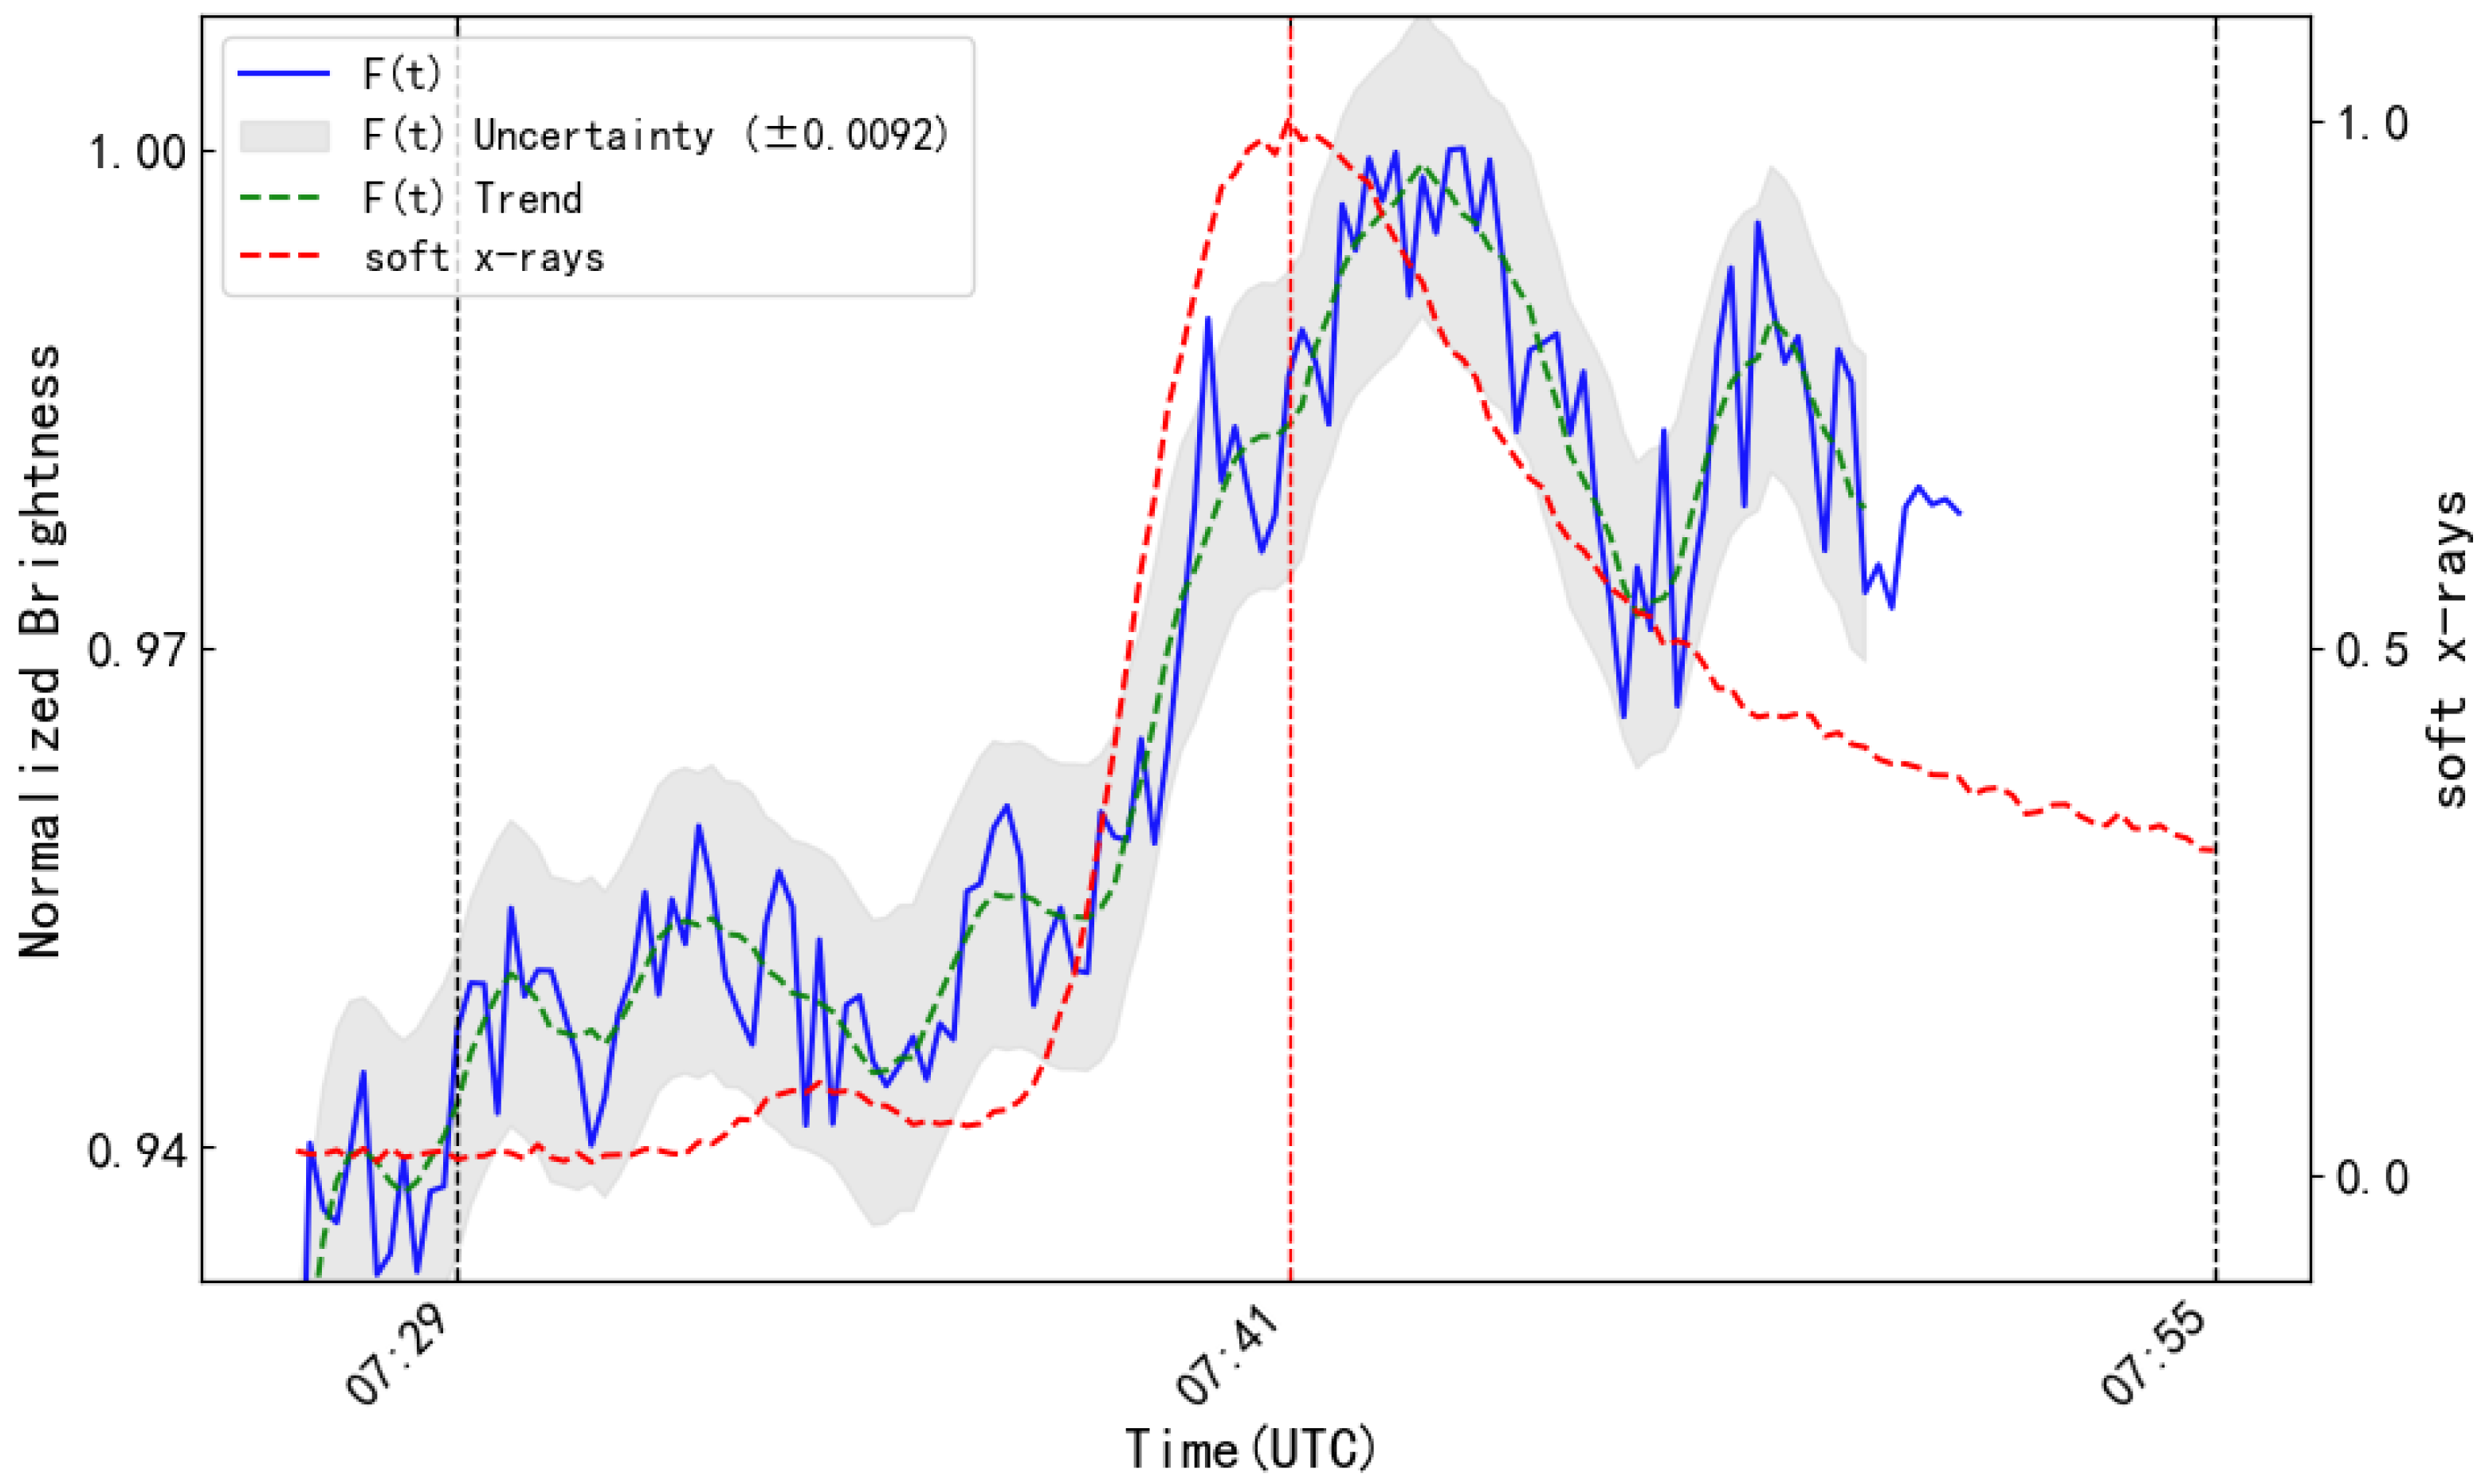
The reconstructed curve obtained by dividing the chromospheric brightness curve of SMAT by the photospheric brightness curve is shown as the blue solid line in Figure 6. In the comparison between the soft X-ray flux and the chromospheric brightness curve, we observed that the peak of chromospheric brightness appears shortly after the peak of the soft X-ray flux is reached, and there is a partial overlap in the rising phases of the two. According to the research by Veronig et al. [23], in more than 90% of flare events, preheating phenomena in soft X-rays can be observed, and H α radiation usually lags behind soft X-rays. This conclusion supports our research result that the peak of the reconstructed chromospheric brightness lags behind the peak of the soft X-ray flux, thus verifying the effectiveness of using the dual-band brightness ratio method to remove the influence of thin clouds on the flare monitoring of SMAT configuration.

5. Conclusions and Discussion

This paper addresses the impact of thin cloud interference on SMAT flare monitoring. Based on the fact that the dual-band synchronous observation system of the SMAT—with the 5324 Å band observing the photospheric magnetic field and the 6562.8 Å band observing chromospheric activities—has a highly overlapping field of view, we establish an empirical model for the effects of thin clouds. We first hypothesize that the modulation effect of clouds on the brightness of both bands is consistent, and we conducted correlation analysis using real cloud-contaminated observational data from the SMAT, which validates the reasonableness of the proposed hypothesis under the SMAT configuration. Based on this consistency assumption, we propose a cloud removal method based on the brightness ratio between the two bands. The method is applied to SMAT observational data containing an M1.5 class flare. The results show that the brightness peak caused by the flare is successfully reconstructed, and it is in good agreement with the peak of soft X-rays, with the peak slightly lagging behind that of soft X-rays. This result confirms the effectiveness of the proposed method in removing the influence of thin clouds on flare monitoring by the SMAT. In summary, this paper provides a feasible technical solution for solar flare monitoring with the SMAT, offering technical support for improving data utilization and the accuracy of flare detection.
Certainly, there is room for improvement in its accuracy. In fact, the assumption proposed in this paper that the influence of clouds on the two telescopes of the SMAT is consistent is an empirical assumption derived from long-term observations. Furthermore, the validity of this assumption is highly dependent on the telescope system and observation methodology: the two telescopes must be in sufficiently close proximity and must be capable of acquiring dual-band observation images with a sufficiently high synchronization rate. In the future, more observational data are needed to verify the applicability of this assumption under different cloud cover conditions. Additionally, the proposed method will be applied to flare events of various classes to further validate its effectiveness across a broader range of solar activity levels. Moreover, there are certain differences in the transmittance of clouds in different bands. In subsequent work, the radiative transfer model will also be combined to accurately calculate the transmittance of thin clouds in different bands.

Author Contributions

methodology, H.L. and S.Y.; Validation, H.L.; resources, S.Y. and H.X.; writing—original draft preparation, H.L. and X.H.; writing—review and editing, S.Y. and X.H. and H.X. and H.L.; supervision, S.Y. All authors have read and agreed to the published version of the manuscript.

Funding

This research is supported by the National Key R&D Program of China No. 2022YFF0503800, 2021YFA1600500, 2022YFF0503001; the National Natural Science Foundation of China (grants No. 12250005, 12073040, 12273059, 11973056, 12003051, 11573037, 12073041, 11427901, 11572005, 11611530679 and 12473052); the Strategic Priority Research Program of the China Academy of Sciences (grants No. XDB0560000, XDA15052200, XDB09040200, XDA15010700, XDB0560301, and XDA15320102); and by the Chinese Meridian Project (CMP).

Data Availability Statement

The data is available from the author.

Acknowledgments

This project was supported by the Specialized Research Fund for State Key Laboratory of Solar Activity and Space Weather, and we appreciate the use of data from the China Meridian project in this work.

Conflicts of Interest

The authors declare no conflicts of interest.

References

  1. Schrijver, C.J.; Kauristie, K.; Aylward, A.D.; Denardini, C.M.; Gibson, S.E.; Glover, A.; Gopalswamy, N.; Grande, M.; Hapgood, M.; Heynderickx, D.; et al. Understanding space weather to shield society: A global road map for 2015–2025 commissioned by COSPAR and ILWS. Adv. Space Res. 2015, 55, 2745–2807. [Google Scholar] [CrossRef]
  2. Janssen, M. On the solar protuberances. Proc. R. Soc. Lond. 1868, 17, 276–277. [Google Scholar] [CrossRef]
  3. Lockyer, J.N.; Frankland, P.F. Preliminary note of researches on gaseous spectra in relation to the physical constitution of the sun. Proc. R. Soc. Lond. 1869, 17, 350–356. [Google Scholar] [CrossRef]
  4. Rimmele, T.R.; Marino, J. Solar adaptive optics. Living Rev. Sol. Phys. 2011, 8, 2. [Google Scholar] [CrossRef] [PubMed]
  5. Xukun, Z.; Wei, S.; Ganghua, L.; Yuxi, S. Solar Image Cloud Removal based on Improved Pix2Pix Network. Comput. Mater. Contin. 2022, 73, 6181–6193. [Google Scholar] [CrossRef]
  6. Shen, X.; Li, Q.; Tian, Y.; Shen, L. An Uneven Illumination Correction Algorithm for Optical Remote Sensing Images Covered with Thin Clouds. Remote Sens. 2015, 7, 11848–11862. [Google Scholar] [CrossRef]
  7. Shen, H.; Li, H.; Qian, Y.; Zhang, L.; Yuan, Q. An effective thin cloud removal procedure for visible remote sensing images. ISPRS J. Photogramm. Remote Sens. 2014, 96, 224–235. [Google Scholar] [CrossRef]
  8. Yang, X.; Jia, Z.; Yang, J.; Kasabov, N. Change Detection of Optical Remote Sensing Image Disturbed by Thin Cloud Using Wavelet Coefficient Substitution Algorithm. Sensors 2019, 19, 1972. [Google Scholar] [CrossRef] [PubMed]
  9. Zi, Y.; Ding, H.; Xie, F.; Jiang, Z.; Song, X. Wavelet Integrated Convolutional Neural Network for Thin Cloud Removal in Remote Sensing Images. Remote Sens. 2023, 15, 781. [Google Scholar] [CrossRef]
  10. Lv, Z.; An, N.; Fan, C.; Zhang, H.; Zhao, G.; Song, Q.; Dong, H.; Liu, C. Automatic processing of satellite laser ranging data based on image denoising technique. Opt. Commun. 2024, 562, 130570. [Google Scholar] [CrossRef]
  11. Shibata, K.; Magara, T. Solar Flares: Magnetohydrodynamic Processes. Living Rev. Sol. Phys. 2011, 8, 6. [Google Scholar] [CrossRef]
  12. Fletcher, L.; Dennis, B.R.; Hudson, H.; Krucker, S.; Phillips, K.; Veronig, A.; Battaglia, M.; Bone, L.; Caspi, A.; Chen, Q.; et al. An Observational Overview of Solar Flares. Space Sci. Rev. 2011, 159, 19. [Google Scholar] [CrossRef]
  13. Neidig, D.F.; Wiborg, P.H.; Gilliam, L.B. Physical properties of white-light flares derived from their center-to-limb distribution. Sol. Phys. 1993, 144, 169–194. [Google Scholar] [CrossRef]
  14. Yongliang, S.; Hui, T. Investigation of White-light Emission in Circular-ribbon Flares. ApJ 2018, 867, 159. [Google Scholar] [CrossRef]
  15. Carrington, R.C. Description of a Singular Appearance seen in the Sun on 1 September 1859. Mon. Not. R. Astron. Soc. 1859, 20, 13–15. [Google Scholar] [CrossRef]
  16. Hodgson, R. On a curious Appearance seen in the Sun. Mon. Not. R. Astron. Soc. 1859, 20, 15–16. [Google Scholar] [CrossRef]
  17. Fang, C.; Chen, P.-F.; Li, Z.; Ding, M.-D.; Dai, Y.; Zhang, X.-Y.; Mao, W.-J.; Zhang, J.-P.; Li, T.; Liang, Y.-J. A new multi-wavelength solar telescope: Optical and Near-infrared Solar Eruption Tracer (ONSET). Res. Astron. Astrophys. 2013, 13, 1509. [Google Scholar] [CrossRef]
  18. Jing, Z.; Li, Y.; Feng, l.; Li, H.; Huang, Y.; Li, Y.; Su, Y.; Chen, W.; Tian, J.; Song, D.; et al. A Statistical Study of Solar White-Light Flares Observed by the White-light Solar Telescope of the Lyman-alpha Solar Telescope on the Advanced Space-based Solar Observatory (ASO-S/LST/WST) at 360 nm. Sol. Phys. 2024, 299, 11. [Google Scholar] [CrossRef]
  19. Smith, E.; Gottlieb, D. Solar flux and its variations. Space Sci. Rev. 1974, 16, 771–802. [Google Scholar] [CrossRef]
  20. Zhang, H.Q.; Wang, D.G.; Deng, Y.Y.; Hu, K.L.; Su, J.T.; Lin, J.B.; Lin, G.H.; Yang, S.M.; Mao, W.J.; Wang, Y.N.; et al. Solar Magnetism and the Activity Telescope at HSOS. Chin. J. Astron. Astrophys. 2007, 7, 281. [Google Scholar] [CrossRef]
  21. Wang, L.; Sun, Y. Improved Canny edge detection algorithm. In Proceedings of the 2021 2nd International Conference on Computer Science and Management Technology (ICCSMT), Shanghai, China, 12–14 November 2021; pp. 414–417. [Google Scholar] [CrossRef]
  22. Mukhopadhyay, P.; Chaudhuri, B.B. A survey of Hough Transform. Pattern Recognit. 2015, 48, 993–1010. [Google Scholar] [CrossRef]
  23. Veronig, A.; Vršnak, B.; Temmer, M.; Hanslmeier, A. Relative timing of solar flares observed at different wavelengths. Sol. Phys. 2002, 208, 297–315. [Google Scholar] [CrossRef]
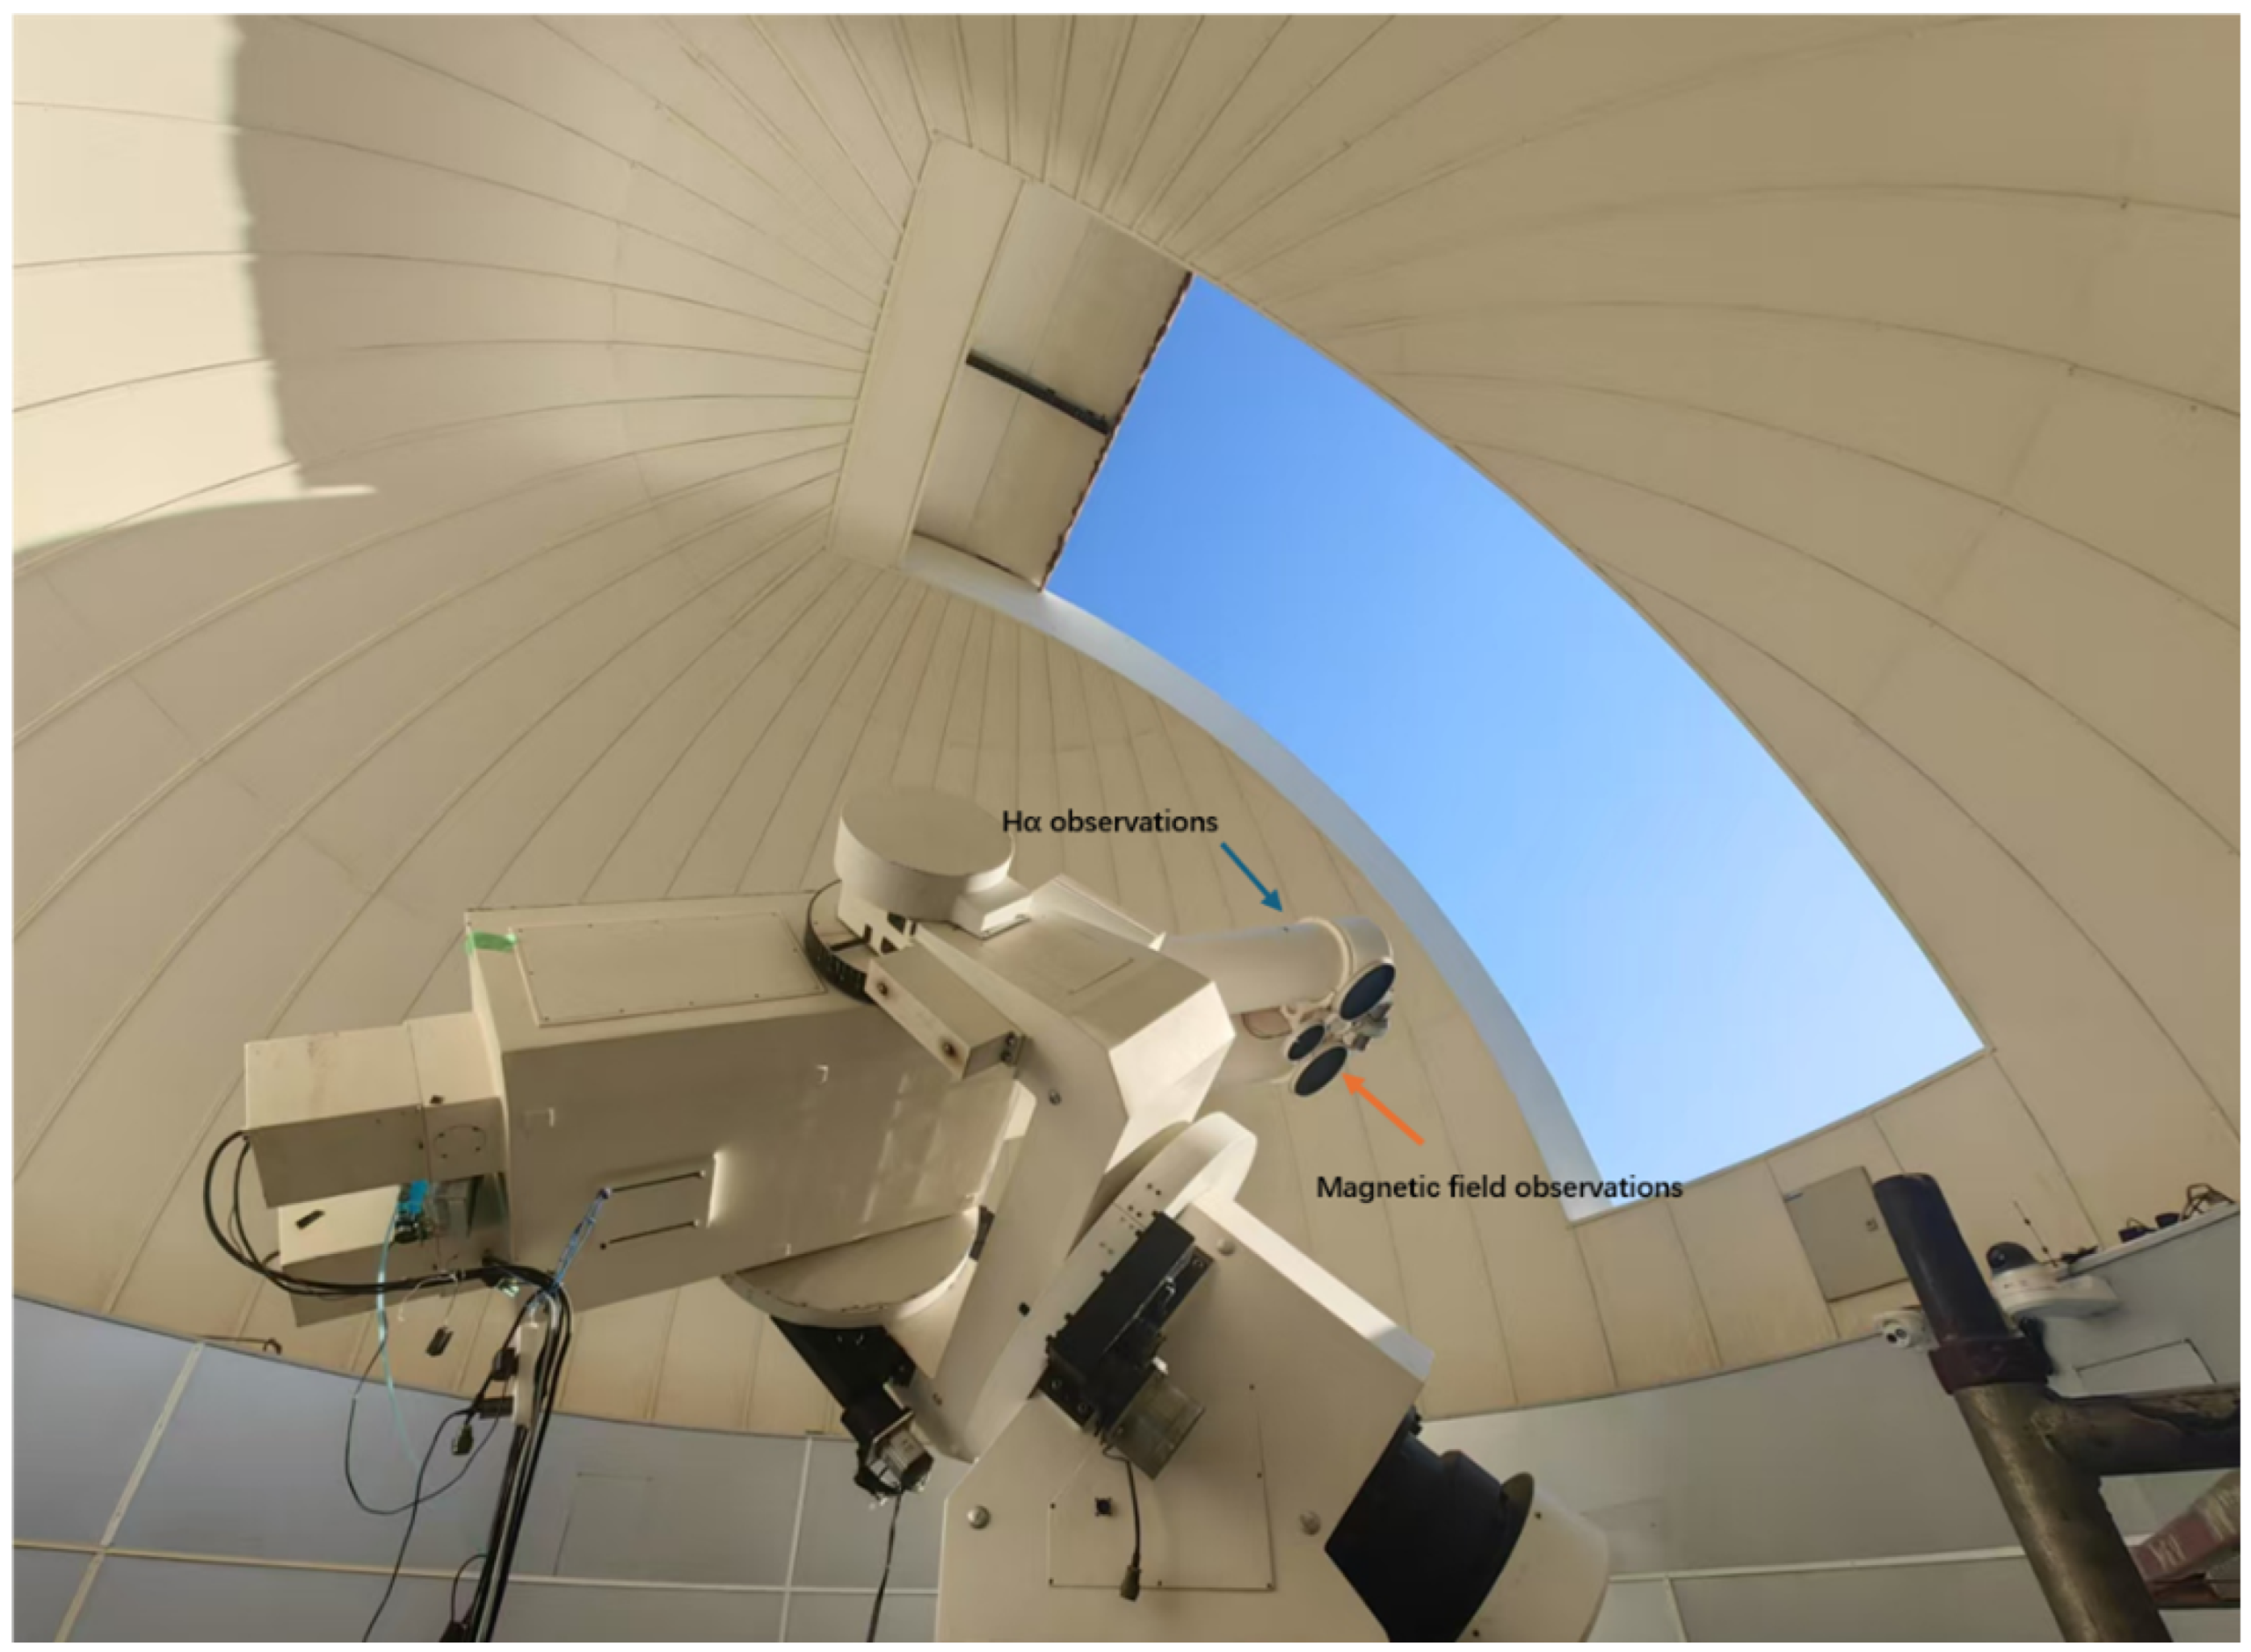
Figure 1. Solar Magnetism and the Activity Telescope (SMAT) at Huairou Solar Observing Station (HSOS) of the National Astronomical Observatories, Chinese Academy of Sciences (CAS).
Universe 11 00282 g001
Figure 2. Flow chart of data preprocessing.
Universe 11 00282 g002
Figure 3. Brightness curves of SMAT observations under three different cloud conditions: (1) thin cloud, (2) intermittent structured cloud, and (3) thick cloud. Black dashed vertical lines denote the time interval covered by the observational data.
Universe 11 00282 g003
Figure 4. The flare occurrence regions in the chromospheric and photospheric images obtained through simultaneous observations using SMAT from 07:26 to 07:52 (UTC) on 3 July 2024. (a) The measured chromospheric image and (b) the measured photospheric image.
Universe 11 00282 g004
Figure 5. The Brightness curves of the SMAT observational data for the M1.5 class solar flare on 3 July 2024. The blue dashed line and green solid line represent the chromospheric (CT(t)) and photospheric (PT(t)) brightness curves, respectively. The black vertical dashed lines indicate the start and end times of the flare, while the red vertical dashed line marks the time of the X-ray flux peak.
Universe 11 00282 g005
Figure 6. The brightness curve reconstructed from the SMAT observational data. The blue solid line represents the reconstructed curve F(t), and the green dashed line is the trend line of F(t). The light-grey shaded area indicates the error range of F(t). The red dashed line shows the normalized soft X-ray flux curve. The black vertical dashed lines mark the start and end times of the flare, while the red vertical dashed line corresponds to the peak time of the X-ray flux.
Universe 11 00282 g006
Table 1. Pearson correlation and cross-correlation analysis results under three cloud conditions.
CasePearson r 1CC Lag 2
(1)0.9970
(2)0.9820
(3)0.9470
1 Pearson correlation coefficient; 2 Cross-correlation lag times.
Disclaimer/Publisher’s Note: The statements, opinions and data contained in all publications are solely those of the individual author(s) and contributor(s) and not of MDPI and/or the editor(s). MDPI and/or the editor(s) disclaim responsibility for any injury to people or property resulting from any ideas, methods, instructions or products referred to in the content.