Abstract
PSR B1259-63/LS 2883 is a well-studied gamma-ray binary hosting a pulsar in a 3.4-year eccentric orbit around a Be-type star. Its non-thermal emission spans from radio to TeV energies, exhibiting a significant increase near the periastron passage. This paper is dedicated to the analysis of INTEGRAL observations of the system following its last periastron passage in June 2024. We aim to study the spectral evolution of this gamma-ray binary in the soft (0.3–10 keV) and hard (30–300 keV) X-ray energy bands. We performed a joint analysis of the data taken by INTEGRAL/ISGRI in July–August 2024 and quasi-simultaneous Swift/XRT observations. The spectrum of the system in the 0.3–300 keV band is well described by an absorbed power law with a photon index of . We place constraints on potential spectral curvature, limiting the break energy keV for and cutoff energy keV at a 95% confidence level. For one-zone leptonic emission models, these values correspond to electron distribution spectral parameters of TeV and TeV, consistent with previous constraints derived by H.E.S.S.
1. Introduction
PSR B1259-63 is a rotation-powered radio pulsar with a spin period of ms, orbiting an O9.5 Ve optical companion, LS 2883. This binary belongs to the subclass of gamma-ray binaries–high mass binary systems, which emit most of their non-thermal emission in the gamma-ray range. The system has well-established orbital parameters [1,2], including high eccentricity () and a long orbital period ( days). It is one of only three gamma-ray binaries in which the compact object is confirmed to be a pulsar, making it an attractive candidate for studying and modeling emission from gamma-ray binaries (see [3] for a review).
The optical Be star companion produces both polar and axisymmetric outflows: a polar wind and a decretion disk [1]. The pulsar orbital plane is inclined relative to the decretion disk, so the pulsar passes through the disk twice per orbit, approximately 15–20 days before and after periastron [4].
The interaction between the stellar outflows and the pulsar’s relativistic wind forms an intrabinary shock, where accelerated particles produce non-thermal emission spanning from radio to TeV energies [5,6]. Close to the periastron passage, this unpulsed emission from the intrabinary shock dominates the electromagnetic spectrum (from X-rays to TeVs, and in the radio band). For the purpose of our work, we will refer to all such unpulsed, binary-system-generated emission as “binary radiation” (distinguishing it from direct, pulsed emission from a pulsar). The non-thermal radiation intensity increases near periastron, and the X-ray emission is additionally enhanced during the pulsar-disk passages, leading to a two-peaked X-ray light curve. The most recent periastron passage occurred on 30 June 2024 ( MJD 60491.591).
The multiwavelength observational campaigns covering previous periastron passages have revealed that the system’s observational properties, such as the shape of the light curves in different energy ranges, vary from one orbit to another (see [7] for a review of previous periasters observations). In particular, the 2021 periastron passage has revealed a number of unusual features, like the presence of the third X-ray peak [7,8]. The 2024 periastron was monitored by radio, optical, and gamma-ray observatories, as well as by the X-ray telescopes Swift and NICER. The X-ray light curve was found to be more complex than expected, demonstrating a prolonged second hump after the second pulsar-disc passage [9].
In previous studies of the hard X-ray emission from PSR B1259-63/LS 2883, the spectrum was successfully described by an absorbed power law (PL) model with no indications of a more complicated spectrum or an additional thermal component. Shaw et al. [10] analyzed the system in the 20–200 keV band with INTEGRAL and found that the PL with an index of provided a good fit. More recently, Chernyakova et al. [11] examined data from NuSTAR and Suzaku (up to E∼70 keV) as well as INTEGRAL (up to 60 keV, though no spectrum was provided), finding a slightly phase-dependent PL fit with 1.5–1.7.
In this work, we examine the hard X-ray emission (>30 keV) from the binary using new observations from the INTEGRAL/ISGRI observatory. Nominally, the IBIS/ISGRI instrument can obtain X-ray spectra up to 500 keV, allowing us to test the PL model at higher energies. We analyze data from July–August 2024 to extract the spectrum, build a light curve, and study the spectral evolution of the system.
2. Data Analysis
The INTEGRAL/ISGRI 2024 periastron passage data cover revolutions 2798–2805 and 2807, with a total exposure time of 258 ks taken between 9 July and 2 August 2024. For each revolution, the data were processed according to the IBIS Analysis User Manual v. 11.21, using the standard ISDC offline scientific analysis software v. 11.2. Using the standard data analysis pipeline, we obtained nine ISGRI spectra for the nine revolutions, summing science windows for each revolution. The energy bins were defined as four logarithmically spanned bins in the 30–80 keV range and one bin in the 80–300 keV range.
We note that the spectral analysis of PSR B1259-63/LS 2883 in hard X-rays with ISGRI is complicated by the presence of a nearby (∼10′ away) source 2RXP J130159.6-635806, a Be/X-ray pulsar, which lies well within the ISGRI PSF for our target. To account for the possible contribution of this source to the PSR B1259-63 spectrum, we utilized the best-fit model from the most recent NuSTAR observations of this source taken quasi-simultaneously with ISGRI and reported by Salganik et al. [12]. For this period, MJD 60500–60530, the flux of 2RXP J130159.6-635806 was at a constant level of ∼, an order of magnitude lower than that of PSR B1259-63/LS 2883: ∼(3–6) and, therefore, does not strongly contaminate the results presented.
To extend our analysis to softer X-ray energies, we also incorporated Swift/XRT (hereafter XRT, [13]) data in the 0.3–10 keV band, as analyzed in Chernyakova et al. [9]. The excellent time coverage of PSR B1259-63/LS 2883 by XRT allowed us to match each of the nine ISGRI observations with a corresponding XRT observation, separated by no more than 1 day. This resulted in nine joint XRT and ISGRI datasets. The XRT spectra were binned using a minimum of 25 photons with the grppha routine. These spectra were further analyzed using XSPEC v.12.11.0 from HEASOFT v.6.27. Table 1 shows the parameters of the datasets: Science Window ranges (ScW—continuous time intervals during which the satellite maintains a stable pointing), MJD, and time since periastron passage, along with the absorbed PL best fit parameters and fluxes in soft and hard X-ray energy bands. Figure 1 presents examples of such datasets (no. 2, 7, and 9), together with their best fit by the absorbed PL models (Tbabs*powerlaw) and residuals.

Table 1.
Best-fit parameters for the 9 datasets of XRT –ISGRI data, including observation details (ScW ranges, MJD, and time since periastron passage), along with the absorbed PL joint fit parameters and and fluxes in the soft and hard X-ray energy ranges.
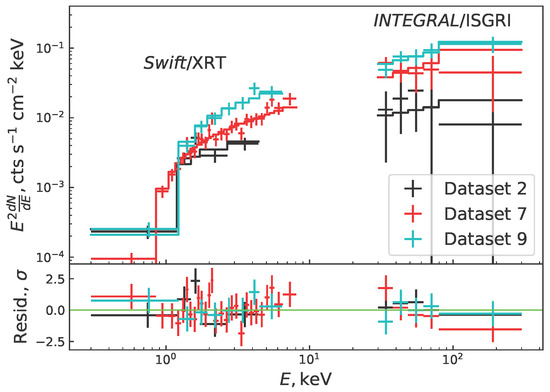
Figure 1.
Spectra for the datasets 2, 7, and 9. For each dataset, Swift/XRT and INTEGRAL/ISGRI data were modeled simultaneously with an absorbed PL model (tbabs*powerlaw), and the model is also shown.
We also searched for indications of a more complex spectral model: broken PL or exponential cutoff PL (see below). For these models, we used the XSPEC models Tbabs*bknpower and Tbabs*cutoffpl. When parameter exploration was required, we employed the steppar routine.
3. Results and Discussion
We fitted the spectra from nine joint (XRT + ISGRI) datasets with the absorbed PL model, treating the interstellar hydrogen density , the X-ray spectral slope , and the normalization of the PL as free parameters. For the fit, we adopted statistics; the errorbars shown in Figure 1 correspond to the statistical confidence interval.
Figure 2 presents the results of the performed analysis. The top panel illustrates the post-periastron PSR B1259-63/LS 2883 light curve obtained from, first, only the XRT data (0.3–10 keV, grey points), and, second, from the joint fit of the XRT and ISGRI data (blue and red points). The blue points indicate the flux derived from the joint fit in the XRT energy range (0.3–10 keV), allowing for a direct comparison with XRT-only data points. The red points correspond to the flux in the 30–50 keV energy range. The Figure shows that the light curve in the hard X-ray band traces the same secondary hump at ∼25–40 days after the periastron, as previously reported in the soft X-ray band, while the nature of this hump remains largely unclear. For example, it could be attributed to a longer electron runaway time caused by the disk’s disruption (see, e.g., [7]).
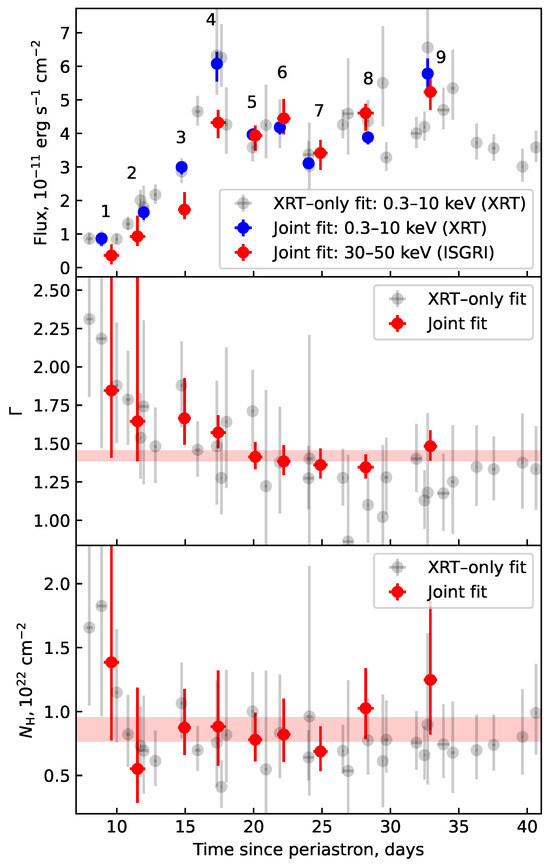
Figure 2.
Top: The 2024 light curve in soft X-rays (blue) and hard X-rays (red) from joint Swift/XRT and INTEGRAL/ISGRI fits. The gray points correspond to the soft X-ray flux from the XRT -only fit. All XRT + ISGRI pairs are marked with the dataset number they belong to. Middle and bottom: The photon index and the column density from the joint fit, in red, and XRT -only fit, in gray. On the two lower panels, the red bands show the -uncertainties for the and fits from datasets 4–9.
The middle panel of Figure 2 shows the results for the spectral slope derived from XRT-only data (grey points) and from the joint XRT -ISGRI spectral fit (red points). The lower panel presents the interstellar neutral hydrogen absorption value with the same color scheme. Although not statistically significant, we note the gradual hardening of the spectral slope as PSR B1259-63/LS 2883 moves away from periastron. The observed trend is consistent with high-quality XMM-Newton data (see [11] for the summary for several periastron passages). Figure 2 illustrates the substantial improvement in the spectral PL index constraints using the joint XRT and ISGRI data analysis. To further illustrate this improvement, we examined the confidence ellipses for and , as these parameters are typically strongly correlated for the X-ray data.
In Figure 3, we show maps in parameter space from the joint XRT -ISGRI analysis of high-quality datasets 4–9 (corresponding to 17–33 days after periastron) and compare them to the analysis of the corresponding XRT -only observations. The colorbar represents the change in for the given relative to the best-fit value. The white contours show and statistical confidence regions, and , correspondingly, for a joint fit, with the best-fit values of . The red ellipses show the same confidence regions for the XRT-only analysis around the best-fit values . One can see that the inclusion of ISGRI data significantly improves the constraints on the spectral slope. Within error bars, the PL spectral index and hydrogen column density for datasets 4–9 remained consistent with the constant joint fit values (see red shaded regions in Figure 2).
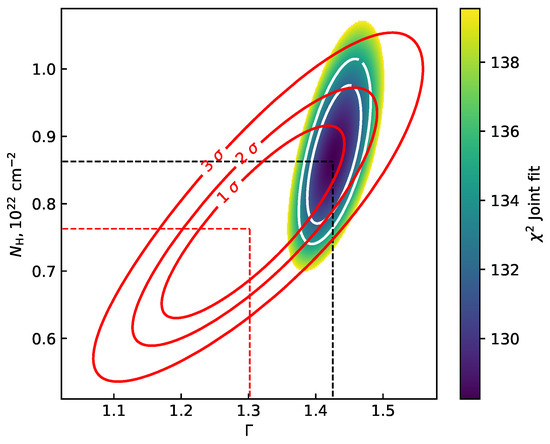
Figure 3.
Chi-square () maps in the – parameter space. The color scale represents the joint fit values, with regions below significance shown. White contours indicate the and confidence levels. Red contours correspond to levels from XRT-only fits (see labels). The analysis includes data from datasets 4–9 only.
Motivated by the considerable refinement of the joint XRT -ISGRI analysis, we performed an additional search for deviations from a simple PL model. We searched for a break in the spectrum by fitting it with a broken PL model:
and tested for the spectrum curvature using the exponential cutoff PL:
The results are shown in Figure 4 as the change in between the modified and simple PL models. The left panel corresponds to the broken PL model, while the right panel corresponds to the exponential cutoff PL model. The contours denote the and statistical significance contours. For the the broken PL model, we additionally fixed to its best-fit value derived from the joint XRT –ISGRI fit. We explicitly verified that the best improvement of for both and indexes free is , which remains within the statistical fluctuations of the data.
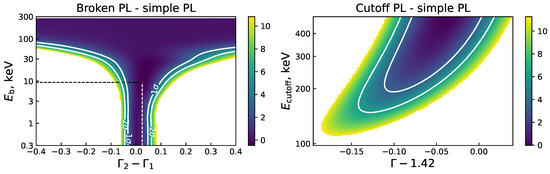
Figure 4.
The difference in total between a modified PL model and a simple PL model. Left: The modified model is a broken PL, with the map shown in coordinates of break energy and index difference . The first index was fixed at , while the second index was varied. Right: The modified model is an exponential cutoff PL, with the map shown in coordinates of the cutoff energy and spectral index . The white solid contours indicate significance levels of and . The color bars to the right of the plots indicate the value of .
This figure demonstrates that the data limit spectral breaks to keV (for ) and keV (for ) at the confidence level. The data do not constrain the break energy above keV. Similarly, we place a lower limit on the cutoff energy of keV at 95% () statistical significance. As before, the and levels were defined as and , respectively, above the best-fit value.
The multiwavelength (keV to TeV) spectral energy distribution (SED) of PSR B1259-63/LS 2883 is shown in Figure 5. The X-ray data correspond to the joint XRT and ISGRI spectrum from datasets 4–9; the GeV data are the Fermi/LAT spectra from Chernyakova et al. [9], obtained for different time intervals around the 2024 periastron passage; and the TeV data are H.E.S.S. results from the 2021 periastron campaign [14] averaged over 25–36 days after periastron.
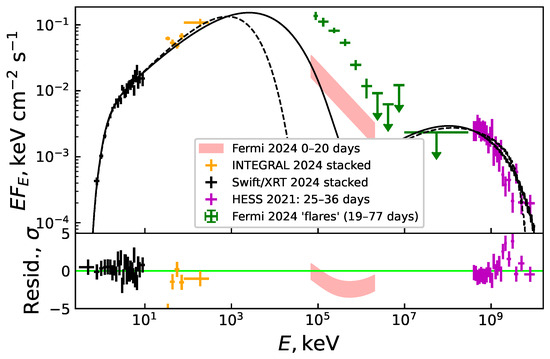
Figure 5.
Top: SED of PSR B1259-63. Black: Swift/XRT stacked spectrum for the datasets 4–9. Orange: INTEGRAL/ISGRI stacked spectrum for the same datasets. Red bound: Fermi 2024 spectrum 0–20 days after periastron. Green: Fermi spectrum during gamma-ray flares: 19–77 days after periastron. All Fermi data is from Chernyakova et al. [9]. Magenta: 2021 H.E.S.S. spectrum 25–36 days after periastron from H. E. S. S. Collaboration et al. [14]. The lines show modeled SEDs as sums of synchrotron (first hump) and inverse Compton (second hump) emission. Solid (dashed) lines correspond to the super-exponential cutoff index. Bottom: Residuals for the model spectrum with .
We fit the data with a simple one-zone leptonic model in which the X-ray emission originates from the synchrotron emission of a population of relativistic electrons, while the TeV emission arises from Inverse Compton (IC) emission from the same population. We assumed that the population of electrons is characterized by a super-exponential cutoff PL spectrum,
The key parameters of this electron distribution can be estimated analytically based on the X-ray analysis presented above. Namely, the electrons’ distribution index is given by . The derived limits on the break/cutoff energy of the photons’ spectrum translate into the constraints for the corresponding quantities in electrons’ spectrum via . Thus, we constrain the possible break in the spectrum of electrons to be at TeV and cutoff energy to TeV. This value is consistent with the cutoff upper limit TeV reported by H.E.S.S. [14].
We further performed the detailed spectral analysis of the discussed model with the Naima package [15], which uses synchrotron and isotropic IC emission models described in [16,17]. We leave the discussion of the applicability of such a model to a future work, pointing out the potential significance of the IC emission anisotropy and the spatial extension of the emission zone along the intrabinary shock.
The blue and red lines in Figure 5 show the synchrotron and inverse Compton (IC) components of the spectrum. We explicitly assumed that the GeV data is explained by a separate component, such as a combination of a bremsstrahlung and IC emission from a population of the relativistic electrons of the pulsar wind, (see, e.g., [6,18]). Indeed, we see that the synchrotron emission is not enough to explain GeV data taken during Fermi flares. Solid and dashed lines correspond to different choices of the super-exponential cutoff PL index , namely, solid lines correspond to , while dashed lines correspond to a sharp cutoff .
To account for the absorption of the soft X-rays due to interstellar hydrogen, we explicitly convolved the derived photon spectrum with the Tbabs absorption model using , identical to the value used to fit XRT data.
The seed photons for the IC scattering were assumed to originate from the optical star, with a temperature of K [19] at a distance au (the binary separation at 32 days after the periastron passage). The absorbtion was not accounted for.
The joint fit of the X-ray and TeV data ranges allowed us to constrain the magnetic field in the emission zone to G. Chernyakova et al. [6] preformed a simultaneous modeling of X-ray, GeV, and TeV spectra, obtaining a magnetic field approximately 5–10 times weaker. However, their analysis was based on 2017 observational data, when the X-ray light curve differed from the 2024 observations.
This value is consistent with the expected toroidal magnetic field originating from a pulsar [20,21], at the distance of ∼0.1 a.u.:
where is the pulsar spin-down luminosity, – is the magnetization of the pulsar wind, and is the distance from the pulsar to the emission zone. The factor of 3 is due to the compression of the isotropic magnetic field at the shock front.
This estimation may suggest that the emission zone is located close to the pulsar. The theoretical X-ray light curve modeling by Chen et al. [22] successfully reproduced the observed light curve while employing the equation above.
We note that a magnetic field of the same order may originate from the optical star. We estimate the stellar magnetic field as follows (see also [23,24]):
Here, we adopt the values used by De Becker [24]: the terminal wind velocity , the star rotation velocity , the Alfvén radius , the star radius [2], and is a binary separation: the distance between the pulsar and the optical star. is the magnetic field at the surface of the star. The estimated magnetic field strength is of the same order as the fitted value of ∼2 . However, no magnetic field has been detected in Be stars, with upper limits on the surface field estimated at 50–100 G [25]. Moreover, theoretical modeling suggests that a surface field of 100 G would likely disrupt the decretion disk, with a limit of G for the strongest surface field that would not completely destroy the disk [26].
We point out that the low level of GeV emission observed by Fermi at days after periastron implies the presence of a spectral break or cutoff at energies below ≈100 MeV (see Figure 5). The derived lower limit for the cutoff energy, keV, thus narrows the cutoff to the range 100 keV MeV.
A similar trend of increasing X-ray and decreasing GeV components in the energy spectrum is also observed in other gamma-ray binaries, indicating that the cutoff or break likewise lies at MeV, a range potentially accessible to hard X-ray instruments. However, numerous attempts to detect this break have resulted so far only in upper limits in the keV range. For instance, LS I +61° 303, a microquasar, has been reported to exhibit no break or cutoff at keV [27,28].
In contrast, redback pulsars (a class of binaries with a millisecond pulsar ablating a low-mass companion) show a spectral break at lower, keV-range energies [29]. The X-ray emission in these systems is typically modeled as synchrotron radiation from ultra-relativistic electrons in the intrabinary shock (see, e.g., [30]), allowing the break in the keV band to be interpreted as evidence of synchrotron cooling in the electron population [30,31]. The lower break energy in this case can be connected to a substantially higher magnetic field in the emission zone, B∼50 G in redbacks, compared to B∼1 G in gamma-ray binaries.
4. Conclusions
We conducted spectral analysis in the hard X-ray range for the 2024 periastron passage of PSR B1259-63 using INTEGRAL data. Spectral modeling shows that the data are satisfactorily described by an absorbed PL model in the 0.3–300 keV energy range. The stacked spectra for ∼18–32 days after periastron yield a photon index of .
At the significance level, we constrain the spectral break energy to keV (for ) and keV (for ). At the same significance, we exclude an exponential cutoff at energies keV. For a possible break or cutoff in the electron spectrum, these results translate to TeV (for ), TeV (for ), and TeV. This limit on the cutoff energy is among the strongest reported for PSR B1259-63. Further progress may be achieved with next-generation missions such as eASTROGAM [32], AMEGO [33], and Gecco [34].
We also compared a theoretical one-zone emission model to the combined observed X-ray and TeV spectrum, incorporating the 2021 H.E.S.S. TeV spectral data. The model with a magnetic field of ∼2 G provides the best fit. Such a magnetic field strength at ∼30 days after periastron suggests either that the emission zone lies very close to the pulsar or that the magnetic field may originate from the optical star surface.
Author Contributions
Conceptualization, A.K. and D.M.; formal analysis A.K.; writing—original draft preparation, A.K.; writing—review and editing, A.K., D.M., M.C., B.v.S. and A.S.; project administration A.S.; funding acquisition D.M.; and supervision D.M. and A.S. All authors have read and agreed to the published version of the manuscript.
Funding
This work was supported by Deutsches Zentrum für Luft- und Raumfahrt e.V. (DLR) grant 50OR2409. The authors acknowledge support by the state of Baden-Württemberg through bwHPC. BvS acknowledges support from the National Research Foundation of South Africa (grant number 119430). MCh acknowledges support from the European Space Agency (ESA) in the framework of the PRODEX Programme (PEA 4000120711).
Data Availability Statement
The original contributions presented in the study are included in the article. Further inquiries can be directed to the corresponding author.
Acknowledgments
The authors acknowledge support by the state of Baden-Württemberg through bwHPC. We acknowledge the use of public data from the Swift data archive. This work is based on observations using INTEGRAL, an ESA project with instruments, and a science data center funded by ESA member states.
Conflicts of Interest
The authors declare no conflicts of interest.
Note
| 1 | https://www.isdc.unige.ch/integral/analysis (accessed on 28 July 2025) |
References
- Johnston, S.; Manchester, R.N.; Lyne, A.G.; Bailes, M.; Kaspi, V.M.; Qiao, G.; D’Amico, N. PSR 1259-63: A Binary Radio Pulsar with a Be Star Companion. Astrophys. J. 1992, 387, L37. [Google Scholar] [CrossRef]
- Miller-Jones, J.C.A.; Deller, A.T.; Shannon, R.M.; Dodson, R.; Moldón, J.; Ribó, M.; Dubus, G.; Johnston, S.; Paredes, J.M.; Ransom, S.M.; et al. The geometric distance and binary orbit of PSR B1259-63. Mon. Not. R. Astron. Soc. 2018, 479, 4849–4860. [Google Scholar] [CrossRef]
- Chernyakova, M.; Malyshev, D. Gamma-ray binaries. In Proceedings of the Multifrequency Behaviour of High Energy Cosmic Sources–XIII, Palermo, Italy, 3–8 June 2019; Creative Commons: Mountain View, CA, USA, 2020; p. 45. [Google Scholar] [CrossRef]
- Melatos, A.; Johnston, S.; Melrose, D.B. Stellar wind and stellar disc models of dispersion and rotation measure variations in the PSR B1259—63/SS2883 binary system. Mon. Not. R. Astron. Soc. 1995, 275, 381–397. [Google Scholar] [CrossRef]
- Tavani, M.; Arons, J.; Kaspi, V.M. Regimes of High-Energy Shock Emission from the Be Star/Pulsar System PSR 1259-63. Astrophys. J. Lett. 1994, 433, L37. [Google Scholar] [CrossRef]
- Chernyakova, M.; Malyshev, D.; Mc Keague, S.; van Soelen, B.; Marais, J.P.; Martin-Carrillo, A.; Murphy, D. New insight into the origin of the GeV flare in the binary system PSR B1259-63/LS 2883 from the 2017 periastron passage. Mon. Not. R. Astron. Soc. 2020, 497, 648–655. [Google Scholar] [CrossRef]
- Chernyakova, M.; Malyshev, D.; van Soelen, B.; O’Sullivan, S.; Sobey, C.; Tsygankov, S.; Mc Keague, S.; Green, J.; Kirwan, M.; Santangelo, A.; et al. Multi-Wavelength Properties of the 2021 Periastron Passage of PSR B1259-63. Universe 2021, 7, 242. [Google Scholar] [CrossRef]
- Chernyakova, M.; Malyshev, D.; van Soelen, B.; Mc Keague, S.; O’Sullivan, S.P.; Buckley, D. The radio to GeV picture of PSR B1259-63 during the 2021 periastron passage. Mon. Not. R. Astron. Soc. 2024, 528, 5231–5241. [Google Scholar] [CrossRef]
- Chernyakova, M.; Malyshev, D.; van Soelen, B.; Finn Gallagher, A.; Matchett, N.; Russell, T.D.; van den Eijnden, J.; Lower, M.E.; Johnston, S.; Tsygankov, S.; et al. Multiwavelength coverage of the 2024 periastron passage of PSR B1259-63/LS 2883. Mon. Not. R. Astron. Soc. 2025, 536, 247–253. [Google Scholar] [CrossRef]
- Shaw, S.E.; Chernyakova, M.; Rodriguez, J.; Walter, R.; Kretschmar, P.; Mereghetti, S. INTEGRAL observations of the PSR B1259-63/SS2883 system after the 2004 periastron passage. Astron. Astrophys. 2004, 426, L33–L36. [Google Scholar] [CrossRef]
- Chernyakova, M.; Neronov, A.; van Soelen, B.; Callanan, P.; O’Shaughnessy, L.; Babyk, I.; Tsygankov, S.; Vovk, I.; Krivonos, R.; Tomsick, J.A.; et al. Multi-wavelength observations of the binary system PSR B1259-63/LS 2883 around the 2014 periastron passage. Mon. Not. R. Astron. Soc. 2015, 454, 1358–1370. [Google Scholar] [CrossRef]
- Salganik, A.; Tsygankov, S.S.; Chernyakova, M.; Malyshev, D.; Poutanen, J. Discovery of a bimodal luminosity distribution in persistent Be/X-ray pulsar 2RXP J130159.6-635806. arXiv 2025, arXiv:2504.11263. [Google Scholar] [CrossRef]
- Burrows, D.N.; Hill, J.E.; Nousek, J.A.; Kennea, J.A.; Wells, A.; Osborne, J.P.; Abbey, A.F.; Beardmore, A.; Mukerjee, K.; Short, A.D.T.; et al. The Swift X-Ray Telescope. Space Sci. Rev. 2005, 120, 165–195. [Google Scholar] [CrossRef]
- Aharonian, F. et al. [H. E. S. S. Collaboration]; Ait Benkhali, F.; Aschersleben, J.; Ashkar, H.; Backes, M.; Barbosa Martins, V.; Batzofin, R.; Becherini, Y.; Berge, D.; Bernlöhr, K.; et al. H.E.S.S. observations of the 2021 periastron passage of PSR B1259-63/LS 2883. Astron. Astrophys. 2024, 687, A219. [Google Scholar] [CrossRef]
- Zabalza, V. Naima: A Python package for inference of particle distribution properties from nonthermal spectra. In Proceedings of the 34th International Cosmic Ray Conference (ICRC2015), The Hague, The Netherlands, 30 July–6 August 2015; Volume 34, p. 922. [Google Scholar] [CrossRef]
- Aharonian, F.A.; Kelner, S.R.; Prosekin, A.Y. Angular, spectral, and time distributions of highest energy protons and associated secondary gamma rays and neutrinos propagating through extragalactic magnetic and radiation fields. Phys. Rev. D 2010, 82, 043002. [Google Scholar] [CrossRef]
- Khangulyan, D.; Aharonian, F.A.; Kelner, S.R. Simple Analytical Approximations for Treatment of Inverse Compton Scattering of Relativistic Electrons in the Blackbody Radiation Field. Astrophys. J. 2014, 783, 100. [Google Scholar] [CrossRef]
- Khangulyan, D.; Aharonian, F.A.; Bogovalov, S.V.; Ribó, M. Gamma-Ray Signal from the Pulsar Wind in the Binary Pulsar System PSR B1259-63/LS 2883. Astrophys. J. 2011, 742, 98. [Google Scholar] [CrossRef]
- Negueruela, I.; Ribó, M.; Herrero, A.; Lorenzo, J.; Khangulyan, D.; Aharonian, F.A. Astrophysical Parameters of LS 2883 and Implications for the PSR B1259-63 Gamma-ray Binary. Astrophys. J. Lett. 2011, 732, L11. [Google Scholar] [CrossRef]
- Kennel, C.F.; Coroniti, F.V. Confinement of the Crab pulsar’s wind by its supernova remnant. Astrophys. J. 1984, 283, 694–709. [Google Scholar] [CrossRef]
- Tavani, M.; Arons, J. Theory of High-Energy Emission from the Pulsar/Be Star System PSR 1259-63. I. Radiation Mechanisms and Interaction Geometry. Astrophys. J. 1997, 477, 439–464. [Google Scholar] [CrossRef]
- Chen, A.M.; Takata, J.; Yi, S.X.; Yu, Y.W.; Cheng, K.S. Modelling multiwavelength emissions from PSR B1259-63/LS 2883: Effects of the stellar disc on shock radiations. Astron. Astrophys. 2019, 627, A87. [Google Scholar] [CrossRef]
- Usov, V.V.; Melrose, D.B. X-Ray Emission from Single Magnetic Early-Type Stars. Astrophys. J. 1992, 395, 575. [Google Scholar] [CrossRef]
- De Becker, M. Non-thermal emission processes in massive binaries. Astron. Astrophys. Rev. 2007, 14, 171–216. [Google Scholar] [CrossRef]
- Wade, G.A.; Petit, V.; Grunhut, J.; Neiner, C. Magnetic fields of Be stars: Preliminary results from a hybrid analysis of the MiMeS sample. arXiv 2014, arXiv:1411.6165. [Google Scholar] [CrossRef]
- ud-Doula, A.; Owocki, S.P.; Kee, N.D. Disruption of circumstellar discs by large-scale stellar magnetic fields. Mon. Not. R. Astron. Soc. 2018, 478, 3049–3055. [Google Scholar] [CrossRef]
- Zhang, S.; Torres, D.F.; Li, J.; Chen, Y.P.; Rea, N.; Wang, J.M. Long-term monitoring of LS I +61°303 with INTEGRAL. Mon. Not. R. Astron. Soc. 2010, 408, 642–646. [Google Scholar] [CrossRef]
- Li, J.; Torres, D.F.; Zhang, S. Spectral Analysis in Orbital/Superorbital Phase Space and Hints of Superorbital Variability in the Hard X-Rays of LS I +61°303. Astrophys. J. Lett. 2014, 785, L19. [Google Scholar] [CrossRef]
- Sullivan, A.G.; Romani, R.W. High-energy Emission from the Intrabinary Shocks in Redback Pulsars. Astrophys. J. 2025, 984, 146. [Google Scholar] [CrossRef]
- Kandel, D.; Romani, R.W.; An, H. The Synchrotron Emission Pattern of IntraBinary Shocks. Astrophys. J. 2019, 879, 73. [Google Scholar]
- Sim, M.; An, H.; Wadiasingh, Z. Modeling X-Ray and Gamma-Ray Emission from Redback Pulsar Binaries. Astrophys. J. 2024, 964, 109. [Google Scholar] [CrossRef]
- de Angelis, A.; Tatischeff, V.; Grenier, I.A.; McEnery, J.; Mallamaci, M.; Tavani, M.; Oberlack, U.; Hanlon, L.; Walter, R.; Argan, A.; et al. Science with e-ASTROGAM. A space mission for MeV-GeV gamma-ray astrophysics. J. High Energy Astrophys. 2018, 19, 1–106. [Google Scholar] [CrossRef]
- McEnery, J.; van der Horst, A.; Dominguez, A.; Moiseev, A.; Marcowith, A.; Harding, A.; Lien, A.; Giuliani, A.; Inglis, A.; Ansoldi, S.; et al. All-sky Medium Energy Gamma-ray Observatory: Exploring the Extreme Multimessenger Universe. Proc. Bull. Am. Astron. Soc. 2019, 51, 245. [Google Scholar] [CrossRef]
- Orlando, E.; Bottacini, E.; Moiseev, A.A.; Bodaghee, A.; Collmar, W.; Ensslin, T.; Moskalenko, I.V.; Negro, M.; Profumo, S.; Digel, S.W.; et al. Exploring the MeV sky with a combined coded mask and Compton telescope: The Galactic Explorer with a Coded aperture mask Compton telescope (GECCO). J. Cosmol. Astropart. Phys. 2022, 2022, 036. [Google Scholar] [CrossRef]


Disclaimer/Publisher’s Note: The statements, opinions and data contained in all publications are solely those of the individual author(s) and contributor(s) and not of MDPI and/or the editor(s). MDPI and/or the editor(s) disclaim responsibility for any injury to people or property resulting from any ideas, methods, instructions or products referred to in the content. |
© 2025 by the authors. Licensee MDPI, Basel, Switzerland. This article is an open access article distributed under the terms and conditions of the Creative Commons Attribution (CC BY) license (https://creativecommons.org/licenses/by/4.0/).