
Measurement of Ion Mobilities for the Ion-TPC of NvDEx Experiment

 ,
, 
Abstract
1. Introduction
2. Experimental Apparatus and Method
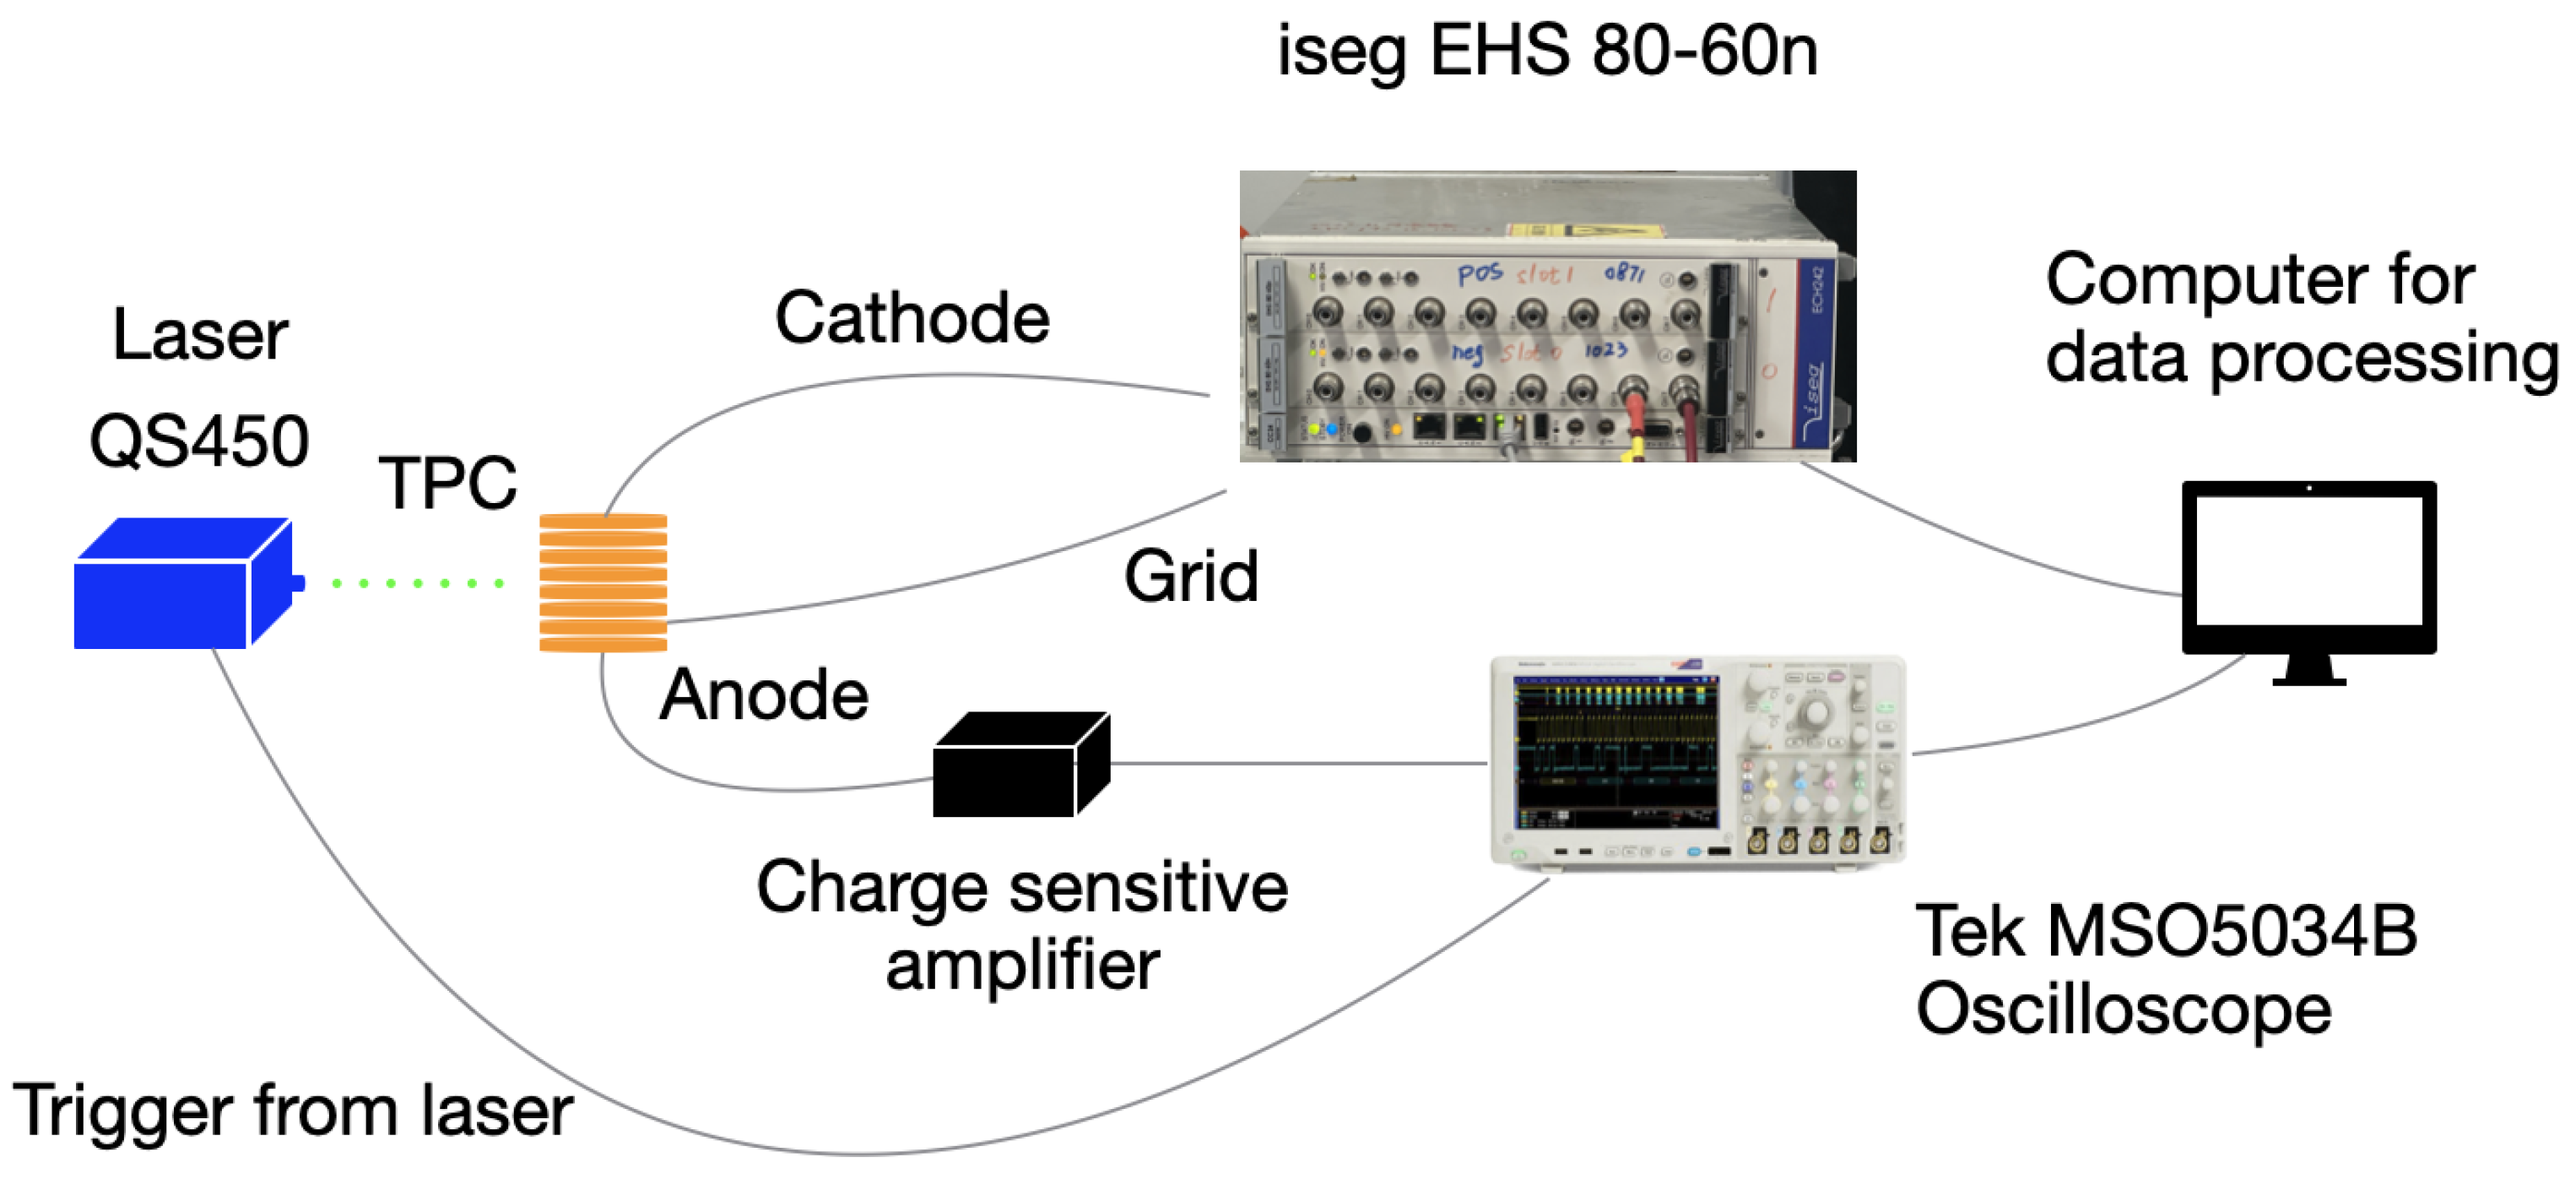
2.1. Device Setup
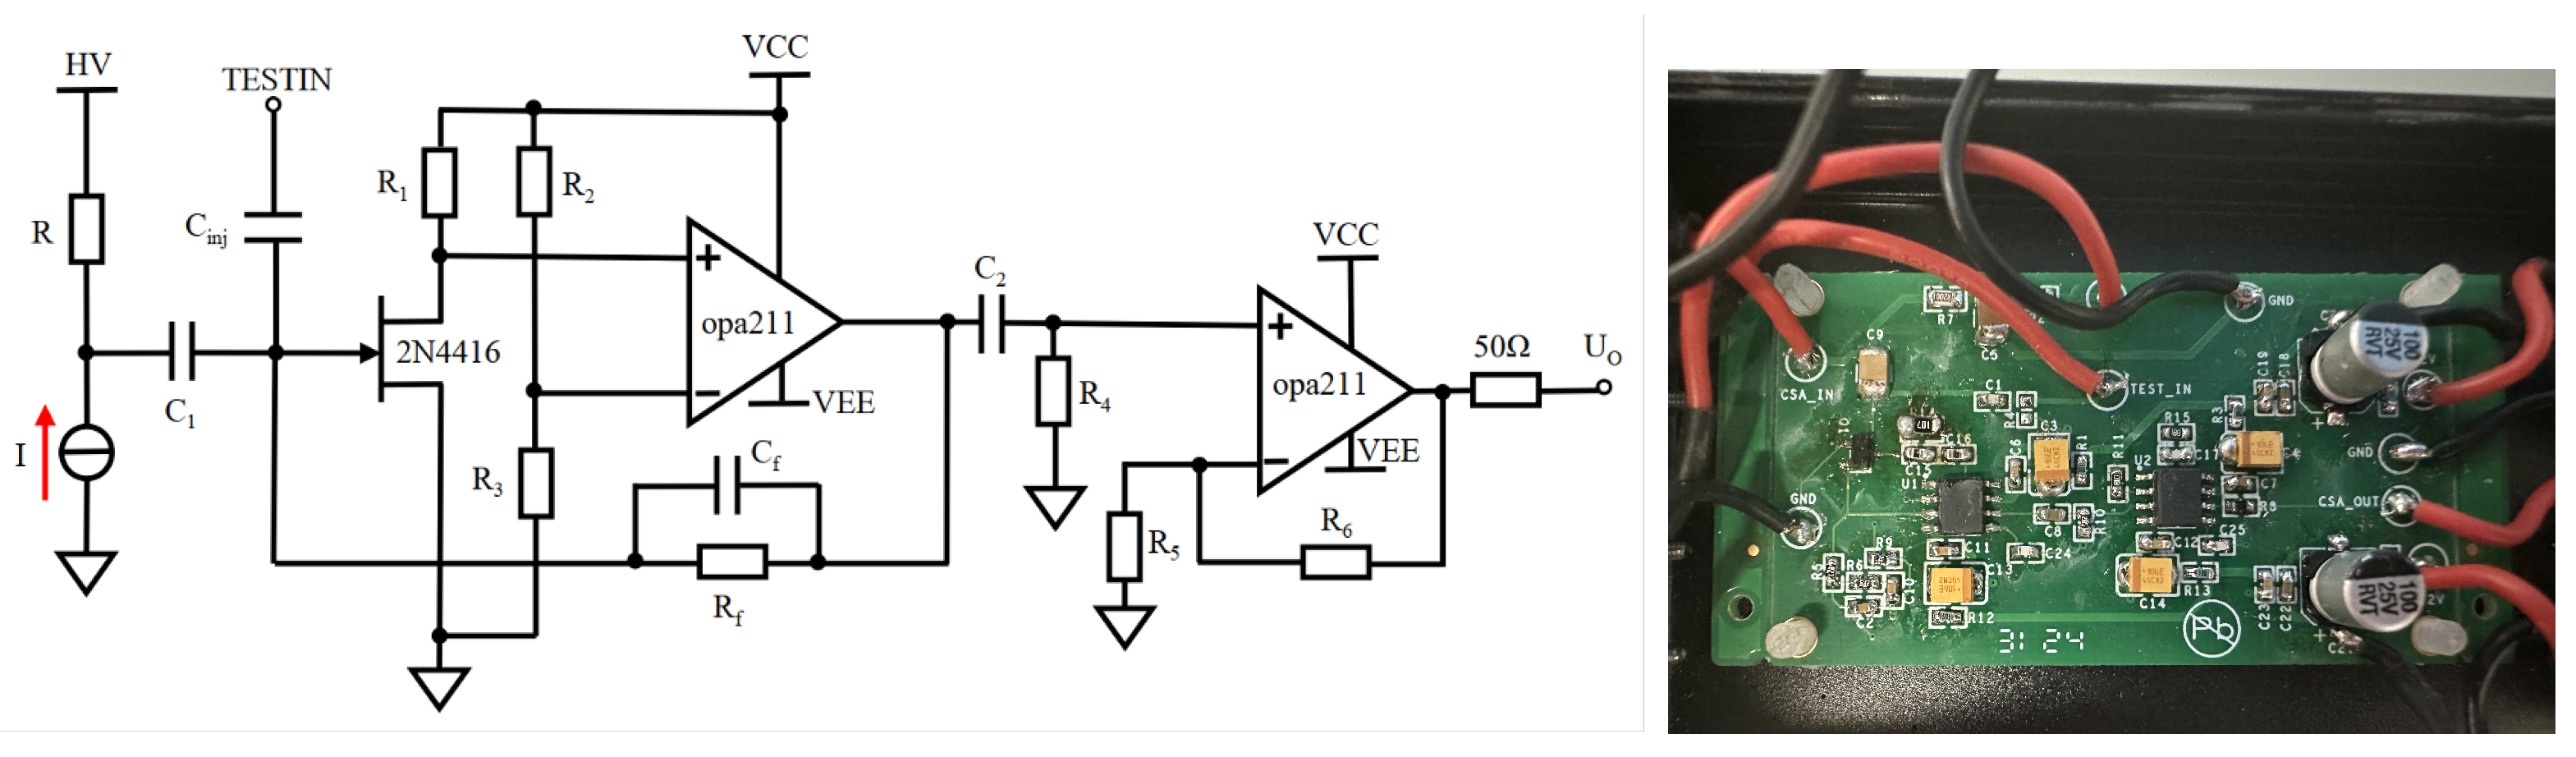
2.2. The CSA
3. Results of Measurement
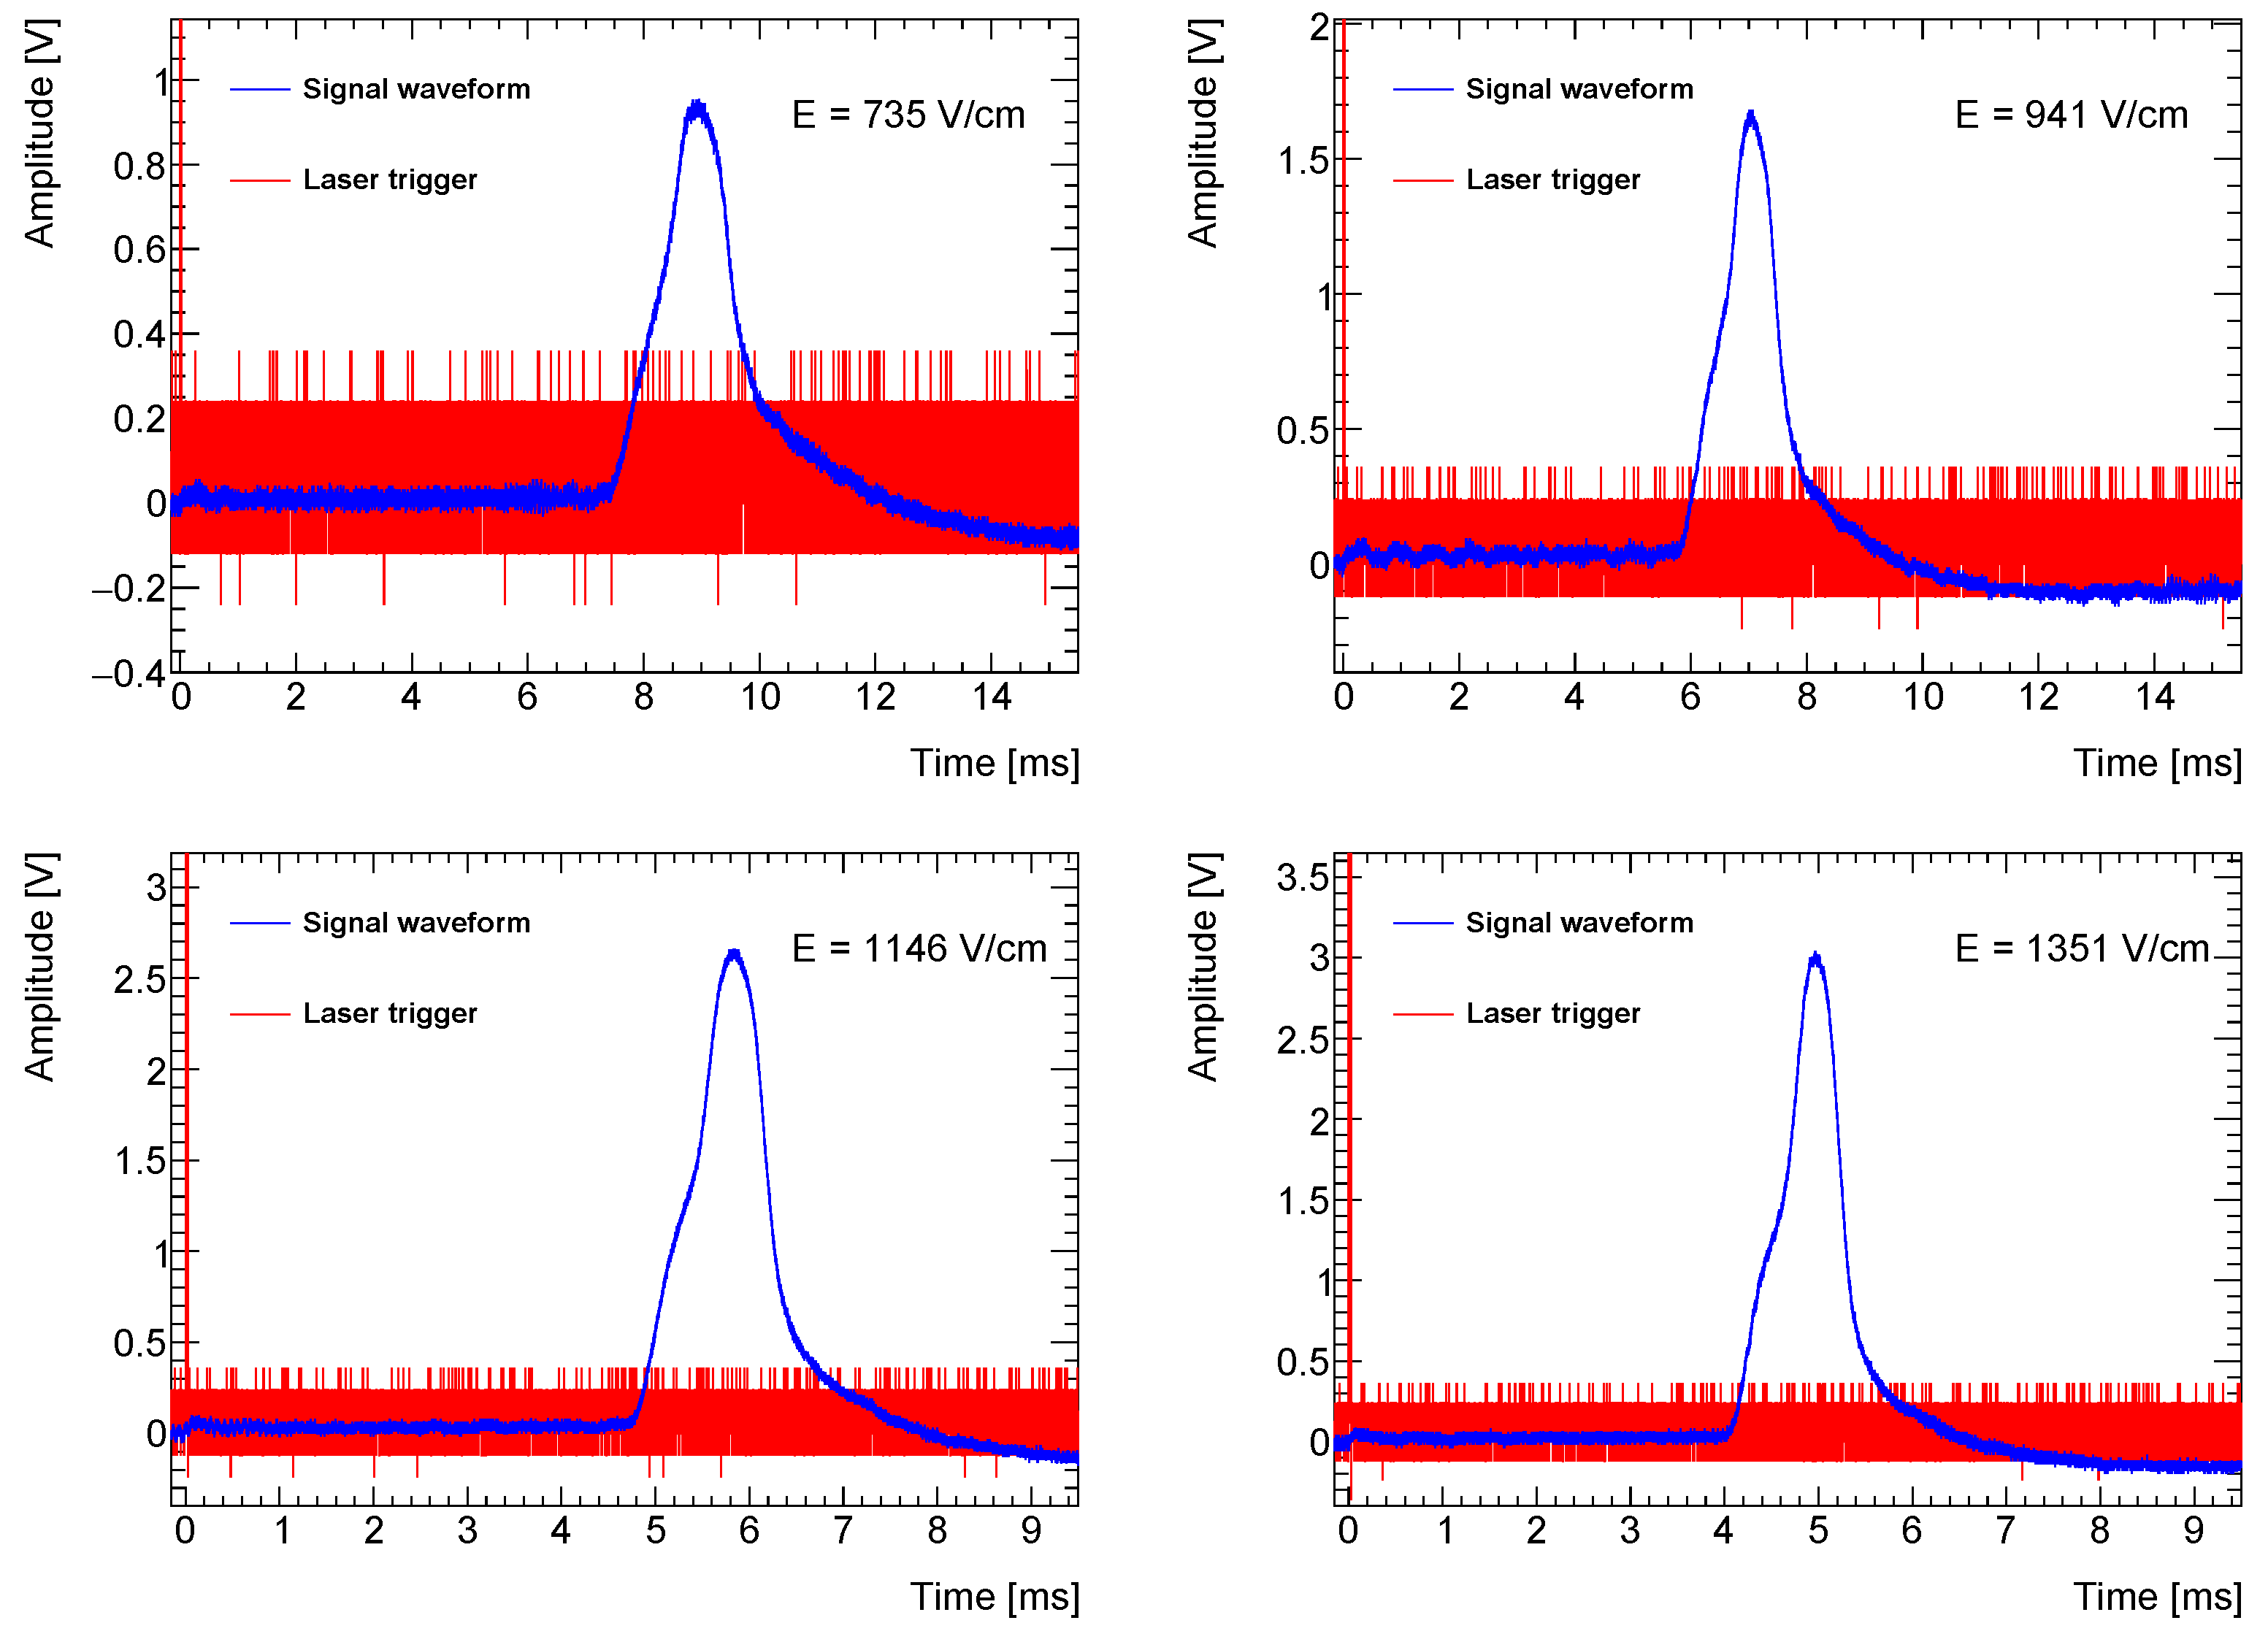
3.1. Waveforms of
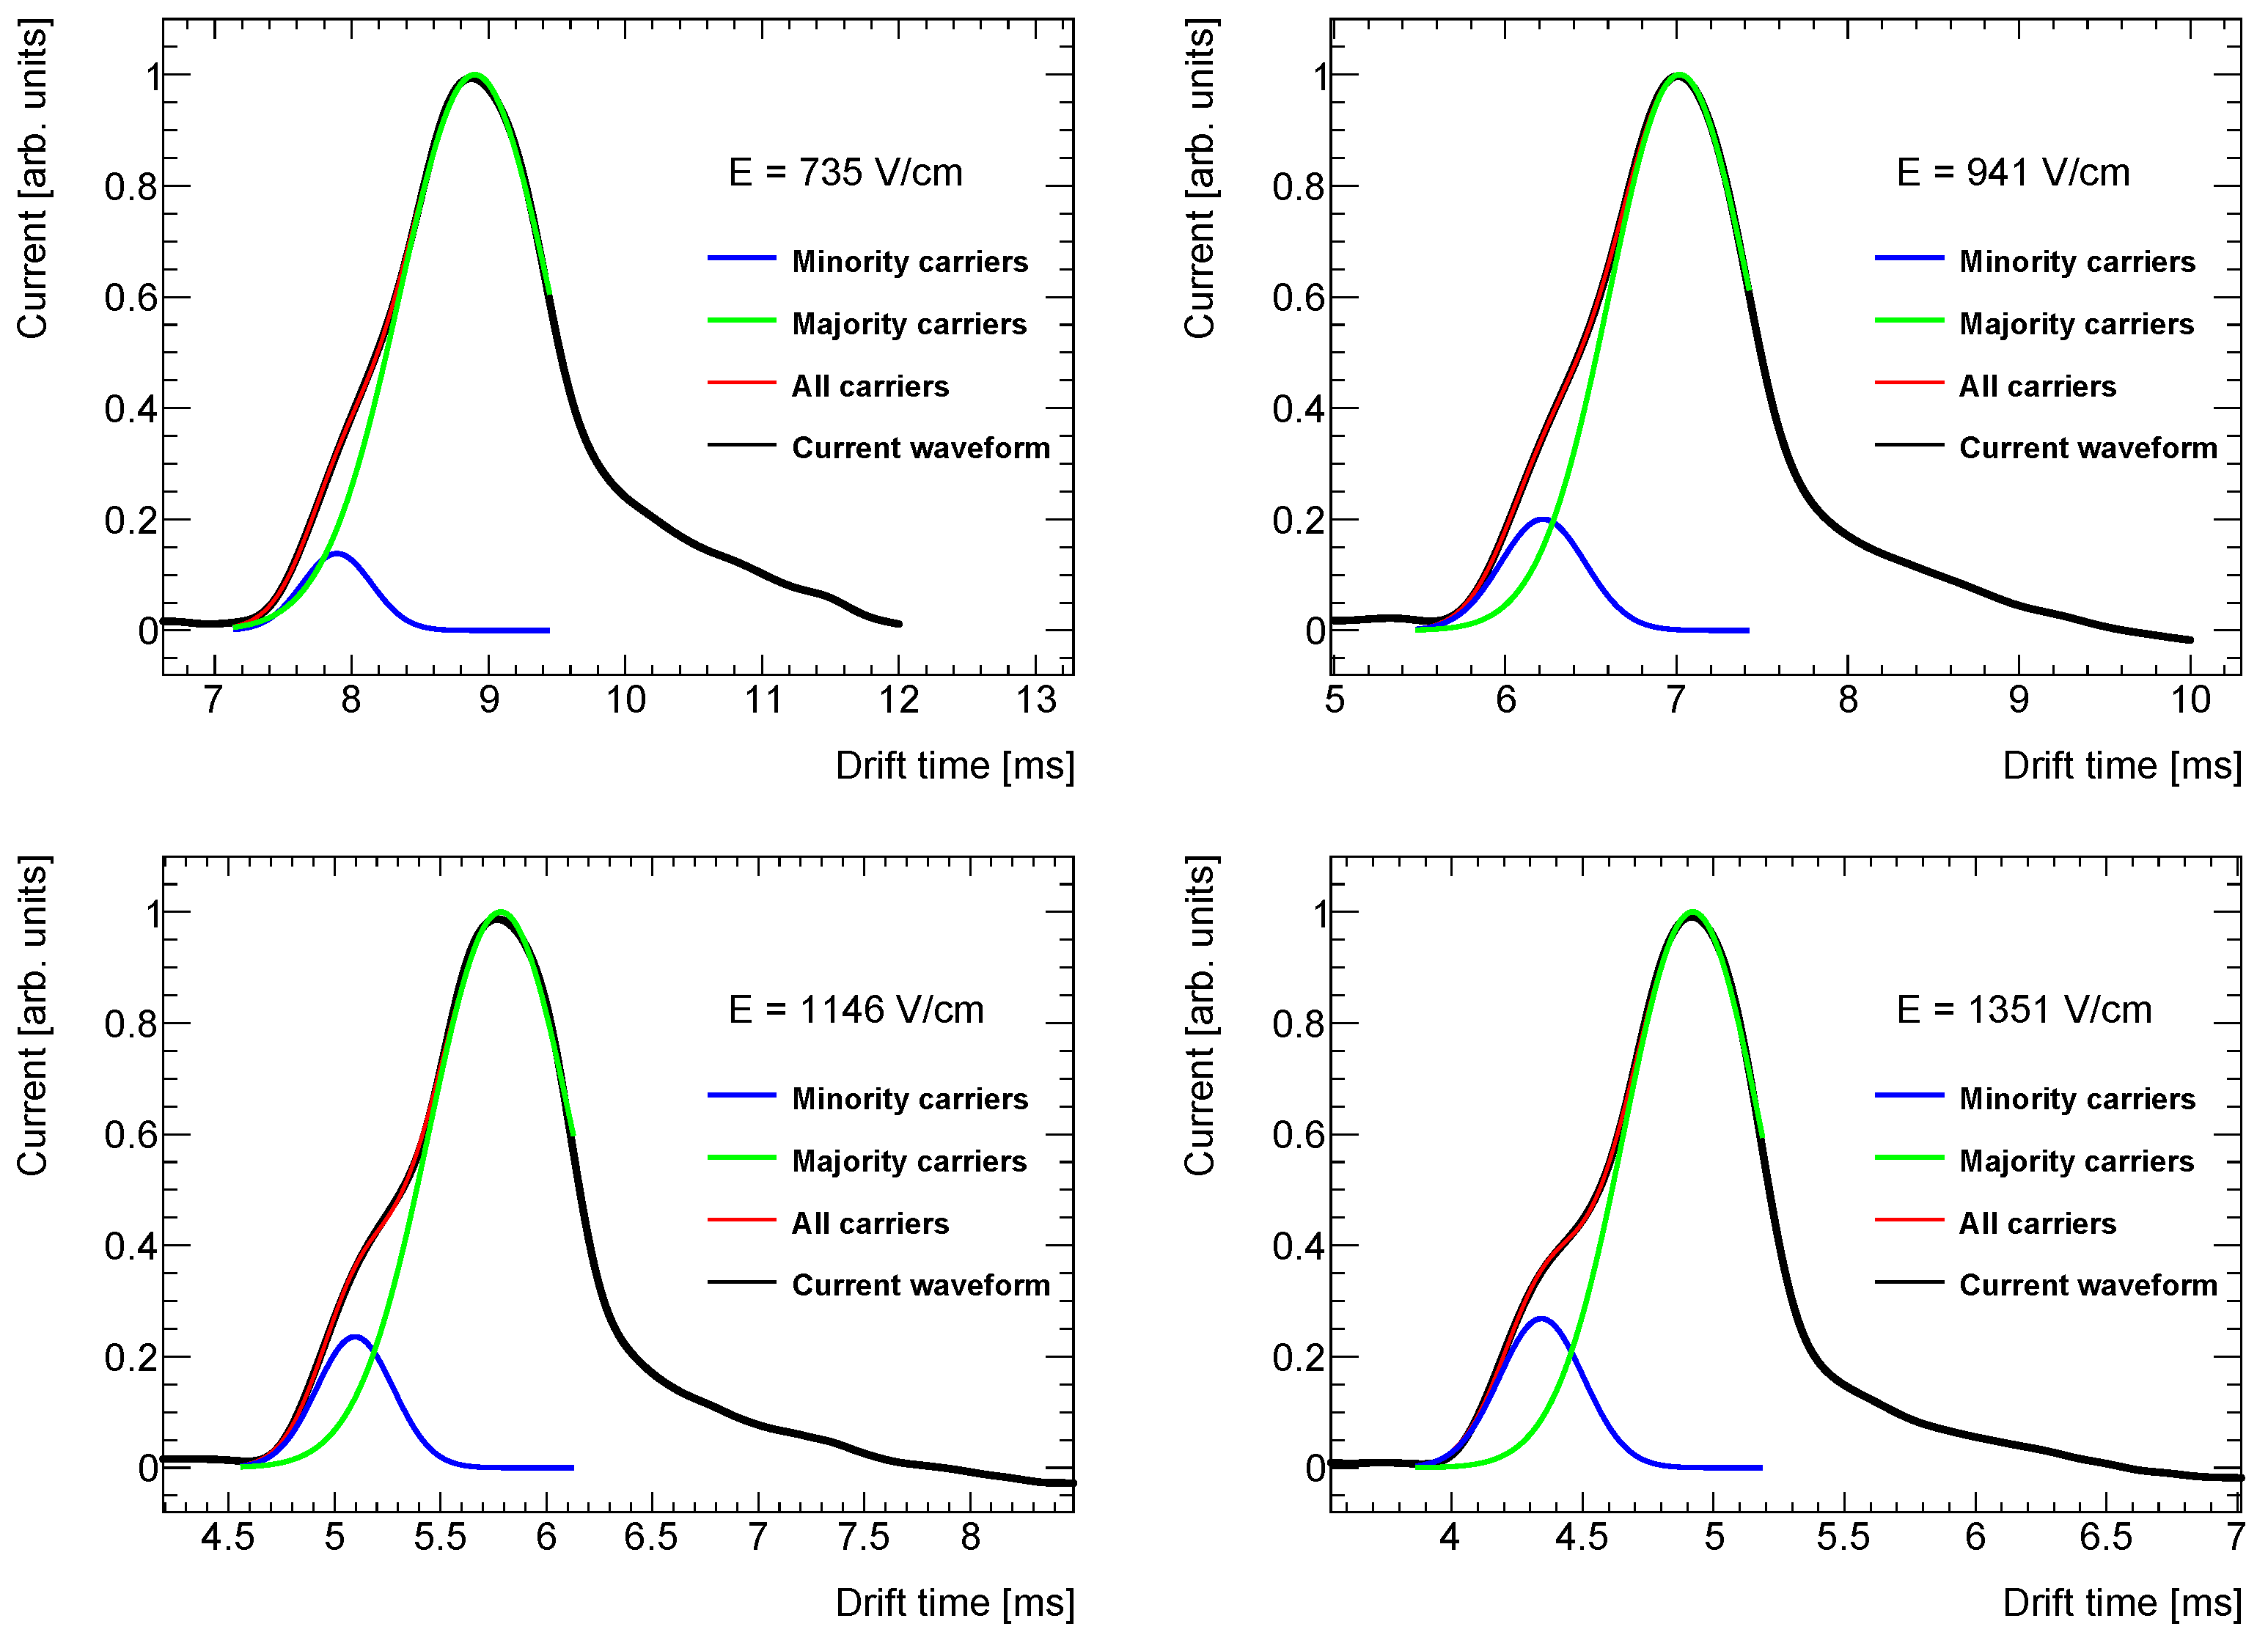
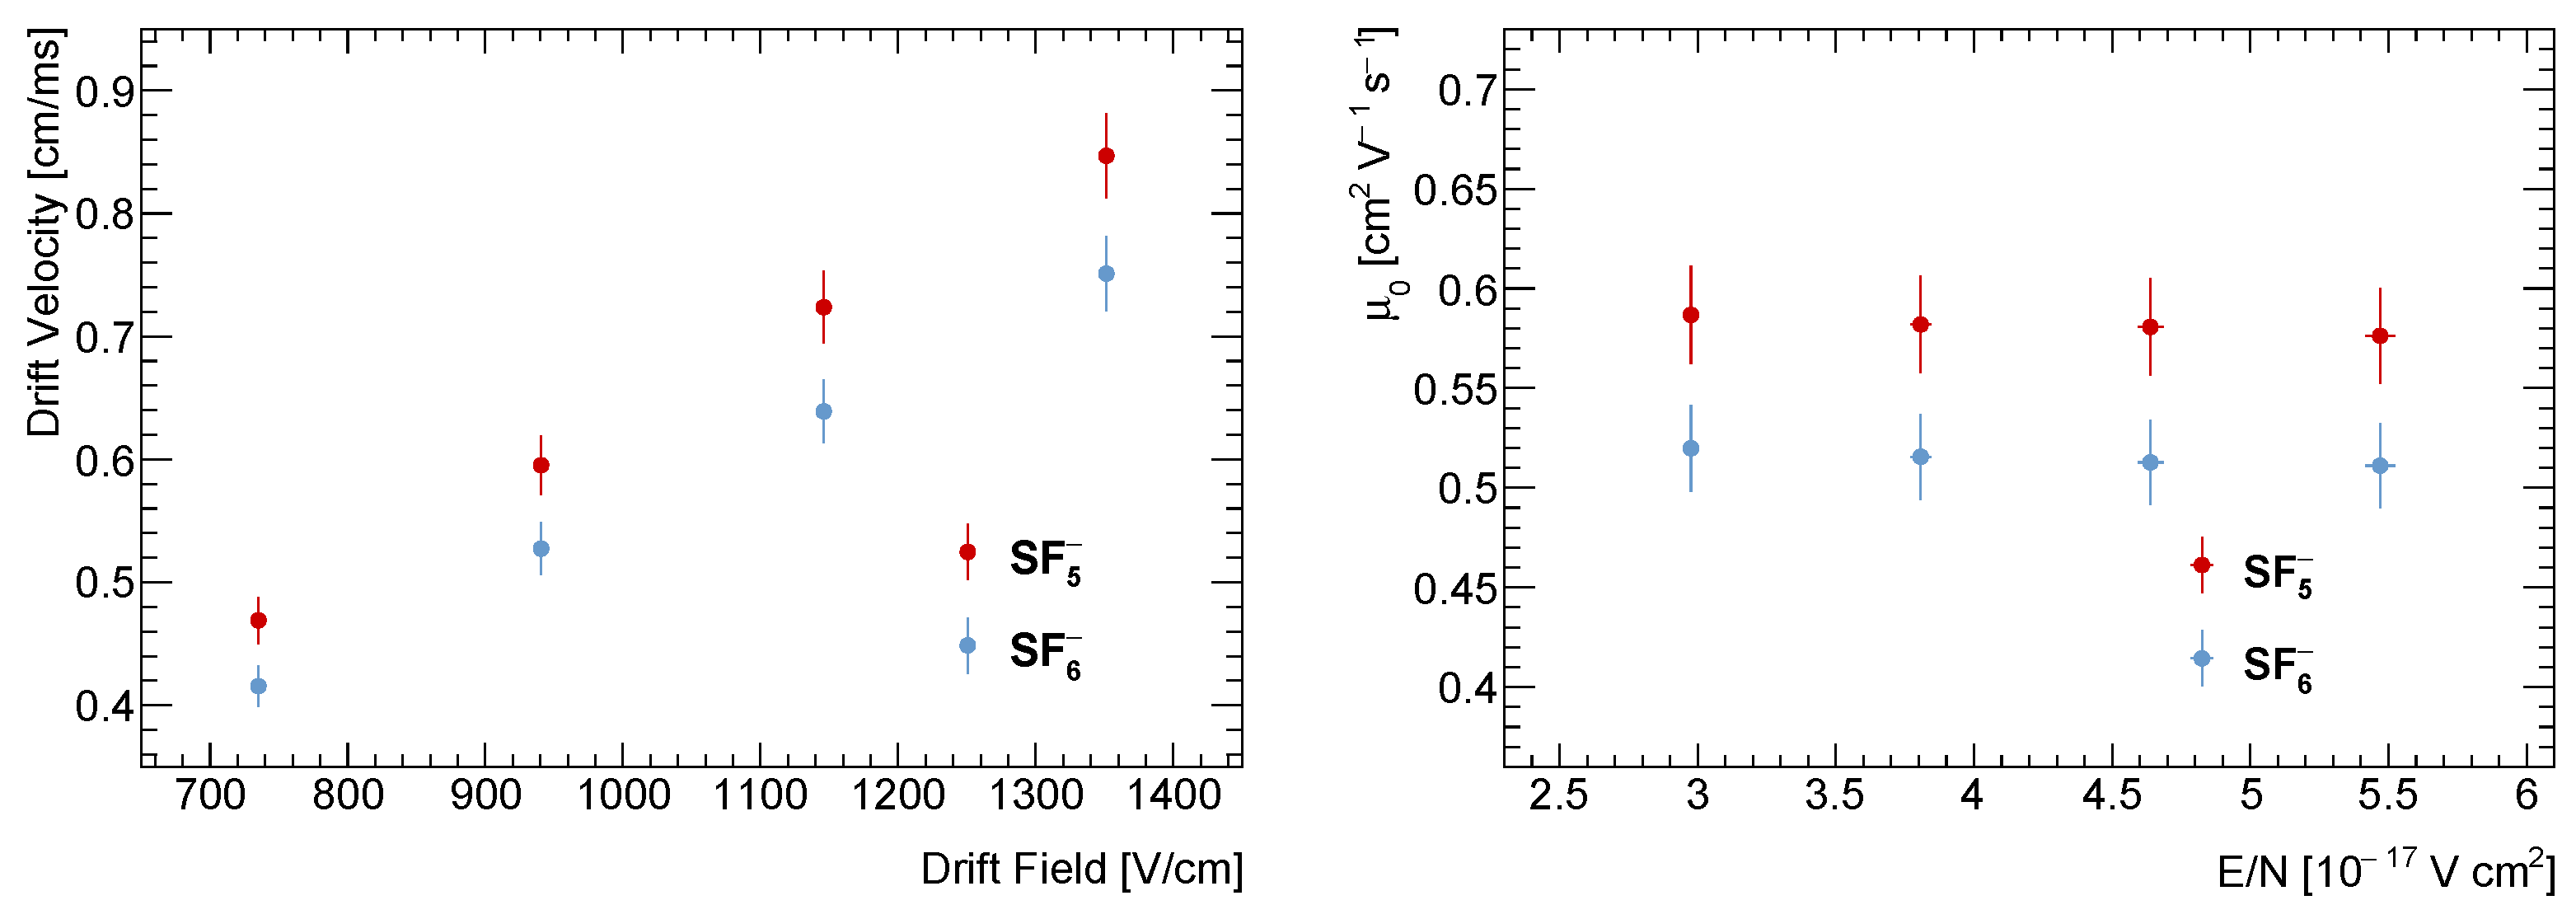
3.2. Drift Velocities and Mobilities
4. Reconstruction of z Coordinate
5. Conclusions
Author Contributions
Funding
Data Availability Statement
Acknowledgments
Conflicts of Interest
References
- Agostini, M. et al. [GERDA Collaboration] Upgrade for phase ii of the gerda experiment. Eur. Phys. J. C 2018, 78, 388. [Google Scholar] [CrossRef]
- Abgrall, N. et al. [Majorana Collaboration] The majorana demonstrator neutrinoless double-beta decay experiment. Adv. High Energy Phys. 2014, 2014, 365432. [Google Scholar] [CrossRef]
- Abgrall, N. et al. [LEGEND Collaboration] Legend-1000 preconceptual design report. arXiv 2021, arXiv:2107.11462. [Google Scholar]
- Wang, L.; Yue, Q.; Kang, K.; Cheng, J.; Li, Y.; Wong, T.H.; Lin, S.; Chang, J.; Chen, J.; Chen, Q.; et al. First results on 76Ge neutrinoless double beta decay from CDEX-1 experiment. Sci. China Phys. Mech. Astron. 2017, 60, 071011. [Google Scholar] [CrossRef]
- Auger, M.; Auty, D.J.; Barbeau, P.S.; Bartoszek, L.; Baussan, E.; Beauchamp, E.; Benitez-Medina, C.; Breidenbach, M.; Chauhan, D.; Cleveland, B.; et al. The EXO-200 detector, part i: Detector design and construction. J. Instrum. 2012, 7, P05010. [Google Scholar] [CrossRef]
- Adhikari, G.; Al Kharusi, S.; Angelico, E.; Anton, G.; Arnquist, I.J.; Badhrees, I.; Bane, J.; Belov, V.; Bernard, E.P.; Bhatta, T.; et al. nEXO: Neutrinoless double beta decay search beyond 1028 year half-life sensitivity. J. Phys. G Nucl. Part. Phys. 2021, 49, 015104. [Google Scholar] [CrossRef]
- Novella, P. et al. [The NEXT Collaboration] Demonstration of neutrinoless double beta decay searches in gaseous xenon with NEXT. J. High Energy Phys. 2023, 2023, 190. [Google Scholar] [CrossRef]
- Chen, X.; Fu, C.; Giboni, K.; Giuliani, F.; Gu, L.; Han, K.; Ji, X.; Lin, H.; Liu, J.; Ni, K.; et al. PandaX-III: Searching for neutrinoless double beta decay with high pressure 136Xe gas time projection chambers. Sci. China Phys. Mech. Astron. 2017, 60, 061011. [Google Scholar] [CrossRef]
- Akerib, D.S. et al. [LZ Collaboration] Lux-zeplin (lz) conceptual design report. arXiv 2015, arXiv:1509.02910. [Google Scholar]
- Aalbers, J.; Agostini, F.; Alfonsi, M.; Amaro, F.; Amsler, C.; Aprile, E.; Arazi, L.; Arneodo, F.; Barrow, P.; Baudis, L.; et al. DARWIN: Towards the ultimate dark matter detector. J. Cosmol. Astropart. Phys. 2016, 2016, 017. [Google Scholar] [CrossRef]
- Abe, S. et al. [KamLAND-Zen Collaboration] Search for the majorana nature of neutrinos in the inverted mass ordering region with kamland-zen. Phys. Rev. Lett. 2023, 130, 051801. [Google Scholar] [CrossRef] [PubMed]
- Albanese, V. et al. [The SNO+ Collaboration] The SNO+ experiment. J. Instrum. 2021, 16, P08059. [Google Scholar] [CrossRef]
- Alduino, C.; Alessandria, F.; Balata, M.; Biare, D.; Biassoni, M.; Bucci, C.; Caminata, A.; Canonica, L.; Cappelli, L.; Ceruti, G.; et al. The CUORE cryostat: An infrastructure for rare event searches at millikelvin temperatures. Cryogenics 2019, 102, 9–21. [Google Scholar] [CrossRef]
- CUPID Interest Group. Cupid pre-CDR. arXiv 2019, arXiv:1907.09376. [Google Scholar]
- Bandac, I.C. et al. [The CROSS Collaboration] The 0ν2β-decay cross experiment: Preliminary results and prospects. J. High Energy Phys. 2020, 2020, 18. [Google Scholar] [CrossRef]
- Lee, M. AMoRE: A search for neutrinoless double-beta decay of 100Mo using low-temperature molybdenum-containing crystal detectors. J. Instrum. 2020, 15, C08010. [Google Scholar] [CrossRef]
- Arnold, R. et al. [NEMO-3 Collaboration] Results of the search for neutrinoless double-β decay in 100Mo with the nemo-3 experiment. Phys. Rev. D 2015, 92, 072011. [Google Scholar] [CrossRef]
- Piquemal, F. The SuperNEMO project. Phys. At. Nucl. 2006, 69, 2096–2100. [Google Scholar] [CrossRef]
- Cao, X.-G.; Chang, Y.-L.; Chen, K.; Ciuffoli, E.; Duan, L.-M.; Fang, D.-L.; Gao, C.-S.; Ghorui, S.K.; Hu, P.-C.; Hu, Q.; et al. NνDEx-100 conceptual design report. Nucl. Sci. Tech. 2023, 35, 3. [Google Scholar] [CrossRef]
- Nygren, D.; Jones, B.; López-March, N.; Mei, Y.; Psihas, F.; Renner, J. Neutrinoless double beta decay with 82SeF6 and direct ion imaging. J. Instrum. 2018, 13, P03015. [Google Scholar] [CrossRef]
- Lang, L.; Hu, Y.; Yu, Z.; You, B.; Liang, T.; He, Z.; Liu, J.; Huang, G.; Wang, H.; Xiao, L.; et al. Design and demonstration of digital readout chain in NνDEx experiment. IEEE Trans. Nucl. Sci. 2023, 70, 2499–2505. [Google Scholar] [CrossRef]
- Yang, Y.; Liang, T.; Gao, C.; Zhang, D.; Chen, K.; Wang, H.; Liu, J.; Liu, L.; Qiao, Y.; Hu, Z.; et al. Design and preliminary test results of the charge sensitive amplifier for gain-less charge readout in high-pressure TPC. J. Instrum. 2024, 19, C03031. [Google Scholar] [CrossRef]
- Liang, T.; Zhang, D.; Wang, H.; Gao, C.; Liu, J.; Sun, X.; Xiao, L.; Liu, F.; You, B.; Liu, L.; et al. Performance of a novel charge sensor on the ion detection for the development of a high-pressure avalancheless ion TPC. J. Instrum. 2024, 19, C04004. [Google Scholar] [CrossRef]
- Phan, N.; Lafler, R.; Lauer, R.; Lee, E.; Loomba, D.; Matthews, J.; Miller, E. The novel properties of SF6 for directional dark matter experiments. J. Instrum. 2017, 12, P02012. [Google Scholar] [CrossRef]
- Texas Instruments. OPA211: Ultra-Low Noise, Precision Operational Amplifier. Data Sheet, Document Number: SBOS377M. 2022. Available online: https://www.ti.com/lit/ds/symlink/opa211.pdf (accessed on 10 May 2025).


Disclaimer/Publisher’s Note: The statements, opinions and data contained in all publications are solely those of the individual author(s) and contributor(s) and not of MDPI and/or the editor(s). MDPI and/or the editor(s) disclaim responsibility for any injury to people or property resulting from any ideas, methods, instructions or products referred to in the content. |
© 2025 by the authors. Licensee MDPI, Basel, Switzerland. This article is an open access article distributed under the terms and conditions of the Creative Commons Attribution (CC BY) license (https://creativecommons.org/licenses/by/4.0/).
Share and Cite
Liang, T.; Zhan, M.; Wang, H.; Wei, X.; Zhang, D.; Liu, J.; Lu, C.; Hu, Q.; Yang, Y.; Gao, C.; et al. Measurement of Ion Mobilities for the Ion-TPC of NvDEx Experiment. Universe 2025, 11, 163. https://doi.org/10.3390/universe11050163
Liang T, Zhan M, Wang H, Wei X, Zhang D, Liu J, Lu C, Hu Q, Yang Y, Gao C, et al. Measurement of Ion Mobilities for the Ion-TPC of NvDEx Experiment. Universe. 2025; 11(5):163. https://doi.org/10.3390/universe11050163
Chicago/Turabian StyleLiang, Tianyu, Meiqiang Zhan, Hulin Wang, Xianglun Wei, Dongliang Zhang, Jun Liu, Chengui Lu, Qiang Hu, Yichen Yang, Chaosong Gao, and et al. 2025. "Measurement of Ion Mobilities for the Ion-TPC of NvDEx Experiment" Universe 11, no. 5: 163. https://doi.org/10.3390/universe11050163
APA StyleLiang, T., Zhan, M., Wang, H., Wei, X., Zhang, D., Liu, J., Lu, C., Hu, Q., Yang, Y., Gao, C., Xiao, L., Sun, X., Liu, F., Zhao, C., Qiu, H., & Chen, K. (2025). Measurement of Ion Mobilities for the Ion-TPC of NvDEx Experiment. Universe, 11(5), 163. https://doi.org/10.3390/universe11050163