Article

Superluminal Motion and Jet Parameters in the High-Redshift Blazar J1429+5406

1
Department of Astronomy, Institute of Physics and Astronomy, ELTE Eötvös Loránd University, Pázmány Péter Sétány 1/A, H-1117 Budapest, Hungary
2
Konkoly Observatory, HUN-REN Research Centre for Astronomy and Earth Sciences, Konkoly Thege Miklós út 15-17, H-1121 Budapest, Hungary
3
CSFK, MTA Centre of Excellence, Konkoly Thege Miklós út 15-17, H-1121 Budapest, Hungary
4
Institute of Physics and Astronomy, ELTE Eötvös Loránd University, Pázmány Péter Sétány 1/A, H-1117 Budapest, Hungary
*
Author to whom correspondence should be addressed.
Universe 2025, 11(5), 157; https://doi.org/10.3390/universe11050157
Submission received: 23 April 2025 / Revised: 7 May 2025 / Accepted: 9 May 2025 / Published: 11 May 2025
(This article belongs to the Special Issue Advances in Studies of Galaxies at High Redshift)

Abstract

:
We investigate the relativistic jet of the powerful radio-emitting blazar J1429+5406 at redshift z = 3.015 . Our understanding of jet kinematics in z 3 quasars is still rather limited, based on a sample of less than about 50 objects. The blazar J1429+5406 was observed at a high angular resolution using the method of very long baseline interferometry over more than two decades, between 1994 and 2018. These observations were conducted at five radio frequencies, covering a wide range from 1.7 to 15 GHz. The outer jet components at ∼20–40 milliarcsecond (mas) separations from the core do not show discernible apparent motion. On the other hand, three jet components within the central 10 mas region exhibit significant proper motion in the range of (0.045–0.16) mas year−1, including one that is among the fastest-moving jet components at z 3 known to date. Based on the proper motion of the innermost jet component and the measured brightness temperature of the core, we estimated the Doppler factor, the bulk Lorentz factor, and the inclination angle of the jet with respect to the line of sight. The core brightness temperature is at least 3.6 × 10 11 K, well exceeding the equipartition limit, indicating Doppler-boosted radio emission. The low jet inclination (≲5.4°) firmly places J1429+5406 into the blazar category.

1. Introduction

The largely unexplored, high-redshift ( z 3 ) domain of the Universe is key to understanding the evolution of active galactic nuclei (AGN) [1]. By analysing these objects, we can determine whether AGN in the early Universe functioned similarly to those in our local cosmic neighbourhood.
Supermassive black holes (SMBHs) are an essential component of AGN. These black holes have masses ranging from approximately 10 6 to 10 10 solar masses [2] and are believed to reside at the center of every major galaxy [3]. As matter spirals into the SMBH, the galactic core can reach extremely high bolometric luminosities ( L bol 10 48 erg s−1), thousands of times brighter than an entire normal galaxy [2]. Under the influence of the strong magnetic field, not all of the accreted plasma falls into the SMBH; instead, some material is ejected along the SMBH spin axis at relativistic speeds [4]. The magnetic field collimates this outflow into bipolar relativistic jets [4]. The charged particles experience acceleration along helical trajectories due to the Lorentz force in the magnetic field. As a result, they emit synchrotron radiation that can be detected in the radio [5]. The reason why only ≲ 10 % [6] of known AGN are radio-loud and “jetted” is still an open question [7,8].
The technique of very long baseline interferometry (VLBI) [9] uses coordinated observations performed by an extended network of radio telescopes to achieve the highest possible angular resolution. With a global VLBI array, resolutions of around a milliarcsecond (mas) can be achieved at cm wavelengths. In many AGN, instead of symmetric two-sided jets, strongly asymmetric structures are observed with VLBI. The appearance of one-sided core–jet structures is attributed to Doppler beaming, a relativistic effect where the emission from the approaching jet closely aligned with the observer’s line of sight is boosted, while the emission from the opposite (receding) jet is diminished [10].
In blazars, the jet is viewed at an angle of 10° or less [11], causing its Doppler-boosted emission to dominate the spectral energy distribution. Blazars are further categorized into two main types: BL Lac objects and flat-spectrum radio quasars (FSRQs). FSRQs exhibit strong and broad optical emission lines, whereas BL Lac objects have weak or no optical emission lines as they are suppressed by the continuum. Additionally, FSRQs possess higher bolometric luminosities [12]. As a result, they dominate the known high-redshift ( z 3 ) blazar population, as they are significantly brighter than BL Lac objects.
Some studies suggest that SMBHs grow faster in jetted quasars compared to radio-quiet AGN [13], indicating a connection between jet activity and black hole growth [14]. The most distant known blazar has a redshift of nearly z = 7 [15], while AGN have been discovered with redshifts as high as z = 10 [16]. However, jetted AGN do not appear to be dominant in the early Universe, as they have only been observed up to z < 7 [17]. Radio-loud quasars are rare even beyond z 4 , based on current observations [18].
According to a recent work [19], the number of radio quasars at z 3 whose jet kinematics and physics have been studied by means of multi-epoch high-resolution VLBI observations is currently about 50 [20,21,22,23,24,25,26,27,28]. The VLBI jet kinematic analysis of the flat-spectrum radio quasar [29] J1429+5406 (TXS 1427+543) presented here provides a valuable addition to the sample studied to date, offering an interesting comparison with other high-redshift jetted AGN. The right ascension and declination coordinates of the object in the VLBI-based International Celestial Reference Frame [30] are RA = 14 h 29 min 21 . 87879 s and DEC = 54 ° 06 11.1228 , respectively, at 2015.0 as the reference epoch. We consider the spectroscopic redshift determined recently as z = 3.0151 ± 0.0002 based on measurements from the Dark Energy Spectroscopic Instrument [31]. The radio source has a two-point spectral index of α 1.4 GHz 3.0 GHz = 0.68 [32] (following the convention S ν α , where S is the flux density and ν the observing frequency). The flux densities of J1429+5406 are 1165 mJy at 1.4 GHz in the FIRST (Faint Images of the Radio Sky at Twenty-centimeters) survey [33], 792 mJy at 3 GHz in the VLASS (Very Large Array Sky Survey) [34], and 493 mJy at 8.4 GHz measured with the VLA [35]. While the source is compact on arcsecond scales [33,34], 8.4 -GHz VLA imaging at ∼ 0 . 2 resolution revealed an extension in the 110° position angle [35]. The source was also detected in X-rays by ROSAT with the flux of ( 3.6 ± 1.1 ) × 10 13 erg s−1 cm−2 in the (0.1–2.4) keV band [36] and in γ -rays by the Fermi Large Area Telescope [1,37]. It is faint in the optical, with apparent magnitude m V 20.4 [38].
Here we present the analysis of archival multi-frequency VLBI observations of J1429+5406 obtained between 1994 and 2018. Section 2 details the observations and data reduction, Section 3 presents the results, Section 4 provides a discussion, and Section 5 summarizes our findings.
Throughout this paper, we assume a standard flat Λ Cold Dark Matter cosmological model with parameters H 0 = 67.8 km s 1 Mpc 1 , Ω m = 0.308 , and Ω Λ = 0.692 [39]. In this model, the luminosity distance of J1429+5406 is D L = 26196 Mpc and 1 mas angular size corresponds to 7.878 pc projected linear size at z = 3.015 [40].

2. Observations and Data Analysis

Most of the datasets analyzed here were observed with the Very Long Baseline Array (VLBA). This network consists of ten 25 m diameter antennas in the United States: Brewster (BR), Fort Davis (FD), Hancock (HN), Kitt Peak (KP), Los Alamos (LA), North Liberty (NL), Owens Valley (OV), Pie Town (PT), Mauna Kea (MK), and St. Croix (SC). These calibrated visibility data were obtained from the Astrogeo database (https://astrogeo.org/cgi-bin/imdb_get_source.csh?source=J1429%2B5406, accessed on 18 April 2025). In addition, two datasets were obtained using the European VLBI Network (EVN). The following radio telescopes were involved in at least one EVN observation: Effelsberg (EF; Germany), Jodrell Bank Lovell and Mk2 telescopes (JB and JV; United Kingdom), Medicina (MC; Italy), Toruń (TR; Poland), Onsala (ON; Sweden), Sheshan and Nanshan (SH and UR; China), Badary and Zelenchukskaya (BD and ZC; Russia), and the phased array of the Westerbork Synthesis Radio Telescope (WB; The Netherlands). The EVN data were obtained in the project EF022 (PI: S. Frey) in 2010, when J1429+5406 was used as a phase-reference calibrator for the nearby faint radio quasar J1429+5447 at an extremely high redshift ( z = 6.21 ) [41]. Altogether, the five observed frequency bands were 1.7 , 2.3 , 5, 8.3–8.7, and 15.4 GHz (L, S, C, X, and U bands, respectively). For the sake of simplicity, we collectively refer to the frequency of X-band observations as 8 GHz hereafter. The observing parameters for each dataset are collected in Table 1, where the participating antennas are listed by their two-letter station codes. The minus sign preceding a VLBA station code indicates a telescope not included in the network.
The visibility data downloaded from the Astrogeo archive have previously undergone initial amplitude and phase calibration, as well as the EVN data obtained in the experiment EF022 [41]. We imported these data to the Difmap program [42] for imaging and model fitting. To produce the VLBI images of J1429+5406, we used conventional hybrid mapping with cycles of clean deconvolution [43] and self-calibration [44]. Finally, to quantitatively characterize the brightness distribution, we fitted circular two-dimensional Gaussian model components [45] directly to the self-calibrated visibility data.
Table 1. Details of VLBI observations of J1429+5406.
Epoch ν StationstIF × BWProject Code
(year)(GHz) (s)(MHz)
1994.612 *2.27VLBA177 4 × 4 BB023 [46]
8.34
1998.122 *5.00VLBA2416 2 × 8 BV025A [47,48]
2010.149 *15.37VLBA (–HN)5178 4 × 8 BG197B
2010.4014.99EF, JB, JV, MC, TR, ON, SH, UR, BD, ZC, WB21,105 8 × 16 EF022A [41]
2010.4341.66EF, JB, MC, TR, ON, SH, UR, BD, ZC, WB21,102 8 × 16 EF022B [41]
2017.235 *2.29VLBA339 4 × 32 UF001F [49]
8.67 12 × 32
2018.346 *2.25VLBA (–OV)288 3 × 32 UG002G
8.65 12 × 32
Notes: * data obtained from the Astrogeo database. Col. 1: mean epoch in year; Col. 2: central observing frequency; Col. 3: antennas involved in the measurements; Col. 4: on-source integration time; Col. 5: number of intermediate frequency channels (IF) times the bandwidth per IF; Col. 6: VLBI project code and literature reference (if available).

3. Results

3.1. Core–Jet Structure at Multiple Frequencies

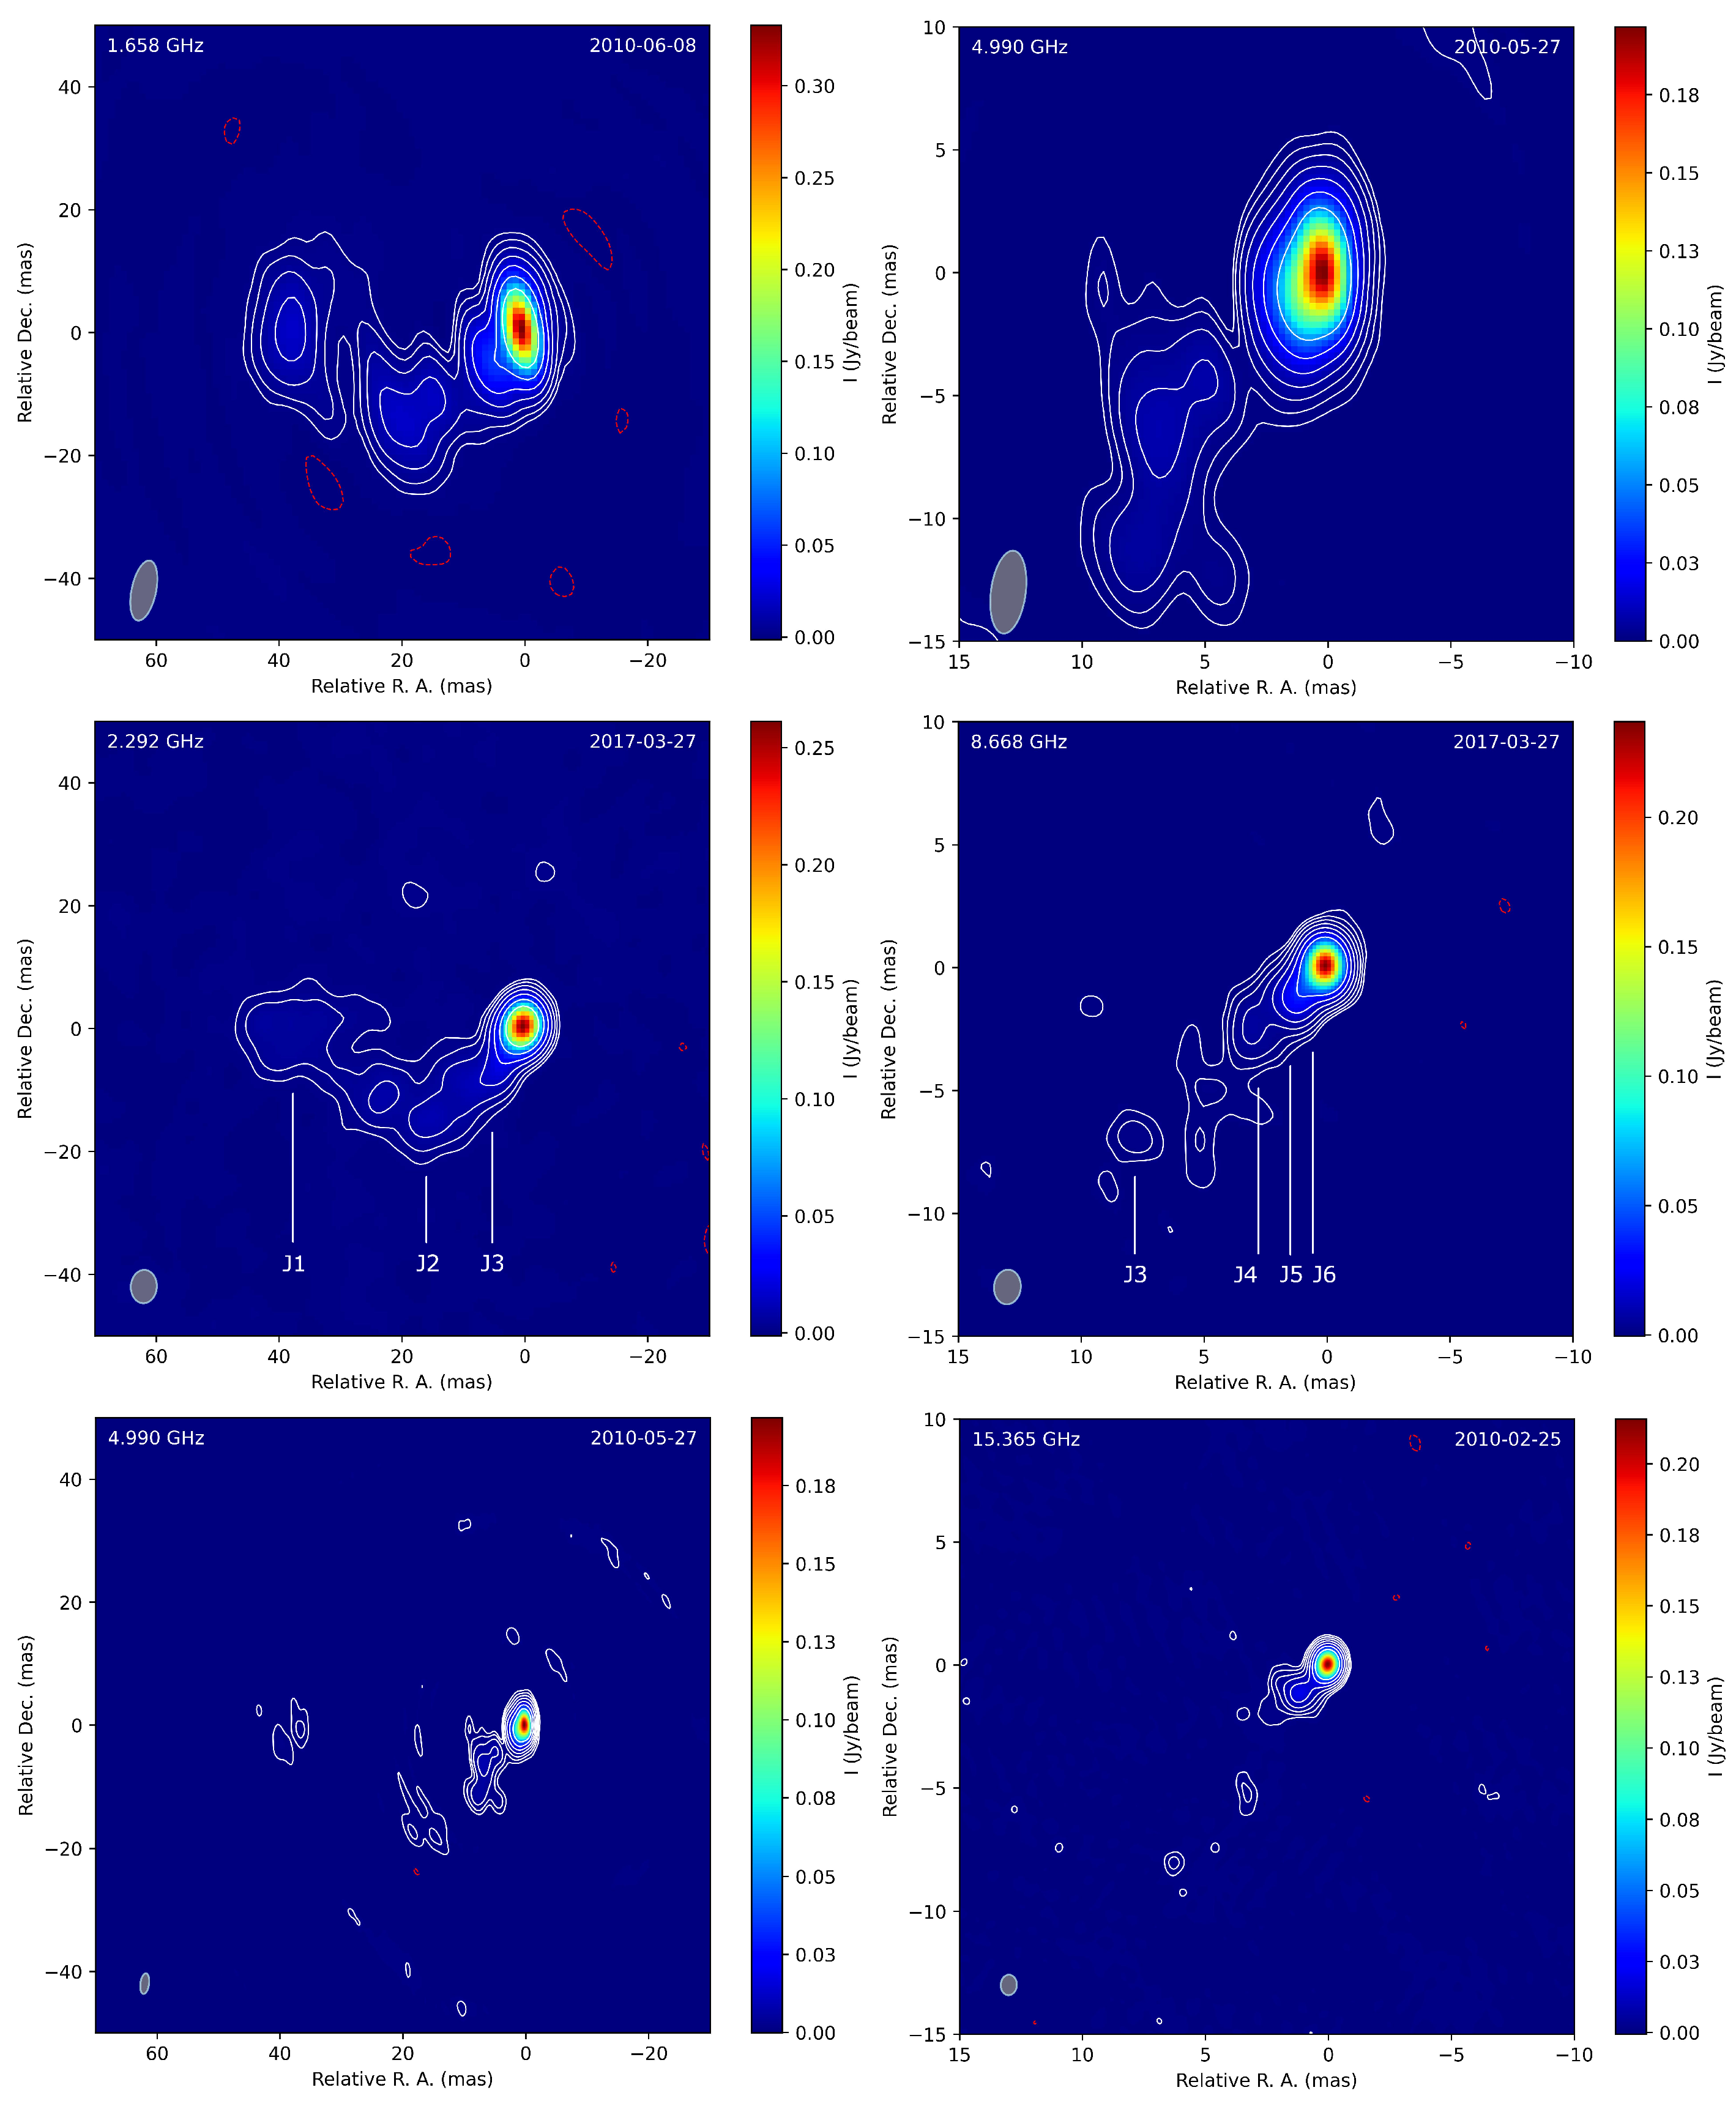
Figure 1 shows example VLBI images of J1429+5406 at each of the frequencies used for observations. The maps presented are based on observations between 2010 and 2017 and are arranged from the lowest to the highest frequency. The maps clearly show the compact, bright core along with multiple extended and fainter jet components at various separations from the core. The image parameters are summarized in Table 2.
The images within the left and right columns in Figure 1 display the same fields of view to facilitate easy comparison between the different frequencies. While the 1.7 , 2.3 , and 5 GHz images on the left of Figure 1 illustrate the full extent of the jet structure revealed by these VLBI observations, the images in the right column zoom into the inner section of the jet at 5, 8, and 15.4 GHz (the 5 GHz image is seen in both the left and right columns, but with different relative right ascension and declination ranges.) Finally, the innermost core–jet region is shown in Figure 2 where the central part of the 15.4 GHz image is reproduced. The diminishing outer extended jet features at higher frequencies are generally consistent with the decreasing spectral index at increasing distances from the core due to spectral aging [50], as well as the increasing angular resolution.

3.2. The Outer Jet Components and Their Proper Motions

The VLBI maps indicate that the jet undergoes a directional change. At the lower frequencies ( 1.7 and 2.3 GHz), which are sensitive to extended structures (Figure 1), the jet’s projection onto the plane of the sky shows a significant turn at approximately 20 mas from the core, changing from southeast to northeast. According to the fitted model parameters (Table A1 and Table A2), the inner jet components are located at position angles ∼140°, while the outermost J1 component has a position angle of ∼90°, indicating a change in the position angle of ∼50°. Note that the position angle of the reported sub-arcsecond extension [35], 110°, is broadly consistent with the VLBI jet direction, although the 8.4 GHz VLA image of J1429+5406 is not published [35].
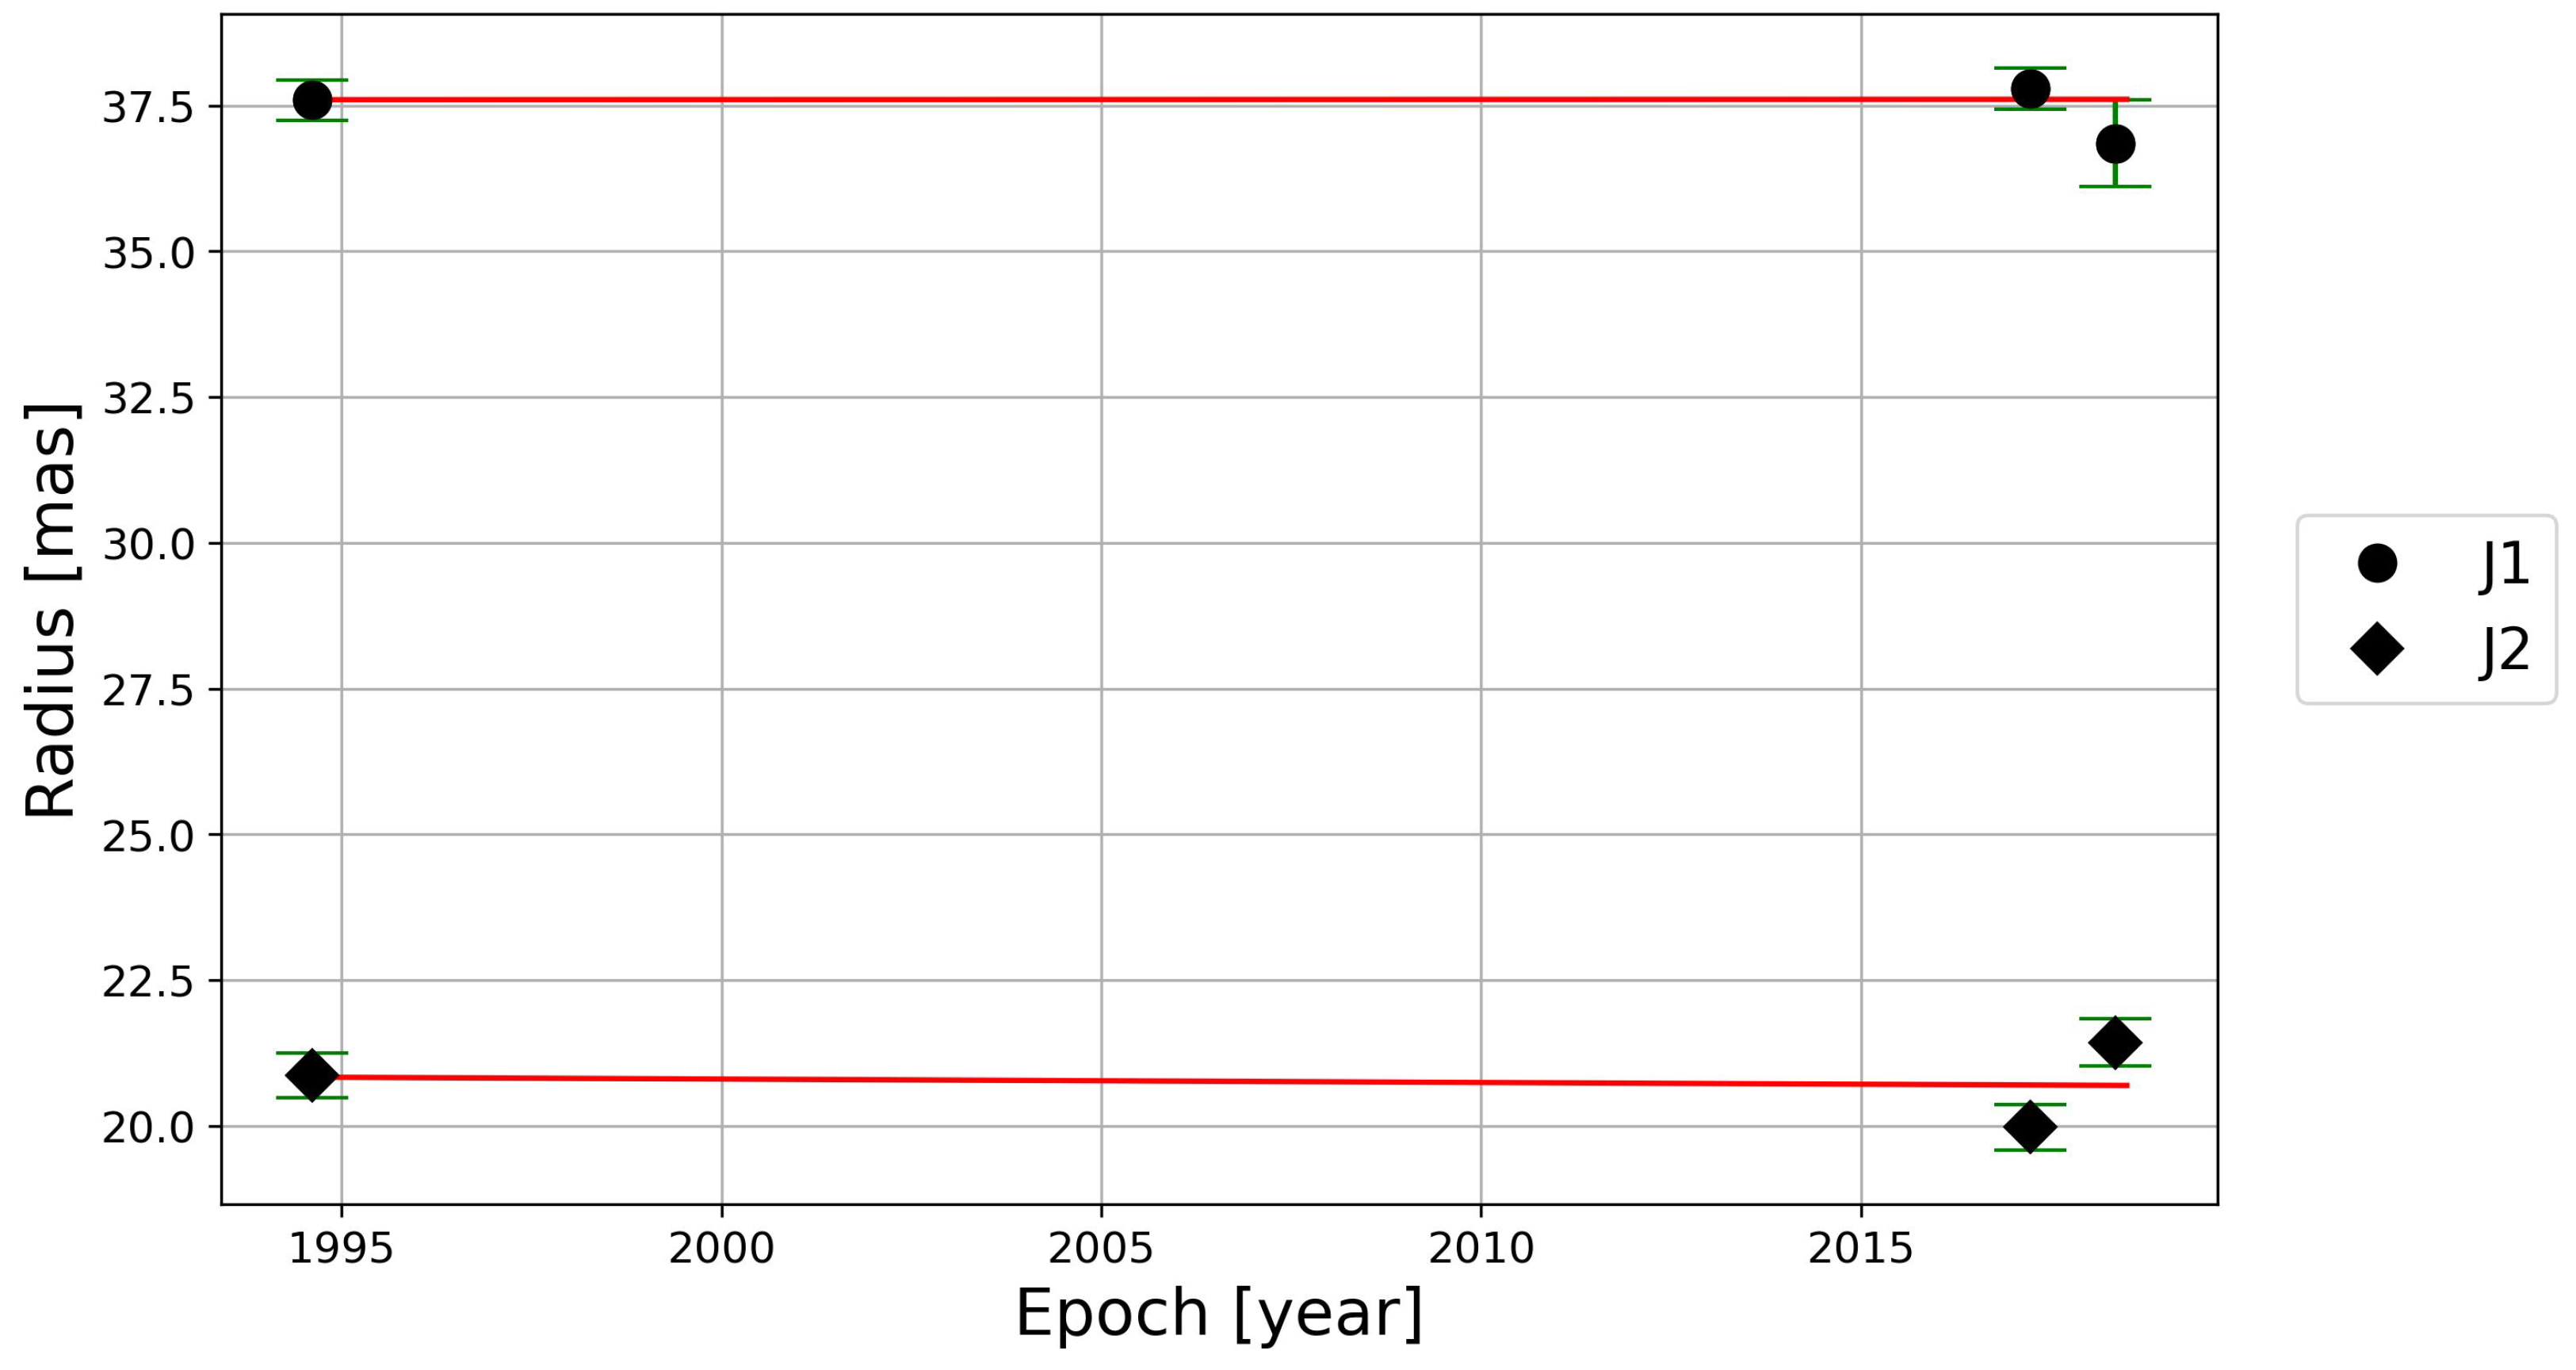
We calculated the apparent proper motions of the jet components with respect to the core at 2.3 GHz. There is no significant change in the position angle and the separation from the core (Figure 3) for the J1 and J2 components over the period covered by the VLBI observations (1994–2018). For the J3 component, however, proper motion was detected at 2.3 GHz. The fitted slopes and their formal uncertainties are ψ J 1 = ( 0.0003 ± 0.02 ) mas year−1, ψ J 2 = ( 0.01 ± 0.05 ) mas year−1, and ψ J 3 = ( 0.11 ± 0.02 ) mas year−1.

3.3. Proper Motions of the Inner Jet Components

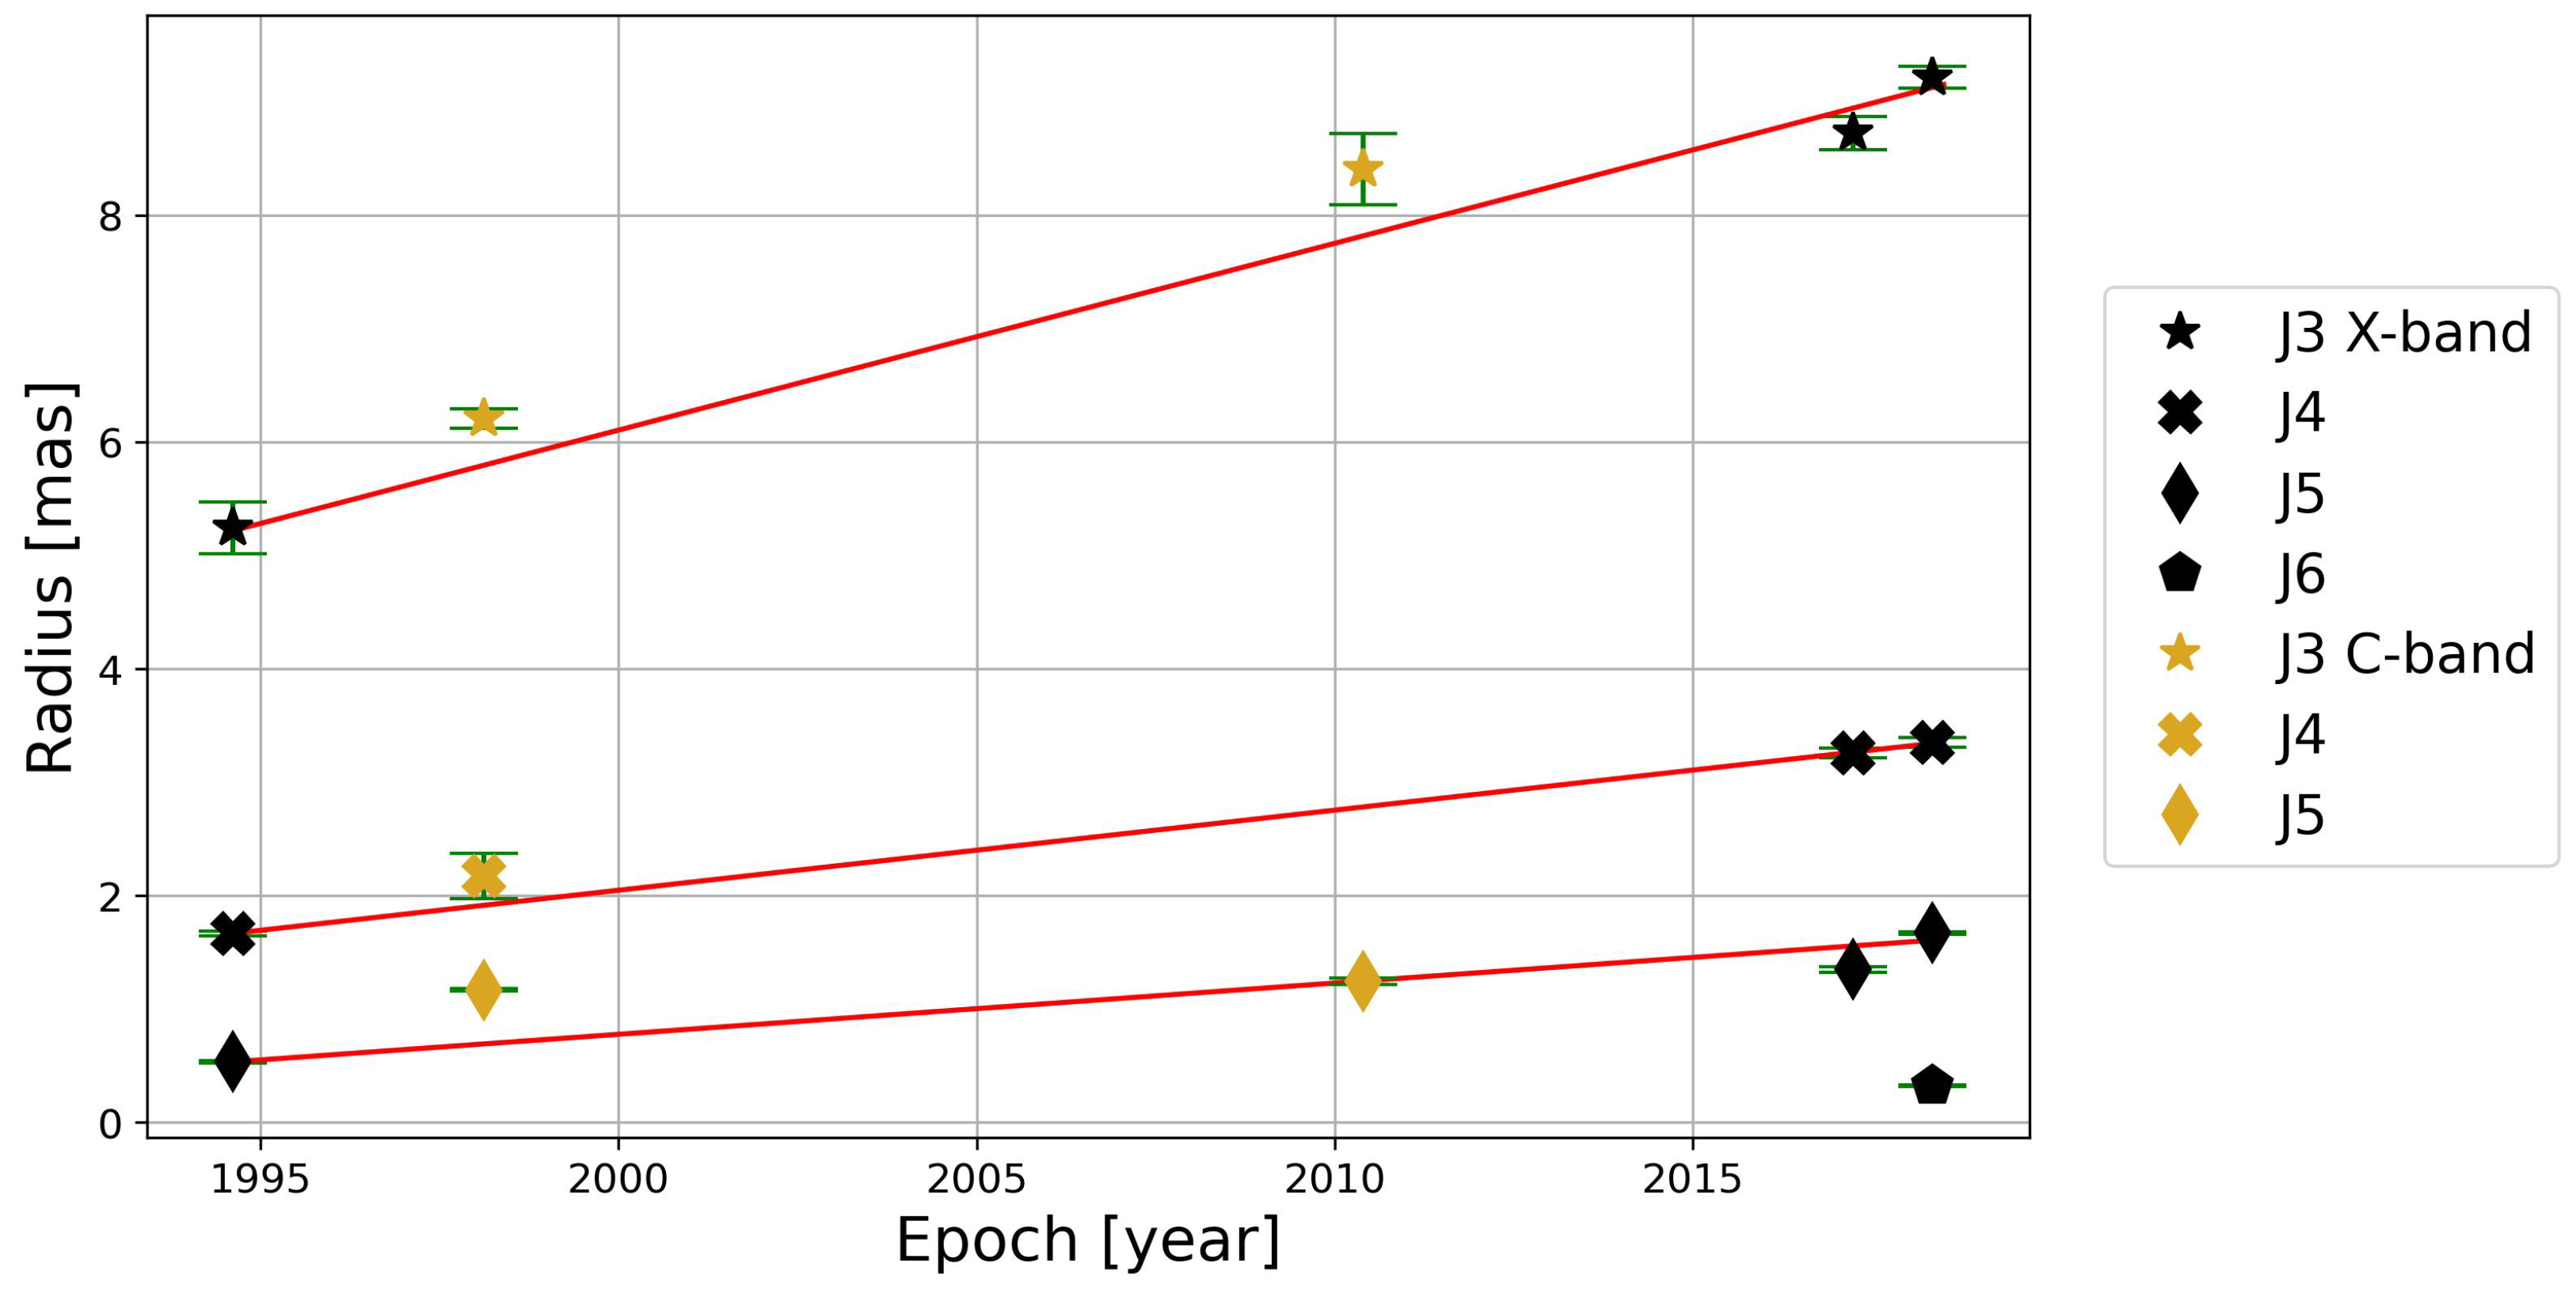
Based on the circular Gaussian brightness distribution model components fitted to the self-calibrated visibility data at 8 GHz, we determined the core–jet distances (R) at the three epochs available (Table A4). From these data, we determined the apparent proper motion of each jet component that could be identified at this frequency band. We obtained μ J 3 = ( 0.16 ± 0.02 ) mas year−1, μ J 4 = ( 0.0706 ± 0.0004 ) mas year−1, and μ J 5 = ( 0.045 ± 0.006 ) mas year−1 for components J3, J4, and J5, respectively, by fitting linear functions, as shown in Figure 4 (note that the values of ψ J 3 and μ J 3 obtained at 2.3 and 8 GHz, respectively, are close to each other). To illustrate the general consistency of the proper motion estimates, in Figure 4 we also indicate the data points measured at a close frequency (5 GHz, Table A3) that were not included in the linear regression.
The apparent speeds of the jet components can be calculated in the units of the speed of light (c) based on the following equation [51]:
β app = 0.0158 × μ D L 1 + z ,
where the apparent proper motion μ is measured in mas year−1. For components with detectable proper motion at 8 GHz, these values are β J 3 = ( 17.0 ± 1.9 ) c , β J 4 = ( 7.28 ± 0.04 ) c , and β J 5 = ( 4.7 ± 0.6 ) c . Each calculated β app value exceeds unity, indicating that these components exhibit apparent superluminal motion.

3.4. Inner Jet Parameters

Based on the 8 GHz measurements, we determined the brightness temperatures of the core component [52], which represents the innermost section of the jet that is synchrotron self-absorbed at the given frequency, e.g., [53]:
T b = 1.22 × 10 12 ( 1 + z ) S θ 2 ν 2 K ,
where S is the core flux density in Jy, ν the observing frequency in GHz, and θ the full width at the half-maximum (FWHM) diameter of the fitted circular Gaussian component in mas. Among the three available epochs, only in one case the core size exceeded the minimum resolvable size of the interferometer [54]. Consequently, we give a conservative lower limit to the brightness temperature T b 3.6 × 10 11 K (Table A4).
We use this lower limit to constrain the value of the Doppler-boosting factor:
δ = T b T b , int ,
where T b , int = 4.1 × 10 10 K is assumed as the typical intrinsic brightness temperature measured for non-flaring quasars [55], close to the equipartition value of T b , eq 5 × 10 10 K [56]. By substituting T b into Equation (3), we obtain the lower limit for the Doppler factor δ 8.8 .
Using the Doppler factor and the measured apparent jet component speed, we can determine the Lorentz factor ( Γ ) characterizing the bulk motion of the plasma and estimate the inclination angle (i) of the jet relative to the line of sight [10]. For these calculations, we consider J5, the innermost component with measured apparent speed at 8 GHz. Its location is the closest to the VLBI core; therefore, it is the best to represent the innermost segment of the jet [53]. The following equations apply, e.g., [10,26]:
Γ = β app 2 + δ 2 + 1 2 δ ,
i = arctan 2 β app β app 2 + δ 2 1 .
By substituting β J 5 and the lower limit to δ , we obtain Γ 5.7 and i 5.4 ° . The calculated lower and upper limits are shown in Table 3.
Since the core brightness temperature lower limit measured in the latest epoch at 8 GHz ( T b > 12.6 × 10 11 K, Table A4) is nearly an order of magnitude higher than the conservative limit we used for calculating the jet parameters, we repeated the same process and obtained Γ 15.8 and i 0.6 ° (Table 3). However, the Doppler factor is likely overestimated here, because the source may have undergone an outburst when its intrinsic brightness temperature could have exceeded the equipartition value [55]. The increase in the sum of component flux densities (nearly 50 % compared to the previous year, Table A4) and the appearance of the new component J6 (Figure 4) provide evidence for such an outburst. Therefore, we retain our conservative parameter estimates.

4. Discussion

For the most recent VLBI study of z 3 quasar jet proper motions [19], the objects were drawn from a carefully defined initial sample of 102 high-redshift quasars [57]. Apart from requiring z 3 , the other primary selection criteria were the total flux density at 1.4 GHz exceeding 100 mJy, and the declination between 35 ° and + 49 ° . The subject of our study, the quasar J1429+5406, also has high 1.4 GHz flux density, but its declination falls just out of the range considered in [19]. Moreover, some of its redshift measurements available in the literature, ranging from 2.905 [58] to 3.036 [59], are slightly lower than 3. Nevertheless, it is physically similar to the AGN studied in [19], and therefore, its derived properties can be compared to those of the sample objects.
Concerning the angular extent of its radio jet structure on VLBI scales, nearly 40 mas, J1429+5406 is among the larger jetted quasars at z 3 , although we know a couple of more extended objects as well, e.g., [60,61,62]. Based on our brightness distribution models (Table A2), the outer steep-spectrum components J1 and J2 seen in the lower-frequency images (Figure 1) exhibit no detectable proper motion (≲0.05 mas year−1) in the observed period (Figure 3). This could be a combined effect of the relatively poorer angular resolution at 2.3 GHz, the insufficient time coverage, and the diffuse nature of the emission features. A possible physical cause for the apparent lack of detectable proper motion in these outer jet components is that the emission is not Doppler-boosted, either because the jet material slows down, e.g., in a standing shock [63] and/or it is inclined at a different angle to the line of sight than the inner (≲10 mas) section.
The remarkable jet bending as seen projected onto the sky, at ∼20 mas from the core (Figure 1), could be caused by a sudden reorientation of the jet due to its interaction with a dense clump of the interstellar medium. Future polarization-sensitive VLBI imaging could provide evidence for this scenario [24]. Alternatively, apparent changes in the jet direction could be due to small intrinsic variations in the spatial orientation of the jet, for example, because of precession detected in high-redshift sources as well [64]. This could be caused by orbital motion in a binary black hole system inspiralling at the jet base, e.g., [65]. In blazars, the small jet inclination angle causes amplification of the bending when projected onto the sky. Similar cases are not uncommon at z 3 . In a study of a large sample, a significant fraction ( 6 % ) of the jets was found to have bending with more than 90° [19].
Unlike the outer features of J1429+5406, the three inner jet components (J3, J4, and J5; Table A4) exhibit detectable proper motion when modeled at 8 and 5 GHz, as shown in Figure 4. The apparent proper motion of J3 was actually measurable at both 2.3 and 8 GHz, yielding similar values. Notably, the apparent jet component speeds increase with increasing distance from the core in this inner part. Apparent jet acceleration on mas scales is common in AGN and can be either due to geometric of physical effects: a change in the jet direction with respect to the line of sight, or an increase in the intrinsic jet speed (or the bulk Lorentz factor), probably the latter being the more common effect [66]. According to VLBI measurements, jet flow acceleration can take place up to ∼100 pc deprojected distances [67]. Jet acceleration on pc scales can be attributed to, e.g., magnetic driving [68] or mass loading of the magnetohydrodynamic flow [69]. Thermal acceleration can also play a role by converting internal energy to bulk kinetic energy [70]. Our VLBI data are rather poorly sampled in time, and therefore, we could only attempt determining linear proper motions for each individual component. Finding evidence for component acceleration, curved trajectories, and jet precession in J1429+5406 would require long-term VLBI monitoring with denser time sampling, as conducted for bright lower-redshift blazars [71]. Monitoring high-redshift sources needs more time since the intrinsic changes appear ( 1 + z ) times slower in the observer’s frame due to the cosmological time dilation.
The structure and proper motion of J1429+5406 have earlier been studied with VLBI at 5 GHz in the CJF (Caltech–Jodrell Bank Flat-spectrum) survey, albeit with a very time-limited set of data. The object was part of the sample of 293 flat-spectrum sources [72]. For J1429+5406, the apparent proper motion of their component designated with C1 (which corresponds to our J5 component) was estimated based on model fitting to VLBI data obtained at three epochs between 1993 and 1998. The value μ C 1 = ( 0.01 ± 0.1 ) mas year−1 has a formal error much larger than the measurement itself, and therefore, the apparent motion of C1 could not be conclusively determined during that short 5-year period of time [72]. In contrast, our study spanning 24 years of VLBI imaging at 8 GHz yielded a significant apparent speed measurement for J5, β J 5 = ( 4.7 ± 0.6 ) c . The apparent speeds of quasar jets at high redshifts are typically in the range ( 0.2 10 ) c [19]. In comparison, β J 5 5 c is close to the average. On the other hand, our component J3 with larger β J 3 = ( 17.0 ± 1.9 ) c is among the fastest-moving ones known in z 3 quasars [23,25].
For further analysis of the geometric and physical parameters of the inner jet, we considered the J5 component. This is the closest to the core with detections in all three available epochs at 8 GHz, allowing us to estimate its apparent speed. Using the parameters of the core (i.e., the jet base), we were able to establish a lower limit to its brightness temperature, T b 3.6 × 10 11 K . This value is nearly an order of magnitude higher than the equipartition brightness temperature [56], confirming that the radio emission of the jet is Doppler-boosted. The core components in the high-redshift sample of [19] typically show high (≳1010 K) brightness temperatures. Our estimated inclination angle ( i 5.4 ° ) confirms that J1429+5406 is a blazar, as the value is well below 10° [11]. The Lorentz factor ( Γ 5.7 ) is consistent with the Lorentz factors described in two papers [19,25] on major samples of high-redshift sources, which present values between approximately 1 and 32, while their median is ∼6.
The blazar J1429+5406 has also been studied in the γ -ray and soft X-ray bands [1]. It was part of a sample of 142 X-ray-detected AGN with z 3 , consisting of 9 confirmed blazars and 133 blazar candidates. Here, the source was classified as a γ -ray-detected blazar. According to this high-energy study [1], the full sample was characterised by mean magnetic field strength B ¯ = ( 1.0 ± 0.5 ) G, mean Lorentz factor Γ ¯ = 7.0 ± 1.9 , and mean Doppler factor δ ¯ = 12.3 ± 2.3 . For J1429+5406 in particular, the values obtained are the following: magnetic field strength B = 2.4 G, Lorentz factor Γ 1 = 11 , and Doppler factor δ 1 = 16.5 . Our calculated lower limit of the Doppler factor ( δ 8.8 ) is consistent with the value determined from broadband spectral energy distribution (SED) modeling [1]. The same applies to the Lorentz factor, with the VLBI measurements providing a lower limit of Γ 5.7 . It is interesting to note that while SED modeling suggests δ ¯ 12 for the Doppler factors [1], VLBI observations of z 3 sources [19] indicate that Doppler factors exceeding 10 are rare.
Based on the limits we derived for its jet parameters, J1429+5406 appears similar to the typical known high-redshift radio-loud AGN [26]. However, we note that we followed a conservative approach when selecting the 8 GHz brightness temperature measurement that is compatible with all three epochs analyzed (Table A4). This led to the lower limits δ 8.8 and Γ 5.7 . However, the Doppler factor could be much higher if we consider T b > 1.26 × 10 12 K obtained from the latest measurement in 2018 (Table A4). Consequently, the Lorentz factor might in fact significantly exceed our conservative lower limit, reaching at least Γ 15.8 , and the jet inclination can also be somewhat smaller ( i 0.6 ° ). The apparent compactness of the core, together with the uncertainties in deriving jet parameters from the currently limited 8 GHz VLBI monitoring data, highlights the importance of additional, more sensitive VLBI observations in the future. Such observations would enable tighter constraints on the core size and yield more accurate measurements of the jet component’s proper motions in the blazar J1429+5406.
5. Summary and Conclusions

We analyzed archival VLBI imaging data of the high-redshift ( z = 3.015 ) quasar J1429+5406, taken at five different frequency bands, spanning about a quarter of a century. At lower frequencies, components of the relativistic jet can be traced up to about 40 mas from the radio core, with a sharp turn occurring at ∼20 mas (Figure 1). This could be due either to a deflection of the jet by a cloud of dense interstellar matter or to the amplification, in projection onto the sky, of an intrinsically small change in the jet direction.
Where data from multiple epochs are available, brightness distribution modeling allowed us to follow changes in the mas-scale radio structure of the source. The apparent speeds characterizing the outward motion of the inner (≲10 mas) jet components (Figure 4) increase by their distance from the core. One of them (J3) reaches β J 3 = ( 17.0 ± 1.9 ) c , which is among the highest values measured in z 3 quasars to date [19,23].
The radio emission of the source is Doppler-boosted. Using the apparent speed of the J5 component that is the closest to the jet base and the brightness temperature of the core measured at 8 GHz, we arrived at conservative lower limits of the Doppler factor ( δ 8.8 ) and the bulk Lorentz factor ( Γ 5.7 ). We could constrain the jet inclination angle to i 5.4 ° . The latter value firmly places J1429+5406 among blazars which have jets oriented very close to the line of sight. The blazar nature of this source is further supported by its detection in γ -rays [1].
The Doppler and Lorentz factors might be considerably higher than the lower limits estimated from the currently available data, potentially making J1429+5406 an outlier among high-redshift jetted quasars. To confirm this with confidence, additional sensitive, high-resolution VLBI imaging at high observing frequencies ( ν 8 GHz) would be required.

Author Contributions

Conceptualization, S.F.; methodology, D.K. and S.F.; formal analysis, D.K.; writing—original draft preparation, D.K.; writing—review and editing, S.F.; visualization, D.K.; supervision, S.F. All authors have read and agreed to the published version of the manuscript.

Funding

This research was funded by the Hungarian National Research, Development, and Innovation Office (NKFIH), grant number OTKA K134213, and by the NKFIH excellence grant TKP2021-NKTA-64.

Data Availability Statement

The calibrated VLBI data are available from either the Astrogeo database (https://astrogeo.org/cgi-bin/imdb_get_source.csh?source=J1429%2B5406, accessed on 18 April 2025) or, in the case of the EVN data, from the corresponding author upon reasonable request. The raw EVN data are available from the EVN Data Archive (http://archive.jive.nl/scripts/portal.php, accessed on 18 April 2025) under project code EF022.

Acknowledgments

The EVN is a joint facility of independent European, African, Asian, and North American radio astronomy institutes. Scientific results from data presented in this publication are derived from the following EVN project code: EF022. The National Radio Astronomy Observatory is a facility of the National Science Foundation operated under cooperative agreement by Associated Universities, Inc. We gratefully acknowledge the use of archival calibrated VLBI data from the Astrogeo Center database [73] maintained by Leonid Petrov. D.K. is grateful for the support received from the observatory assistant programme of the Konkoly Observatory [74].

Conflicts of Interest

The authors declare no conflicts of interest.

Abbreviations

The following abbreviations are used in this manuscript:
AGNActive galactic nuclei
CJFCaltech–Jodrell Bank Flat-spectrum (survey)
EVNEuropean VLBI Network
FIRSTFaint Images of the Radio Sky at Twenty-centimeters (survey)
FSRQFlat-spectrum radio quasar
FWHMFull width at half maximum
masMilliarcsecond
ROSATRoentgen Satellite
SEDSpectral energy distribution
SMBHSupermassive black hole
VLAKarl G. Jansky Very Large Array
VLASSVLA Sky Survey
VLBAVery Long Baseline Array
VLBIVery long baseline interferometry

Appendix A

Table A1, Table A2, Table A3, Table A4 and Table A5 show the parameters of the Gaussian brightness distribution model components fitted to the calibrated VLBI visibility data of J1429+5406 at 1.7 , 2.3 , 5, 8, and 15.4 GHz, respectively. Where the fitted component sizes were smaller than the minimum resolvable angular size of the interferometer [54], the latter value is given as an upper limit. The uncertainties of the model parameters are estimated based on [75].
Table A1. Parameters of the circular Gaussian components fitted to the 1.7 GHz data.
EpochComp.S θ R ϕ
(year) (mJy)(mas)(mas)(°)
2010.434J1 89 ± 19 17.7 ± 1.0 34.9 ± 0.5 93.6 ± 0.8
J2 43 ± 19 5.0 ± 0.3 23.4 ± 0.1 132.8 ± 0.3
J3 117 ± 20 5.1 ± 0.3 7.4 ± 0.1 133.9 ± 1.1
C 383 ± 28 1.9 ± 0.1 0...
Notes: Col. 1: mean observing epoch; Col. 2: component identifier; Col. 3: flux density; Col. 4: FWHM diameter; Col. 5: angular distance from the core (C); Col. 6: position angle of the component with respect to the core, measured from north through east.
Table A2. Parameters of the circular Gaussian components fitted to the 2.3 GHz data.
EpochComp.S θ R ϕ
(year) (mJy)(mas)(mas)(°)
1994.612J1 62 ± 33 10.8 ± 0.7 37.6 ± 0.3 90.4 ± 0.5
J2 86 ± 34 11.9 ± 0.8 20.9 ± 0.4 134.0 ± 1.0
J3 60 ± 33 1.6 ± 0.1 5.75 ± 0.05 146.5 ± 0.5
C 511 ± 46 0.62 ± 0.04 0...
2017.235J1 41 ± 15 12.2 ± 0.7 37.8 ± 0.4 91.1 ± 0.5
J2 69 ± 16 13.6 ± 0.8 20.0 ± 0.4 130.3 ± 1.1
J3 32 ± 15 3.4 ± 0.2 8.0 ± 0.1 148.7 ± 0.7
J5 90 ± 16 1.47 ± 0.09 1.84 ± 0.04 131.0 ± 1.3
C 211 ± 20 0.79 ± 0.05 0...
2018.346J1 90 ± 22 23.0 ± 1.5 36.9 ± 0.7 91.0 ± 1.2
J2 63 ± 22 12.5 ± 0.8 21.4 ± 0.4 135.5 ± 1.1
J3 41 ± 22 4.5 ± 0.3 9.0 ± 0.1 145.8 ± 0.9
J5 133 ± 23 1.04 ± 0.07 2.00 ± 0.03 135.5 ± 1.0
C 242 ± 27 <0.250...
Notes: Col. 1: mean observing epoch; Col. 2: component identifier; Col. 3: flux density; Col. 4: FWHM diameter; Col. 5: angular distance from the core (C); Col. 6: position angle of the component with respect to the core, measured from north through east.
Table A3. Parameters of the circular Gaussian components fitted to the 5 GHz data.
EpochComp.S θ R ϕ
(year) (mJy)(mas)(mas)(°)
1998.122J2 32 ± 16 12.0 ± 0.5 20.1 ± 0.2 133.4 ± 0.7
J3 24 ± 16 4.3 ± 0.2 6.21 ± 0.09 139.5 ± 0.8
J4 15 ± 16 <0.081 2.172 ± 0.002 130.14 ± 0.04
J5 135 ± 17 0.45 ± 0.02 1.168 ± 0.009 135.2 ± 0.4
C 319 ± 20 0.32 ± 0.01 0...
2010.401J3 74 ± 13 10.3 ± 0.6 8.4 ± 0.3 132.8 ± 2.1
J5 117 ± 15 0.95 ± 0.06 1.24 ± 0.03 135.6 ± 1.3
C 199 ± 18 0.20 ± 0.01 0...
Notes: Col. 1: mean observing epoch; Col. 2: component identifier; Col. 3: flux density; Col. 4: FWHM diameter; Col. 5: angular distance from the core (C); Col. 6: position angle of the component with respect to the core, measured from north through east.
Table A4. Parameters of the circular Gaussian components fitted to the 8 GHz data and the calculated core brightness temperatures.
EpochComp.S θ R ϕ T b
(year) (mJy)(mas)(mas)(°)(1011 K)
1994.612J3 33 ± 29 6.1 ± 0.5 5.2 ± 0.2 136.1 ± 2.5
J4 68 ± 30 0.54 ± 0.04 1.67 ± 0.02 137.9 ± 0.7
J5 90 ± 30 <0.22 0.535 ± 0.008 131.0 ± 0.9
C 259 ± 35 <0.2120...>3.6
2017.235J3 14 ± 12 5.7 ± 0.3 8.7 ± 0.1 137.7 ± 1.0
J4 20 ± 12 1.72 ± 0.09 3.26 ± 0.04 132.4 ± 0.8
J5 55 ± 12 0.89 ± 0.05 1.35 ± 0.02 134.8 ± 1.0
C 237 ± 17 0.179 ± 0.009 0... 4.8 ± 0.7
2018.346J3 15 ± 18 4.5 ± 0.2 9.2 ± 0.1 142.8 ± 0.6
J4 21 ± 18 1.91 ± 0.08 3.35 ± 0.04 131.5 ± 0.7
J5 48 ± 18 0.61 ± 0.03 1.67 ± 0.01 134.4 ± 0.4
J6 113 ± 18 0.32 ± 0.01 0.323 ± 0.007 130.8 ± 1.2
C 283 ± 21 <0.1180...>12.6
Notes: Col. 1: mean observing epoch; Col. 2: component identifier; Col. 3: flux density; Col. 4: FWHM diameter; Col. 5: angular distance from the core (C); Col. 6: position angle of the component with respect to the core, measured from north through east; Col. 7: brightness temperature of the core.
Table A5. Parameters of the circular Gaussian components fitted to the 15.4 GHz data and the calculated core brightness temperature.
EpochComp.S θ R ϕ T b
(year) (mJy)(mas)(mas)(°)(1011 K)
2010.149J5 40 ± 13 0.69 ± 0.04 1.57 ± 0.02 136.2 ± 0.8
J6 25 ± 13 <0.041 0.403 ± 0.001 139.6 ± 0.2
C 214 ± 18 0.152 ± 0.009 0... 1.9 ± 0.3
Notes: Col. 1: mean observing epoch; Col. 2: component identifier; Col. 3: flux density; Col. 4: FWHM diameter; Col. 5: angular distance from the core (C); Col. 6: position angle of the component with respect to the core, measured from north through east; Col. 7: brightness temperature of the core.

References

  1. Paliya, V.S.; Ajello, M.; Cao, H.M.; Giroletti, M.; Kaur, A.; Madejski, G.; Lott, B.; Hartmann, D. Blazars at the Cosmic Dawn. Astrophys. J. 2020, 897, 177. [Google Scholar] [CrossRef]
  2. Padovani, P.; Alexander, D.M.; Assef, R.J.; De Marco, B.; Giommi, P.; Hickox, R.C.; Richards, G.T.; Smolčić, V.; Hatziminaoglou, E.; Mainieri, V.; et al. Active galactic nuclei: What’s in a name? Astron. Astrophys. Rev. 2017, 25, 2. [Google Scholar] [CrossRef]
  3. Kormendy, J.; Ho, L.C. Coevolution (Or Not) of Supermassive Black Holes and Host Galaxies. Annu. Rev. Astron. Astrophys. 2013, 51, 511–653. [Google Scholar] [CrossRef]
  4. Blandford, R.D.; Payne, D.G. Hydromagnetic flows from accretion disks and the production of radio jets. Mon. Not. R. Astron. Soc. 1982, 199, 883–903. [Google Scholar] [CrossRef]
  5. Begelman, M.C.; Blandford, R.D.; Rees, M.J. Theory of extragalactic radio sources. Rev. Mod. Phys. 1984, 56, 255–351. [Google Scholar] [CrossRef]
  6. Ivezić, Ž.; Menou, K.; Knapp, G.R.; Strauss, M.A.; Lupton, R.H.; Vanden Berk, D.E.; Richards, G.T.; Tremonti, C.; Weinstein, M.A.; Anderson, S.; et al. Optical and Radio Properties of Extragalactic Sources Observed by the FIRST Survey and the Sloan Digital Sky Survey. Astron. J. 2002, 124, 2364–2400. [Google Scholar] [CrossRef]
  7. Mehdipour, M.; Costantini, E. Relation between winds and jets in radio-loud AGN. Astron. Astrophys. 2019, 625, A25. [Google Scholar] [CrossRef]
  8. Mestici, S.; Tombesi, F.; Gaspari, M.; Piconcelli, E.; Panessa, F. Unified properties of supermassive black hole winds in radio-quiet and radio-loud AGN. Mon. Not. R. Astron. Soc. 2024, 532, 3036–3055. [Google Scholar] [CrossRef]
  9. Janssen, M.; Radcliffe, J.F.; Wagner, J. Software and Techniques for VLBI Data Processing and Analysis. Universe 2022, 8, 527. [Google Scholar] [CrossRef]
  10. Urry, C.M.; Padovani, P. Unified Schemes for Radio-Loud Active Galactic Nuclei. Publ. Astron. Soc. Pac. 1995, 107, 803. [Google Scholar] [CrossRef]
  11. Prandini, E.; Ghisellini, G. The Blazar Sequence and Its Physical Understanding. Galaxies 2022, 10, 35. [Google Scholar] [CrossRef]
  12. Sambruna, R.M. Soft X-Ray Properties of Flat-Spectrum Radio Quasars. Astrophys. J. 1997, 487, 536–554. [Google Scholar] [CrossRef]
  13. Sbarrato, T.; Ghisellini, G.; Tagliaferri, G.; Foschini, L.; Nardini, M.; Tavecchio, F.; Gehrels, N. Blazar candidates beyond redshift 4 observed by Swift. Mon. Not. R. Astron. Soc. 2015, 446, 2483–2489. [Google Scholar] [CrossRef]
  14. Fabian, A.C.; Walker, S.A.; Celotti, A.; Ghisellini, G.; Mocz, P.; Blundell, K.M.; McMahon, R.G. Do high-redshift quasars have powerful jets ? Mon. Not. R. Astron. Soc. 2014, 442, L81–L84. [Google Scholar] [CrossRef]
  15. Bañados, E.; Khusanova, Y.; Decarli, R.; Momjian, E.; Walter, F.; Connor, T.; Carilli, C.L.; Mazzucchelli, C.; Rojas-Ruiz, S.; Venemans, B.P. [C II] Properties and Far-infrared Variability of a z = 7 Blazar. Astrophys. J. Lett. 2024, 977, L46. [Google Scholar] [CrossRef]
  16. Bogdán, Á.; Goulding, A.D.; Natarajan, P.; Kovács, O.E.; Tremblay, G.R.; Chadayammuri, U.; Volonteri, M.; Kraft, R.P.; Forman, W.R.; Jones, C.; et al. Evidence for heavy-seed origin of early supermassive black holes from a z ≈ 10 X-ray quasar. Nat. Astron. 2024, 8, 126–133. [Google Scholar] [CrossRef]
  17. Bañados, E.; Mazzucchelli, C.; Momjian, E.; Eilers, A.C.; Wang, F.; Schindler, J.T.; Connor, T.; Andika, I.T.; Barth, A.J.; Carilli, C.; et al. The Discovery of a Highly Accreting, Radio-loud Quasar at z = 6.82. Astrophys. J. 2021, 909, 80. [Google Scholar] [CrossRef]
  18. Perger, K.; Frey, S.; Gabányi, K.É.; Tóth, L.V. A catalogue of active galactic nuclei from the first 1.5 Gyr of the Universe. Front. Astron. Space Sci. 2017, 4, 9. [Google Scholar] [CrossRef]
  19. Guo, S.; An, T.; Liu, Y.; Liu, C.; Xu, Z.; Sotnikova, Y.; Mufakharov, T.; Wang, A. High-Redshift Quasars at z ≥ 3—III: Parsec-Scale Jet Properties from Very Long Baseline Interferometry Observations. Universe 2025, 11, 91. [Google Scholar] [CrossRef]
  20. Veres, P.; Frey, S.; Paragi, Z.; Gurvits, L.I. Physical parameters of a relativistic jet at very high redshift: The case of the blazar J1430+4204. Astron. Astrophys. 2010, 521, A6. [Google Scholar] [CrossRef]
  21. Frey, S.; Paragi, Z.; Fogasy, J.O.; Gurvits, L.I. The first estimate of radio jet proper motion at z > 5. Mon. Not. R. Astron. Soc. 2015, 446, 2921–2928. [Google Scholar] [CrossRef]
  22. Perger, K.; Frey, S.; Gabányi, K.É.; An, T.; Britzen, S.; Cao, H.M.; Cseh, D.; Dennett-Thorpe, J.; Gurvits, L.I.; Hong, X.Y.; et al. Constraining the radio jet proper motion of the high-redshift quasar J2134-0419 at z = 4.3. Mon. Not. R. Astron. Soc. 2018, 477, 1065–1070. [Google Scholar] [CrossRef]
  23. Zhang, Y.; An, T.; Frey, S. Fast jet proper motion discovered in a blazar at z = 4.72. Sci. Bull. 2020, 65, 525–530. [Google Scholar] [CrossRef]
  24. An, T.; Mohan, P.; Zhang, Y.; Frey, S.; Yang, J.; Gabányi, K.É.; Gurvits, L.I.; Paragi, Z.; Perger, K.; Zheng, Z. Evolving parsec-scale radio structure in the most distant blazar known. Nat. Commun. 2020, 11, 143. [Google Scholar] [CrossRef] [PubMed]
  25. Zhang, Y.; An, T.; Frey, S.; Gabányi, K.É.; Sotnikova, Y. Radio Jet Proper-motion Analysis of Nine Distant Quasars above Redshift 3.5. Astrophys. J. 2022, 937, 19. [Google Scholar] [CrossRef]
  26. Frey, S.; Fogasy, J.; Perger, K.; Kulish, K.; Benke, P.; Koller, D.; Gabányi, K.É. Revisiting a Core–Jet Laboratory at High Redshift: Analysis of the Radio Jet in the Quasar PKS 2215+020 at z = 3.572. Universe 2024, 10, 97. [Google Scholar] [CrossRef]
  27. Benke, P.; Gokus, A.; Lisakov, M.; Gurvits, L.I.; Eppel, F.; Heßdörfer, J.; Kadler, M.; Kovalev, Y.Y.; Ros, E.; Rösch, F. Very-long-baseline interferometry study of the flaring blazar TXS 1508+572 in the early Universe. Astron. Astrophys. 2024, 689, A43. [Google Scholar] [CrossRef]
  28. Krezinger, M.; Frey, S.; Perger, K.; Gabányi, K.É.; An, T.; Zhang, Y.; Gurvits, L.I.; Titov, O.; Melnikov, A.; Paragi, Z. Proper motion of the radio jets in two blazars at redshift above 3. Mon. Not. R. Astron. Soc. 2024, 530, 4614–4625. [Google Scholar] [CrossRef]
  29. Healey, S.E.; Romani, R.W.; Taylor, G.B.; Sadler, E.M.; Ricci, R.; Murphy, T.; Ulvestad, J.S.; Winn, J.N. CRATES: An All-Sky Survey of Flat-Spectrum Radio Sources. Astrophys. J. Suppl. Ser. 2007, 171, 61–71. [Google Scholar] [CrossRef]
  30. Charlot, P.; Jacobs, C.S.; Gordon, D.; Lambert, S.; de Witt, A.; Böhm, J.; Fey, A.L.; Heinkelmann, R.; Skurikhina, E.; Titov, O.; et al. The third realization of the International Celestial Reference Frame by very long baseline interferometry. Astron. Astrophys. 2020, 644, A159. [Google Scholar] [CrossRef]
  31. DESI Collaboration; Adame, A.G.; Aguilar, J.; Ahlen, S.; Alam, S.; Aldering, G.; Alexander, D.M.; Alfarsy, R.; Allende Prieto, C.; Alvarez, M.; et al. The Early Data Release of the Dark Energy Spectroscopic Instrument. Astron. J. 2024, 168, 58. [Google Scholar] [CrossRef]
  32. Hayashi, T.J.; Doi, A.; Nagai, H. A Giant Metrewave Radio Telescope survey of radio-loud broad absorption line quasars. Mon. Not. R. Astron. Soc. 2024, 530, 2590–2607. [Google Scholar] [CrossRef]
  33. White, R.L.; Becker, R.H.; Helfand, D.J.; Gregg, M.D. A Catalog of 1.4 GHz Radio Sources from the FIRST Survey. Astrophys. J. 1997, 475, 479–493. [Google Scholar] [CrossRef]
  34. Gordon, Y.A.; Boyce, M.M.; O’Dea, C.P.; Rudnick, L.; Andernach, H.; Vantyghem, A.N.; Baum, S.A.; Bui, J.P.; Dionyssiou, M. A Catalog of Very Large Array Sky Survey Epoch 1 Quick Look Components, Sources, and Host Identifications. Res. Notes Am. Astron. Soc. 2020, 4, 175. [Google Scholar] [CrossRef]
  35. Patnaik, A.R.; Browne, I.W.A.; Wilkinson, P.N.; Wrobel, J.M. Interferometer phase calibration sources—I. The region 35°≤ δ≤ 75°. Mon. Not. R. Astron. Soc. 1992, 254, 655. [Google Scholar] [CrossRef]
  36. Britzen, S.; Brinkmann, W.; Campbell, R.M.; Gliozzi, M.; Readhead, A.C.S.; Browne, I.W.A.; Wilkinson, P. The soft X-ray properties of AGN from the CJF sample. A correlation analysis between soft X-ray and VLBI properties. Astron. Astrophys. 2007, 476, 759–777. [Google Scholar] [CrossRef]
  37. Ajello, M.; Angioni, R.; Axelsson, M.; Ballet, J.; Barbiellini, G.; Bastieri, D.; Becerra Gonzalez, J.; Bellazzini, R.; Bissaldi, E.; Bloom, E.D.; et al. The Fourth Catalog of Active Galactic Nuclei Detected by the Fermi Large Area Telescope. Astrophys. J. 2020, 892, 105. [Google Scholar] [CrossRef]
  38. Véron-Cetty, M.P.; Véron, P. A catalogue of quasars and active nuclei: 13th edition. Astron. Astrophys. 2010, 518, A10. [Google Scholar] [CrossRef]
  39. Planck Collaboration; Ade, P.A.R.; Aghanim, N.; Arnaud, M.; Ashdown, M.; Aumont, J.; Baccigalupi, C.; Banday, A.J.; Barreiro, R.B.; Bartlett, J.G.; et al. Planck 2015 results. XIII. Cosmological parameters. Astron. Astrophys. 2016, 594, A13. [Google Scholar] [CrossRef]
  40. Wright, E.L. A Cosmology Calculator for the World Wide Web. Publ. Astron. Soc. Pac. 2006, 118, 1711–1715. [Google Scholar] [CrossRef]
  41. Frey, S.; Paragi, Z.; Gurvits, L.I.; Gabányi, K.É.; Cseh, D. Into the central 10 pc of the most distant known radio quasar. VLBI imaging observations of J1429+5447 at z = 6.21. Astron. Astrophys. 2011, 531, L5. [Google Scholar] [CrossRef]
  42. Shepherd, M.C. Difmap: An Interactive Program for Synthesis Imaging. In Proceedings of the Astronomical Data Analysis Software and Systems VI, Charlottesville, VA, USA, 22–25 September 1996; Hunt, G., Payne, H., Eds.; Astronomical Society of the Pacific Conference Series. Astronomical Society of the Pacific: San Francisco, CA, USA, 1997; Volume 125, p. 77. [Google Scholar]
  43. Högbom, J.A. Aperture Synthesis with a Non-Regular Distribution of Interferometer Baselines. Astron. Astrophys. Suppl. 1974, 15, 417. [Google Scholar]
  44. Pearson, T.J.; Readhead, A.C.S. Image Formation by Self-Calibration in Radio Astronomy. Annu. Rev. Astron. Astrophys. 1984, 22, 97–130. [Google Scholar] [CrossRef]
  45. Pearson, T.J. Non-Imaging Data Analysis. In Proceedings of the Very Long Baseline Interferometry and the VLBA, Socorro, NM, USA, 23–30 June 1993; Zensus, J.A., Diamond, P.J., Napier, P.J., Eds.; Astronomical Society of the Pacific Conference Series. Astronomical Society of the Pacific: San Francisco, CA, USA, 1995; Volume 82, p. 267. [Google Scholar]
  46. Beasley, A.J.; Gordon, D.; Peck, A.B.; Petrov, L.; MacMillan, D.S.; Fomalont, E.B.; Ma, C. The VLBA Calibrator Survey-VCS1. Astrophys. J. Suppl. Ser. 2002, 141, 13–21. [Google Scholar] [CrossRef]
  47. Britzen, S.; Vermeulen, R.C.; Taylor, G.B.; Campbell, R.M.; Pearson, T.J.; Readhead, A.C.S.; Xu, W.; Browne, I.W.A.; Henstock, D.R.; Wilkinson, P. A multi-epoch VLBI survey of the kinematics of CJF sources. I. Model-fit parameters and maps. Astron. Astrophys. 2007, 472, 763–771. [Google Scholar] [CrossRef]
  48. Helmboldt, J.F.; Taylor, G.B.; Tremblay, S.; Fassnacht, C.D.; Walker, R.C.; Myers, S.T.; Sjouwerman, L.O.; Pearson, T.J.; Readhead, A.C.S.; Weintraub, L.; et al. The VLBA Imaging and Polarimetry Survey at 5 GHz. Astrophys. J. 2007, 658, 203–216. [Google Scholar] [CrossRef]
  49. Hunt, L.R.; Johnson, M.C.; Cigan, P.J.; Gordon, D.; Spitzak, J. Imaging Sources in the Third Realization of the International Celestial Reference Frame. Astron. J. 2021, 162, 121. [Google Scholar] [CrossRef]
  50. Pushkarev, A.B.; Kovalev, Y.Y. Single-epoch VLBI imaging study of bright active galactic nuclei at 2 GHz and 8 GHz. Astron. Astrophys. 2012, 544, A34. [Google Scholar] [CrossRef]
  51. An, T.; Baan, W.A. The Dynamic Evolution of Young Extragalactic Radio Sources. Astrophys. J. 2012, 760, 77. [Google Scholar] [CrossRef]
  52. Condon, J.J.; Condon, M.A.; Gisler, G.; Puschell, J.J. Strong radio sources in bright spiral galaxies. II. Rapid star formation and galaxy-galaxy interactions. Astrophys. J. 1982, 252, 102–124. [Google Scholar] [CrossRef]
  53. Sokolovsky, K.V.; Kovalev, Y.Y.; Pushkarev, A.B.; Lobanov, A.P. A VLBA survey of the core shift effect in AGN jets. I. Evidence of dominating synchrotron opacity. Astron. Astrophys. 2011, 532, A38. [Google Scholar] [CrossRef]
  54. Kovalev, Y.Y.; Kellermann, K.I.; Lister, M.L.; Homan, D.C.; Vermeulen, R.C.; Cohen, M.H.; Ros, E.; Kadler, M.; Lobanov, A.P.; Zensus, J.A.; et al. Sub-Milliarcsecond Imaging of Quasars and Active Galactic Nuclei. IV. Fine-Scale Structure. Astron. J. 2005, 130, 2473–2505. [Google Scholar] [CrossRef]
  55. Homan, D.C.; Cohen, M.H.; Hovatta, T.; Kellermann, K.I.; Kovalev, Y.Y.; Lister, M.L.; Popkov, A.V.; Pushkarev, A.B.; Ros, E.; Savolainen, T. MOJAVE. XIX. Brightness Temperatures and Intrinsic Properties of Blazar Jets. Astrophys. J. 2021, 923, 67. [Google Scholar] [CrossRef]
  56. Readhead, A.C.S. Equipartition Brightness Temperature and the Inverse Compton Catastrophe. Astrophys. J. 1994, 426, 51. [Google Scholar] [CrossRef]
  57. Sotnikova, Y.; Mikhailov, A.; Mufakharov, T.; Mingaliev, M.; Bursov, N.; Semenova, T.; Stolyarov, V.; Udovitskiy, R.; Kudryashova, A.; Erkenov, A. High-redshift quasars at z ≥ 3—I. Radio spectra. Mon. Not. R. Astron. Soc. 2021, 508, 2798–2814. [Google Scholar] [CrossRef]
  58. Richards, G.T.; Myers, A.D.; Gray, A.G.; Riegel, R.N.; Nichol, R.C.; Brunner, R.J.; Szalay, A.S.; Schneider, D.P.; Anderson, S.F. Efficient Photometric Selection of Quasars from the Sloan Digital Sky Survey. II. ∼1,000,000 Quasars from Data Release 6. Astrophys. J. Suppl. Ser. 2009, 180, 67–83. [Google Scholar] [CrossRef]
  59. Albareti, F.D.; Allende Prieto, C.; Almeida, A.; Anders, F.; Anderson, S.; Andrews, B.H.; Aragón-Salamanca, A.; Argudo-Fernández, M.; Armengaud, E.; Aubourg, E.; et al. The 13th Data Release of the Sloan Digital Sky Survey: First Spectroscopic Data from the SDSS-IV Survey Mapping Nearby Galaxies at Apache Point Observatory. Astrophys. J. Suppl. Ser. 2017, 233, 25. [Google Scholar] [CrossRef]
  60. Lobanov, A.P.; Gurvits, L.I.; Frey, S.; Schilizzi, R.T.; Kawaguchi, N.; Pauliny-Toth, I.I.K. VLBI Space Observatory Programme Observation of the Quasar PKS 2215+020: A New Laboratory for Core–Jet Physics at z = 3.572. Astrophys. J. 2001, 547, 714–721. [Google Scholar] [CrossRef]
  61. Yang, J.; Gurvits, L.I.; Lobanov, A.P.; Frey, S.; Hong, X.Y. Multi-frequency investigation of the parsec- and kilo-parsec-scale radio structures in high-redshift quasar PKS 1402+044. Astron. Astrophys. 2008, 489, 517–524. [Google Scholar] [CrossRef]
  62. Spingola, C.; Dallacasa, D.; Belladitta, S.; Caccianiga, A.; Giroletti, M.; Moretti, A.; Orienti, M. Parsec-scale properties of the radio brightest jetted AGN at z > 6. Astron. Astrophys. 2020, 643, L12. [Google Scholar] [CrossRef]
  63. Daly, R.A.; Marscher, A.P. The Gasdynamics of Compact Relativistic Jets. Astrophys. J. 1988, 334, 539. [Google Scholar] [CrossRef]
  64. Rozgonyi, K.; Frey, S. Precessing Jet in the High-Redshift Blazar J0017+8135. Galaxies 2016, 4, 10. [Google Scholar] [CrossRef]
  65. Kun, E.; Gabányi, K.É.; Karouzos, M.; Britzen, S.; Gergely, L.Á. A spinning supermassive black hole binary model consistent with VLBI observations of the S5 1928+738 jet. Mon. Not. R. Astron. Soc. 2014, 445, 1370–1382. [Google Scholar] [CrossRef]
  66. Homan, D.C.; Kadler, M.; Kellermann, K.I.; Kovalev, Y.Y.; Lister, M.L.; Ros, E.; Savolainen, T.; Zensus, J.A. MOJAVE: Monitoring of Jets in Active Galactic Nuclei with VLBA Experiments. VII. Blazar Jet Acceleration. Astrophys. J. 2009, 706, 1253–1268. [Google Scholar] [CrossRef]
  67. Homan, D.C.; Lister, M.L.; Kovalev, Y.Y.; Pushkarev, A.B.; Savolainen, T.; Kellermann, K.I.; Richards, J.L.; Ros, E. MOJAVE. XII. Acceleration and Collimation of Blazar Jets on Parsec Scales. Astrophys. J. 2015, 798, 134. [Google Scholar] [CrossRef]
  68. Vlahakis, N.; Königl, A. Magnetic Driving of Relativistic Outflows in Active Galactic Nuclei. I. Interpretation of Parsec-Scale Accelerations. Astrophys. J. 2004, 605, 656–661. [Google Scholar] [CrossRef]
  69. Nokhrina, E.E.; Beskin, V.S. On the acceleration and deceleration of relativistic jets in active galactic nuclei—II. Mass loading. Mon. Not. R. Astron. Soc. 2017, 469, 3840–3850. [Google Scholar] [CrossRef]
  70. Ricci, L.; Perucho, M.; López-Miralles, J.; Martí, J.M.; Boccardi, B. Magnetic and thermal acceleration in extragalactic jets. An application to NGC 315. Astron. Astrophys. 2024, 683, A235. [Google Scholar] [CrossRef]
  71. Lister, M.L.; Homan, D.C.; Kellermann, K.I.; Kovalev, Y.Y.; Pushkarev, A.B.; Ros, E.; Savolainen, T. Monitoring of Jets in Active Galactic Nuclei with VLBA Experiments. XVIII. Kinematics and Inner Jet Evolution of Bright Radio-loud Active Galaxies. Astrophys. J. 2021, 923, 30. [Google Scholar] [CrossRef]
  72. Britzen, S.; Vermeulen, R.C.; Campbell, R.M.; Taylor, G.B.; Pearson, T.J.; Readhead, A.C.S.; Xu, W.; Browne, I.W.; Henstock, D.R.; Wilkinson, P. A multi-epoch VLBI survey of the kinematics of CFJ sources. II. Analysis of the kinematics. Astron. Astrophys. 2008, 484, 119–142. [Google Scholar] [CrossRef]
  73. Petrov, L.Y.; Kovalev, Y.Y. The Radio Fundamental Catalog. I. Astrometry. Astrophys. J. Suppl. Ser. 2025, 276, 38. [Google Scholar] [CrossRef]
  74. Molnár, L.; Kiss, L.L.; Szabó, R. Kutatásra oktatva: A Csillagászati és Földtudományi Kutatóközpont Csillagászati Intézete hallgatói mentorprogramjának elso öt éve. Magyar Tudomány 2023, 184, 110–120. [Google Scholar] [CrossRef]
  75. Lee, S.S.; Lobanov, A.P.; Krichbaum, T.P.; Witzel, A.; Zensus, A.; Bremer, M.; Greve, A.; Grewing, M. A Global 86 GHz VLBI Survey of Compact Radio Sources. Astron. J. 2008, 136, 159–180. [Google Scholar] [CrossRef]
Figure 1. Selected naturally weighted VLBI images of J1426+5406 at five different frequencies ( 1.7 , 2.3 , 5, 8, and 15.4 GHz) from between the years 2010 and 2017. The images are centred on their brightness peak. The intensities are represented by colors according to the palettes on the right-hand side of each panel, as well as the contours whose first level is drawn at approximately ± 3 σ image root mean square (rms) noise, except for the 5 GHz image (∼ 4 σ ). The positive contours increase by a factor of 2. Negative contours are shown as red dashed curves. The parameters of the images and the elliptical Gaussian restoring beams are given in Table 2. The half-power width of the restoring beam is illustrated by the ellipse in the lower-left corner of each image. The approximate positions of the fitted jet components (see Table A1, Table A2, Table A3, Table A4 and Table A5) are indicated in the middle panels.
Universe 11 00157 g001
Figure 2. The innermost ∼3 mas section of the core–jet structure of J1426+5406 in the central part of the 15.4 GHz image shown in Figure 1. See Figure 1’s caption for a detailed description, Table 2 for the image parameters, and Table A5 for the positions of the fitted jet components.
Universe 11 00157 g002
Figure 3. Core–jet distances as a function of time in J1429+5406, based on 3 epochs of VLBI observations and brightness distribution model fitting at 2.3 GHz (S band). The slopes of the fitted lines do not indicate significant apparent jet component proper motions for J1 and J2.
Universe 11 00157 g003
Figure 4. Core–jet distances as a function of time in J1429+5406, based on 3 epochs of VLBI observations and brightness distribution model fitting at 8 GHz (X band). The slopes of the fitted lines indicate apparent jet component proper motions determined for J3, J4, and J5. The presumably newly emerging component J6 was identified at the last epoch only. The 5 GHz (C-band) data points are shown in yellow for illustration purposes only and were not used for the proper motion determination.
Universe 11 00157 g004
Table 2. Parameters of the VLBI images shown in Figure 1 and Figure 2.
ν I p I 0 rms θ maj θ min PA
(GHz)(mJy beam−1)(mas)(°)
1.66333 ± 1.9 0.629.963.9911.9
2.29261 ± 1.7 0.585.434.243.7
4.99197 ± 0.80 0.183.401.427.5
8.67237 ± 0.61 0.201.411.095.0
15.37216 ± 0.84 0.280.830.663.2
Notes: Col. 1: central observing frequency; Col. 2: peak intensity; Col. 3: lowest intensity contour level; Col. 4: rms noise level in the residual map; Col. 5: elliptical Gaussian restoring beam major axis (half-power width); Col. 6: restoring beam minor axis (half-power width); Col. 7: restoring beam major axis position angle, measured from north through east.
Table 3. Lower and upper limits for the inner jet parameters.
Epoch T b δ Γ i
(year)(1011 K) (°)
1994.612>3.6≳8.8≳5.7≲5.4
2018.346>12.6≳30.8≳15.8≲0.6
Notes: Col. 1: mean observing epoch; Col. 2: brightness temperature of the core; Col. 3: Doppler factor; Col. 4: bulk Lorentz factor; Col. 5: inclination angle.
Disclaimer/Publisher’s Note: The statements, opinions and data contained in all publications are solely those of the individual author(s) and contributor(s) and not of MDPI and/or the editor(s). MDPI and/or the editor(s) disclaim responsibility for any injury to people or property resulting from any ideas, methods, instructions or products referred to in the content.