Abstract
Gravitational fragmentation of a protoplanetary disk is considered a possible mechanism for the formation of planets and brown dwarfs. In this process, transitory objects are formed that are known as clumps, which are compact gas–dust condensations with a size of several astronomical units. The contraction of these clumps to planetary sizes via the dissociation of molecular hydrogen or tidal downsizing can ultimately lead to planet or brown dwarf formation. Here, we present a comprehensive numerical and statistical study of the clump properties in protoplanetary disks formed from cloud cores of similar mass (0.9–1.0 ). We focus on possible differences in their characteristics depending on the metallicity of the parental disk. We show that notable differences can be expected in the clump characteristics in terms of their number, internal energetics, mass, and distance to the star. For all metallicities considered, the propensity to forming planets or brown dwarfs via disk fragmentation is challenged by large amounts of gravitationally unbound clumps. We conclude that giant planet formation via disk fragmentation is possible down to 1/100 solar metallicity but it should be a rare outcome. Brown dwarf formation via disk fragmentation is possible only down to 1/10 solar metallicity. Our results stand for similar masses of the central star on the order of the Sun.
1. Introduction
Giant planets and brown dwarfs differ from stars in their mass, which is insufficient to ignite thermonuclear reactions in their depths. The formation mechanism of giant planets and brown dwarfs may also differ from that of stars. While stars naturally form as a result of the gravitational collapse of compact molecular clouds [1,2], brown dwarfs require more extreme conditions for this mechanism to work. In particular, the pre-brown dwarf clouds have to be more compact than their pre-stellar counterparts, and/or some sort of external force has to terminate cloud collapse before too much mass is acquired by the central object to be still qualified as a brown dwarf (≤0.08 ). These specific conditions can be provided either by strong turbulence in molecular clouds or cloud truncation via external UV photoevaporation [3,4].
Gravitational collapse of molecular clouds is unlikely to directly produce giant planets the same way as it does for brown dwarfs or stars, as it would require too extreme conditions as outlined above. Planets form in protoplanetary disks, which build around stars as the material of the spinning-up molecular cloud pancakes into a centrifugally balanced disk-like configuration. A possible pathway for giant planet formation in the disk is core accretion, a mechanism that starts with the formation of a solid protoplanetary core in the protoplanetary disk via planetesimal and/or pebble accretion, followed by acquisition of a massive gaseous atmosphere when the mass of the solid core exceeds several Earth masses [5,6,7,8]. This mechanism is likely responsible for giant planets on orbits of several astronomical units and closer, especially if some migration towards the star has taken place [9,10].
Another formation mechanism that unites both brown dwarfs and giant planets is the gravitational fragmentation of massive protoplanetary disks [11]. Giant planets on wide orbits of tens and hundreds of astronomical units are likely to form via this mechanism [12,13,14,15]. Moreover, icy giants and Earth-like planets can also form via gravitational instability and fragmentation, followed by the inward migration of massive gas–dust protoplanetary clumps and tidal downsizing of their primordial gaseous atmospheres [16].
Giant planet and brown dwarf formation via disk gravitational fragmentation has been studied in detail in the context of solar metallicity environments. However, theoretical studies of this process for sub-solar metallicity disks are still scarce and controversial. The strength of gravitational instability and propensity to fragment was found to be inversely proportional to metallicity [17,18,19] or weakly sensitive to metallicity [20] or preferentially occurring at solar metallicity and higher [21]. Using numerical hydrodynamics simulations of disks (where is the solar metallicity) with sophisticated thermal balance calculations, Matsukoba et al. [22] confirmed that giant planets on wide orbits can form at subsolar metallicities via disk gravitational fragmentation.
Observational studies of giant planets in different metallicity environments have also led to ambiguous conclusions. On the one hand, the observed correlation between giant planet occurrence and metallicity is in favor of the core accretion formation mechanism [23]. This was interpreted as due to the shortage of heavy elements in low metallicity disks, which are needed to form massive solid cores in the core accretion paradigm. On the other hand, giant planets appear to increase in mass as the metallicity of their host star increases. However, this trend is reversed when the planet’s mass exceeds several and the metallicity of the host star begins to decrease as the planet’s mass increases further [24,25]. This could signify a switch between core accretion and gravitational fragmentation as the dominant formation mechanisms of giant planets.
In this work, we continue the numerical study of disk gravitational fragmentation at different metallicities started in Matsukoba et al. [19]. The main difference of our work is in the initial configuration of prestellar cloud cores that form protostellar objects, and also in the focus on the internal properties of the clumps rather than on their number. Matsukoba et al. [19] simulated the gravitational collapse of cloud cores of increasingly higher mass in progressively metal-poor environments, reflecting an increase in the cloud mass unstable for collapse as the metallicity decreases (the Jeans mass). Here, we consider cloud cores of similar mass but increase the central density of the cloud and make it more compact to achieve a state in which the cloud becomes gravitationally unstable and collapses to form a protostar and protostellar disk. This implicitly assumes some form of cloud truncation at lower metallicity, which may be achieved by external UV photoevaporation. At mass , such increasingly dense and more compact pre-stellar cloud cores can be constructed down to 0.01 solar metallicity. Therefore, we consider three representative metallicities: Solar (), one-tenth of Solar (), and one-hundredth of Solar ().
The paper is organized as follows. In Section 2, we describe the numerical model and methods used to simulate disks and analyze the outcome of disk fragmentation. In Section 3, the main results of our simulations are presented and statistically analyzed. In Section 5, we provide our main conclusions.
2. Materials and Methods
In this section, we provide a description of the model employed to simulate the formation and long-term evolution of protoplanetary disks and the methods used to characterize the properties of gaseous clumps formed via disk gravitational fragmentation.
2.1. Hydrodynamic Model
We use numerical hydrodynamics simulations in the thin-disk limit to model the formation and evolution of gravitationally unstable protoplanetary disks with metallicities ranging from to . The thin-disk limit allows for studying disk dynamics over long evolution times, ≈0.4 Myr from the disk formation instance, which are hardly achievable in full three-dimensional disk-formation simulations for a comparable numerical resolution. The numerical model was described in detail in Vorobyov et al. [26], and a summary of the most important ingredients is provided below.
The disk model considers self-gravity and turbulent viscosity, the latter is described via the usual Shakura and Sunyaev parameterization [27], with the -value set equal to . This value corresponds to a disk with a fully developed magnetorotational instability [28]. Recent observations of efficient dust settling towards the midplane of protoplanetary disks at their advanced stage of evolution (Class II) suggested lower values of [29]. Younger Class 0 and I disks, which are particularly relevant for the present work because disk gravitational fragmentation is strongest at this stage of evolution [30], do not show strong settling to the disk midplane [31], which may indicate stronger turbulence and higher . Nevertheless, the effects of lower values are worth exploring in follow-up studies.
Unlike many previous studies of disk evolution that make no distinction between gas and dust temperatures, we employ a sophisticated thermal evolution scheme that separates gas and dust temperatures. The following energetic processes were considered: radiative continuum cooling (or heating) of gas and dust (including collisional transfer of energy between gas and dust), H2 and HD line cooling, chemical cooling and heating through considered chemical reactions, metal line cooling, stellar and background irradiation, and viscous heating. Subsolar metallicities are set by scaling down the dust opacities, dust-to-gas mass ratio, and metal content of the solar metallicity disk by the corresponding factor.
The hydrodynamic equations for mass, momentum, and internal energy density in the thin-disk limit can then be written as
where is the gas mass surface density, P is the vertically integrated gas pressure calculated via the ideal equation of state as , e is the internal energy per surface area, is the ratio of specific heats, is the velocity in the disk plane, and is the gravitational acceleration in the disk plane (including that of the disk and the star). Turbulent viscosity enters the basic equations via the viscous stress tensor . The total cooling–heating rate is expressed as
where H is the vertical scale height calculated assuming a local hydrostatic equilibrium in the gravitational field of the star and disk (see [32]), is the rate of radiative continuum cooling (or heating) of gas and dust (including collisional transfer of energy between gas and dust), is the H2 line cooling rate, is the HD line cooling rate, is the chemical cooling–heating rate (through chemical reactions), and is the metal line cooling rate. All constituents of are volumetric cooling or heating rates. The dust temperature is determined in the steady-state limit by the energy balance on dust grains due to the thermal emission, absorption, and collision with gas. We note that cooling–heating described by Equation (4) does not include the adiabatic cooling–heating and viscous heating, which are taken into account by the first and third terms on the right-hand side of Equation (3).
In addition to hydrodynamic Equations (1)–(3), we solve the non-equilibrium kinetic equations for H, H2, H+, D, HD, D+, and e, while the H− fraction is calculated from the equilibrium assumption. We assume that helium is always neutral and its fractional abundance is . The stellar characteristics, such as the radius and photospheric luminosity, are calculated in line with the disk evolution using the stellar evolution code STELLAR [33], modified by Hosokawa et al. [34] to take different metallicities into account. The stellar characteristics are further used to calculate the stellar radiation flux impinging on the surface of the disk (stellar irradiation heating). The co-evolution of the disk and the central protostar allows us to accurately follow the thermal evolution of a highly dynamic system with variable accretion and luminosity [35]. The sophisticated thermal evolution scheme allows us to realistically model gravitational fragmentation, which is sensitive to cooling and heating processes in the disk [30,36,37].
2.2. Initial Conditions
The starting point of numerical simulations is the gravitational collapse of a pre-stellar core. We consider three model realizations with distinct metallicities: Z = 0.01 , , and . In our numerical model, the choice of metallicity affects the dust opacities and the abundance of oxygen and carbon that are used to calculate metal cooling rates (see [26]). We use dust opacities of Semenov et al. [38] for the Solar metallicity case, scaled down accordingly for lower metallicity models. The carbon and oxygen (by number) abundances are set equal to and , respectively, for the Solar metallicity case, which corresponds to 72% of carbon and 46% of oxygen depleted onto grains, following the dust grain model in molecular clouds of Pollack et al. [39], see also Omukai [40]. These abundances are scaled down accordingly for lower metallicity models.
All models with different metallicity have similar cloud core masses. This allows us to minimize uncertainties that may be caused by different mass reservoirs available for protoplanet and proto-brown dwarf formation. The initial radial profiles of the gas surface density and angular velocity of the pre-stellar core have the form typical of rotating cloud cores [41]:
Here, and are the gas surface density and the angular velocity at the center of the core. The radius of the central plateau is proportional to the thermal Jeans length and is defined as , where is the central gas volume density, is the initial sound speed in the core, is the mean molecular weight, is the initial gas temperature, is the universal gas constant, and A is the amplitude of the initial positive density perturbation that drives the system out of equilibrium and trigger gravitational collapse. All model cores have the same ratio of rotational-to-gravitational energy . Table 1 provides the numerical values of the above parameters, and further details can be found in Vorobyov et al. [35].

Table 1.
Model parameters.
2.3. Numerical Resolution and Solution Method
The polar grid () is logarithmically spaced in the radial direction and has equal spacing in the azimuthal direction. The inner 5 au was cut out and replaced with the sink cell. The numerical resolution is a grid zone for Models Z1.0 and Z0.1, and for Model Z0.01. The resulting physical size of grid cells in the radial and azimuthal directions is about factors 1.7 and 2.0 larger than in the higher metallicity models. We note, however, that the disk in Model Z0.01 is also more compact than in the other two models (see Section 3.3). This somewhat offsets the effect of a lower numerical resolution because clump formation and evolution occur at smaller radial distances, where numerical resolution is higher on the log-spaced polar grid.
The radial size of the innermost grid cell (just outside 5 au) varies in the 0.077–0.13 au limits, depending on the model, and it scales linearly with the radial distance. The Truelove criterion states that the local Jeans length must be resolved by at least four numerical cells to correctly capture disk fragmentation [42]. In the thin-disk limit, the Jeans length can be expressed as [14]
Fragments usually condense out of the densest sections of spiral arms at a typical distance of 100 au and then either migrate inward or scatter outward. The typical surface densities and temperatures in spiral arms do not exceed 100 g cm−2 and 100 K. Adopting these values, the corresponding Jeans length is 20 au. The numerical resolution at 100 au varies in the 1.5–2.8 au limits, thus fulfilling the Truelove criterion. Finally, we note that the inner boundary condition allows matter to flow in both directions through the sink–disk interface. This greatly reduces a spurious drop in the gas density near the sink that may develop in models with a one-way boundary condition if large azimuthal oscillations are present near the disk–sink interface caused by the non-axisymmetric gravity force of the gravitationally unstable disk (for details, see [43]).
The integration of hydrodynamics equations in the polar coordinates (r, ) was carried out using a finite-volume method with a time-explicit solution procedure similar in methodology to the ZEUS code [44]. The advection of gas and chemical species (which are collisionally coupled to gas) is treated using the third-order-accurate piecewise-parabolic interpolation scheme of Colella and Woodward [45], which is characterized by very low numerical diffusion. Owing to consistent transport [46], our numerical scheme globally conserves angular momentum within machine precision. The stellar mass grows according to the mass accretion rate through the inner computational boundary.
2.4. Clump Identification Algorithm
Once the simulations are finished, we postprocess the output data to check for gaseous clumps—the progenitors of giant planets or brown dwarfs, which may have formed in the disk via disk gravitational fragmentation. A fragment of the disk is recognized as a clump if it is gravitationally bound, as well as pressure supported. These conditions are verified using the gradients of pressure P and gravitational potential that are calculated starting from local peaks in surface density
The extent of the clump within the disk is determined by the grid cells that fulfill both conditions simultaneously. The center of the clump is defined as the location of the local peak in . We note that the same clump may be analyzed several times as it emerges and migrates in the disk.
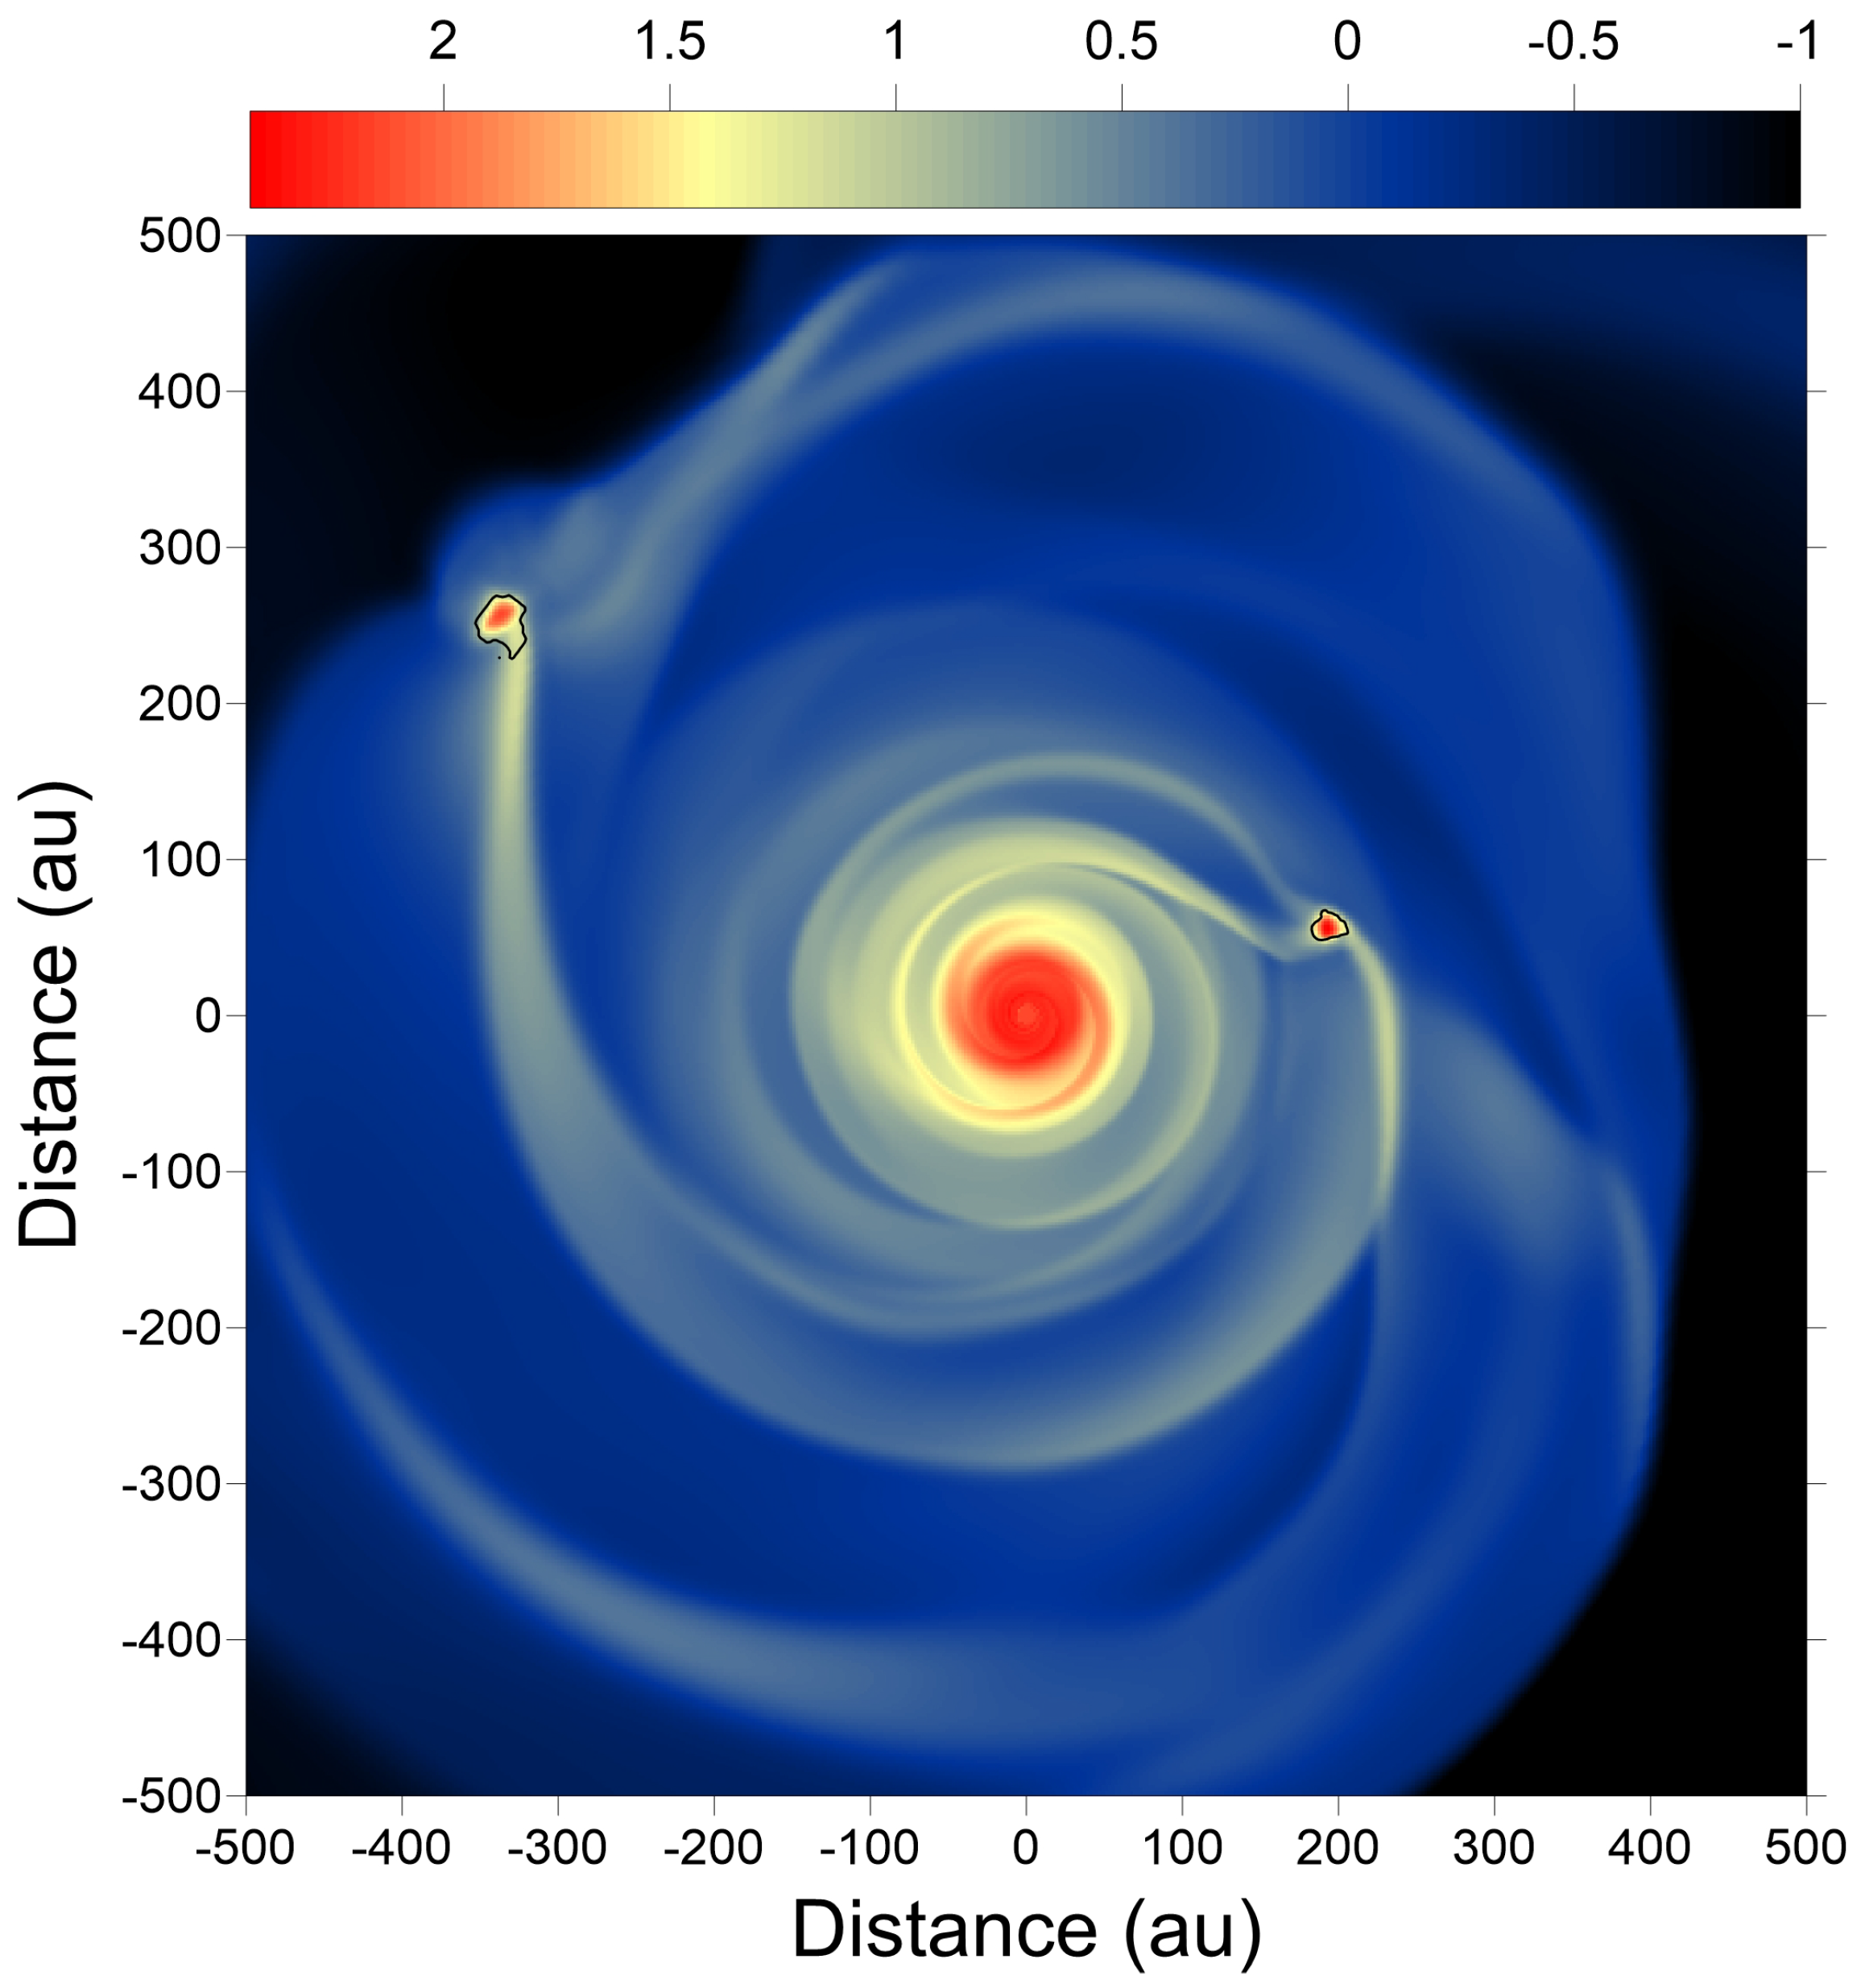
We do not introduce sink particles to replace the clumps. The consequences of this decision are twofold. On the one hand, we are free from assumptions that are usually made to pinpoint a clump on its way to make a compact, planetary, or brown dwarf-like object. These include converging flows, a certain density or temperature threshold, etc. (e.g., [47]), which are only suggestive and may be difficult to fulfill in limited-resolution simulations. Furthermore, the introduction of a sink cell instead of a clump is a one-way process—once sinks are created, they are indestructible. On the other hand, keeping clumps without a sink particle option may lead to premature destruction of the clumps due to tidal forces exacerbated by finite numerical resolution. However, this method allows us to obtain information on the clump’s internal properties and, in particular, on the energy balance within the clump, thus making predictions on the survivability of the clumps and the likelihood of planet and brown dwarf formation. This is the focus of our paper. An example of how our algorithm outlines the clumps in the disk is provided in Figure 1. Once the clump is identified, its characteristics are further calculated as described below.
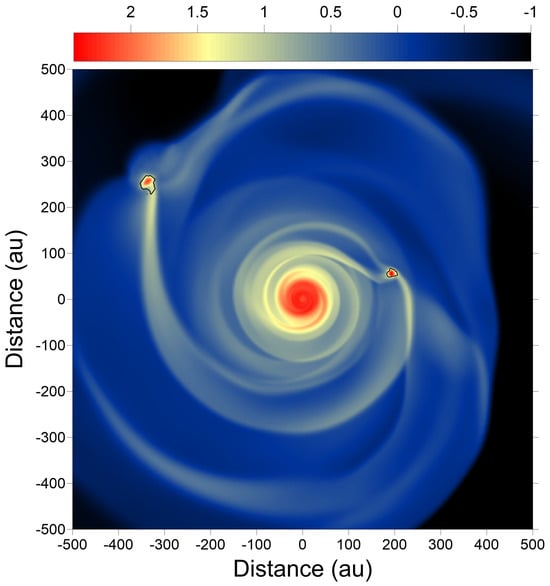
Figure 1.
Gravitationally unstable protoplanetary disk with two clumps. Shown are the gas surface density distribution and black contour curves outlining the clumps according to our clump capturing mechanism. The color bar is in log g cm−2.
2.5. Energy Calculation
Relevant to the analysis are the gravitational, rotational, and thermal energies of clumps. Their expressions come from the Jeans equation but need to be adjusted to the two-dimensional polar grid. The gravitational energy is defined as negative and calculated from a clump’s surface density , gravitational acceleration , and its position vector . Here, is the difference between the vector from the coordinate center to one of the clump’s cells and the vector from the coordinate center to the clump’s center. We note that is calculated at in the clump’s local frame of reference. The gravitational energy is calculated for each clump individually using
where integration is performed over area occupied by the clump.
Similar to the gravitational energy, the necessary parameters to calculate the rotational energy are first determined in the local frame of reference of a clump. The relative velocity is given by (, ), which describes the difference in velocity between a clump’s grid cell and clump’s center. Only the angular component of the relative velocity is needed for the final calculation of rotational energy. The final equation for the rotational energy is given by
The calculation of the thermal energy uses the ideal gas equation of state
where P is the vertically integrated pressure, e is the internal energy per surface area, and is the adiabatic exponent, set equal to 7/5 for gas temperatures K and 1.05 for K [48]. The thermal energy can then be calculated as
with the universal gas constant and mean molecular weight . We note that and are functions of temperature and, using fixed values, introduce uncertainty on the order of unity in the calculations of thermal energy.
3. Results
In this section, we describe the disk evolution, its gravitational fragmentation, and the resulting properties of clumps in models with different metallicity.
3.1. Global Disk Evolution
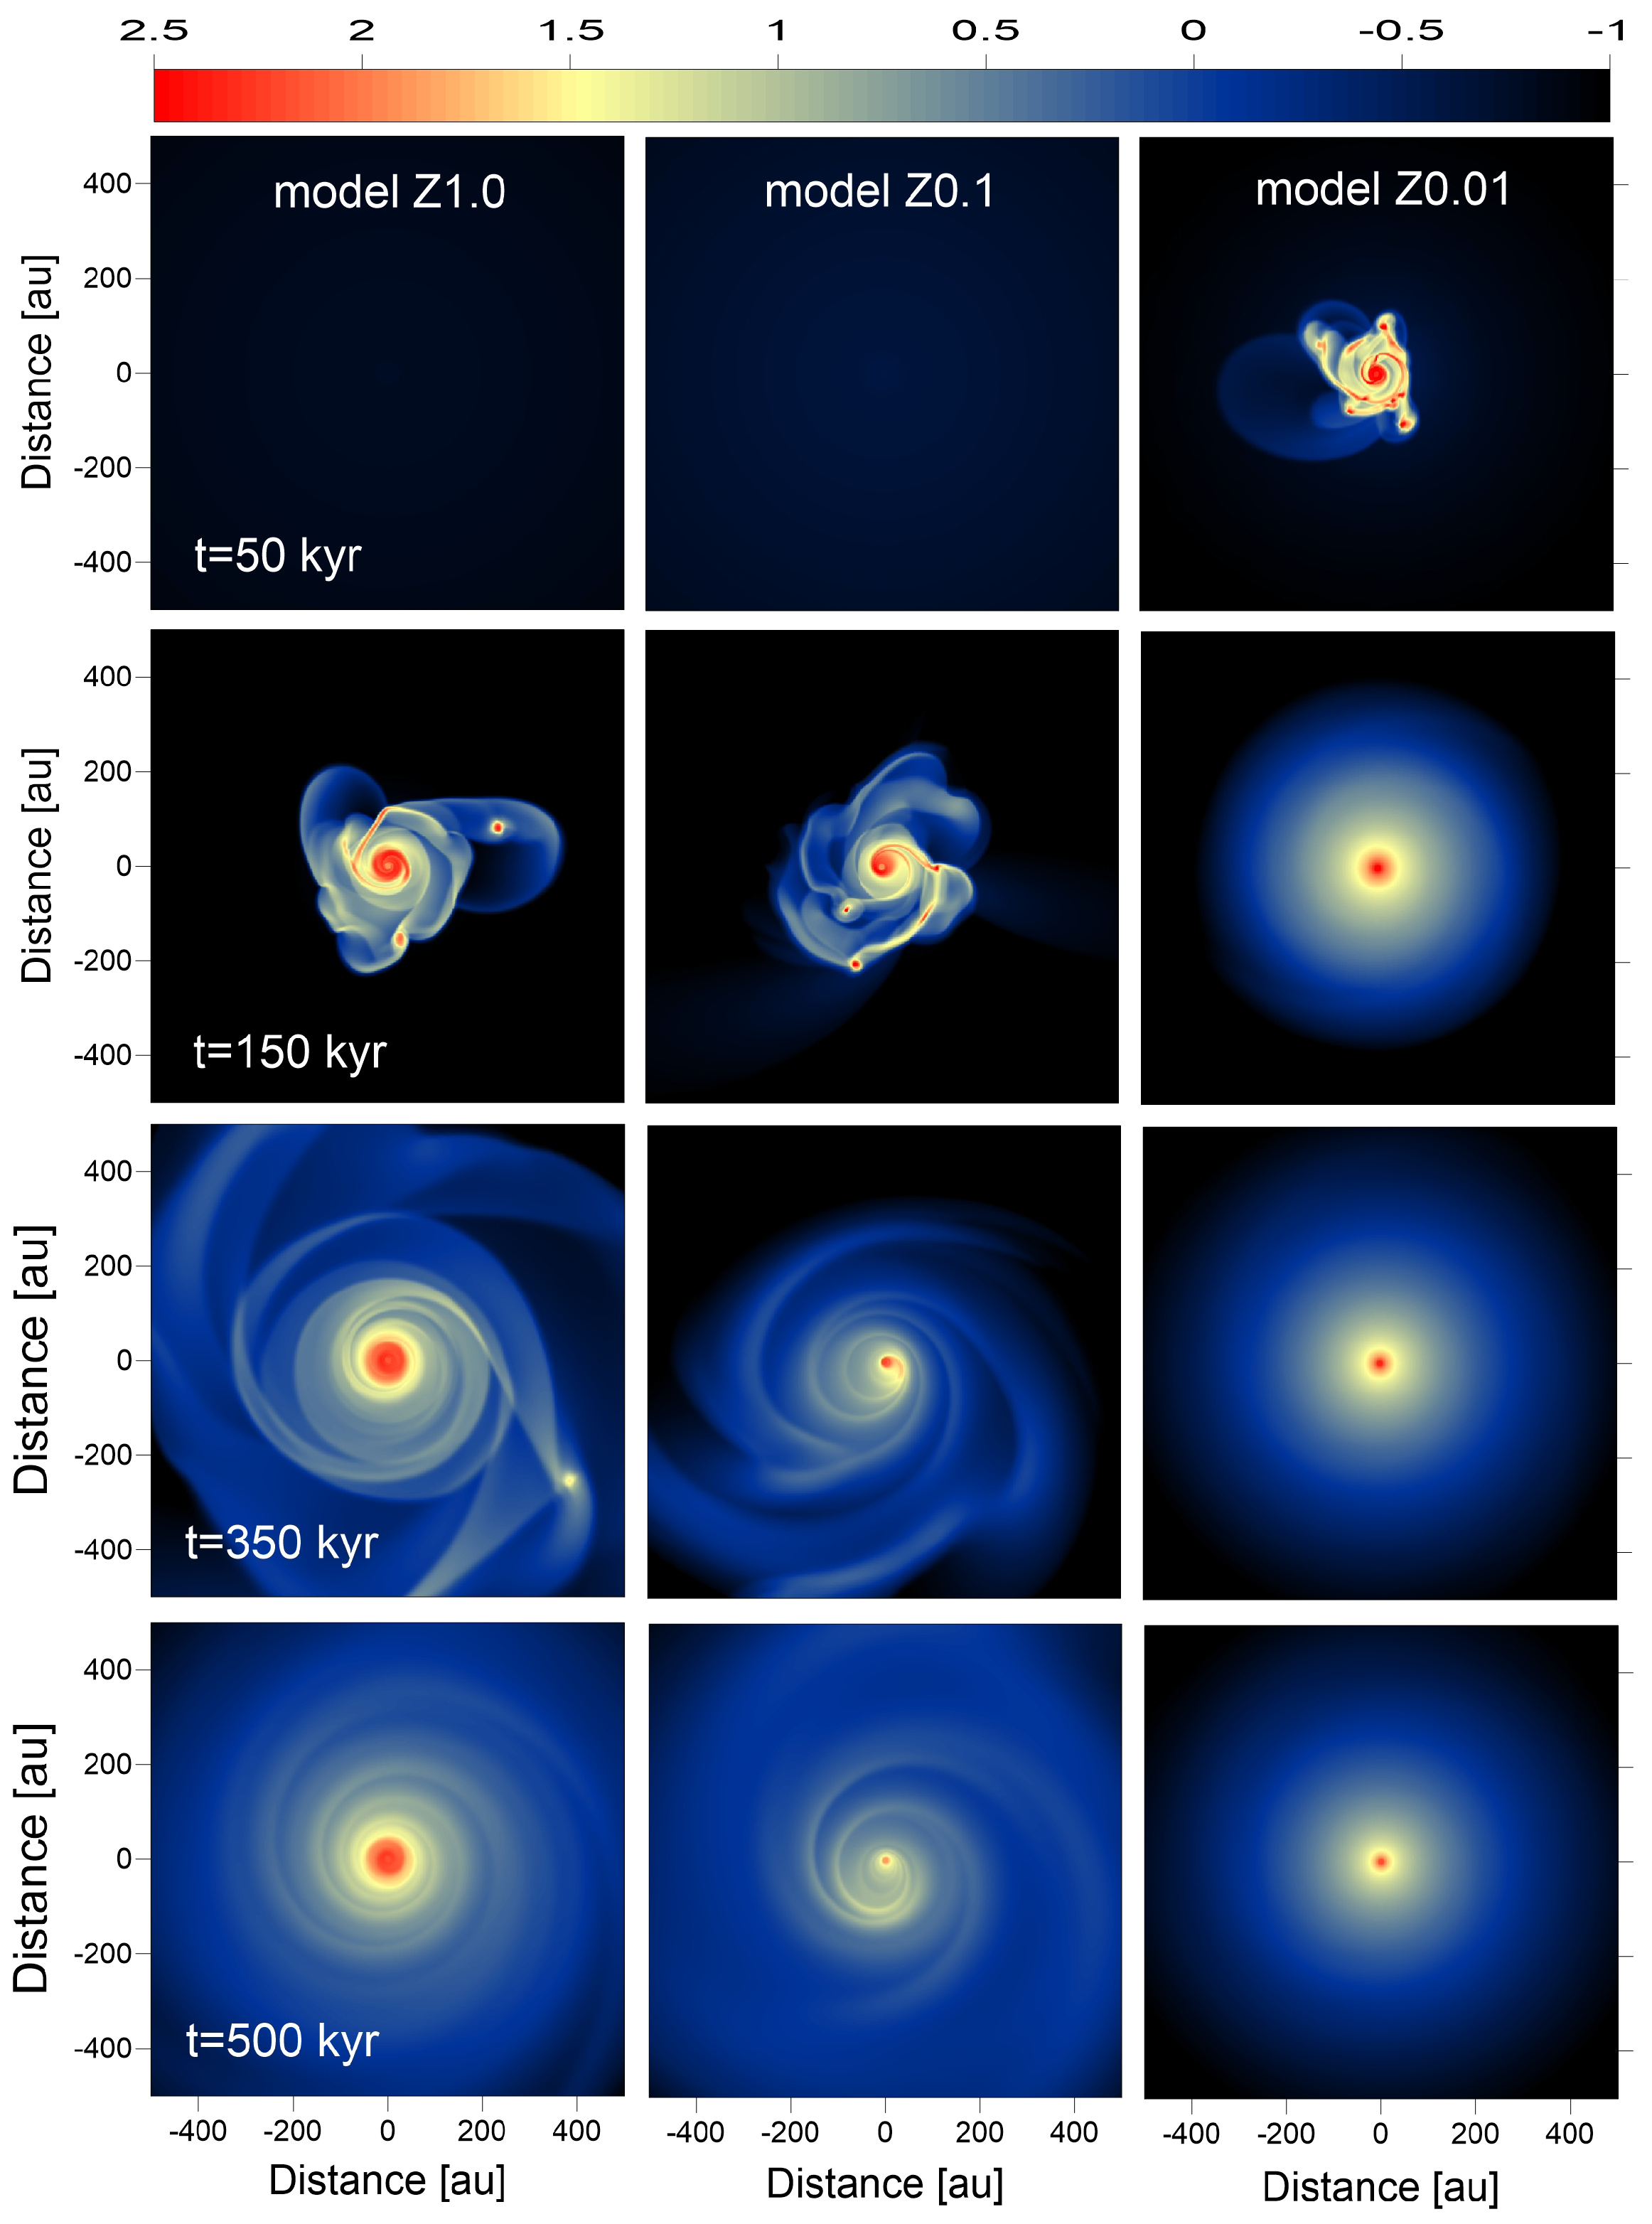
Figure 2 presents the time evolution of circumstellar disks in the three models considered. Each row corresponds to a specific time elapsed since the onset of cloud core collapse. As was noted in Vorobyov et al. [35], cloud cores of similar mass but different metallicity have different collapse timescales. In particular, lower metallicity clouds collapse faster and, as a consequence, form the disks sooner than their higher metallicity counterparts. This is explained by systematically higher temperatures and central densities of lower metallicity cores, resulting in faster collapse and higher infall rates from the cloud onto the disk, . These trends are reflected in Figure 2, showing that the disk in Model Z0.01 has already formed at t = 50 kyr and is gravitationally fragmented, while the other models are still in the pre-disk collapse stage. At t = 150 kyr, Models Z1.0 and Z0.1 exhibit gravitationally unstable disks with multiple clumps, while the disk in Model Z0.01 is already past the fragmentation stage. At t = 350 kyr, Models Z1.0 and Z0.1 are gravitationally unstable but have only episodic fragmentation, while the disk in Model Z0.01 is stable and axisymmetric. Therefore, the disk in the lowest metallicity model evolves much faster along the evolutionary sequence: formation–strong instability–fragmentation–weak instability–stabilization. Gradual stabilization of the disks in all models is caused by continual loss of mass from the disk to the star (protostellar accretion) due to viscous and gravitational torques.
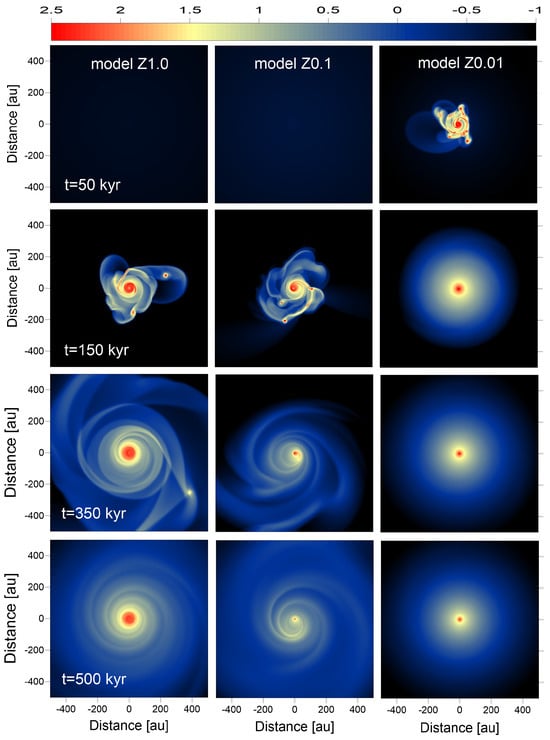
Figure 2.
Images of protoplanetary disks at several evolutionary times in the three models considered. The columns from left to right correspond to Models Z1.0, Z0.1, and Z0.01, while the rows present different times since the onset of simulations. Note that in Models Z1.0 and Z0.1, the disk at kyr is yet to form. The scale bar is in log g cm−2.
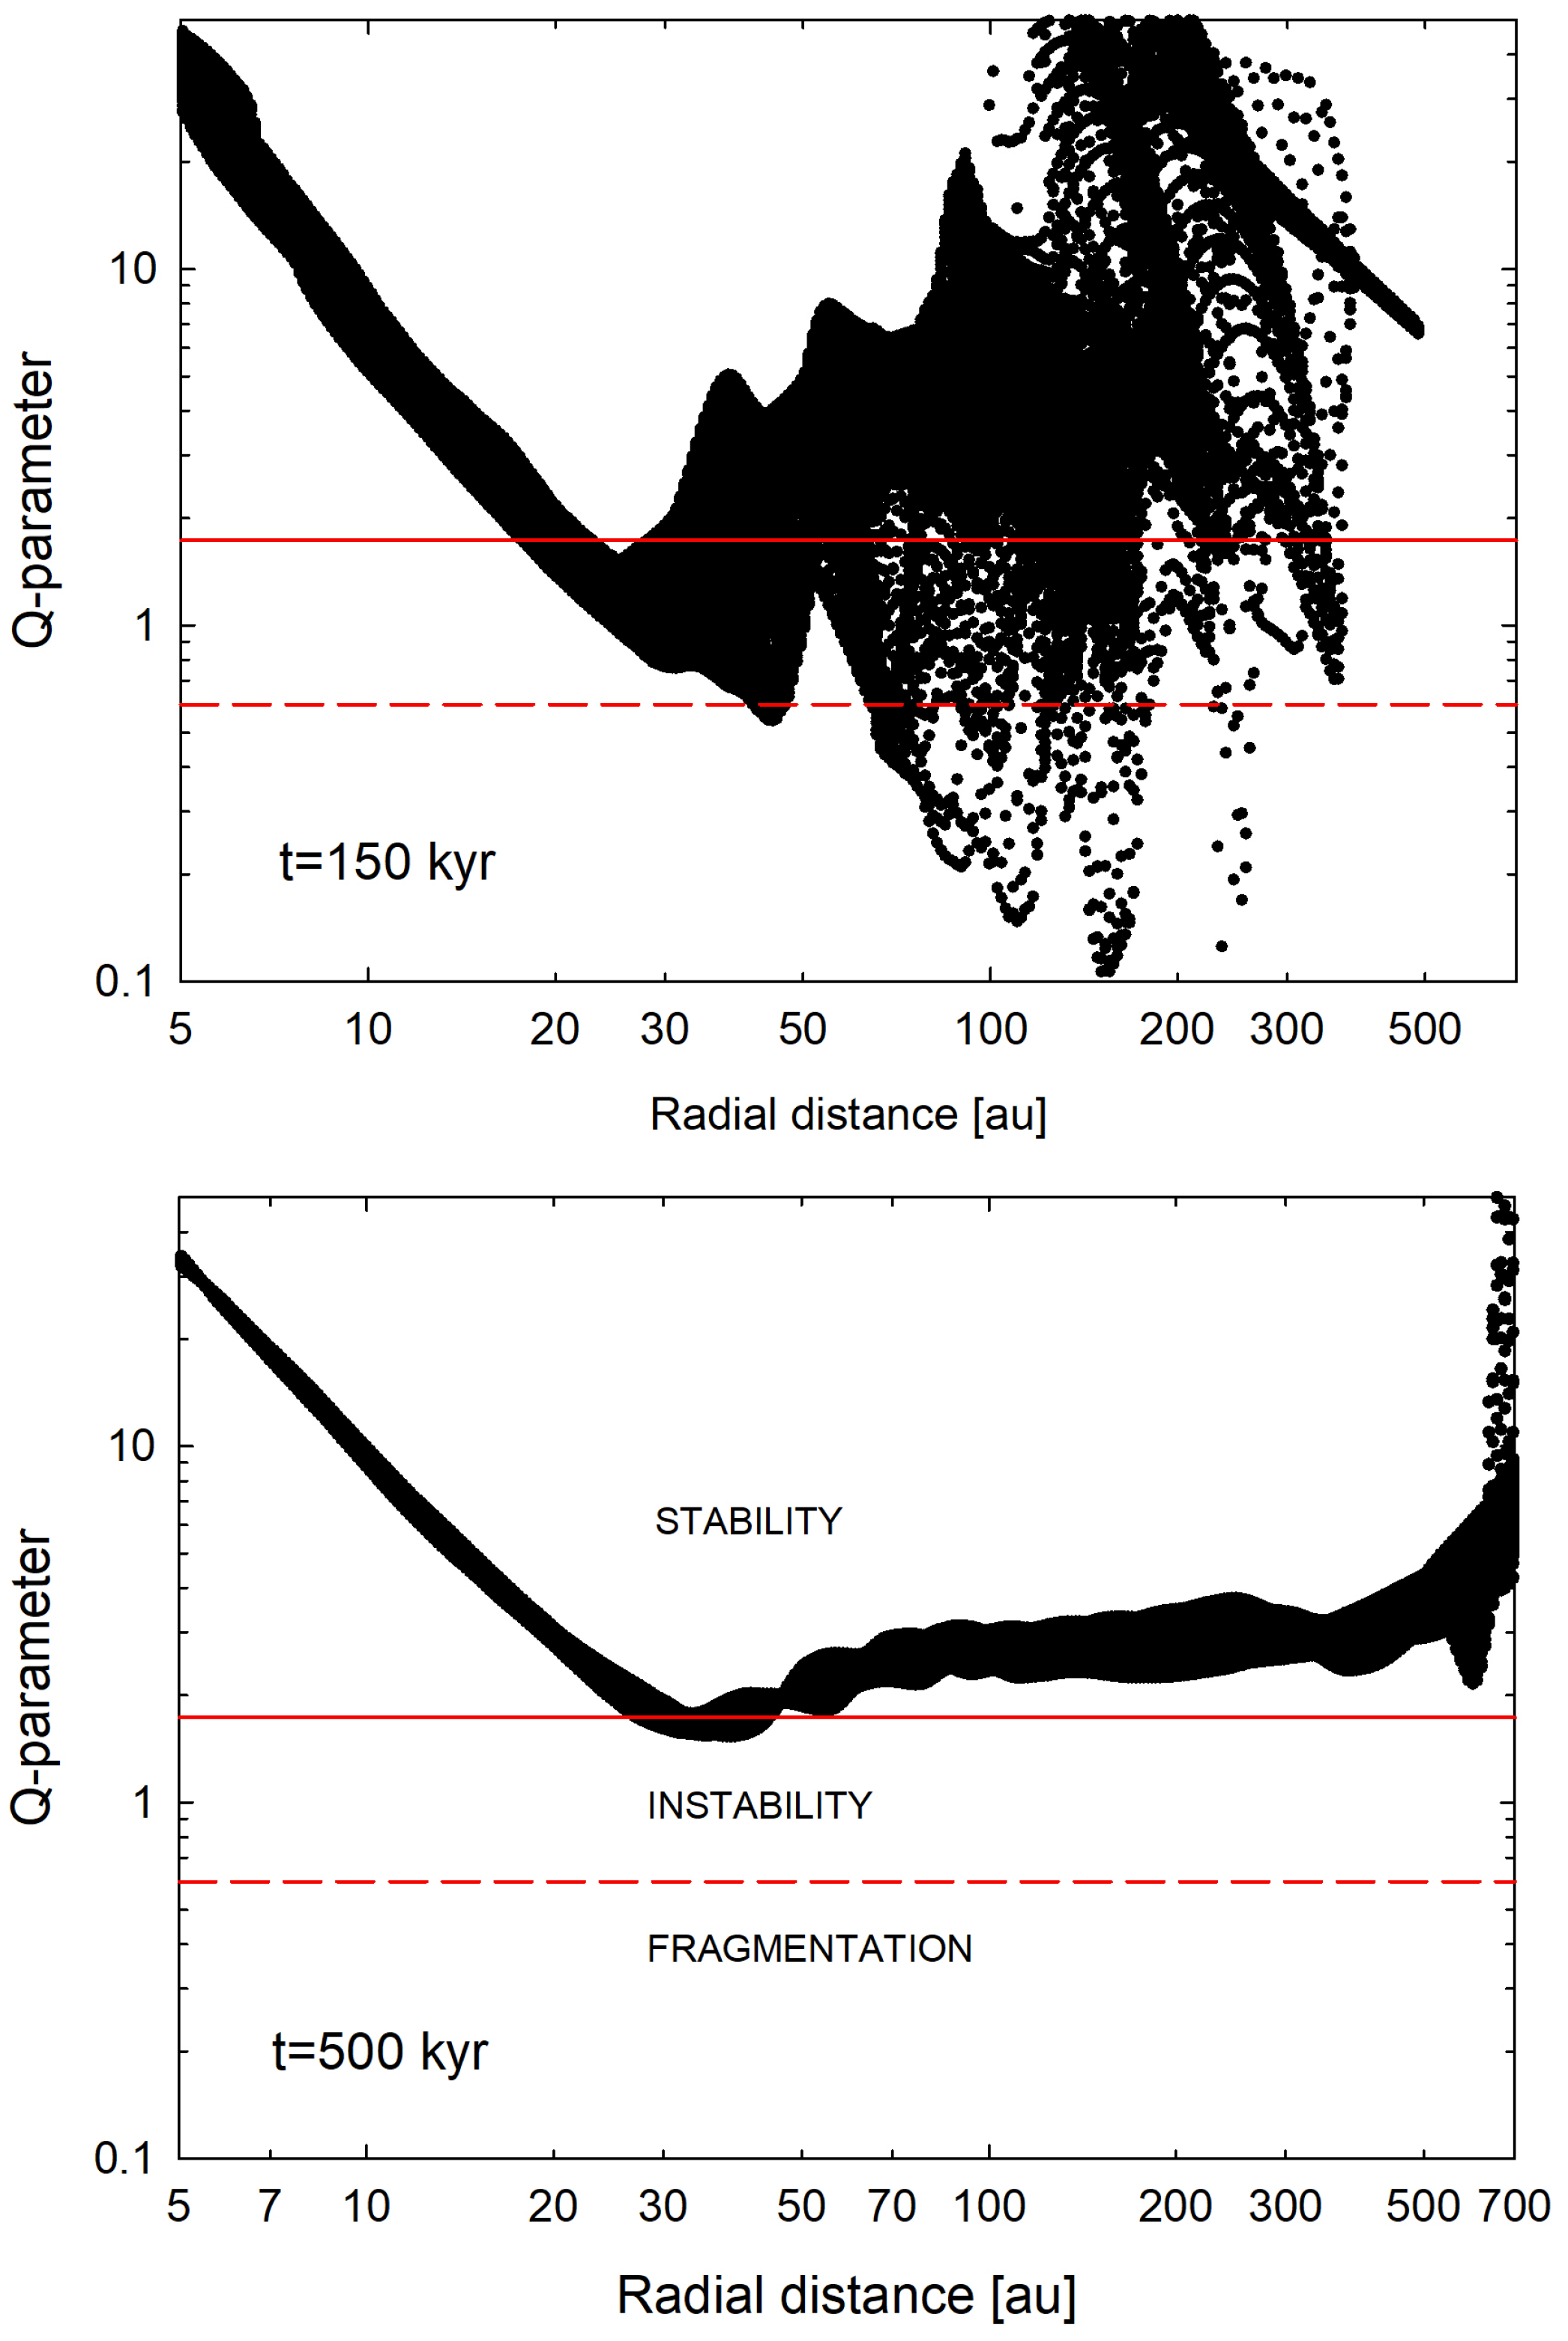
Figure 3 shows the Toomre Q-parameter in the disk of Model Z1.0 as a function of radial distance from the protostar. The Q-parameter is calculated in the standard way as in [49]
The corresponding values of the Q-parameter are calculated for each computational cell in the considered spatial range. No azimuthal average is applied. The classical Toomre analysis for axisymmetric one-dimensional disks gives a threshold value of . Below this value, gravitational instability develops. However, the stability analysis of thin two-dimensional disks to non-axisymmetric perturbations, which is more relevant to our simulations, yields a critical value for instability of [50]. Furthermore, disk gravitational fragmentation and clump formation can occur if as the analytical and numerical models of Takahashi et al. [51] suggest. Both values are indicated in Figure 3 with the horizontal lines. Clearly, the disk at kyr is prone to both gravitational instability and fragmentation, in agreement with what is seen in Figure 2. However, the disk at kyr is only gravitationally unstable but is not susceptible to fragmentation, in accordance with the disk appearance in Figure 2. Other models reveal similar trends in the Q-parameter.
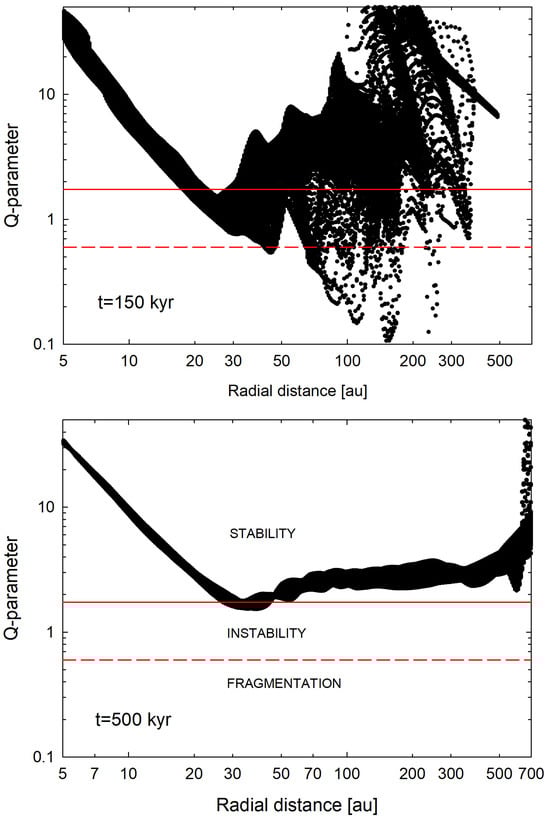
Figure 3.
Q-parameter as a function of radial distance in Model Z1.0. Two evolution times are shown: kyr (top panel) and kyr (bottom panel). The horizontal red solid and dashed lines highlight the boundaries for gravitational instability and fragmentation, respectively.
3.2. Clump Occurrence vs. Time
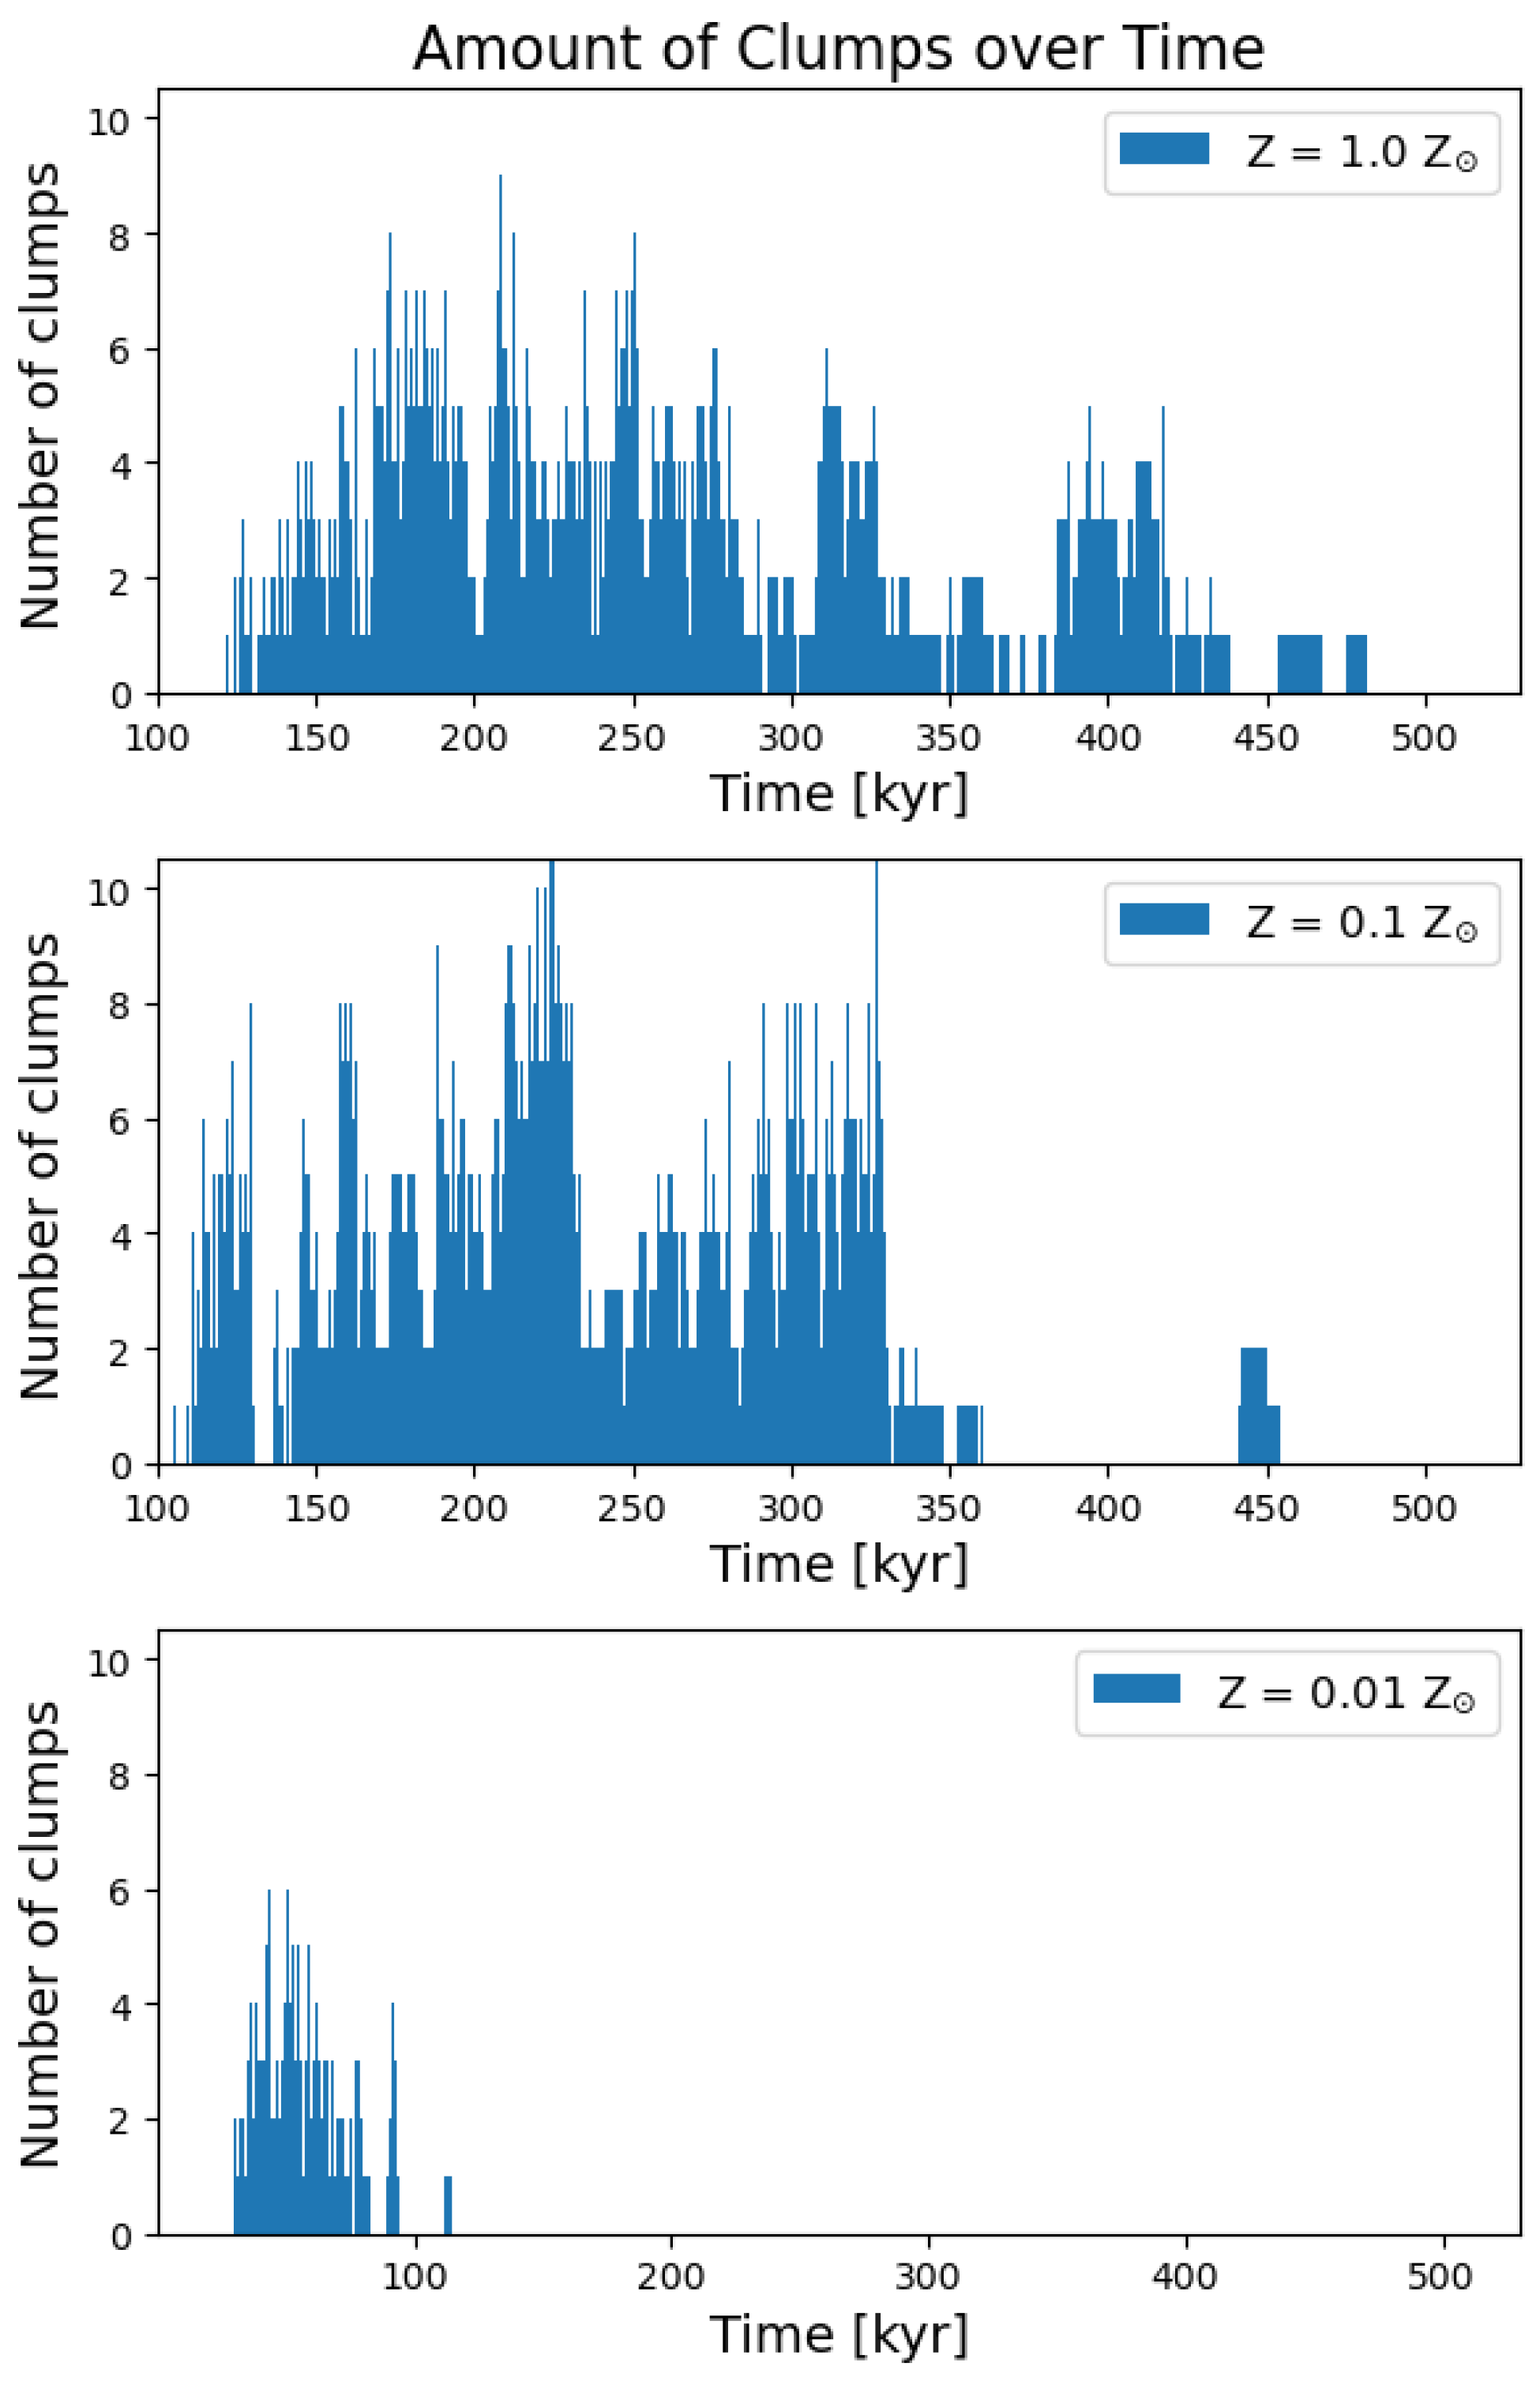
We first study the occurrence of clump realizations for each protoplanetary disk over the course of their respective simulations. This is done by considering the number of clumps present in the disk every 500 yr starting from the onset of simulations. The result is shown in Figure 4. Each simulation runs for about 500 kyr, although the exact time depends on the case. The solar metallicity case shows that for the majority of the simulation, at least one clump was present in the disk. The distribution shows that clumps occurred more commonly in the first 250 kyr than later, the most amount of clumps occurring simultaneously being roughly nine. The number of clumps present in the disk does not increase gradually with time because clumps are subject to destructive tidal forces, merging, ejection, and fast inward migration onto the star, all of which balance the production of clumps via disk fragmentation [30,52,53]. The overall decrease in clump occurrences in the late evolution is due to the advancing mass accretion from the disk onto the protostar therefore decreasing the amount of available gas in the disk, leading to diminishing gravitational instability (see Figure 2). Towards the end of the simulation, only a few clumps are seen. Over the course of the simulation, the solar metallicity disk counts 850 clump realizations for the adopted frequency of disk time snapshots (every 500 yr).
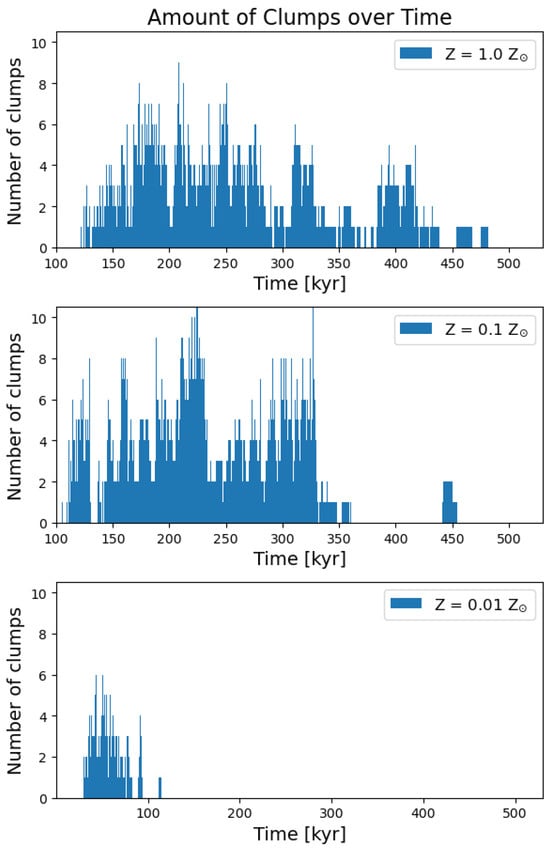
Figure 4.
Amount of clumps present in the disk for all three metallicity models. While clumps form for several hundred kyr in the Z⊙ and 0.1 Z⊙ disks, the lowest metallicity disk shows a lot fewer clumps from which most have already vanished after 100 kyr.
The Z = 0.1 Z⊙ disk seems to start the formation of clumps a few kyr earlier than the solar metallicity case, which is shortly after 100 kyr. We found that this metallicity case exhibits more clump realizations in total than the solar metallicity model. There are 1149 realizations, and the maximum number of clumps at a given time instance is also higher, 11 vs. 9. The overall clump occurrence is more chaotic in Model Z0.1 than in the solar metallicity case, which is manifested by high-amplitude surges and sharp drops in the number of clumps, likely reflecting a higher strength of gravitational instability and more violent dynamics and destructive forces acting on the clumps in the early evolutionary stage. Finally, the Z = 0.01 Z⊙ case varies significantly from the other two cases. Here, the fragmentation begins less than 50 kyr after the core collapse and stops at around 100 kyr, the time at which the higher metallicity disks just begin to fragment. This short fragmentation phase is caused by a faster evolution of the disk at this low metallicity (see Figure 2), naturally resulting in significantly less clump realizations in total, there are 197. The maximum number of clumps at a time is also lower, 6 vs. 9 and 11 in the other higher metallicity models.
For all three disks, it is important to keep in mind that the simulation’s output is produced each 500 yr. This means that it is difficult to know whether two consecutive time steps consider the same clumps or different, newly formed ones. Even the same clump may have evolved notably over 500 yr, thus possessing different characteristics at two consecutive time snapshots. Therefore, in the following sections, we perform a statistical analysis of the clump realizations employing probability distribution functions and treating each clump realization as a unique clump. We also may have missed some clumps with a simulation’s output of 500 yr. Indeed, a clump usually makes several orbital periods before being tidally dispersed (or else destroyed). One orbital period of 500 yr in our Keplerian disks corresponds to distances of 35–50 au, depending on the mass range of the star. Most clumps in Models Z1.0 and Z0.1 are found at larger distances (see Figure 5), meaning that we sample their characteristics at least once per orbital period and the clumps are unlikely to be lost. However, in Model Z0.01 about 18% of the clumps are found at distances where the adopted time sampling may not be sufficiently frequent. Thus, a small fraction of the clumps in this latter model may be lost.
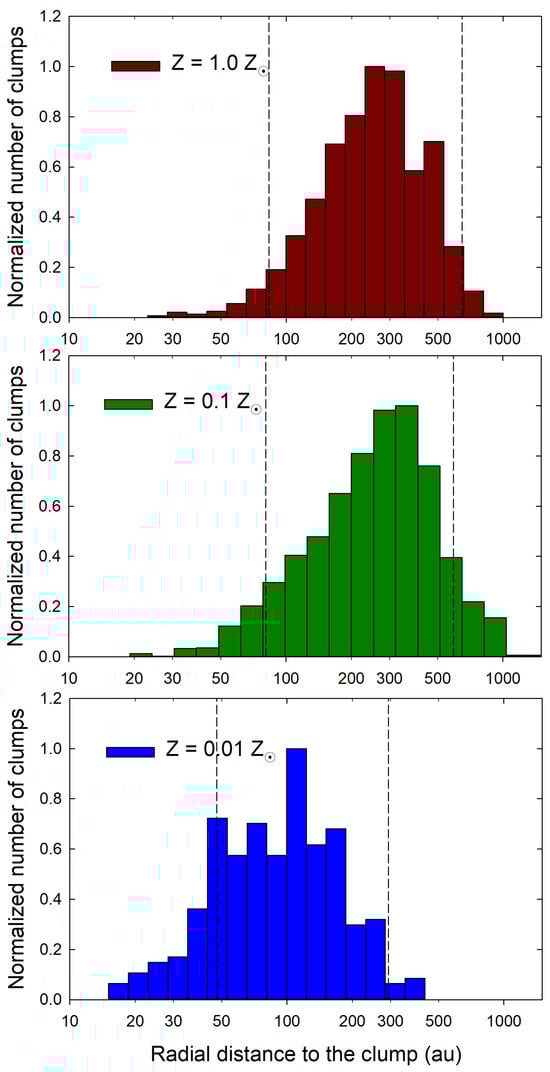
Figure 5.
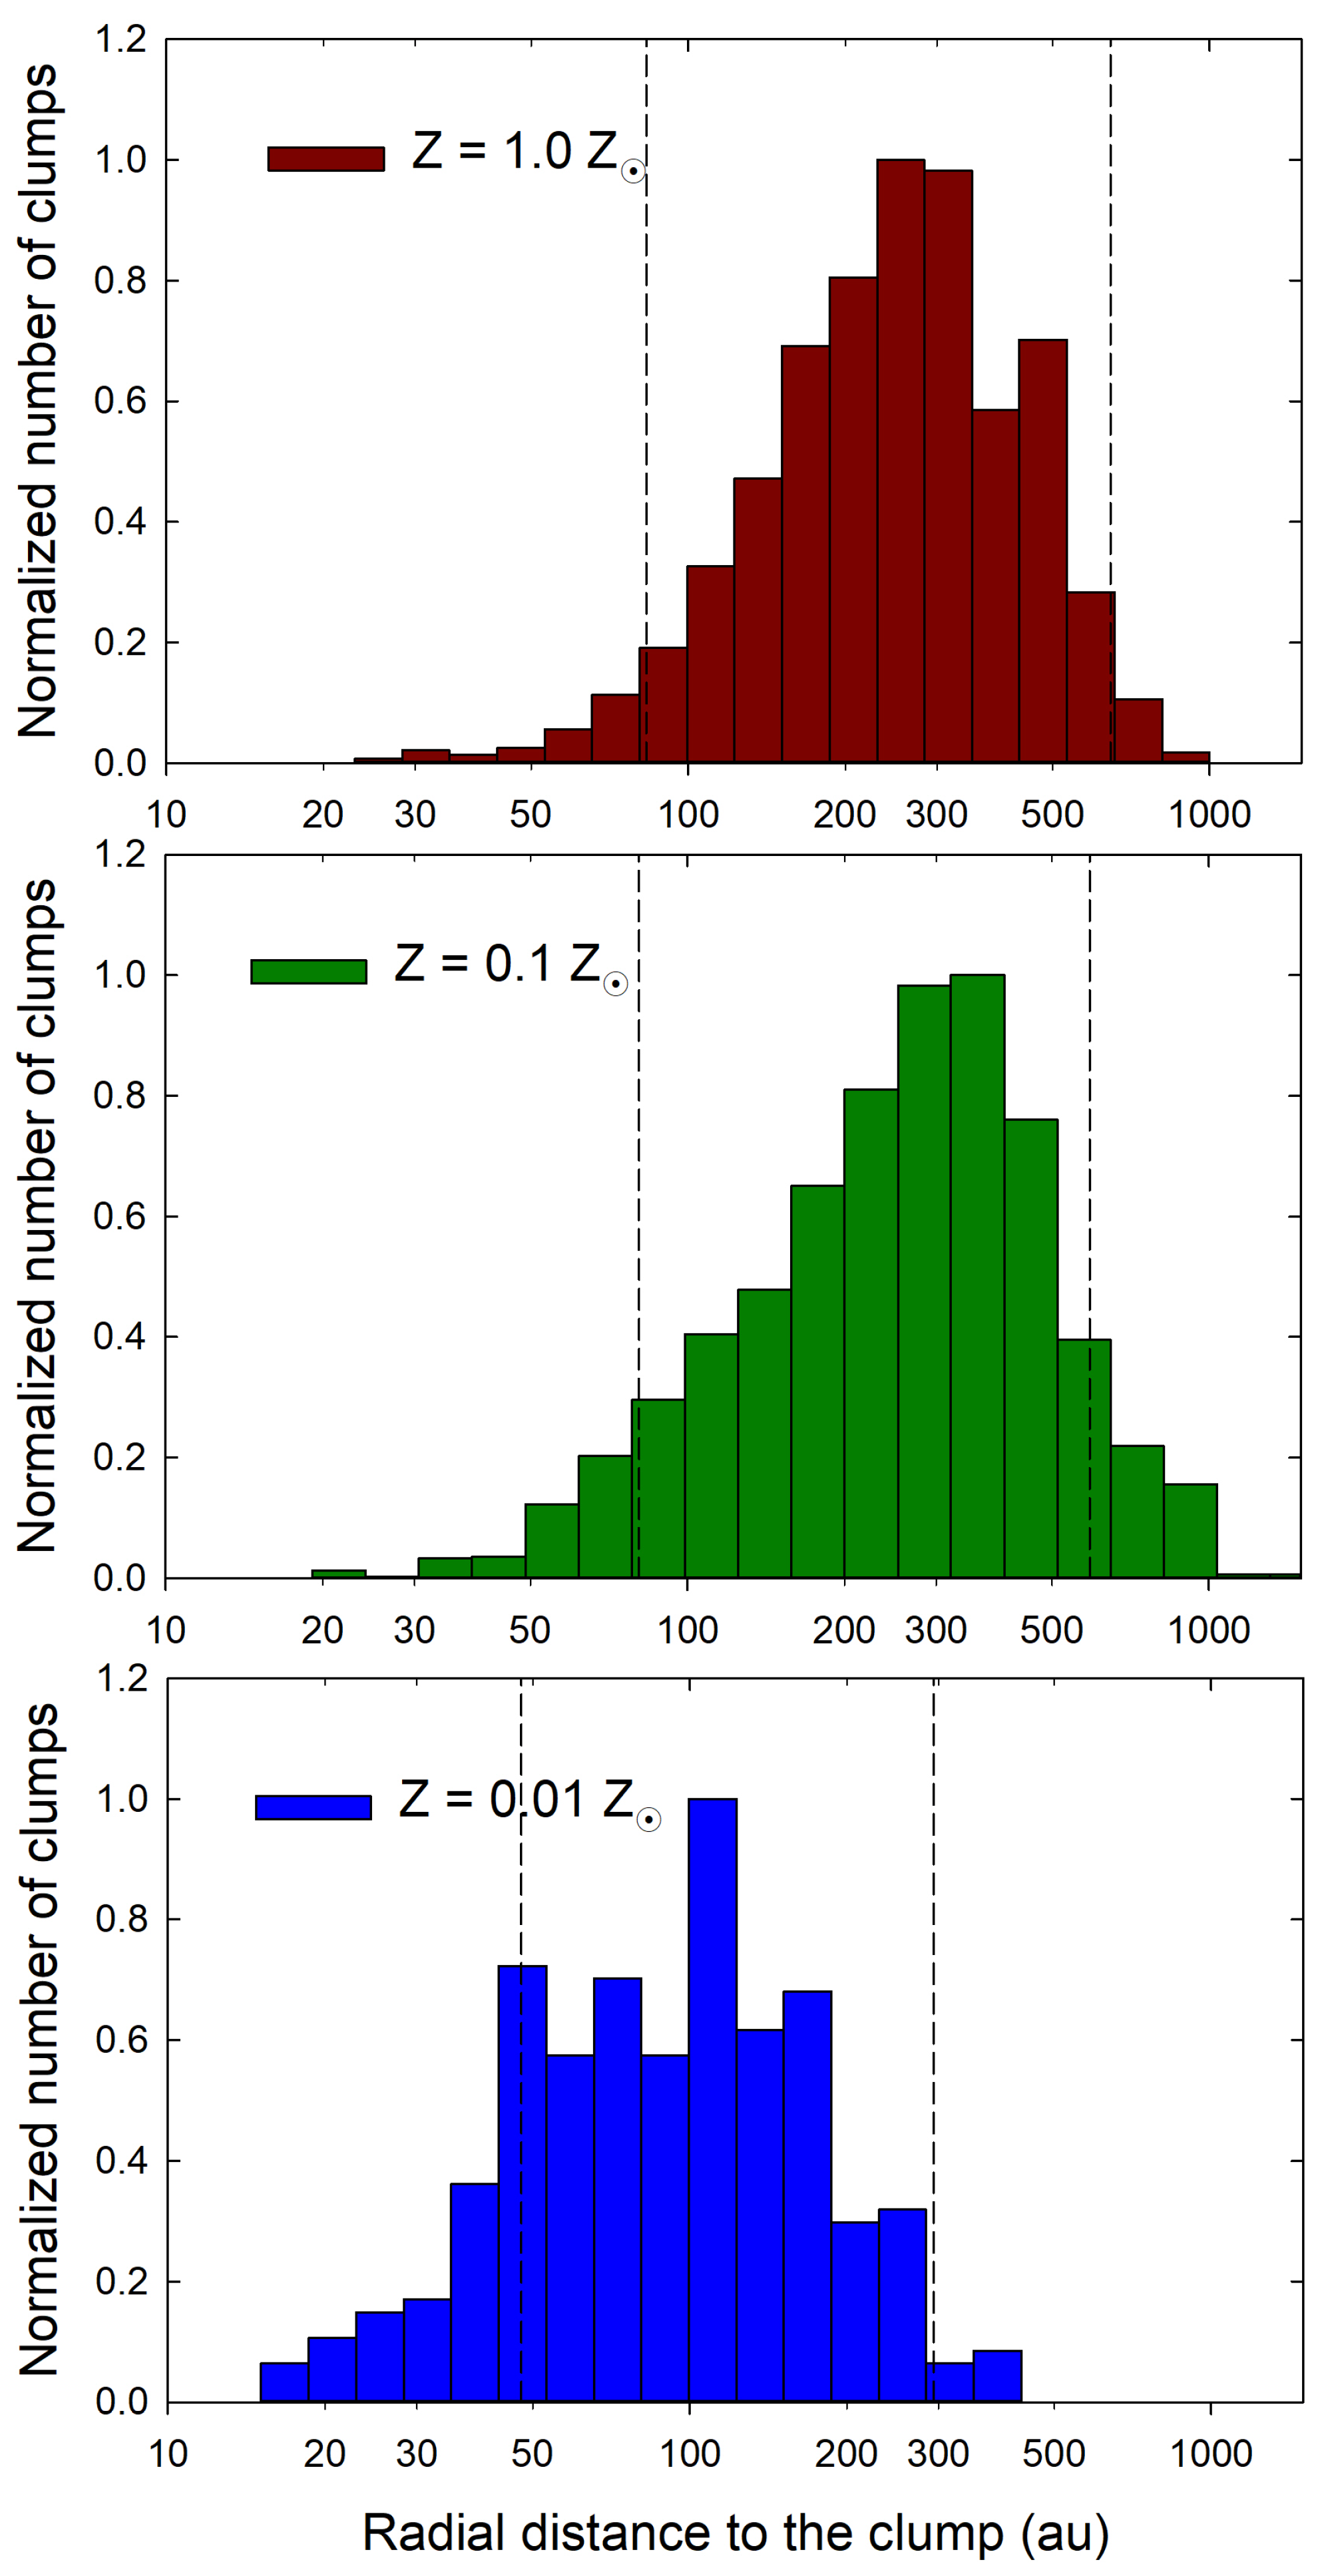
Distribution function of radial distances to the clumps in the disk. Panels from top to bottom correspond to Models Z1.0, Z0.1, and Z0.01. Twenty logarithmically spaced bins between 15 au and 1000 au were used to build the distribution functions. The vertical dashed lines confine the minimum and maximum disk sizes for each model.
3.3. Radial Distance to the Clumps
The radial distance to the clumps in the disk is presented in Figure 5 in the form of a normalized distribution function. The normalization in each model is completed so that the peak of the distribution function is equal to unity. The distribution of clumps over distance is rather similar in Models Z1.0 and Z0.1. Most clumps are located in a radial annulus 200–400 au, with a steep decline on the right-hand side from the peak and a shallower slope on the left-hand side. Some clumps are found up to a distance of 1000 au, and these large distances are likely caused by clump–clump gravitational scattering and ejection [53]. This conjecture is supported by comparing the position of these clumps with the maximum extent of the disk during the fragmentation phase, shown by the vertical dashed lines in Figure 5. For Models Z1.0 and Z0.1, the maximum disk radii are 645 au and 590 au, respectively. The scarcity of clumps at distances au is interesting and may be caused by fast inward migration at these distances, followed by tidal destruction and accretion onto the star. These events manifest themselves in numerical hydrodynamic simulations as accretion and luminosity outbursts [30], which are similar in characteristics to FU Orionis-type eruptions [54]. On the other hand, numerical simulations of a solar metallicity disk with higher numerical resolution () revealed that tidal downsizing of inward-migrating clumps [55] can halt their migration at a few tens of astronomical units, followed by the formation of protogiant planets at distances typical for the H8799 system [56]. Therefore, the number of clumps at tens of astronomical units may be underestimated in our moderate-resolution simulations. The distribution function of the clump’s radial positions in the disk in Model Z0.01 is notably shifted towards smaller values. This is a consequence of a more compact disk in this lowest metallicity model as can be already seen in Figure 2, and also explicitly demonstrated by the dashed vertical lines showing the minimum and maximum disk radii during the fragmentation phase. A smaller number of clumps present at a time in the disk makes clump–clump scattering less effective, although the effect is not completely suppressed, as indicated by a few outliers detected outside the disk’s maximum extent of 295 au. The spatial distribution of clumps in all three models is overall similar, only scaled to the disk size. According to Jin et al. [15], gravitational fragmentation in a solar metallicity disk is expected to occur at 20–200 au with the highest probability, at 200–450 au with lower probability, and with lowest probability beyond this distance range. The locations of the clumps in Model Z1.0 are in general agreement with these predictions, considering that clump–clump gravitational scattering can push the bounds to larger distances.
3.4. Probability Density Distributions of Energies
To visualize how the energies are distributed within the clumps, the probability density distribution of thermal, gravitational, and rotational energy is determined for each metallicity case and using all clump realizations shown in Figure 4. This allows us to analyze the extent of each energy’s influence on the clump evolution and their input to a clump’s energy balance. The y-axis is normalized so that the integrated area of each energy histogram is equal to 1.0. For a better comparison, the x-axes are scaled identically for each figure.
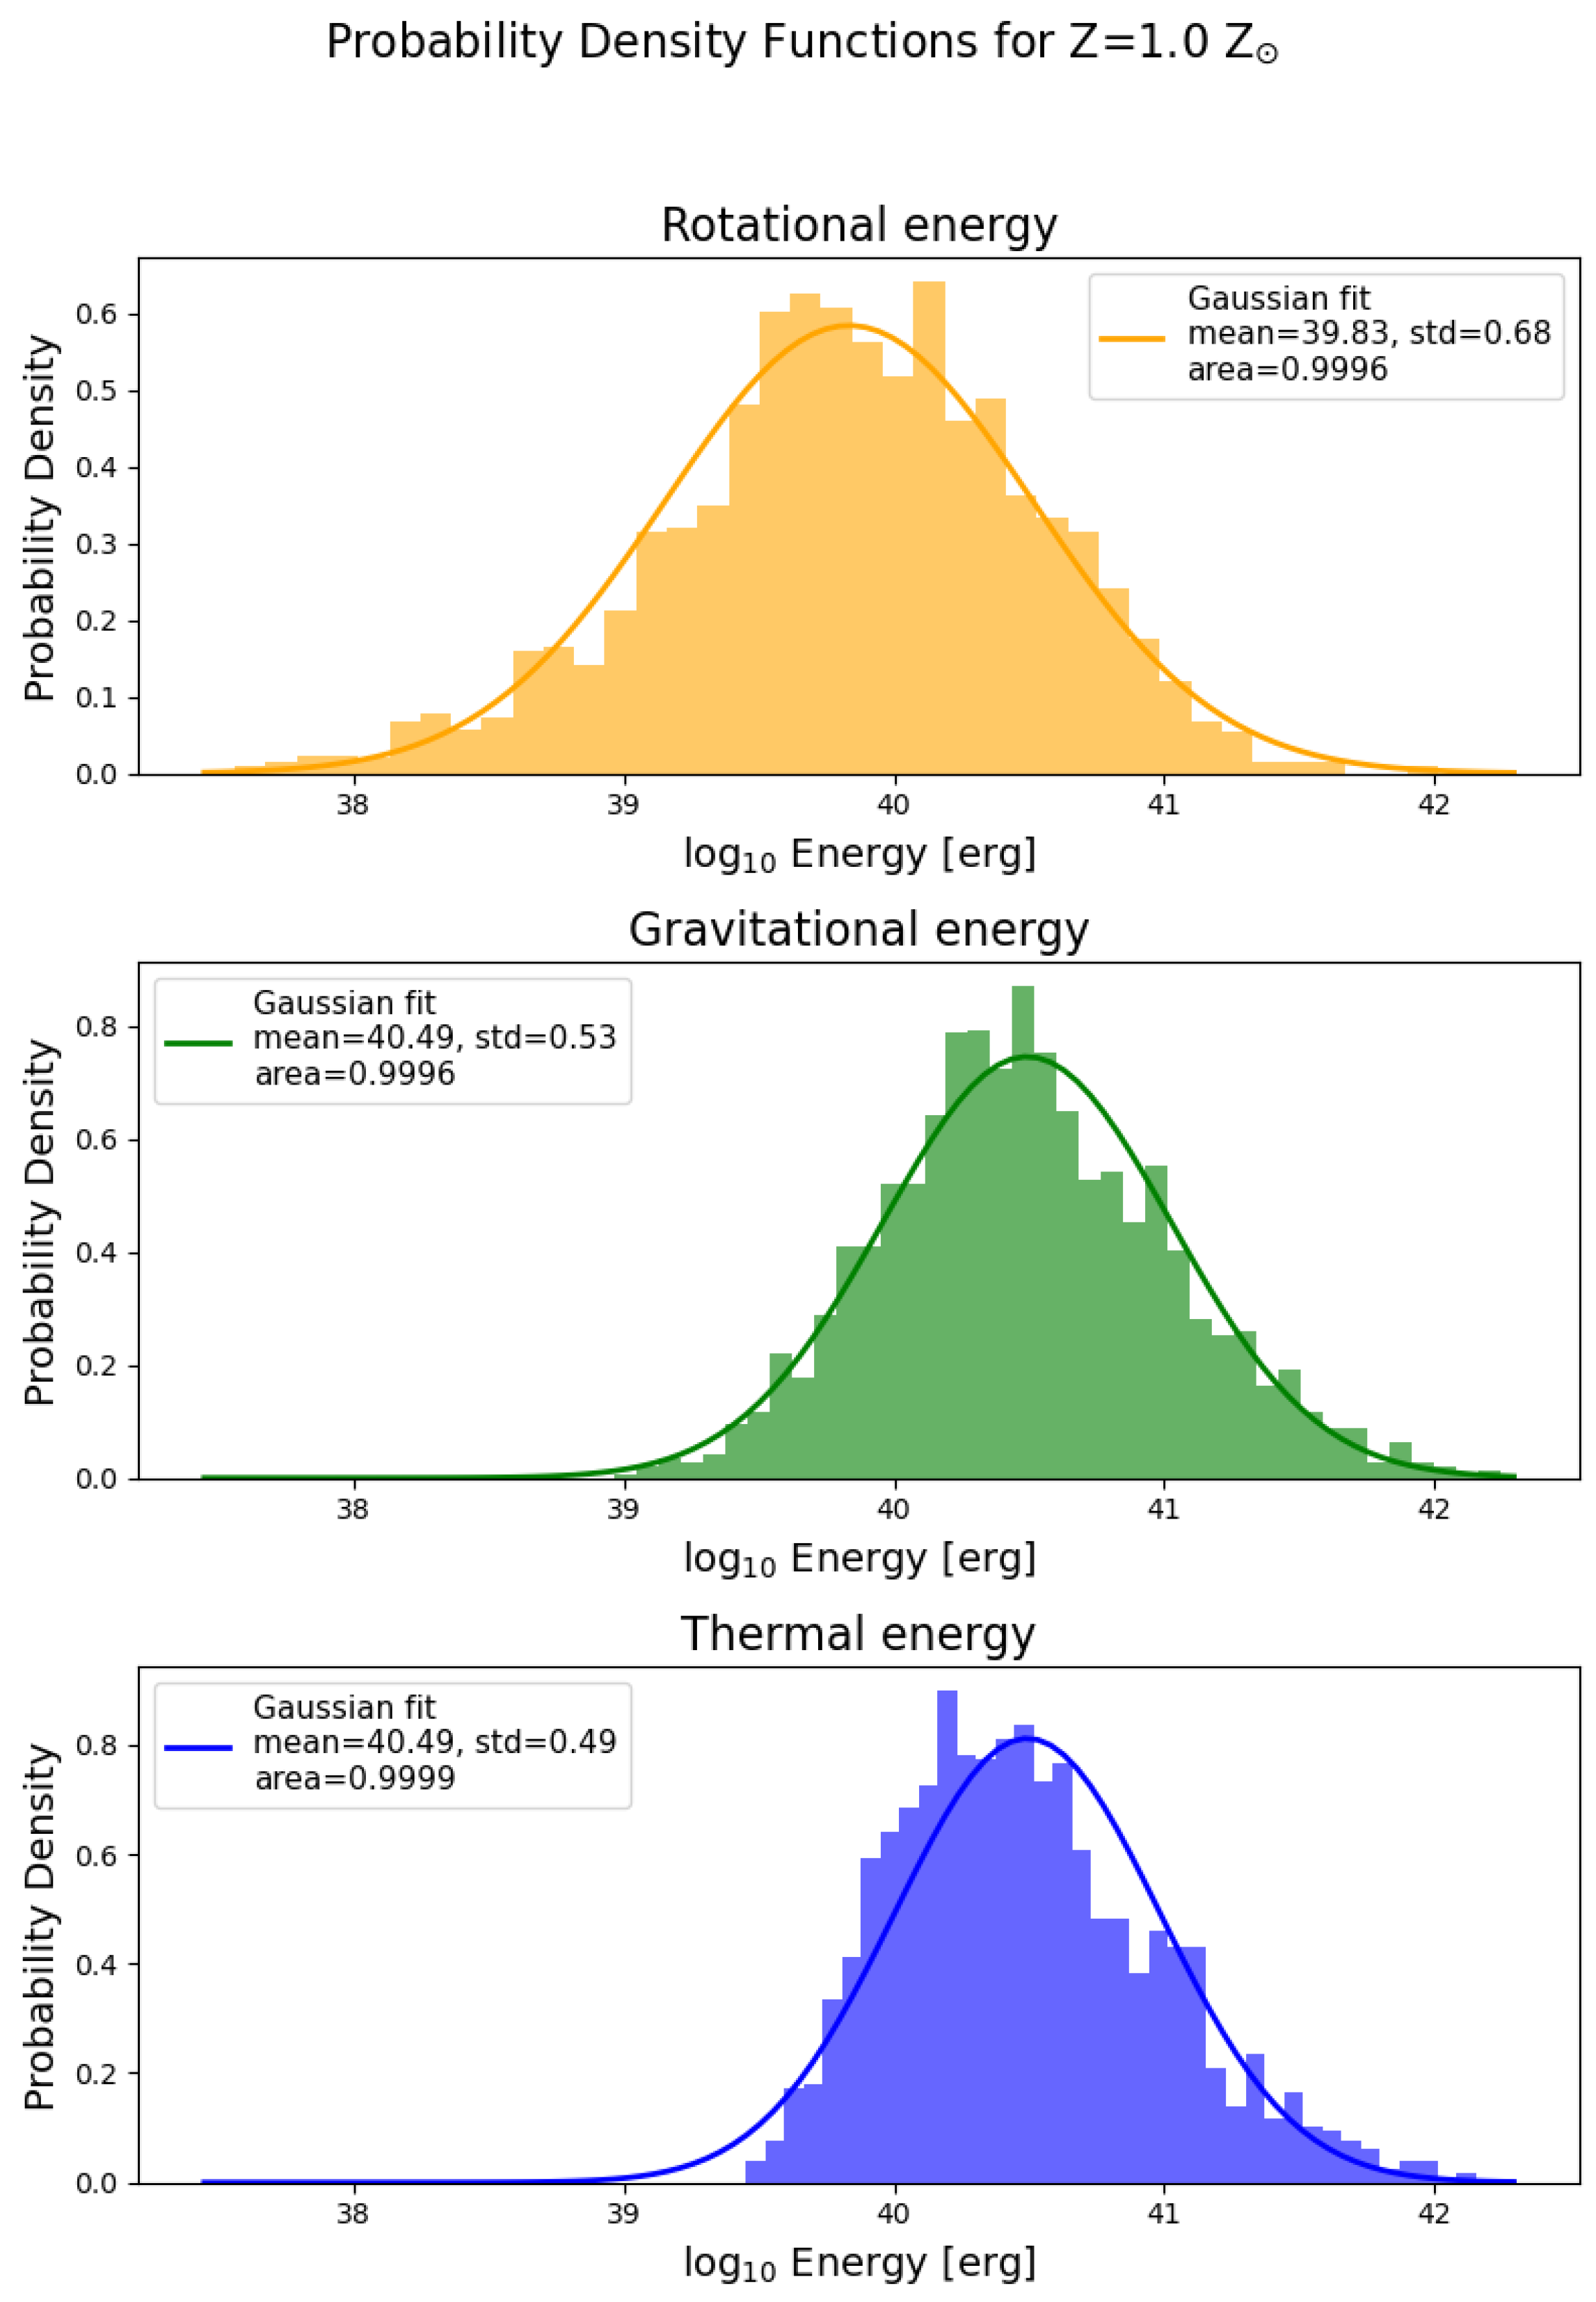
Figure 6 presents the solar metallicity case. It shows that the peaks of the gravitational and thermal energy distributions are at higher values than the rotational energy peak, which is below 1040 erg. The rotational energy distribution, in general, seems to be more shifted towards lower energy values and to cover a wider energy interval in regard to the others. All this would indicate that rotational energy plays a less dominant role in a clump’s energetics than gravitational and thermal energy, meaning that the clumps are supported against their self-gravity by pressure rather than rotation. The three energy distributions were individually fitted with a Gaussian, which are shown in Figure 7. The mean values of the fits again show the shifted position of the rotational energy distribution to systematically lower values. The difference in the mean values, ≈0.7 dex, implies that the input of the rotational energy to support against gravity is, on average, about 20% that of pressure gradients.
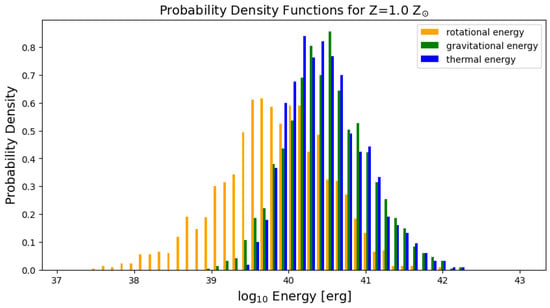
Figure 6.
Probability density function in Model Z1.0. The x-axis is logarithmic and the y-scale is normalized so that the area under each histogram is unity. The rotational energy distribution seems to be shifted to lower energy values than rotational and gravitational energy, making the last two more likely to dominate the clump internal evolution.
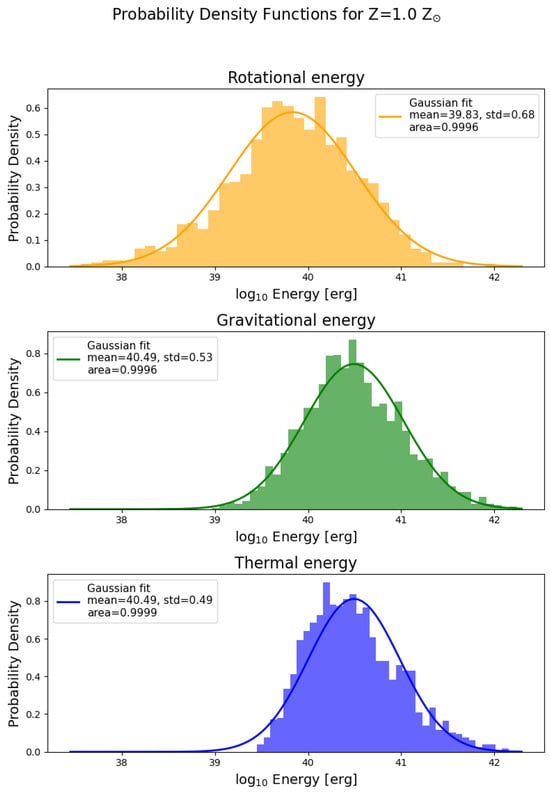
Figure 7.
Gaussian fit to each of the probability density functions in Figure 6. The distribution of rotational energy covers a wider range but is shifted to lower values. Also, the distribution’s mean is shifted towards the lower energies. The Gaussian fits to the gravitational and thermal energies indicate their similar input.
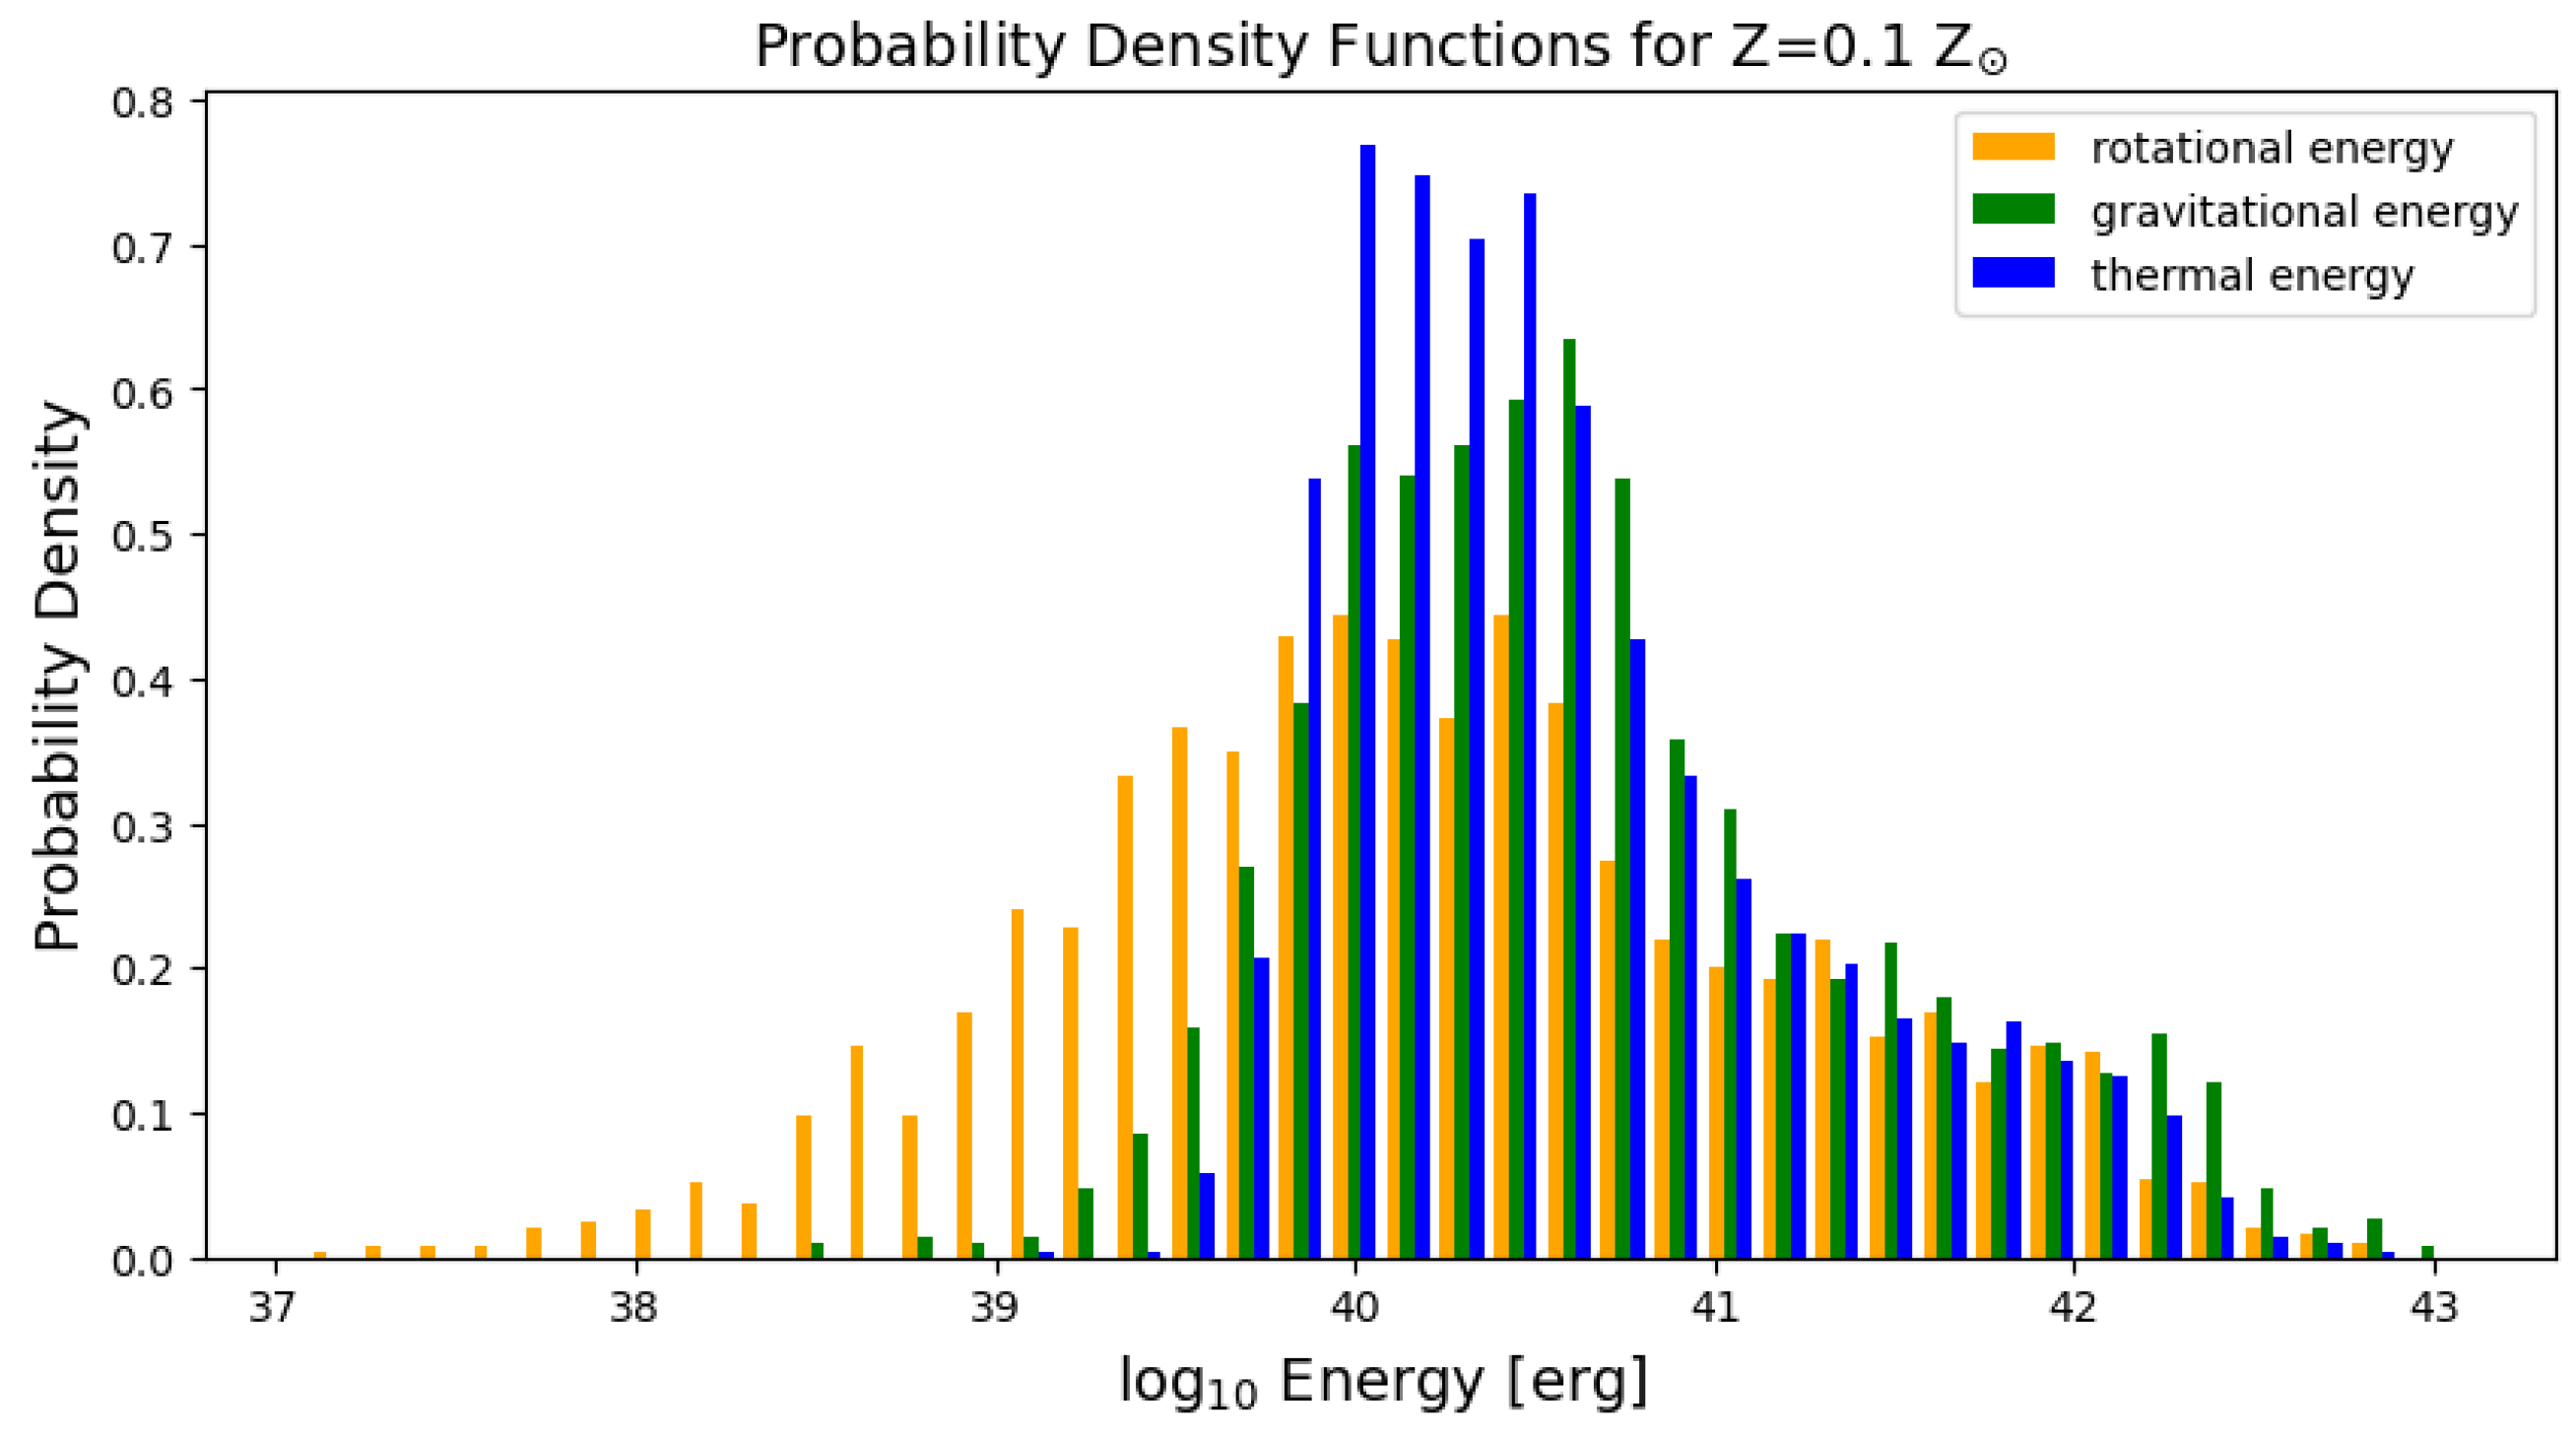
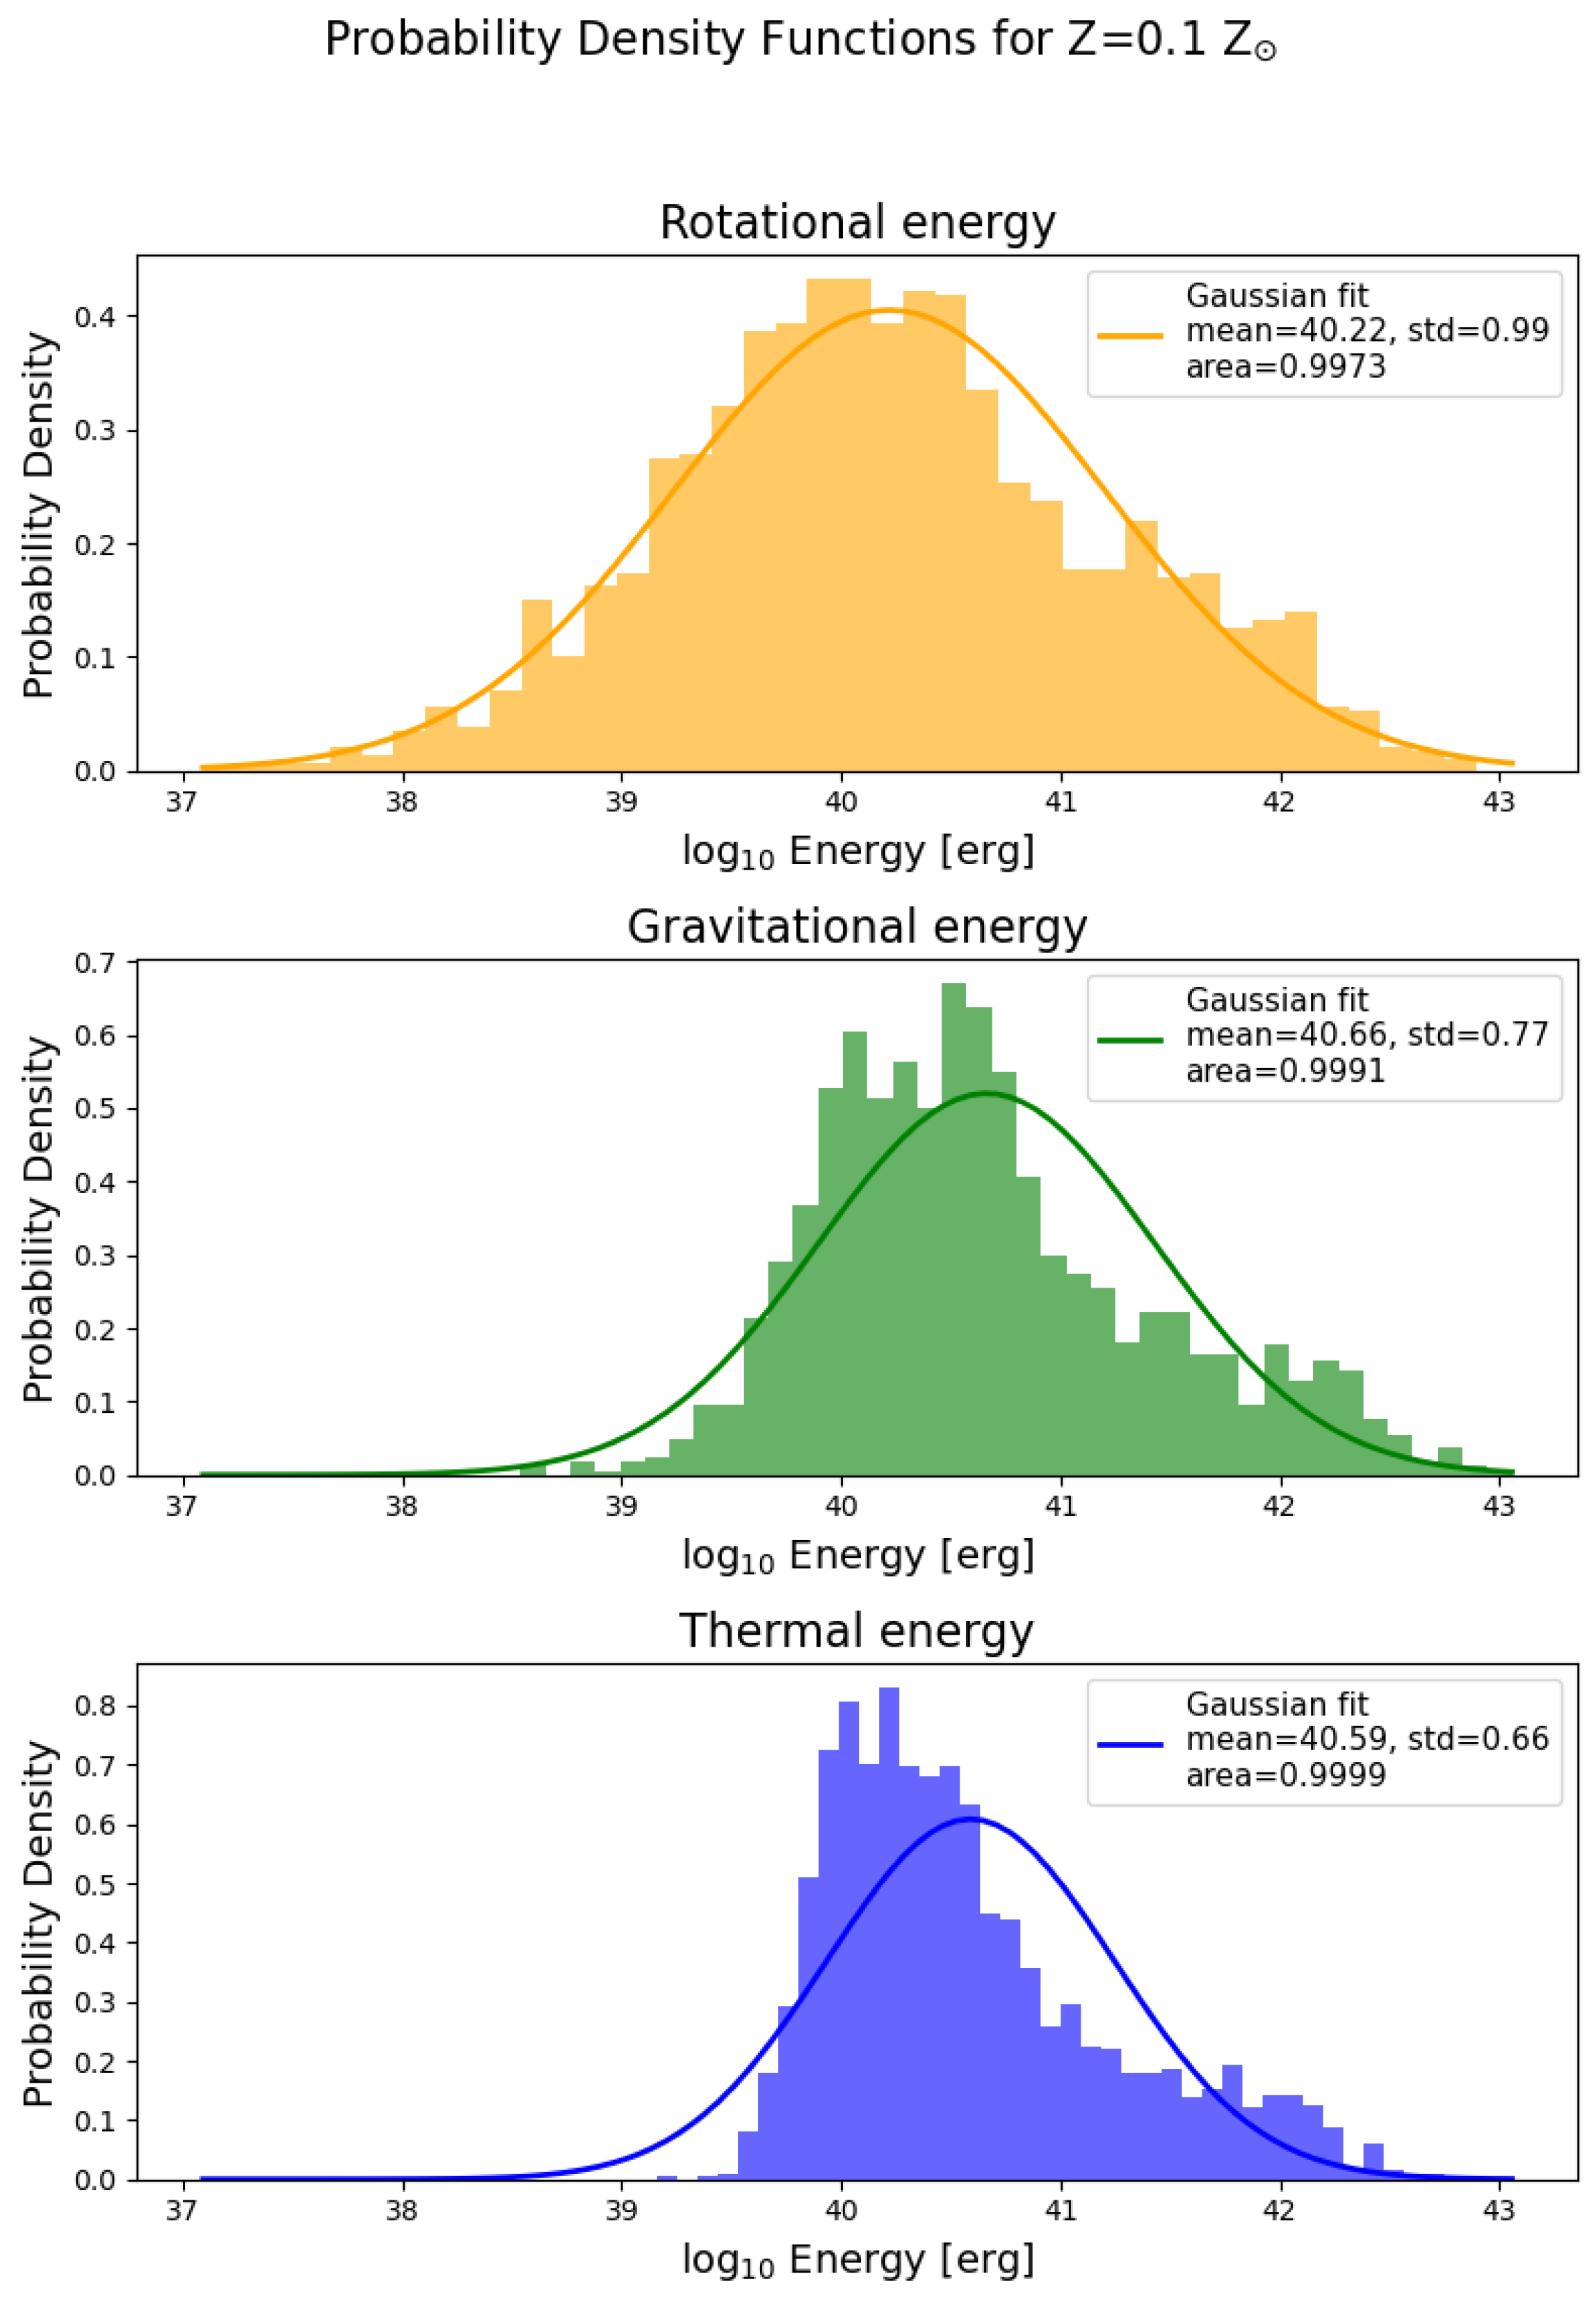
The probability density function for Model Z0.1 is given in Figure 8. The distribution of rotational energies is much broader than it was in the previous case of the solar metallicity, causing a decrease in the maximum probability density at the peak. The shifts between the corresponding energy distributions are much less pronounced. The mean values of the Gaussian fits shown in Figure 9 still indicate a small shift of the rotational energy to lower values. The gravitational energy now seems to slightly dominate the rotational one. This could indicate a higher relevance of the rotational energy in this metallicity regime. The Gaussian fit of the rotational energy describes the function very well, although the fits deviate from the distributions of gravitational and thermal energy. It seems as if the affected distributions could be well described by a positively skewed curve, which would indicate the influence of some processes acting on the clumps in the disk. In particular, the distribution of gravitational energy is skewed towards higher values, which may be explained by efficient clump destruction by tidal forces below a certain threshold value for . The reason why the thermal energy is sharply truncated below requires further investigation.
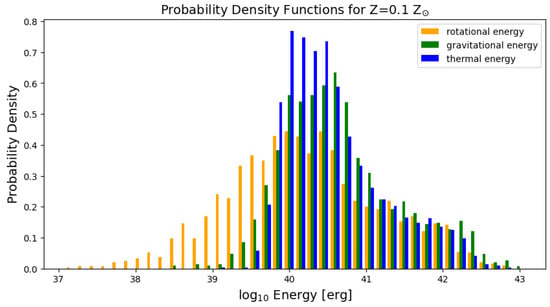
Figure 8.
Same as Figure 6 but for Z = 0.1 Z⊙. The previous shift of the rotational energy distribution is not there, but it still dominates at lower energy values.

Figure 9.
Same as Figure 7 but for Z = 0.1 Z⊙. The Gaussian fits for the gravitational and thermal energies deviate from their distributions. This effect needs further investigation.
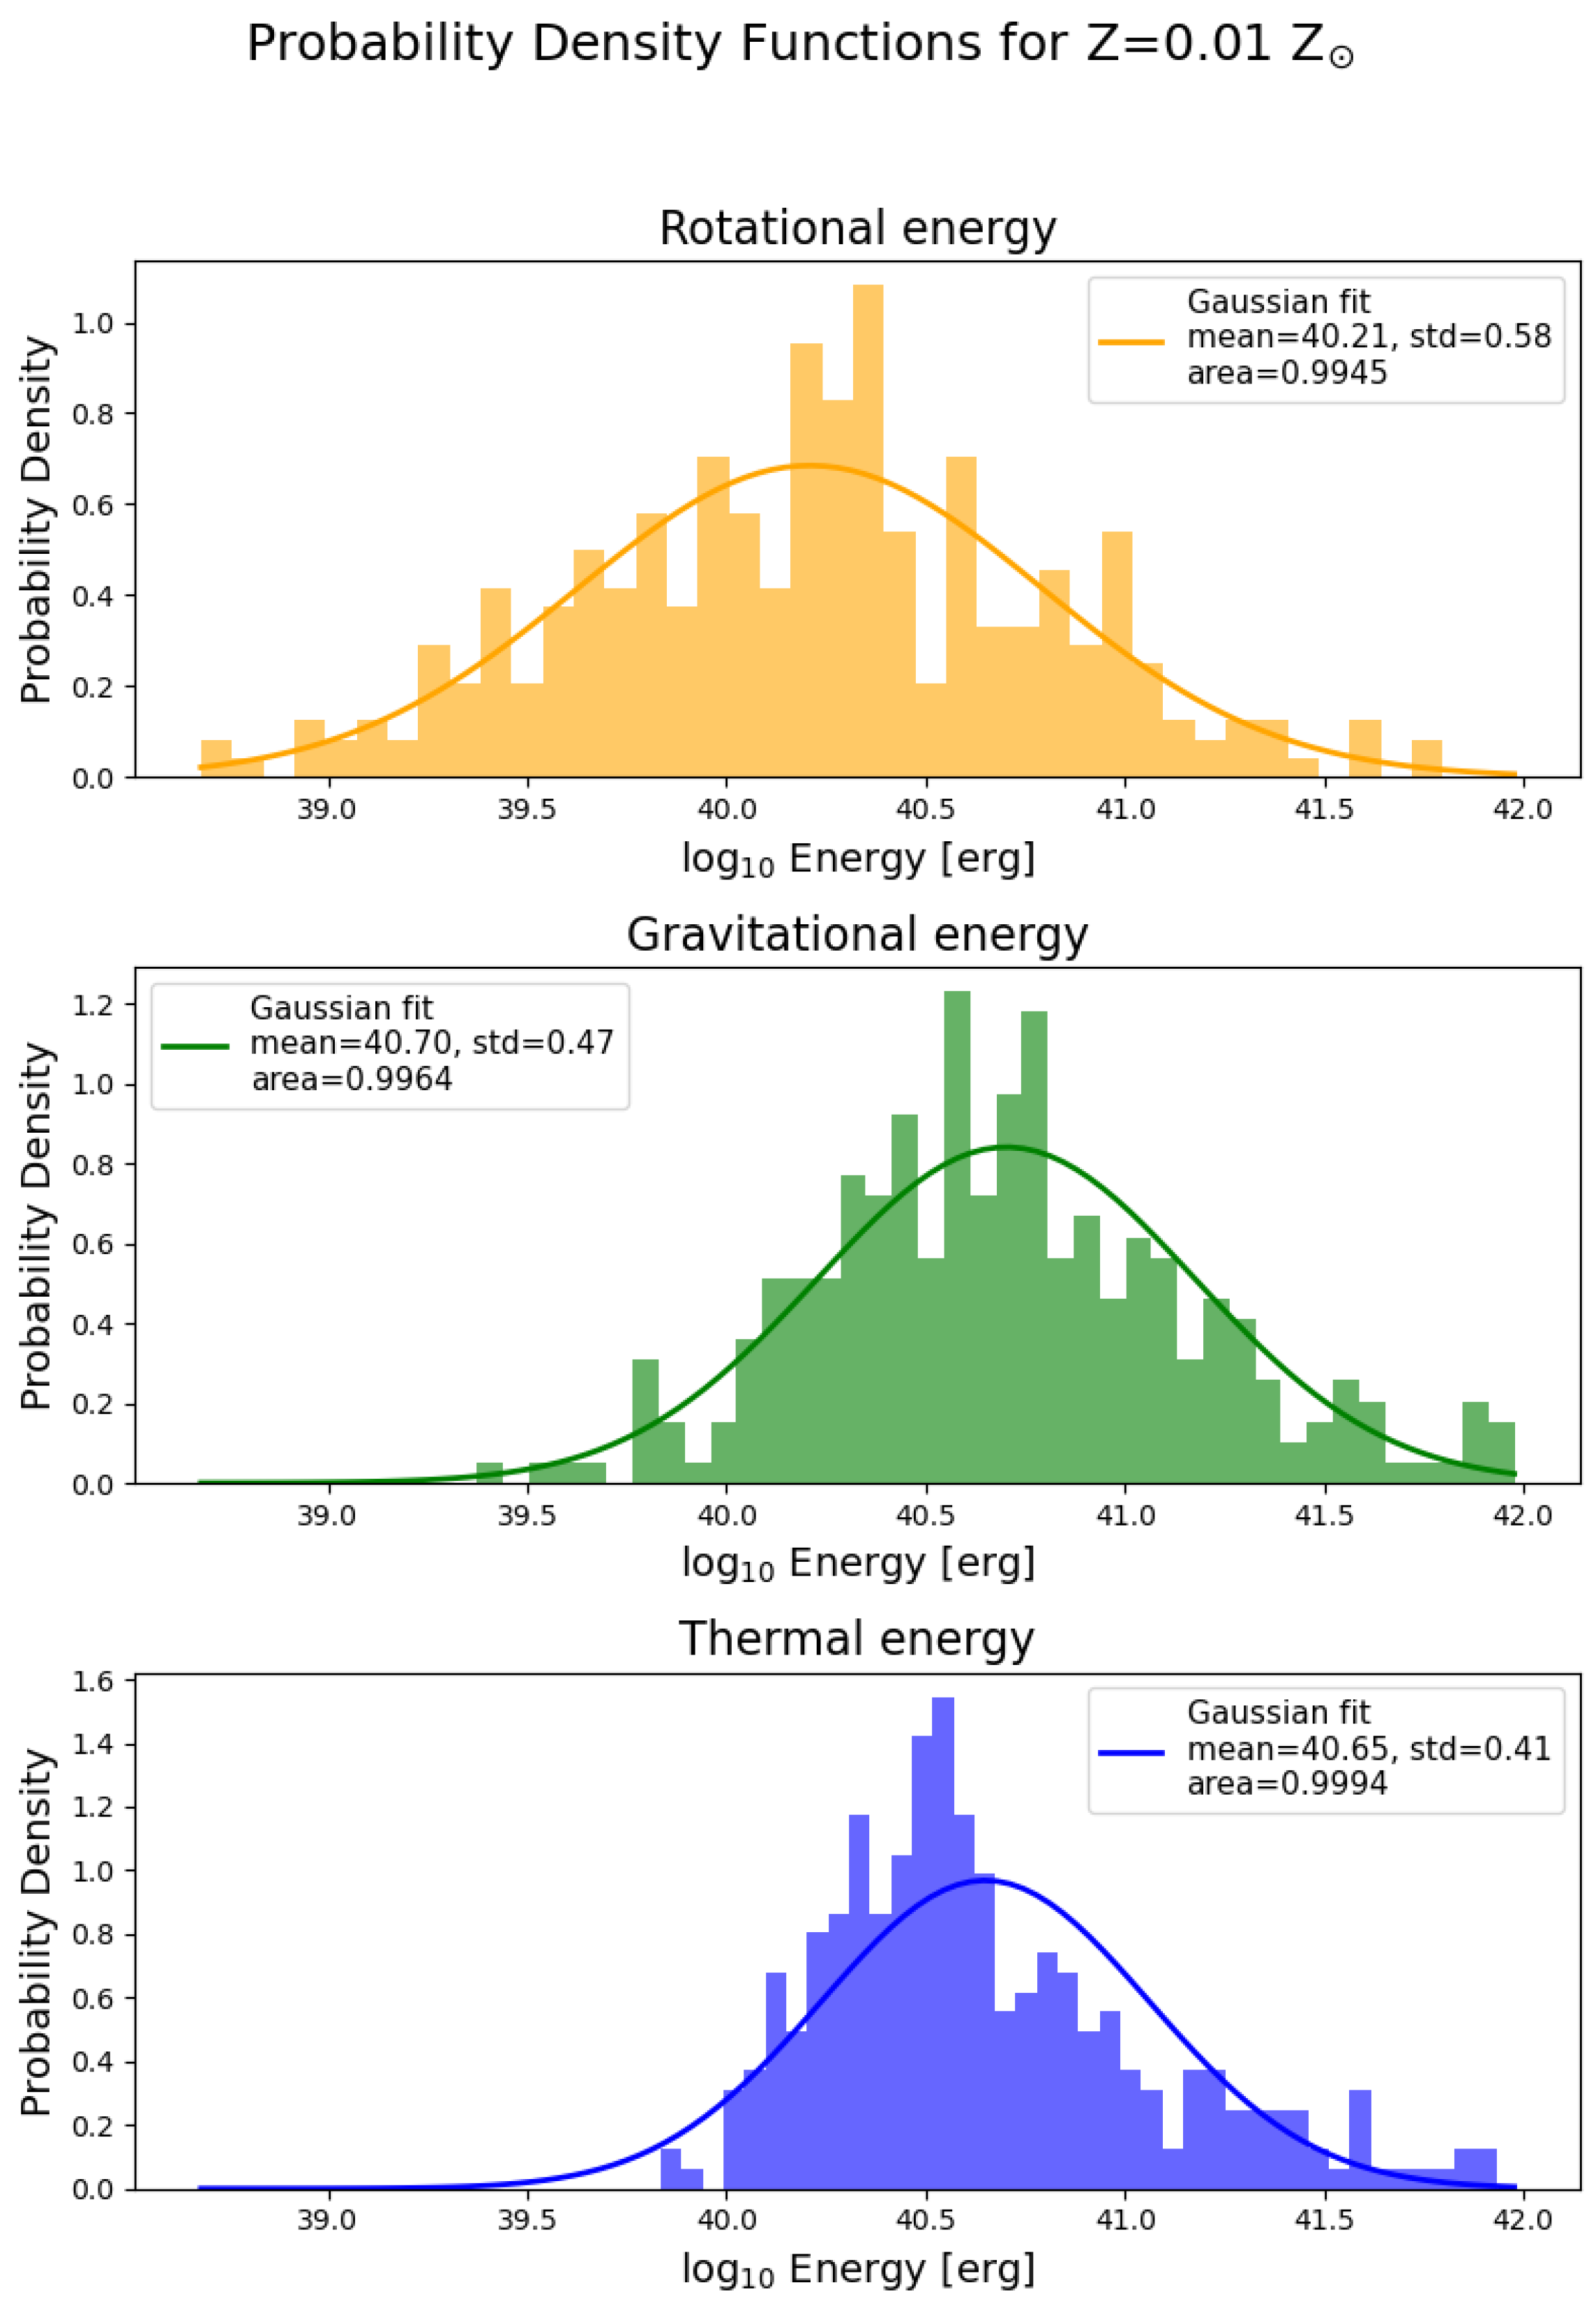
In the case of Z = 0.01 Z⊙, seen in Figure 10, the peaks of the three distributions are much higher compared to the previous metallicities. In turn, they cover a smaller range of energies. The thermal energy shows a peak exceeding a probability density value of 1, but as Figure 11 shows, the area still integrates to a 100% probability. This is because the y-axis only represents the probability density. The rotational energy still dominates the lowest energy values, while thermal and gravitational energy continue to dominate the highest ones. The resolution of the separate probability density histograms in Figure 11 is lower than for the previous metallicity cases. This is because in total, fewer clumps were able to form in the Z = 0.01 Z⊙ disk. The Gaussian of the thermal energy distribution seems to show a misalignment, similar in magnitude to two of the fits in the Z = 0.1 Z⊙ case. The gravitational energy dominates and is balanced by thermal energy and, to a lesser extent, by the rotational energy. The shift between the mean values of and is 0.49 dex, compared to 0.44 dex for Model Z0.1 and 0.7 dex for Model Z1.0. We conclude that the input of rotational energy to support against the gravity of the clump increases for sub-solar metallicity models.
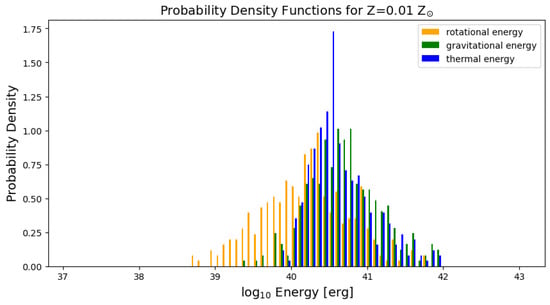
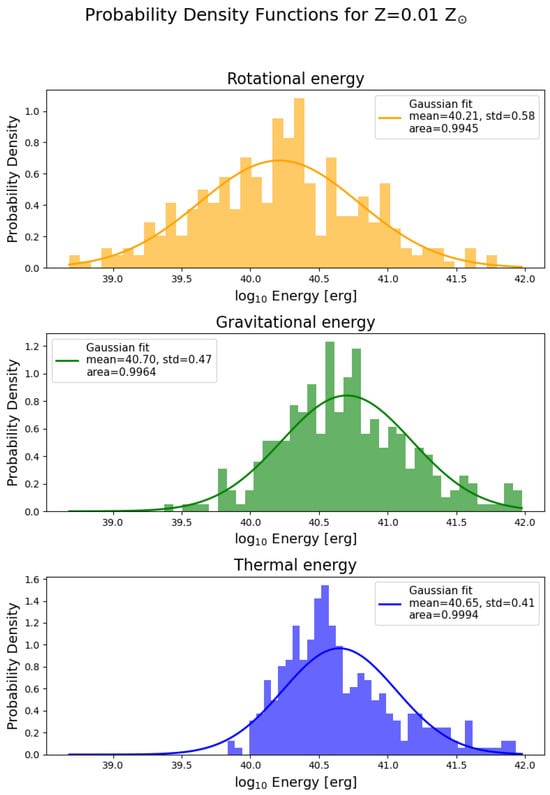
Figure 11.
Same as Figure 7 but for Z = 0.01 Z⊙. The Gaussian of the distribution of thermal energy again deviates from the data. Also, its area integrates to 1 despite its peak reaching a value of about 1.75. The overall lower resolution in this figure is due to the reduced amount of clumps in this model.
3.5. Ratios of the Energies
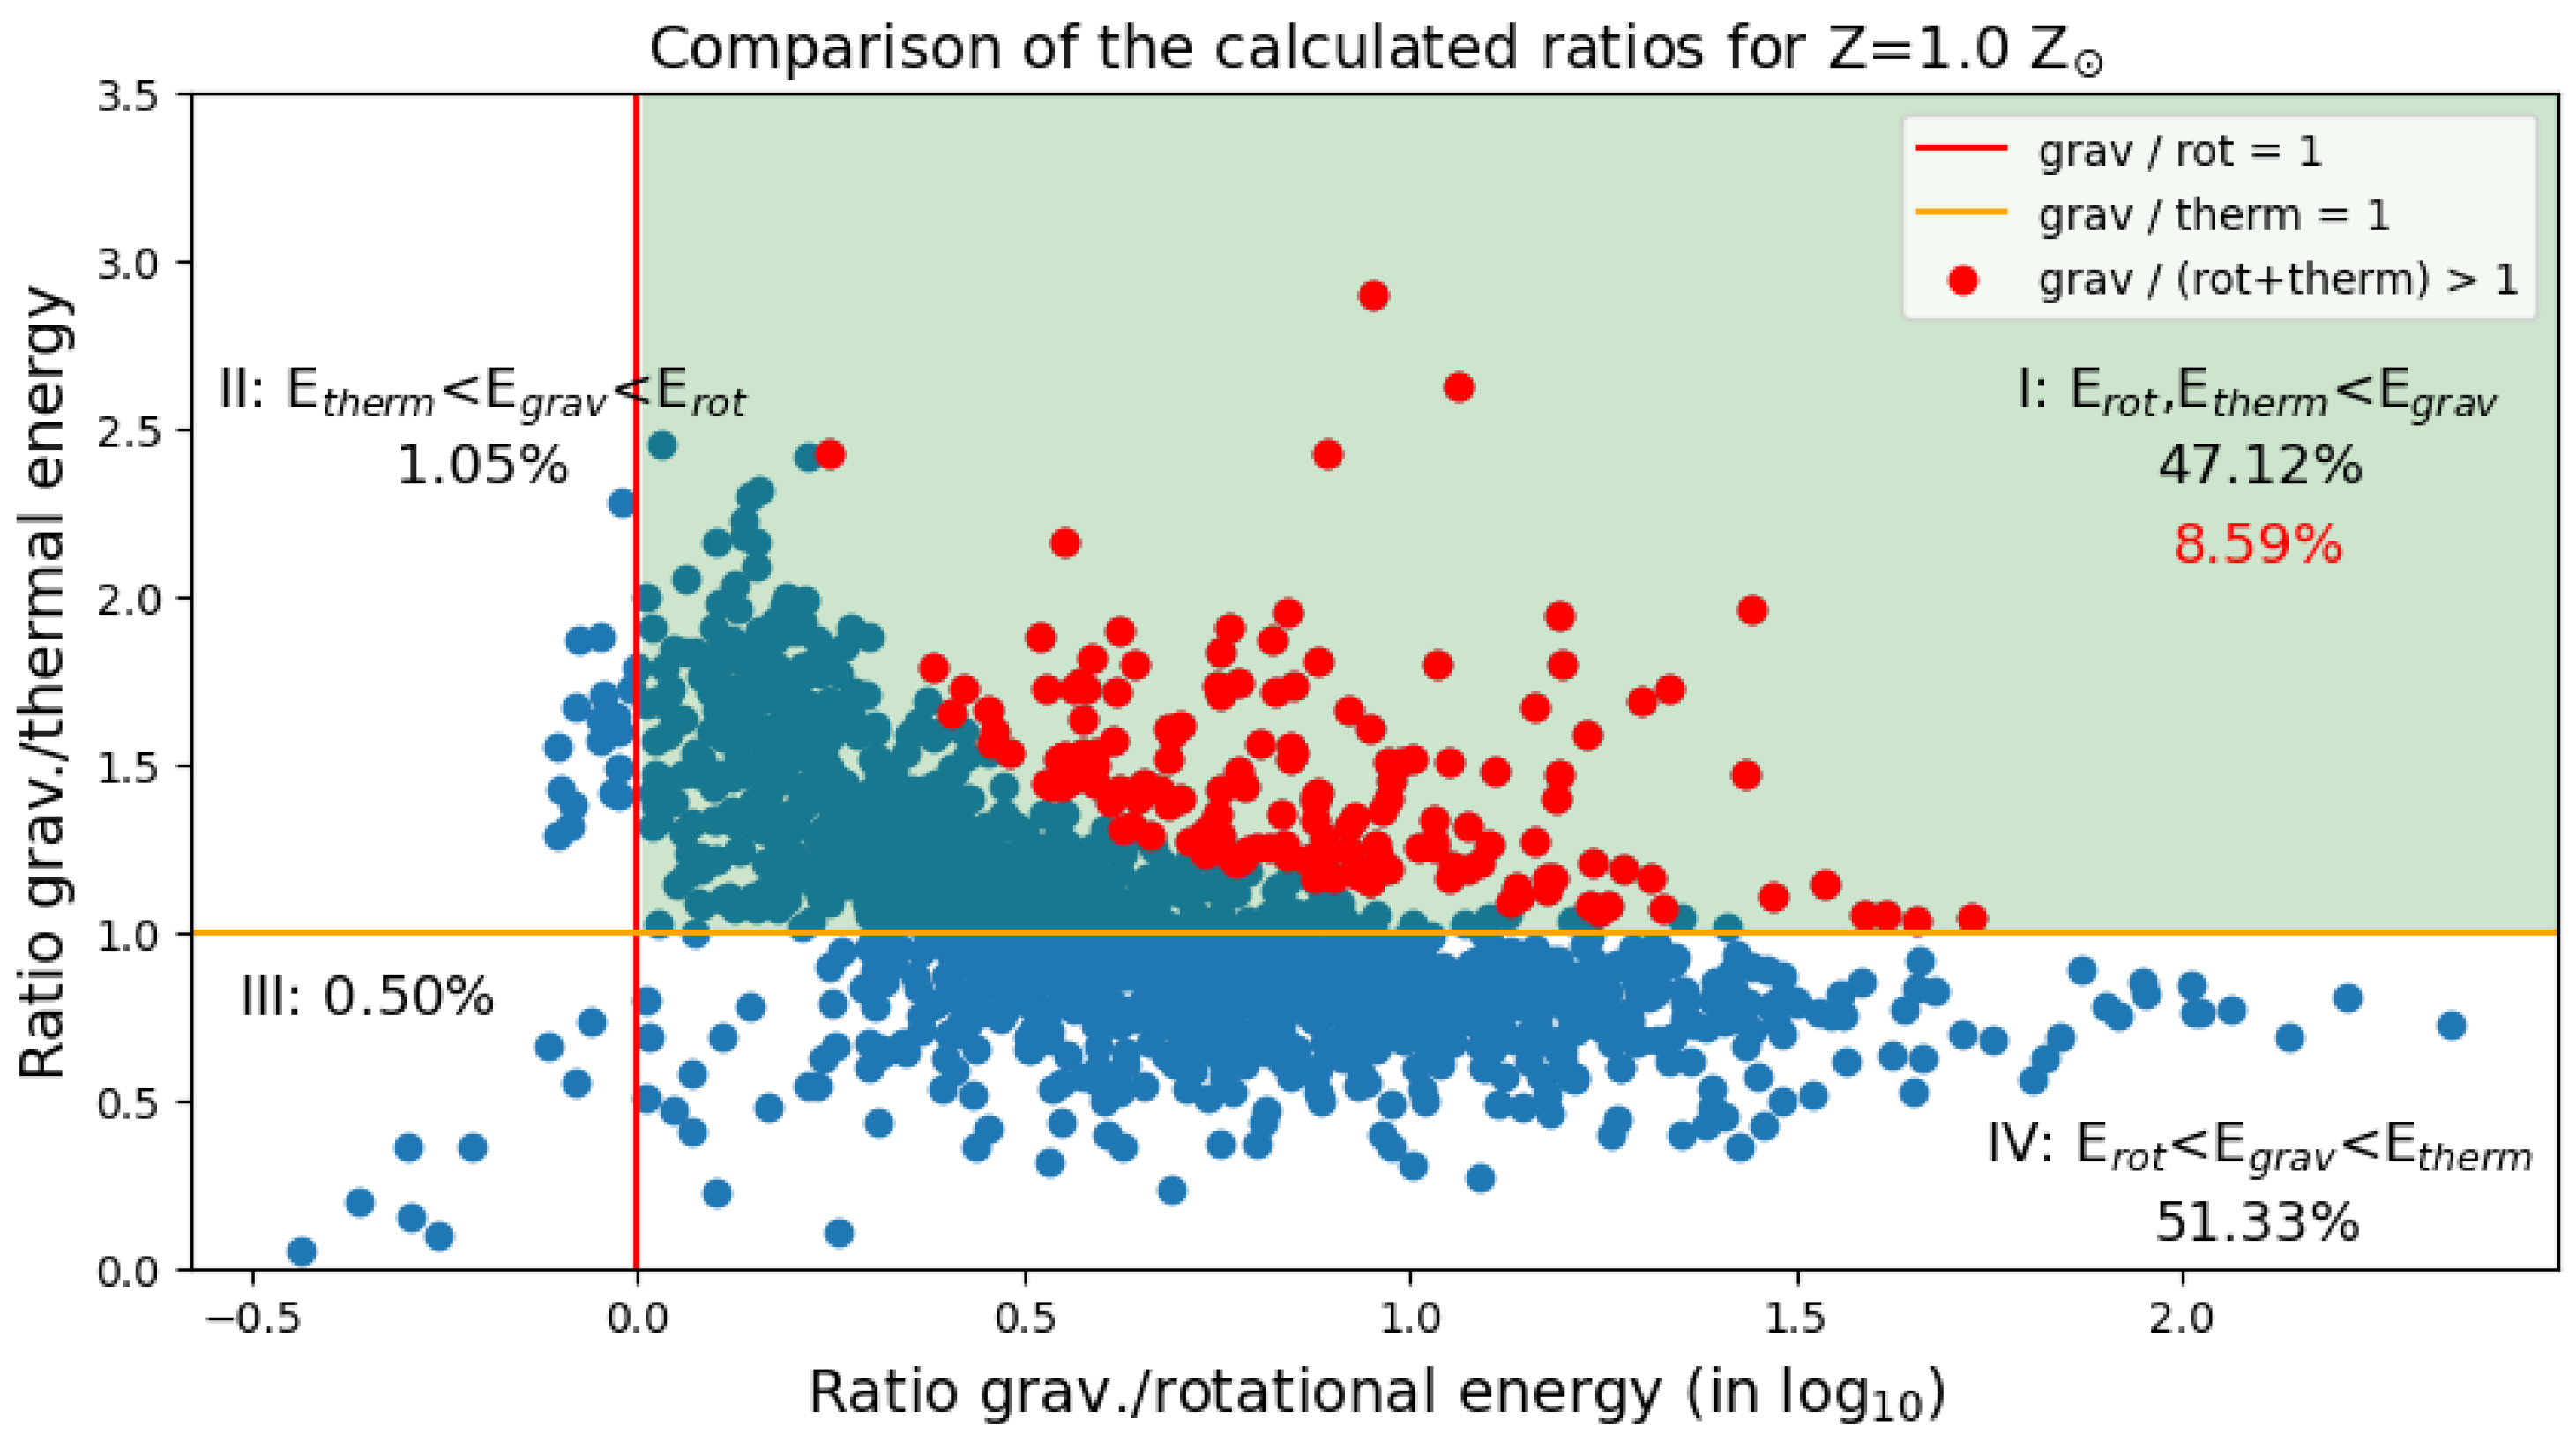
After analyzing the overall likelihood of certain energies to dominate, we analyze the actual energy distribution in the individual clumps. Since the goal is to determine how many clumps may survive the violent dynamics in a gravitationally unstable disk and eventually turn into planets or brown dwarfs, we calculate the percentage of clumps dominated by gravitational energy. This is done by building the ratios between energies. These calculations were done for each clump realization in each model. In the following, these clump realizations will simply be referred to as clumps for simplicity. Also, the terms gravitationally dominated and gravitationally bound are differentiated. The latter means that a clump’s gravitational energy is larger than rotational and thermal energy together, while the first only means that it has the largest value in comparison. The ratios of gravitational-to-rotational energy and gravitational-to-thermal energy are plotted against each other for each model disk in Figure 12, Figure 13 and Figure 14. To visualize the percentage of clumps dominated by either energy, the figures are divided into four areas by indicating the ratios of 1.0. The case where gravitational energy dominates is marked in green. The sectors are also labeled to increase comprehensibility.
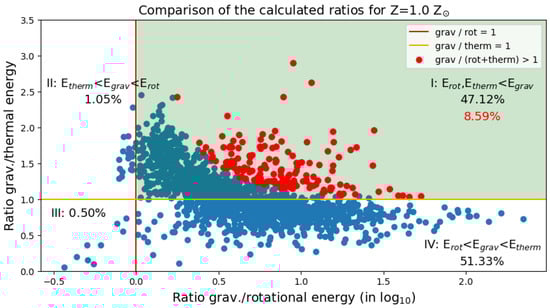
Figure 12.
Comparison of energy ratios for the solar metallicity case. The x-axis is logarithmic. Each sector is labeled, and the percentage of clumps in each quartile is given. The gravitationally bound clumps are red. The model produced a total of 850 clumps.
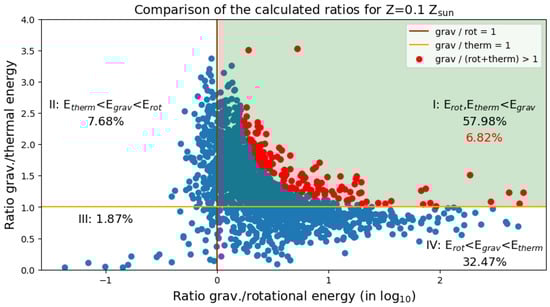
Figure 13.
Same as Figure 12 but for Z = 0.1 Z⊙. The model produced a total of 1148 clumps.
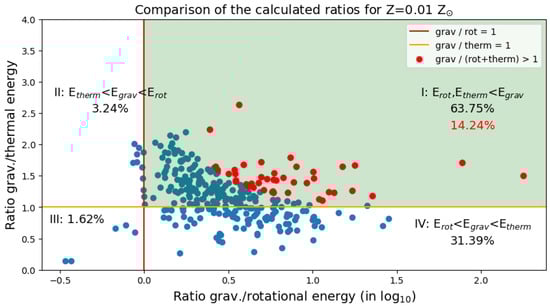
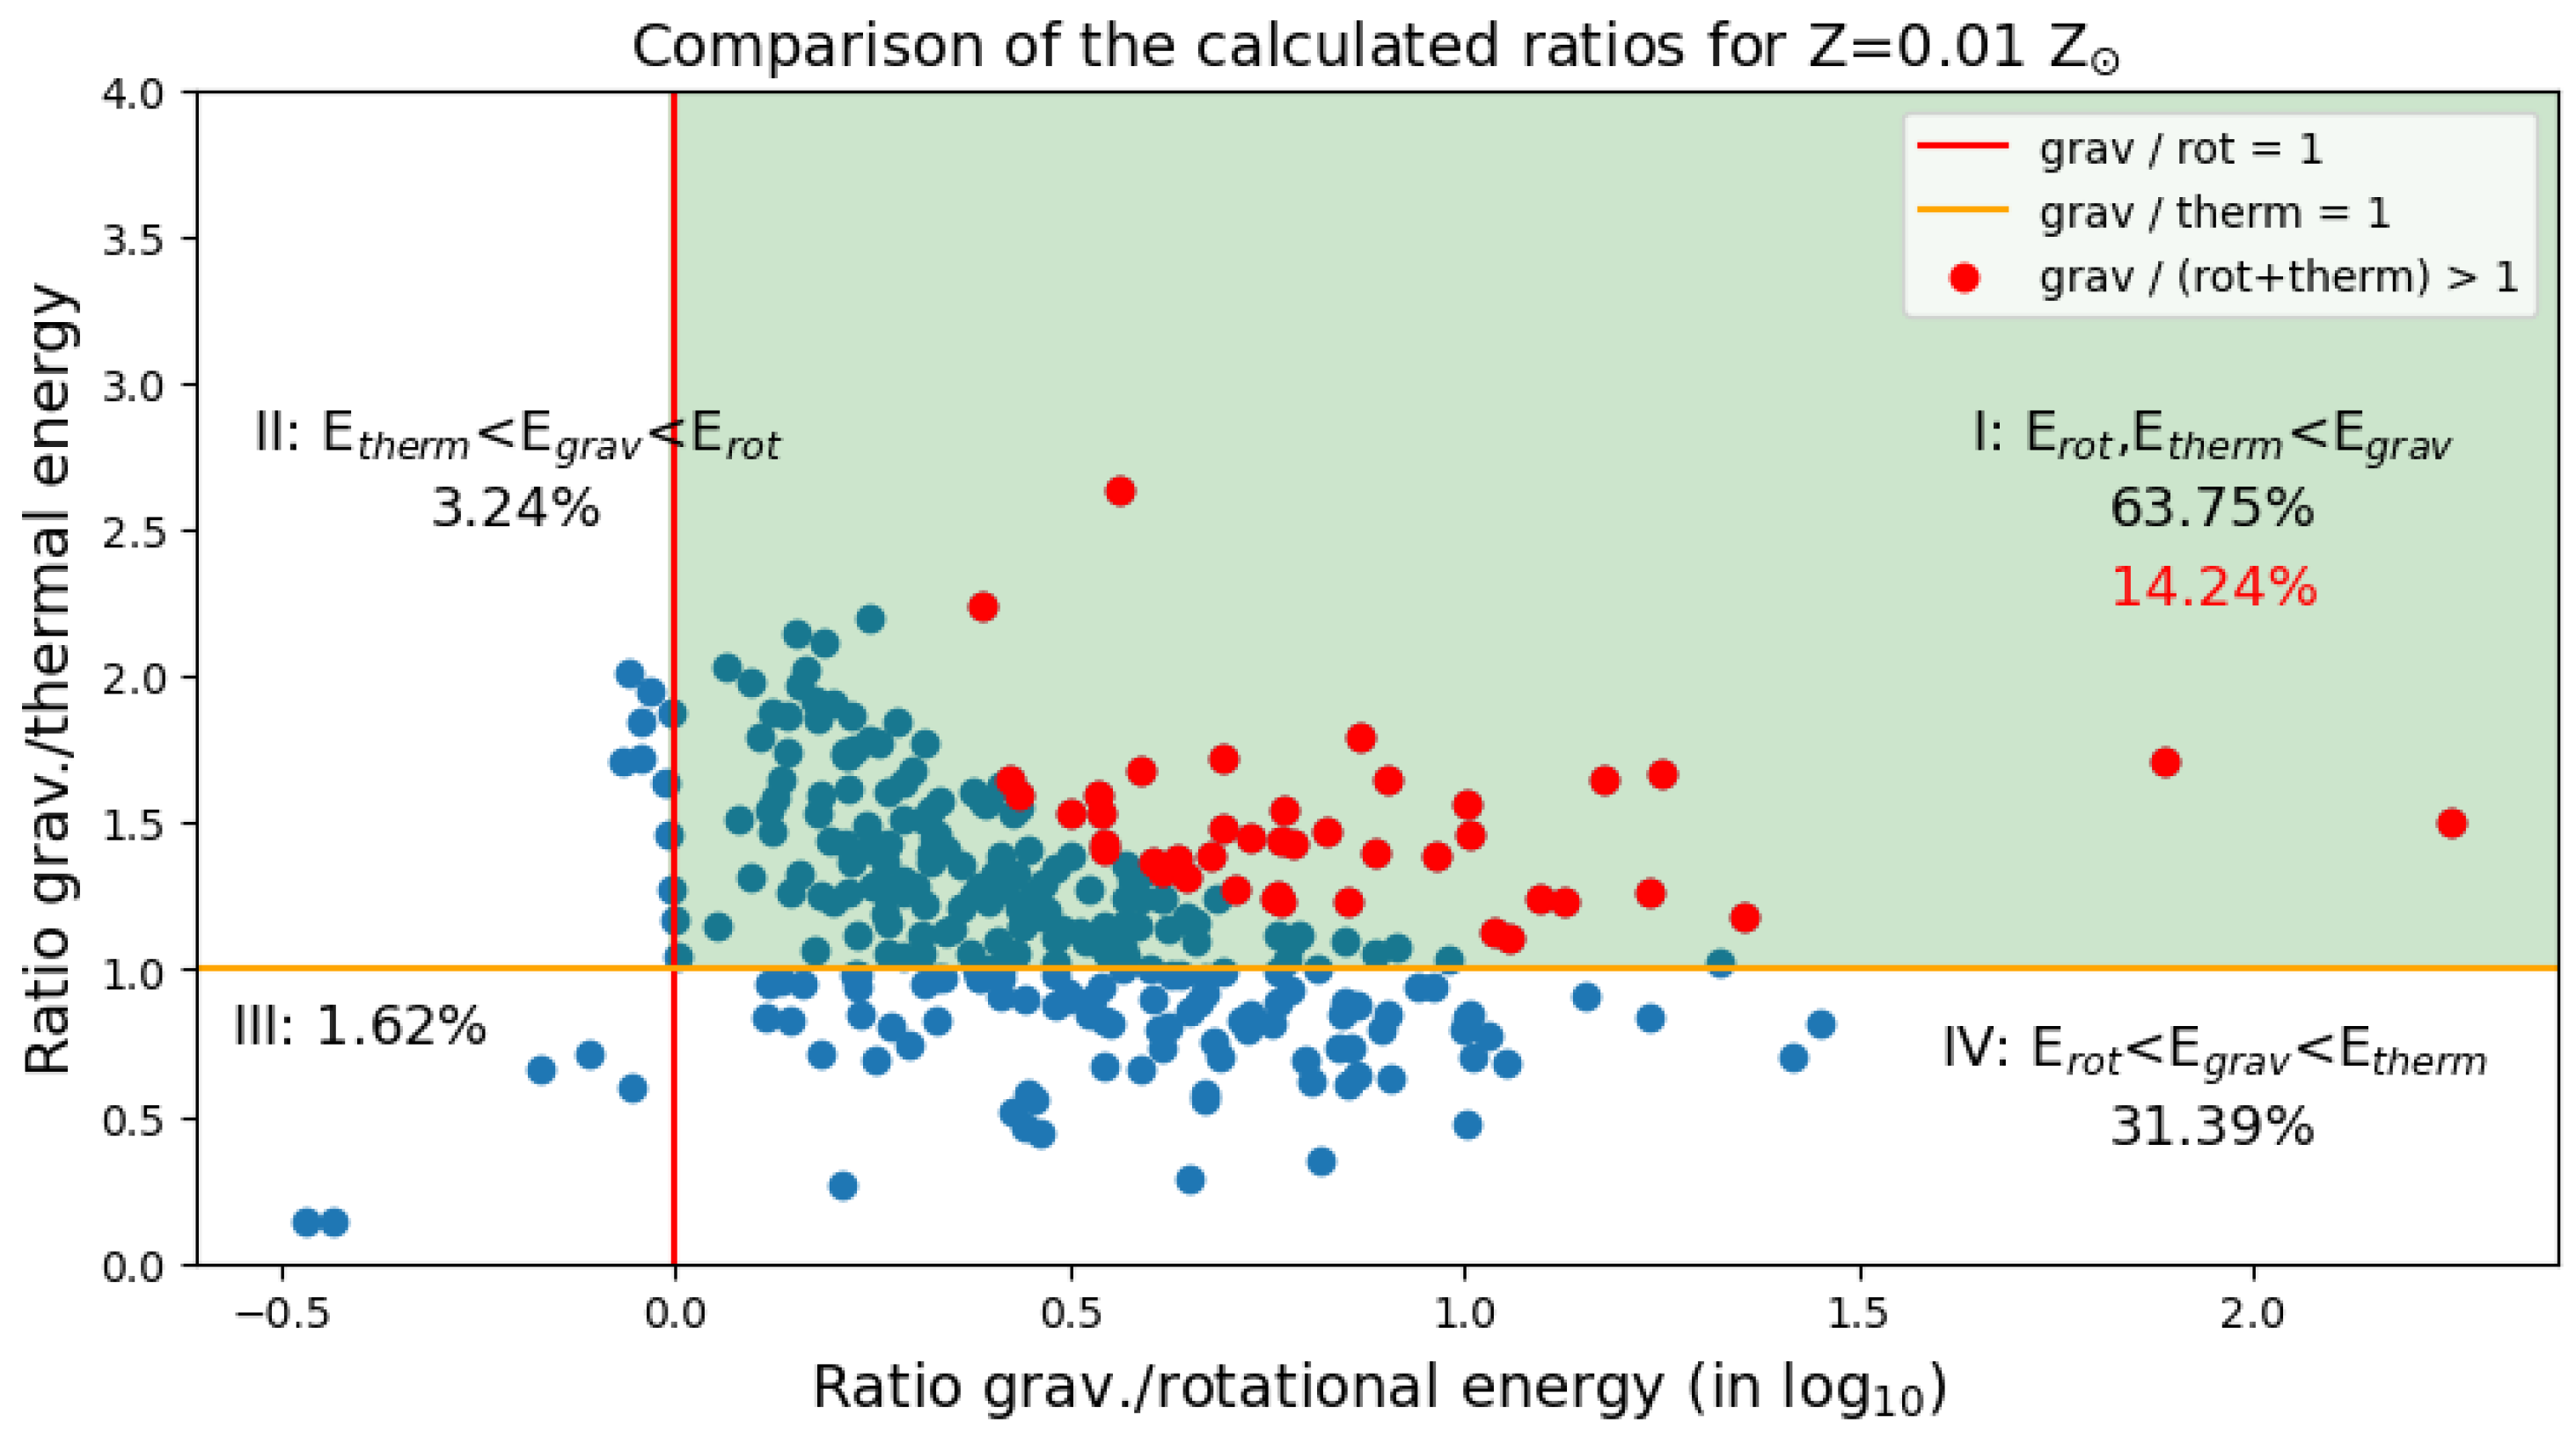
Figure 14.
Same as Figure 12 but for Z = 0.01 Z⊙. The model produced a total of 197 clumps.
Figure 12 shows the energy ratio comparison for the solar metallicity case; 47.12% of the clumps fall into the sector where gravitational energy dominates. The analysis of probability density distributions in Section 3.5 showed that thermal and gravitational energy seems to be more dominant in the clumps’ energetics, and considering that 51.33% of the clumps are dominated by thermal energy (sector IV), this can be supported. Only 1.05% are dominated by rotational energy, which leaves 0.50% of the clumps where the gravitational energy is smallest. These objects are referred to as completely loose clumps, although rotationally and thermally dominated clumps are loose as well. The percentage of really gravitationally bound clumps is 8.59%, they are marked in red in the figures. In total, there are 850 clump realizations for the solar metallicity disk, meaning that about 73 of them are bound. From our data, we can tentatively assume that 1 out of 11 clumps in Model Z1.0 may be gravitationally bound during most of its lifetime. An alternative conclusion may be that about 9% of the lifetime of each clump is spent in the gravitationally bound stage. Further investigations that allow tracking the dynamics and differentiating the evolution of each individual clump may clarify our results.
Figure 13 compares the energy ratios for Z = 0.1 Z⊙. The corresponding probability density distribution showed a larger relevance of rotational energy for these clumps. This is supported by a percentage of 7.68% of rotationally dominated clumps. The percentage of gravitationally dominated clumps also increased and is at 57.98%. Despite the lower percentage of gravitationally bound clump realization, 6.82%, their total amount is 78 and thus slightly higher than for the solar metallicity disk. The thermal energy’s influence on the clumps seems to have decreased, considering that now only 32.47% are pressure supported; 1.87% of the clumps are completely loose. This metallicity case has produced 1149 clump realizations in total. Following our tentative analysis, 1 out of 14 clumps in Model Z0.1 may be gravitationally bound over its lifetime; each clump spends about 7% of its lifetime in a gravitationally bound state.
Finally, Figure 14 shows the comparison for Z = 0.01 Z⊙. There are much fewer data points due to the smaller amount of clump realizations produced, which is 197. Here, the percentage of gravitationally dominated clumps has increased up to 63.75%, and the percentage of gravitationally bound clumps up to 14.24%. Because there are so few clumps, this only translates into 28 bound clumps in total. Nevertheless, one out of seven clumps may be gravitationally bound or, alternatively, each clump spends 14% of its lifetime in the bound state. Again, the thermal energy dominates a notable part of the clumps with 31.39%, which is similar to the Z = 0.1 Z⊙ case before. Here, 3.24% of clumps are dominated by rotational energy and 1.62% are completely loose.
To give an overview of the obtained results, the percentages of clumps dominated by each energy are listed in Table 2 for all three metallicities. Based on Table 2, the total number of clump realizations dominated by each energy is calculated and given in Table 3. The comparisons show that the percentage of gravitationally dominated clumps increases towards lower metallicities. Regardless of this, the percentages of gravitationally bound clumps do not show such a clear behavior. The solar metallicity case shows 8.59% bound clumps, which decreases to 6.82% in the Z = 0.1 case. The Z = 0.01 case shows 14.24%, which is significantly higher. Under consideration of the total amount of bound clumps we see that despite the higher percentage in the lowest metallicity disk, there are only 28 affected realizations. The other disks actually show a comparative number of bound clumps with 73 and 78 realizations. The same goes for gravitationally dominated clumps, the Z = 0.01 disk shows the least amount of such objects. As discussed before, 51.33% of clumps in Model Z1.0 are thermally supported, while Model Z0.1 and Z0.01 have similar percentages of 32.47% and 31.39% respectively. This difference may be due to the increasing influence of rotational and gravitational energy towards lower metallicities, as seen in previous analyses. The fractions of rotationally supported clumps do not show a trend; nevertheless, the occurence of such objects is highest for Model Z0.1. Clumps for which the gravitational energy is least influential, the completely loose clumps, only make up a very small fraction. The percentage is smallest for solar metallicity with 0.50% and increases slightly towards lower metallicites. The Z = 0.1 disk shows 1.87% and the Z = 0.01 disk shows 1.62%. Again, Model Z0.1 has the highest occurrence of such clumps due to its high number of realizations.
Table 2.
Overview of the percentages of gravitationally bound clump realizations for each metallicity case considered. The percentages of realizations are also given with dominating gravitational, thermal, or rotational energy for the different models, as well as the percentage for which both ratios are below unity (completely loose clumps). The total amount of clump realizations is given as well.
Table 3.
Same as Table 2, but with the total amount of clump realizations.
The analysis of the clump’s energetics suggests that the gravitationally unstable disks present a rather challenging environment for clump survival. Most clumps are not gravitationally bound, meaning that they can be prone to tidal destruction and dissipation, apart from other clump destruction mechanisms such as inward migration and ejection. These findings are in agreement with numerical simulations of clump dynamics and evolution in solar metallicity disks [14,52], but here, we also demonstrate that this trend extends to sub-solar metallicity disks. The formation of giant planets via disk gravitational fragmentation is possible in sub-solar metallicity disks, as Matsukoba et al. [22] recently demonstrated, but this process may be rare.
3.6. Mass Spectra of Bound Clumps
As a further investigation of all bound clumps, we first look at their masses. Again, a probability density distribution is used. The most apparent feature from Figure 15 is that the masses of the Z = 0.01 Z⊙ clumps are generally lower than those of the higher metallicity disks. The low metallicity distribution shows a strong peak around 4 MJup, and its largest value is about 14 Mjup, implying the lack of proto-brown dwarfs. In comparison, the distribution for solar metallicity clumps extends about 30 MJup and its most probable value seems to be between 6 and 10 MJup. Lastly, the Z = 0.1 Z⊙ distribution reaches much higher values than the other two metallicity cases and extends up to about 70 MJup. Nevertheless, there is no obvious peak as in the other distributions, although probable masses again seem to be around 4–5 MJup. For all three cases, the lowest mass that occurs is approximately 2 MJup, in general agreement with numerical simulations of Forgan and Rice [57] and theoretical predictions of Jin et al. [15] for the solar metallicity case.
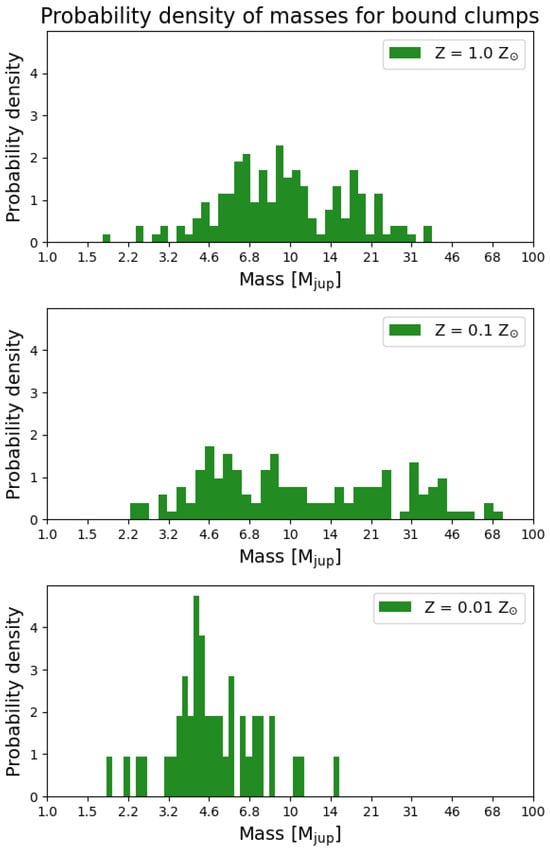
Figure 15.
Probability density distribution of all bound clump’s masses. The mass is given in Jupiter masses and spaced logarithmically on the x-axis. The distribution for Z = 0.01 Z⊙ covers smaller masses than the other cases.
A minimum mass of the clumps that is rather insensitive to disk metallicity is interesting. The initial mass of the clump upon formation via gravitational fragmentation can be estimated as [58]
where is the most unstable wavelength of perturbation. The initial mass is then defined mostly by the gas temperature in the disk and, to a lesser extent, by the gas surface density. A comparison of disk characteristics under different metallicities in Vorobyov et al. [35] revealed that notable differences in the gas temperatures occur in the innermost disk regions (several au) and at the disk–envelope interface. The rest of the disk, where usual fragmentation takes place, has rather similar temperatures mostly determined by stellar irradiation. The latter scales as and is only weakly sensitive to stellar luminosity, which in turn varies weakly with metallicity for subsolar mass protostars. In particular, the stellar luminosity of a star with mass 0.8 and age 0.1–1.0 Myr, relevant for our models, is higher about 30% higher for Z = 0.01 compared to the case1. This may explain similar minimum clump masses found in disks of varying metallicity. The lack of the high-mass tail in Model Z0.01 can be related to a shorter gravitationally unstable stage of disk evolution so that clumps have less time to build more massive envelopes via disk accretion. Alternatively, the Z = 0.01 disk is more compact, and tidal forces due to close encounters between the clumps and spiral arms may be stronger, thus acting to truncate the clump’s envelopes.
3.7. Central Temperatures of Bound Clumps
Figure 16 shows the probability density distribution for the central temperature of all bound clumps. The distribution for the solar metallicity clumps goes from about 15 K to 300 K. The most probable value is between 50 and 60 K. Similar to the mass distribution, the distribution of the Z = 0.1 Z⊙ case covers a larger range of values, going from 15 K to just below 1000 K. There is also no evident peak. Model Z0.01 also shows no clear peak. The interesting feature of this distribution is that it starts at higher values than the high-metallicity ones. The covered range is roughly from 30 K to 320 K with an outlier just below 1000 K, similar to Z = 0.1 Z⊙. The most probable temperature seems to be around 45 K. Nevertheless, the entire Z = 0.01 Z⊙ distribution seems to be shifted toward higher temperatures than the solar metallicity one. This may be due to the dust cooling effect, which is metallicity-dependent. Since it is more dominant at high metallicities, the low-metallicity clumps are not affected by it. Thus, their central temperatures remain higher.
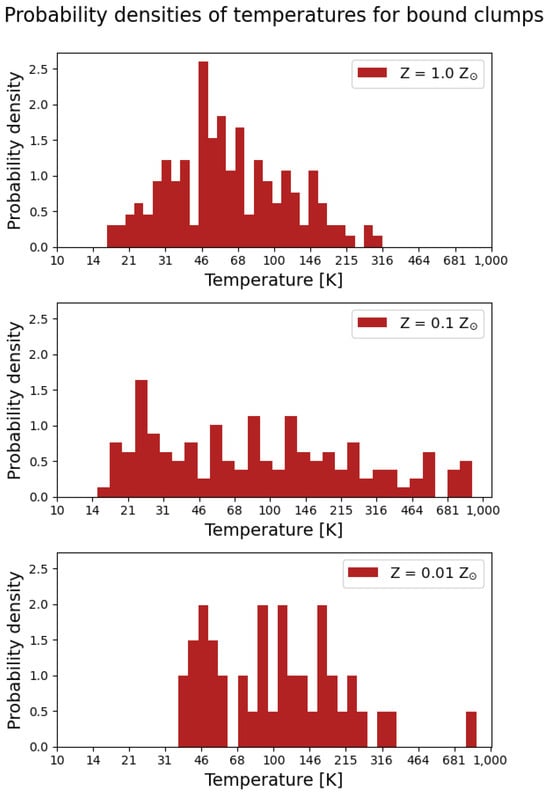
Figure 16.
Probability density distribution of the central temperatures of all bound clumps. The x-axis is spaced logarithmically and given in Kelvin. Bound clumps in the lowest-metallicity disk seem to have higher temperatures than those in the solar metallicity disk.
Another important feature of all temperature distributions is the lack of temperatures near the molecular hydrogen dissociation limit, ∼2000 K [48]. This means that the bound clumps are likely to cool and contract slowly to form protoplanets and/or proto-brown dwarfs rather than to experience a rapid collapse due to H2O dissociation. Numerical simulations of isolated bound clumps suggest timescales reaching the H2O dissociation temperature of thousands to tens of thousand years depending on metallicity [59], but slow cooling and contraction may take much longer. This can make clump survival in the dynamical disk environment less likely. However, the central temperature of bound clumps may simply be washed out because of limited numerical resolution, thus failing to capture the H2O dissociation process. Simulations with doubled or even quadrupled resolution are needed to clarify the evolutionary path of bound clumps.
4. Discussion
Here, we discuss the key results of our numerical simulations in the context of previous studies of gravitational instability and giant planet formation in low-metallicity disks. The observed correlation between the giant planet occurrence and metallicity [23] makes the core accretion theory an unlikely mechanism for giant planet formation at low metallicities [10]. Therefore, giant planet formation via disk gravitational fragmentation has long been considered an alternative. Numerical radiation hydrodynamics simulations of isolated protoplanetary disks by Cai et al. [17] showed that they cool faster and show stronger gravitational instability with lower metallicity. However, gravitational fragmentation and formation of self-gravitating gaseous clumps were not detected, unlike in our models. One of the reasons behind this discrepancy is that Cai et al. [17] considered isolated disks in a more advanced stage of evolution, while we consider younger disks that are still actively accreting from their parental clouds. The resulting infall of gas from the cloud onto the disk plays a crucial role in driving the disk to gravitational fragmentation [30,60]. This conclusion was reinforced by numerical simulations of actively accreting young disks of various metallicity, showing that disk gravitational fragmentation generally increases in efficiency with lower metallicity [18,19]. We note, however, that these later authors considered clouds of increasingly higher mass with decreasing metallicity, following a general increase in the Jeans mass, while our study focused on protoplanetary disks formed from cloud cores of similar mass to exclude an uncertainty introduced by different stellar and disk masses. As a result, the disk formation phase and duration of the gravitationally unstable stage are found to be shorter for the lowest metallicity case of , which affected the number of clumps formed via gravitational fragmentation in this lowest-metallicity model.
Numerical radiation hydrodynamics simulations of isolated protoplanetary disks with stellar irradiation by Boss [20] revealed remarkable insensitivity of clump formation to metallicity variations by an order of magnitude with respect to the Solar value. This was attributed to the dominant effect of stellar irradiation in controlling the energy balance and temperature in the disk, a suggestion that was also put forward in our study to explain the insensitivity of the lower mass limit of the clumps to metallicity.
One of our key findings that only a small fraction of clumps formed via disk gravitational fragmentation is actually gravitationally bound suggests that giant planet formation via this mechanism should be rare. This appears to be confirmed by a low detection frequency (in less than a few percent for FGK stars) of giant planets on wide orbits, au, namely at distances where gravitational fragmentation is likely [61,62]. The caveat is that sensitivity limits and radial migration may be responsible for the scarcity of wide-orbit objects. However rare giant planet formation via disk gravitational fragmentation may be, direct numerical simulations confirm that this mechanism can still operate down to 1/10 of Solar metallicity [12,14,22,55,63,64].
5. Conclusions
In this work, we numerically studied the long-term evolution of protoplanetary disks for metallicities Z = 0.01, 0.1, and 1.0 Z⊙. In our models, the disks are formed self-consistently via the gravitational collapse of cloud cores of similar mass (0.9–1.0 ) but of a denser and more compact shape as the metallicity decreases. Our main focus is on the properties of gravitationally bound clumps that form in the gravitationally unstable disks via fragmentation. The main findings can be summarized as follows.
- The disk fragmentation phase starts earlier and lasts shorter in the lowest metallicity model (0.01 ). The number of clumps at a time in the disk of this model is also lowest.
- Most clumps in models with Z = 1.0 and 0.1 Z⊙ are located at 20–500 au with a peak at 200–300 au. The peak in the clump locations in the lowest metallicity model is shifted to 50–200 au, reflecting a more compact nature of the corresponding disk.
- Clumps are supported against self-gravity mostly by pressure, with a lesser input from rotation. The input of rotation to the clump energetics slightly increases with lowering metallicity.
- Only about 7–14% of the clumps are gravitationally bound, meaning that the gravitational energy is greater than the sum of the rotational and thermal energies. The percentage of bound clumps is highest for the lowest metallicity case, but the absolute number of bound clumps is lowest because the Z = 0.01 Z⊙ disk features the least number of clumps.
- Masses of gravitationally bound clumps in the Z = 1.0 Z⊙ model lie in 1.7–30 limits, with most clump masses corresponding to upper-mass giant planets, 6–10 MJup. In the Z = 0.1 Z⊙ model, the proto-brown dwarf tail extends to 70 , whereas the lowest metallicity model yields almost no proto-brown dwarfs. The peak in the bound clump mass distribution in both low metallicity models seems to shift to slightly lower values, ≈4–6 .
- The central temperatures of bound clumps do not reach the dissociation temperature of molecular hydrogen and are limited by 320–1000 K depending on the metallicity, implying slow contraction towards proto-planetary densities rather than fast collapse due to H2O dissociation. This result may, however, be affected by moderate numerical resolution.
Overall, our numerical experiments suggest that protoplanetary disks of 0.01–1.0 Z⊙ metallicity may represent challenging environments for giant planets and brown dwarf formation via disk gravitational fragmentation. Our conclusion does not invalidate this mechanism but emphasizes hurdles and difficulties that are inherit to it. We note that our results stand for stellar objects with a similar mass of about that of the Sun. The case of increasing object mass with decreasing metallicity was studied in detail in Matsukoba et al. [19] using a similar numerical approach.
Author Contributions
Conceptualization, methodology, software, and validation, E.V.; formal analysis and investigation, C.S.; writing—original draft preparation, E.V. and C.S.; visualization, C.S. and E.V. All authors have read and agreed to the published version of the manuscript.
Funding
Data Availability Statement
Data can be obtained on reasonable request.
Acknowledgments
We are thankful to the anonymous referees and the scientific editor for valuable comments and suggestions. Simulations were performed on the Vienna Scientific Cluster (VSC).
Conflicts of Interest
The authors declare no conflicts of interest.
Note
| 1 | The Pisa PMS Evolutionary Tracks. Available online: http://astro.df.unipi.it/stellar-models/ (accessed on 22 March 2025). |
References
- Shu, F.H. Self-similar collapse of isothermal spheres and star formation. Astrophysical 1977, 214, 488–497. [Google Scholar] [CrossRef]
- Larson, R.B. Cloud fragmentation and stellar masses. Mon. Not. R. Astron. Soc. 1985, 214, 379–398. [Google Scholar] [CrossRef]
- Padoan, P.; Nordlund, Å. The “Mysterious” Origin of Brown Dwarfs. Astrophysical 2004, 617, 559–564. [Google Scholar] [CrossRef]
- Whitworth, A.P.; Zinnecker, H. The formation of free-floating brown dwarves and planetary-mass objects by photo-erosion of prestellar cores. Astron. Astrophys. 2004, 427, 299–306. [Google Scholar] [CrossRef]
- Pollack, J.B.; Hubickyj, O.; Bodenheimer, P.; Lissauer, J.J.; Podolak, M.; Greenzweig, Y. Formation of the Giant Planets by Concurrent Accretion of Solids and Gas. Icarus 1996, 124, 62–85. [Google Scholar] [CrossRef]
- Stökl, A.; Dorfi, E.A.; Johnstone, C.P.; Lammer, H. Dynamical Accretion of Primordial Atmospheres around Planets with Masses between 0.1 and 5 M ⊕ in the Habitable Zone. Astrophys. J. 2016, 825, 86. [Google Scholar] [CrossRef]
- Jin, L.; Li, M. Diversity of Extrasolar Planets and Diversity of Molecular Cloud Cores. I. Semimajor Axes. Astrophys. J. 2014, 783, 37. [Google Scholar] [CrossRef]
- Haghighipour, N.; Podolak, M.; Podolak, E. Detailed Calculations of the Efficiency of Planetesimal Accretion in the Core-accretion Model. II. The Effect of Saturn. Astrophys. J. 2022, 941, 117. [Google Scholar] [CrossRef]
- Ida, S.; Lin, D.N.C. Toward a Deterministic Model of Planetary Formation. I. A Desert in the Mass and Semimajor Axis Distributions of Extrasolar Planets. Astrophys. J. 2004, 604, 388–413. [Google Scholar] [CrossRef]
- Mordasini, C.; Alibert, Y.; Klahr, H.; Henning, T. Characterization of exoplanets from their formation. I. Models of combined planet formation and evolution. Astron. Astrophys. 2012, 547, A111. [Google Scholar] [CrossRef]
- Cameron, A.G.W. Physics of the Primitive Solar Accretion Disk. Moon Planets 1978, 18, 5–40. [Google Scholar] [CrossRef]
- Mayer, L.; Quinn, T.; Wadsley, J.; Stadel, J. Formation of Giant Planets by Fragmentation of Protoplanetary Disks. Science 2002, 298, 1756–1759. [Google Scholar] [CrossRef] [PubMed]
- Boley, A.C. The Two Modes of Gas Giant Planet Formation. Astrophys. J. 2009, 695, L53–L57. [Google Scholar] [CrossRef]
- Vorobyov, E.I. Formation of giant planets and brown dwarfs on wide orbits. Astron. Astrophys. 2013, 552, A129. [Google Scholar] [CrossRef]
- Jin, L.; Liu, F.; Jiang, T.; Tang, P.; Yang, J. An Investigation of Fragmentation in the Disk Instability Model for Giant Planet Formation. Astrophys. J. 2020, 904, 55. [Google Scholar] [CrossRef]
- Nayakshin, S. Formation of planets by tidal downsizing of giant planet embryos. Mon. Not. R. Astron. Soc. 2010, 408, L36–L40. [Google Scholar] [CrossRef]
- Cai, K.; Durisen, R.H.; Michael, S.; Boley, A.C.; Mejía, A.C.; Pickett, M.K.; D’Alessio, P. The Effects of Metallicity and Grain Size on Gravitational Instabilities in Protoplanetary Disks. Astrophys. J. 2006, 636, L149–L152. [Google Scholar] [CrossRef]
- Machida, M.N. Binary Formation in Star-forming Clouds with Various Metallicities. Astrophys. J. 2008, 682, L1. [Google Scholar] [CrossRef]
- Matsukoba, R.; Tanaka, K.E.I.; Omukai, K.; Vorobyov, E.I.; Hosokawa, T. Protostellar-disc fragmentation across all metallicities. Mon. Not. R. Astron. Soc. 2022, 515, 5506–5522. [Google Scholar] [CrossRef]
- Boss, A.P. Stellar Metallicity and the Formation of Extrasolar Gas Giant Planets. Astrophys. J. 2002, 567, L149–L153. [Google Scholar] [CrossRef]
- Mayer, L.; Lufkin, G.; Quinn, T.; Wadsley, J. Fragmentation of Gravitationally Unstable Gaseous Protoplanetary Disks with Radiative Transfer. Astrophys. J. 2007, 661, L77–L80. [Google Scholar] [CrossRef]
- Matsukoba, R.; Vorobyov, E.I.; Hosokawa, T.; Guedel, M. Formation of a wide-orbit giant planet in a gravitationally unstable subsolar-metallicity protoplanetary disc. Mon. Not. R. Astron. Soc. 2023, 526, 3933–3943. [Google Scholar] [CrossRef]
- Fischer, D.A.; Valenti, J. The Planet-Metallicity Correlation. Astrophys. J. 2005, 622, 1102–1117. [Google Scholar] [CrossRef]
- Santos, N.C.; Adibekyan, V.; Figueira, P.; Andreasen, D.T.; Barros, S.C.C.; Delgado-Mena, E.; Demangeon, O.; Faria, J.P.; Oshagh, M.; Sousa, S.G.; et al. Observational evidence for two distinct giant planet populations. Astron. Astrophys. 2017, 603, A30. [Google Scholar] [CrossRef]
- Narang, M.; Manoj, P.; Furlan, E.; Mordasini, C.; Henning, T.; Mathew, B.; Banyal, R.K.; Sivarani, T. Properties and Occurrence Rates for Kepler Exoplanet Candidates as a Function of Host Star Metallicity from the DR25 Catalog. Astron. J. 2018, 156, 221. [Google Scholar] [CrossRef]
- Vorobyov, E.I.; Matsukoba, R.; Omukai, K.; Guedel, M. Thermal evolution of protoplanetary disks: From β-cooling to decoupled gas and dust temperatures. arXiv 2020, arXiv:2004.13561. [Google Scholar]
- Shakura, N.I.; Sunyaev, R.A. Black holes in binary systems. Observational appearance. Astron. Astrophys. 1973, 24, 337–355. [Google Scholar]
- Zhu, Z.; Jiang, Y.F.; Stone, J.M. Global 3-D Radiation Magnetohydrodynamic Simulations for FU Ori’s Accretion Disk and Observational Signatures of Magnetic Fields. arXiv 2019, arXiv:1912.01632. [Google Scholar]
- Rosotti, G.P. Empirical constraints on turbulence in proto-planetary discs. New Astron. Rev. 2023, 96, 101674. [Google Scholar] [CrossRef]
- Vorobyov, E.I.; Basu, S. The Burst Mode of Accretion and Disk Fragmentation in the Early Embedded Stages of Star Formation. Astrophys. J. 2010, 719, 1896–1911. [Google Scholar] [CrossRef]
- Lin, Z.Y.D.; Li, Z.Y.; Tobin, J.J.; Ohashi, N.; Jørgensen, J.K.; Looney, L.W.; Aso, Y.; Takakuwa, S.; Aikawa, Y.; van’t Hoff, M.L.R.; et al. Early Planet Formation in Embedded Disks (eDisk). II. Limited Dust Settling and Prominent Snow Surfaces in the Edge-on Class I Disk IRAS 04302+2247. Astrophys. J. 2023, 951, 9. [Google Scholar] [CrossRef]
- Vorobyov, E.I.; Basu, S. Secular evolution of viscous and self-gravitating circumstellar discs. Mon. Not. R. Astron. Soc. 2009, 393, 822–837. [Google Scholar] [CrossRef]
- Yorke, H.W.; Bodenheimer, P. Theoretical Developments in Understanding Massive Star Formation. In Proceedings of the Massive Star Formation: Observations Confront Theory, Heidelberg, Germany, 10–14 September 2007; Beuther, H., Linz, H., Henning, T., Eds.; Astronomical Society of the Pacific: San Francisco, CA, USA, 2008; Volume 387, p. 189. [Google Scholar]
- Hosokawa, T.; Yorke, H.W.; Inayoshi, K.; Omukai, K.; Yoshida, N. Formation of Primordial Supermassive Stars by Rapid Mass Accretion. Astrophys. J. 2013, 778, 178. [Google Scholar] [CrossRef]
- Vorobyov, E.I.; Elbakyan, V.G.; Omukai, K.; Hosokawa, T.; Matsukoba, R.; Guedel, M. Accretion bursts in low-metallicity protostellar disks. Astron. Astrophys. 2020, 641, A72. [Google Scholar] [CrossRef]
- Gammie, C.F. Nonlinear Outcome of Gravitational Instability in Cooling, Gaseous Disks. Astrophys. J. 2001, 553, 174–183. [Google Scholar] [CrossRef]
- Rice, W.K.M.; Armitage, P.J.; Bate, M.R.; Bonnell, I.A. The effect of cooling on the global stability of self-gravitating protoplanetary discs. Mon. Not. R. Astron. Soc. 2003, 339, 1025–1030. [Google Scholar] [CrossRef]
- Semenov, D.; Henning, T.; Helling, C.; Ilgner, M.; Sedlmayr, E. Rosseland and Planck mean opacities for protoplanetary discs. Astron. Astrophys. 2003, 410, 611–621. [Google Scholar] [CrossRef]
- Pollack, J.B.; Hollenbach, D.; Beckwith, S.; Simonelli, D.P.; Roush, T.; Fong, W. Composition and Radiative Properties of Grains in Molecular Clouds and Accretion Disks. Astrophys. J. 1994, 421, 615. [Google Scholar] [CrossRef]
- Omukai, K. Protostellar Collapse with Various Metallicities. Astrophys. J. 2000, 534, 809–824. [Google Scholar] [CrossRef]
- Basu, S. A Semianalytic Model for Supercritical Core Collapse: Self-Similar Evolution and the Approach to Protostar Formation. Astrophys. J. 1997, 485, 240–253. [Google Scholar] [CrossRef]
- Truelove, J.K.; Klein, R.I.; McKee, C.F.; Holliman, J.H., II; Howell, L.H.; Greenough, J.A.; Woods, D.T. Self-gravitational Hydrodynamics with Three-dimensional Adaptive Mesh Refinement: Methodology and Applications to Molecular Cloud Collapse and Fragmentation. Astrophys. J. 1998, 495, 821–852. [Google Scholar] [CrossRef]
- Vorobyov, E.I.; Akimkin, V.; Stoyanovskaya, O.; Pavlyuchenkov, Y.; Liu, H.B. Early evolution of viscous and self-gravitating circumstellar disks with a dust component. Astron. Astrophys. 2018, 614, A98. [Google Scholar] [CrossRef]
- Stone, J.M.; Norman, M.L. ZEUS-2D: A Radiation Magnetohydrodynamics Code for Astrophysical Flows in Two Space Dimensions. I. The Hydrodynamic Algorithms and Tests. Astrophys. J. 1992, 80, 753. [Google Scholar] [CrossRef]
- Colella, P.; Woodward, P.R. The Piecewise Parabolic Method (PPM) for Gas-Dynamical Simulations. J. Comput. Phys. 1984, 54, 174–201. [Google Scholar] [CrossRef]
- Norman, M.L.; Wilson, J.R.; Barton, R.T. A new calculation on rotating protostar collapse. Astrophys. J. 1980, 239, 968–981. [Google Scholar] [CrossRef]
- Federrath, C.; Banerjee, R.; Clark, P.C.; Klessen, R.S. Modeling Collapse and Accretion in Turbulent Gas Clouds: Implementation and Comparison of Sink Particles in AMR and SPH. Astrophys. J. 2010, 713, 269–290. [Google Scholar] [CrossRef]
- Masunaga, H.; Inutsuka, S.i. A Radiation Hydrodynamic Model for Protostellar Collapse. II. The Second Collapse and the Birth of a Protostar. Astrophys. J. 2000, 531, 350–365. [Google Scholar] [CrossRef]
- Toomre, A. On the gravitational stability of a disk of stars. Astrophys. J. 1964, 139, 1217–1238. [Google Scholar] [CrossRef]
- Polyachenko, V.L.; Polyachenko, E.V.; Strel’Nikov, A.V. Stability criteria for gaseous self-gravitating disks. Astron. Lett. 1997, 23, 483–491. [Google Scholar]
- Takahashi, S.Z.; Tsukamoto, Y.; Inutsuka, S. A revised condition for self-gravitational fragmentation of protoplanetary discs. Mon. Not. R. Astron. Soc. 2016, 458, 3597–3612. [Google Scholar] [CrossRef]
- Zhu, Z.; Hartmann, L.; Nelson, R.P.; Gammie, C.F. Challenges in Forming Planets by Gravitational Instability: Disk Irradiation and Clump Migration, Accretion, and Tidal Destruction. Astrophys. J. 2012, 746, 110. [Google Scholar] [CrossRef]
- Basu, S.; Vorobyov, E.I. A Hybrid Scenario for the Formation of Brown Dwarfs and Very Low Mass Stars. Astrophys. J. 2012, 750, 30. [Google Scholar] [CrossRef]
- Fischer, W.J.; Hillenbrand, L.A.; Herczeg, G.J.; Johnstone, D.; Kospal, A.; Dunham, M.M. Accretion Variability as a Guide to Stellar Mass Assembly. In Proceedings of the Protostars and Planets VII, Kyoto, Japan, 10–15 April 2023; Inutsuka, S., Aikawa, Y., Muto, T., Tomida, K., Tamura, M., Eds.; Astronomical Society of the Pacific: San Francisco, CA, USA, 2023; Volume 534, p. 355. [Google Scholar] [CrossRef]
- Nayakshin, S. Dawes Review 7: The Tidal Downsizing Hypothesis of Planet Formation. Publ. Astron. Soc. Aust. 2017, 34, e002. [Google Scholar] [CrossRef]
- Vorobyov, E.I.; Elbakyan, V.G. Gravitational fragmentation and formation of giant protoplanets on orbits of tens of au. Astron. Astrophys. 2018, 618, A7. [Google Scholar] [CrossRef]
- Forgan, D.; Rice, K. The Jeans mass as a fundamental measure of self-gravitating disc fragmentation and initial fragment mass. Mon. Not. R. Astron. Soc. 2011, 417, 1928–1937. [Google Scholar] [CrossRef]
- Boley, A.C.; Hayfield, T.; Mayer, L.; Durisen, R.H. Clumps in the outer disk by disk instability: Why they are initially gas giants and the legacy of disruption. Icarus 2010, 207, 509–516. [Google Scholar] [CrossRef]
- Helled, R.; Bodenheimer, P. The effects of metallicity and grain growth and settling on the early evolution of gaseous protoplanets. Icarus 2011, 211, 939–947. [Google Scholar] [CrossRef]
- Kratter, K.M.; Matzner, C.D.; Krumholz, M.R. Global Models for the Evolution of Embedded, Accreting Protostellar Disks. Astrophys. J. 2008, 681, 375–390. [Google Scholar] [CrossRef]
- Bowler, B.P. Imaging Extrasolar Giant Planets. Publ. Astron. Soc. Pac. 2016, 128, 102001. [Google Scholar] [CrossRef]
- Vigan, A.; Fontanive, C.; Meyer, M.; Biller, B.; Bonavita, M.; Feldt, M.; Desidera, S.; Marleau, G.D.; Emsenhuber, A.; Galicher, R.; et al. The SPHERE infrared survey for exoplanets (SHINE). III. The demographics of young giant exoplanets below 300 au with SPHERE. Astron. Astrophys. 2021, 651, A72. [Google Scholar] [CrossRef]
- Mercer, A.; Stamatellos, D. The effect of radiative feedback on disc fragmentation. Mon. Not. R. Astron. Soc. 2017, 465, 2–18. [Google Scholar] [CrossRef]
- Machida, M.N.; Inutsuka, S.i.; Matsumoto, T. Recurrent Planet Formation and Intermittent Protostellar Outflows Induced by Episodic Mass Accretion. Astrophys. J. 2011, 729, 42. [Google Scholar] [CrossRef]


Disclaimer/Publisher’s Note: The statements, opinions and data contained in all publications are solely those of the individual author(s) and contributor(s) and not of MDPI and/or the editor(s). MDPI and/or the editor(s) disclaim responsibility for any injury to people or property resulting from any ideas, methods, instructions or products referred to in the content. |
© 2025 by the authors. Licensee MDPI, Basel, Switzerland. This article is an open access article distributed under the terms and conditions of the Creative Commons Attribution (CC BY) license (https://creativecommons.org/licenses/by/4.0/).