Article

Cosmic Ray Spectra and Anisotropy in an Anisotropic Propagation Model with Spiral Galactic Sources

1
College of Information Science and Engineering, Shandong Agricultural University, Tai’an 271018, China
2
Key Laboratory of Particle Astrophysics, Institute of High Energy Physics, Chinese Academy of Sciences, Beijing 100049, China
3
University of Chinese Academy of Sciences, Beijing 100049, China
4
TIANFU Cosmic Ray Research Center, Chengdu 610000, China
*
Authors to whom correspondence should be addressed.
Universe 2025, 11(2), 53; https://doi.org/10.3390/universe11020053
Submission received: 3 January 2025 / Revised: 27 January 2025 / Accepted: 5 February 2025 / Published: 7 February 2025
(This article belongs to the Special Issue Universe: Feature Papers 2025—Space Science)

Abstract

:
In our previous work, we investigated the spectra and anisotropy of galactic cosmic rays (GCRs) under the assumption of an axisymmetric distribution of galactic sources. Currently, much observational evidence indicates that the Milky Way is a typical spiral galaxy. In this work, we further utilize an anisotropic propagation model under the framework of spiral distribution sources to study spectra and anisotropy. During the calculation process, we adopt the spatial-dependent propagation (SDP) model, while incorporating the contribution from the nearby Geminga source and the anisotropic diffusion of cosmic rays (CRs) induced by the local regular magnetic field (LRMF). By comparing the results of background sources with spiral and axisymmetric distribution models, it is found that both of them can well reproduce the CR spectra and anisotropy. However, there exist differences in their propagation parameters. The diffusion coefficient with spiral distribution is larger than that with axisymmetric distribution, and its spectral indices are slightly harder. To investigate the effects of a nearby Geminga source and LRMF on anisotropy, two-dimensional (2D) anisotropy sky maps under various contributing factors are compared. Below 100 TeV, the anisotropy is predominantly influenced by both the nearby Geminga source and the LRMF, causing the phase to align with the direction of the LRMF. Above 100 TeV, the background sources become dominant, resulting in the phase pointing towards the Galactic Center (GC). Future high-precision measurements of CR anisotropy and spectra, such as the LHAASO experiment, will be crucial in evaluating the validity of our proposed model.

1. Introduction

With the improvement of cosmic ray (CR) observation technology, a new generation of experiments have entered the era of high-precision measurement and unveiled a series of unexpected phenomena. In recent years, multiple experiments such as ATIC-2 [1], CREAM [2,3], PAMELA [4], AMS-02 [5,6], DAMPE [7], and the calorimeter experiment CALET [8] have observed that the spectra of proton and helium nuclei become harder at rigidity R ∼ 200 GV. Furthermore, DAMPE [9], CREAM [10], NUCLEON [11], and CALET [12] found that spectra soften at R ∼ 14 TV. This subtle anomaly in spectra obviously deviates from the expected CR power law spectrum. The main theoretical explanations for the anomaly are as follows: the sources near to the Solar System contributing to the “bulge” of the CR spectra [13,14]; interaction between CRs and accelerating shock waves [15,16]; effects in the CR propagation process [14,17]; and multiple acceleration sources as superimposed factors [18,19].
CRs, mostly charged particles, become isotropic as they travel through the Milky Way due to deflections in the galactic magnetic field (GMF). However, extensive observations show that there exists a subtle CR anisotropy with relative amplitudes in the order of 10 4 10 3 at a wide energy range. Tibet [20,21,22], Super-Kamiokande [23], Milagro [24,25], IceCube/IceTop [26,27,28,29,30], ARGO-YBJ [31,32], EAS-TOP [33], KASCADE [34,35], and HWAC [36,37] have revealed that the structure and intensity of anisotropy are obviously energy-dependent. The amplitude of anisotropy increases first and then decreases with energy below 100 TeV, but gradually increases again above 100 TeV. Meanwhile, the phase points toward a value of ∼3 h below 100 TeV, whereas it flips and points towards ∼−6 h above 100 TeV, in the direction of the GC. It is noteworthy that, at tens of TeV, the morphology of anisotropy exhibits an excess named “tail-in” and a deficit named “loss-cone”. Obviously, the above anisotropic features contradict the expectations of the conventional propagation model. In general, CR anisotropy may arise due to the following several causes: the uneven distribution of CR sources, such as sources near the Solar System [14,38]; the modulation effect of large-scale local magnetic fields [38,39,40]; the process of CR propagation in the Galaxy [14]; and the Compton–Getting effect caused by the relative motion between the observer and the CR flux [41].
It is believed that anisotropy is related to the distribution of CR sources and CR propagation. In our previous work [38,42], based on the assumption that CR background sources follow an axisymmetric distribution, we built a hybrid model to calculate the CR spectra and anisotropy. The model successfully reproduced the experimental observations. Current extensive experimental observations reveal that the Milky Way is a typical spiral galaxy. The spiral arms, where high-density gas accumulates, are hotspots for rapid star formation [43,44]. Therefore, there is a high correlation between the distribution pattern of CR sources (especially supernova remnants, SNRs) and the spiral arm structure. In recent years, the impact of the spiral distribution of CR sources has garnered attention in research. Several studies have demonstrated that this spiral distribution of CR sources can significantly influence the positron and electron spectra, providing a more compelling explanation for the observed excess of positrons and electrons at 30 GeV [45,46]. Does the spiral distribution of CR sources affect nucleon spectra and anisotropy? In this work, we will utilize an anisotropic propagation model to investigate the energy spectra and anisotropy under the spiral distribution scenario. This will contribute to a deeper understanding of the origins and propagation mechanisms of CRs.
The rest of this paper is organized as follows: Section 2 introduces the model in detail, including the SDP model, the spiral structure of background sources, nearby sources, anisotropic diffusion, and large-scale anisotropy. In Section 3, the results of CR spectra and anisotropy are presented and thoroughly discussed; Section 4 provides the summary.

2. Model Description

2.1. Spatial-Dependent Propagation Model

In recent years, the SDP model has been proposed and widely applied. It was initially introduced as a two-halo model to account for the excess of primary proton and helium fluxes at R 200 GV [16]. Afterwards, it was further extended to explain the excess of secondary and heavier components [45,47,48,49], the diffuse gamma-ray distribution [50], and large-scale anisotropy [51,52]. Recent observations of halos surrounding pulsars have revealed that CRs diffuse much slower than previously inferred from the boron-to-carbon (B/C) ratio, providing robust support for the hypothesis that diffusion may be spatially dependent [53,54].
In the SDP model, the whole galactic diffusive halo is clearly divided into two distinct zones characterized by different diffusion properties. The galactic disk and its surrounding area are referred to as the inner halo (IH), while the extensive diffusive region outside the IH is called outer halo (OH). In the IH region, where there are more sources, the activity of supernova explosions will lead to more intense turbulence. Consequently, the diffusion of CRs in the IH region is slowed down, and the diffusion coefficient exhibits a lesser dependence on rigidity. In the OH region, however, the diffusion of CRs is less affected by stellar activity, so CRs diffuse faster. The diffusion coefficient only depends on rigidity and is consistent with the conventional propagation model.
In this work, we adopt the SDP model, and the diffusion coefficient is parameterized as [38,42]
D x x r , z , R = D 0 F ( r , z ) R R 0 δ 0 F ( r , z )
where r and z are cylindrical coordinates, R is a particle’s rigidity and the terms D 0 and δ 0 are two constants. The reference rigidity R 0 is fixed at 4 GV. The parameterization of F ( r , z ) is given by
F ( r , z ) = g ( r , z ) + 1 g ( r , z ) z ξ z 0 n , | z | ξ z 0 1 , | z | > ξ z 0
with g ( r , z ) = N m / [ 1 + f ( r , z ) ] , where f ( r , z ) denotes the source density distribution and N m is a normalization factor. The total half thickness of the propagation halo is z 0 , with ξ z 0 and ( 1 ξ ) z 0 being the half thicknesses of the IN and OH, respectively. In this work, we apply the diffusion–reacceleration model. The diffusive reacceleration is represented as a diffusion in the momentum space. Its diffusion coefficient D p p is related to D x x by
D x x D p p = 4 p 2 v A 2 3 δ 4 δ 2 4 δ
where δ = δ 0 F ( r , z ) and v A is the Alfvénic velocity.
Numerical simulations of CR propagation through the Galaxy help to understand the galactic CR transportation. Recently, a variety of codes have emerged for simulating the CR propagation process, including GALPROP [55], DRAGON [56], and PICARD [57]. In this work, we adopt the numerical package DRAGON to solve the CR transport equation.

2.2. Spiral Distribution of CR Sources

In view of the fact that the diffusion length of CRs is usually much longer than the characteristic spacing between the adjacent spiral arms, CR sources are generally approximated as axisymmetric. In our previous work, the source density distribution is parameterized as
f ( r , z ) = ( r / r ) α exp [ β ( r r ) / r ] exp ( | z | / z s ) ,
where r = 8.5 kpc represents the solar distance to the GC. The parameters α and β are taken as 1.69 and 3.33, respectively [58]. Perpendicular to the galactic plane, the density of CR sources descends as an exponential function, with a mean value z s = 0.2 kpc.
However, a large number of observations have indicated that the Milky Way is a typical spiral galaxy [43,44]. Due to the position of the Solar System within the Milky Way, we still have uncertainties regarding the structure of the spiral arms. Currently, it is generally believed that the Milky Way possesses four spiral arms, yet its internal structure remains relatively unclear. The spiral arms where high-density gas accumulates are regions of rapid star formation. Consequently, the distribution of SNRs is highly correlated with the spiral arm structure. In this work, we adopt a model established by Faucher-Giguere and Kaspi to describe the spiral distribution [59]. The Galaxy consists of the four major spiral arms extending outward from the GC: Norma, Carina–Sagittarius, Perseus, and Crux–Scutum. The locus of the i-th arm centroid is expressed as a logarithmic curve: θ i ( r ) = k i ln ( r / r 0 i ) + θ 0 i , with i 1 , 2 , 3 , 4 , where r is the distance to the GC and the values of k i , r 0 i , and θ 0 i have been fixed for each arm [46]. Along each spiral arm, there is a spread in the normal direction which follows a Gaussian distribution, i.e.,
f i = 1 2 π σ i exp ( r r i ) 2 2 σ i 2
where r i is the inverse function of the i-th spiral arm’s locus and the standard deviation σ i is 0.07 r i . The number density of SNRs at different radii is still consistent with the radial distribution in the axisymmetric case, i.e., Equation (4).
The injection spectrum of background sources is assumed to be a power-law of rigidity with a high-energy exponential cutoff, i.e.,
q ( R ) = q 0 R ν exp ( R / R c )
where q 0 is a normalization factor, ν is the power index, and R c is the rigidity cutoff. The cutoff rigidity of each element could be either Z- or A-dependent.

2.3. Nearby Source

In this work, the CR flux from the nearby source can be computed by solving the time-dependent diffusion equation using the Green’s function method, assuming a boundary at infinity [60,61]. Regarding the scenario of instantaneous and point-like injection, the CR density is calculated using a function of time, location, and rigidity, i.e.,
ψ ( r , R , t ) = q inj ( R ) ( 2 π σ ) 3 exp ( r r ) 2 2 σ 2 ,
where q inj ( R ) is parameterized as a power-law function of rigidity with an exponential cutoff, i.e.,
q inj ( R ) = q 0 R α exp ( R / R c ) ,
where q 0 is a normalization factor, α is the power index, R c is the rigidity cutoff, σ ( R , t ) = 2 D ( R ) t is the effective diffusion length within time t, and D ( R ) is the diffusion coefficient, which is adopted as the value near the Solar System.
In our previous works, the spectral anomaly at 200 GeV and dipole anisotropy below 100 TeV are attributed to the Geminga SNR. The Geminga SNR is located in the direction of ( l , b ) = ( 194 . 3 , 13 ) , where l and b denote the galactic longtitude and latitude and its distance to the Solar System is d 330 pc [62]. Its explosion time was about τ = 3.4 × 10 5 years ago, which is inferred from the spin-down luminosity of the Geminga pulsar [63]. In this work, we also select the Geminga SNR as the optimal source.

2.4. Anisotropic Diffusion and Large-Scale Anisotropy

By observing neutral particles traversing through the heliosphere boundary, the IBEX experiment has unveiled that the LRMF aligns with coordinates ( l , b ) = ( 210 . 5 , 57 . 1 ) , within a 20 pc radius [40,64]. We have discovered that the direction of the LRMF is generally consistent with the CR anisotropy observed below 100 TeV. Furthermore, some studies have also revealed that the TeV CR anisotropy is associated with the LRMF [38,39,40,42].
When CRs are deflected by magnetic fields, they diffuse anisotropically. It is generally believed that CRs diffuse faster along the direction of the magnetic field than perpendicular to it. The corresponding dipole anisotropy is expected to be modified by the LRMF. In this scenario, the diffusion coefficient D is replaced by a tensor D i j . The D i j associated with the magnetic field is written as
D i j D δ i j + D D b i b j , b i = B i | B | ,
where D and D are the diffusion coefficients aligned parallel and perpendicular to the ordered magnetic field B, and b i is the i-th component of its unit vector [62], respectively. In this work, the values D and D are parameterized as a power-law function of rigidity [41,65],
D = D 0 R R 0 δ ,
D = D 0 R R 0 δ = ε D 0 R R 0 δ .
where ε = D 0 D 0 is the ratio between the perpendicular and parallel diffusion coefficients at the reference rigidity R 0 .
Under the anisotropic diffusion model, the dipole anisotropy can be written as
δ = 3 D v . ψ ψ = 3 v ψ D i j ψ x j .
where v is the velocity of the CRs.

3. Results and Discussion

3.1. Proton and Helium Spectra of Nearby Sources

Since the spatial scale of the LRMF is significantly smaller than the average propagation length of CRs deduced from the B/C ratio, the LRMF does not have a remarkable impact on the energy spectra. Consequently, in this work, the isotropic diffusion SDP model within the framework of the spiral distribution of background sources is employed to calculate the nucleon spectra.
Firstly, the propagation parameters for the SDP model can be determined by fitting the B/C ratio. Figure 1 displays the fitting results of the B/C ratio, which align well with the experimental data from AMS-02 [66,67]. The corresponding propagation parameters are as follows: D 0 = 9.0 × 10 28 cm 2 s 1 , R 0 = 4 GV , δ 0 = 0.58 , N m = 0.5 , ξ = 0.12 , v A = 6 km / s , and z 0 = 5 kpc .
The normalization, power index, and cutoff rigidity for each element of the background source injection spectra are determined by fitting to the energy spectra derived from experimental observations. The cutoff rigidities of different compositions are regarded as the limits of acceleration in the sources and are presumed to be Z-dependent, with a high-energy exponential cutoff. Similarly, the injection spectrum of the nearby source is also set using the same methodology.
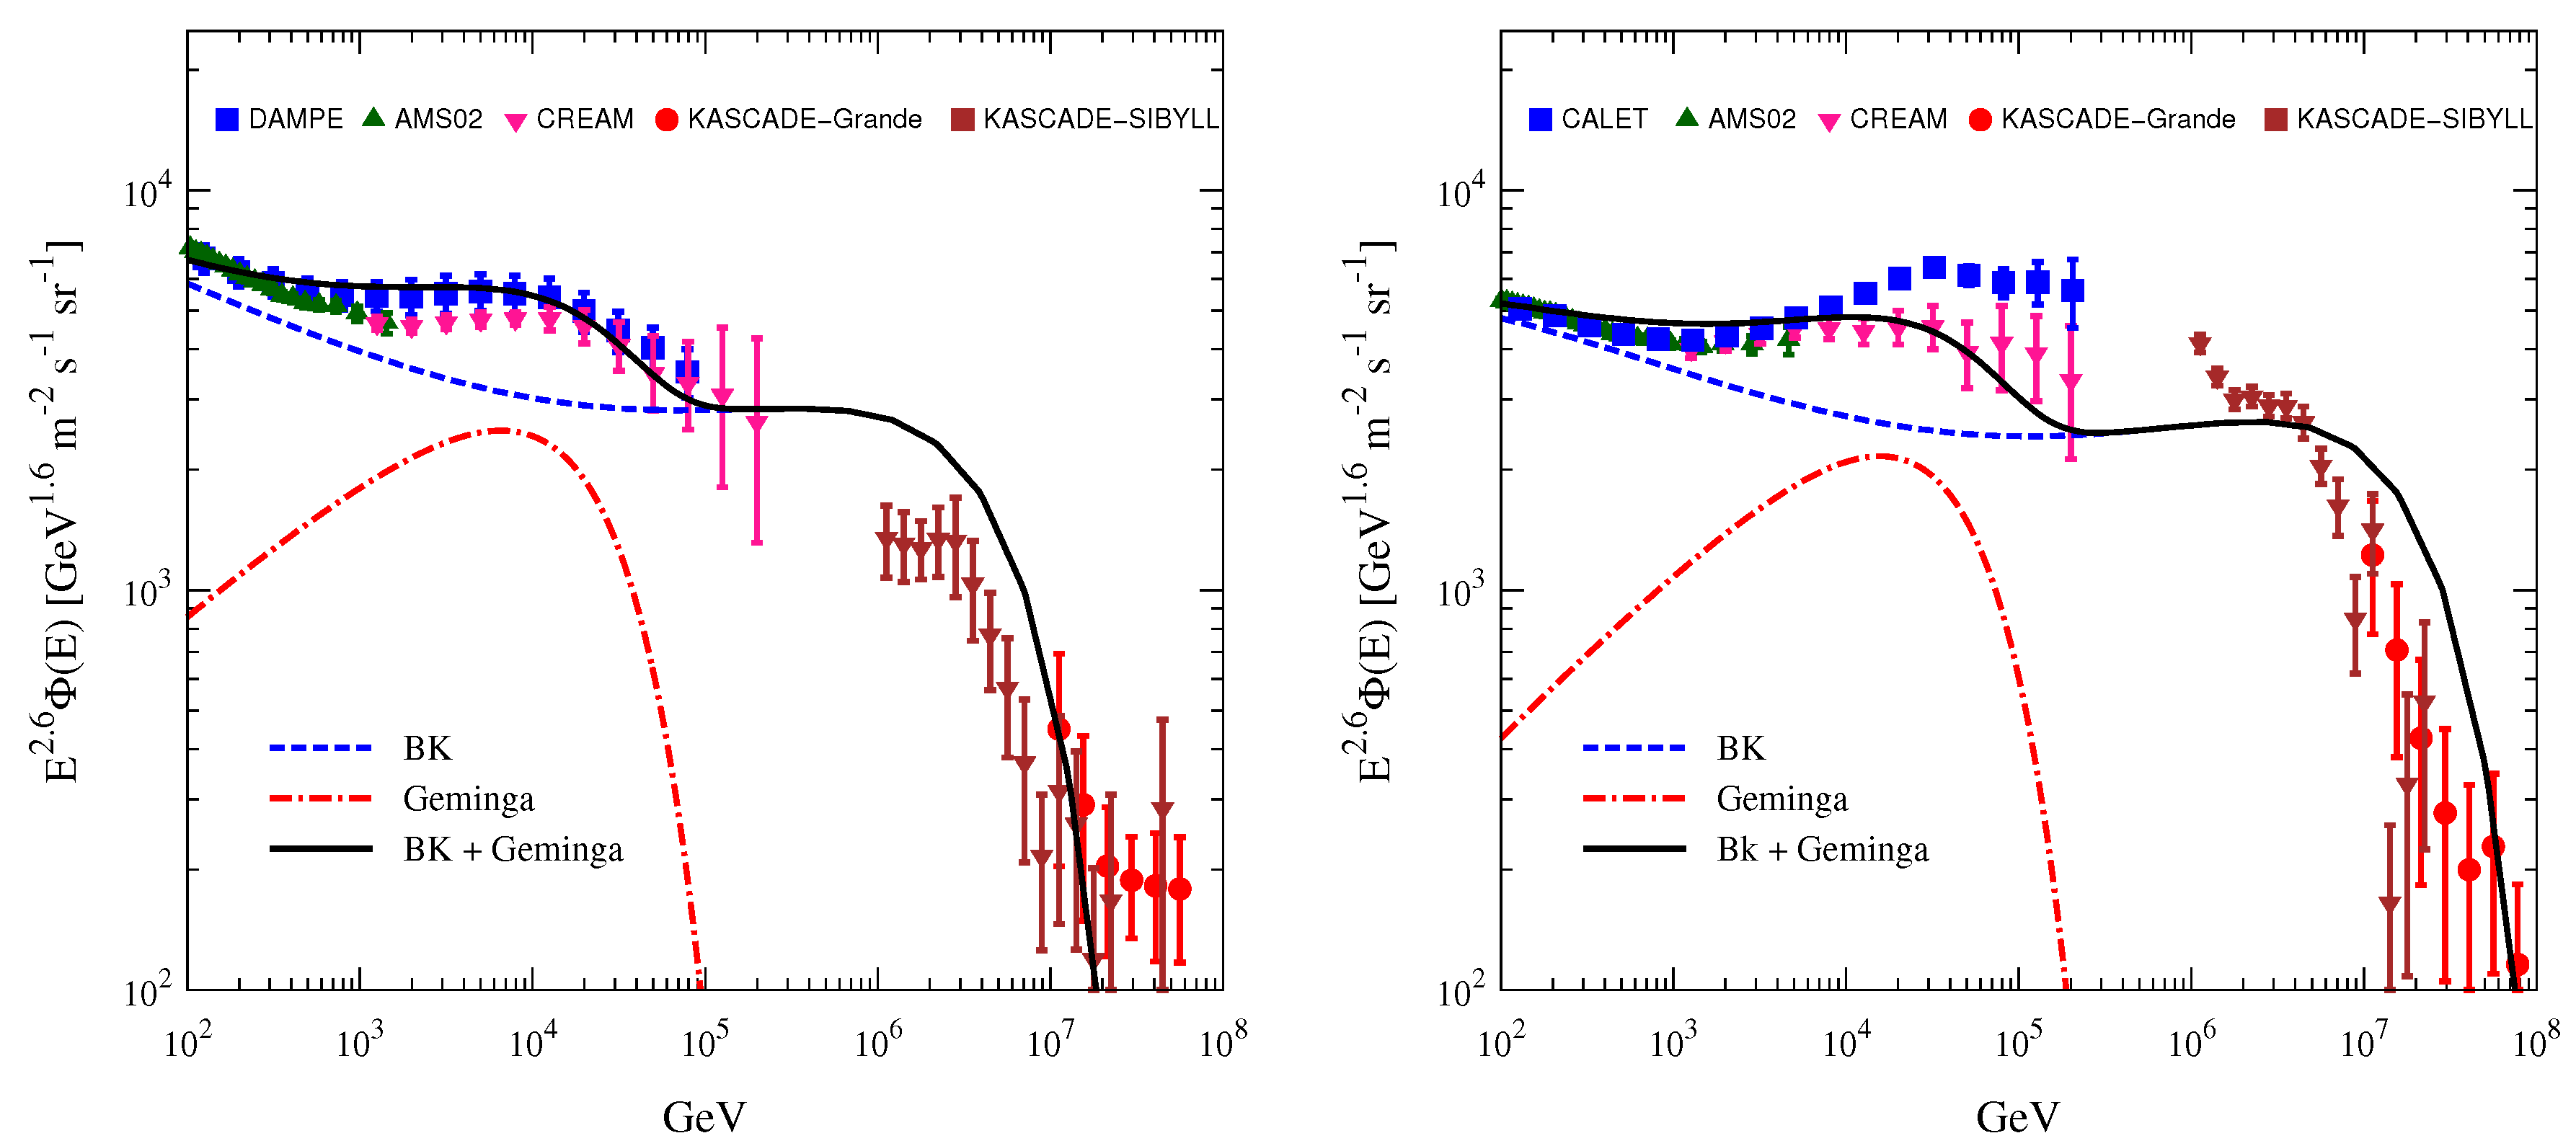
Figure 2 shows the proton (left) and helium (right) spectra, with the red dash-dotted, blue dashed, and black solid lines representing the contributions from the nearby Geminga source, background sources, and sum of all, respectively. It is evident that the Geminga source significantly contributes to the hardening of the proton and helium nucleus energy spectra at 200 GeV. The corresponding injection parameters for the background and Geminga sources are listed in Table 1. The spectral indices of the nearby source component are slightly harder than those of the background component, enhancing the fit to the observed data. To explain the softening observed at tens of TeV in the proton and helium spectra, the cutoff rigidity of the nearby source has been determined to be 22 TV. Furthermore, to accurately depict the all-particle spectra and the cutoffs of proton and helium at PeV energies, the cutoff rigidity of the background sources is established at 5 PV. It is apparent that the contribution by the nearby Geminga SNR source can simultaneously account for both the spectral hardening features at R 200 GV and the softening features at R 10 TV.
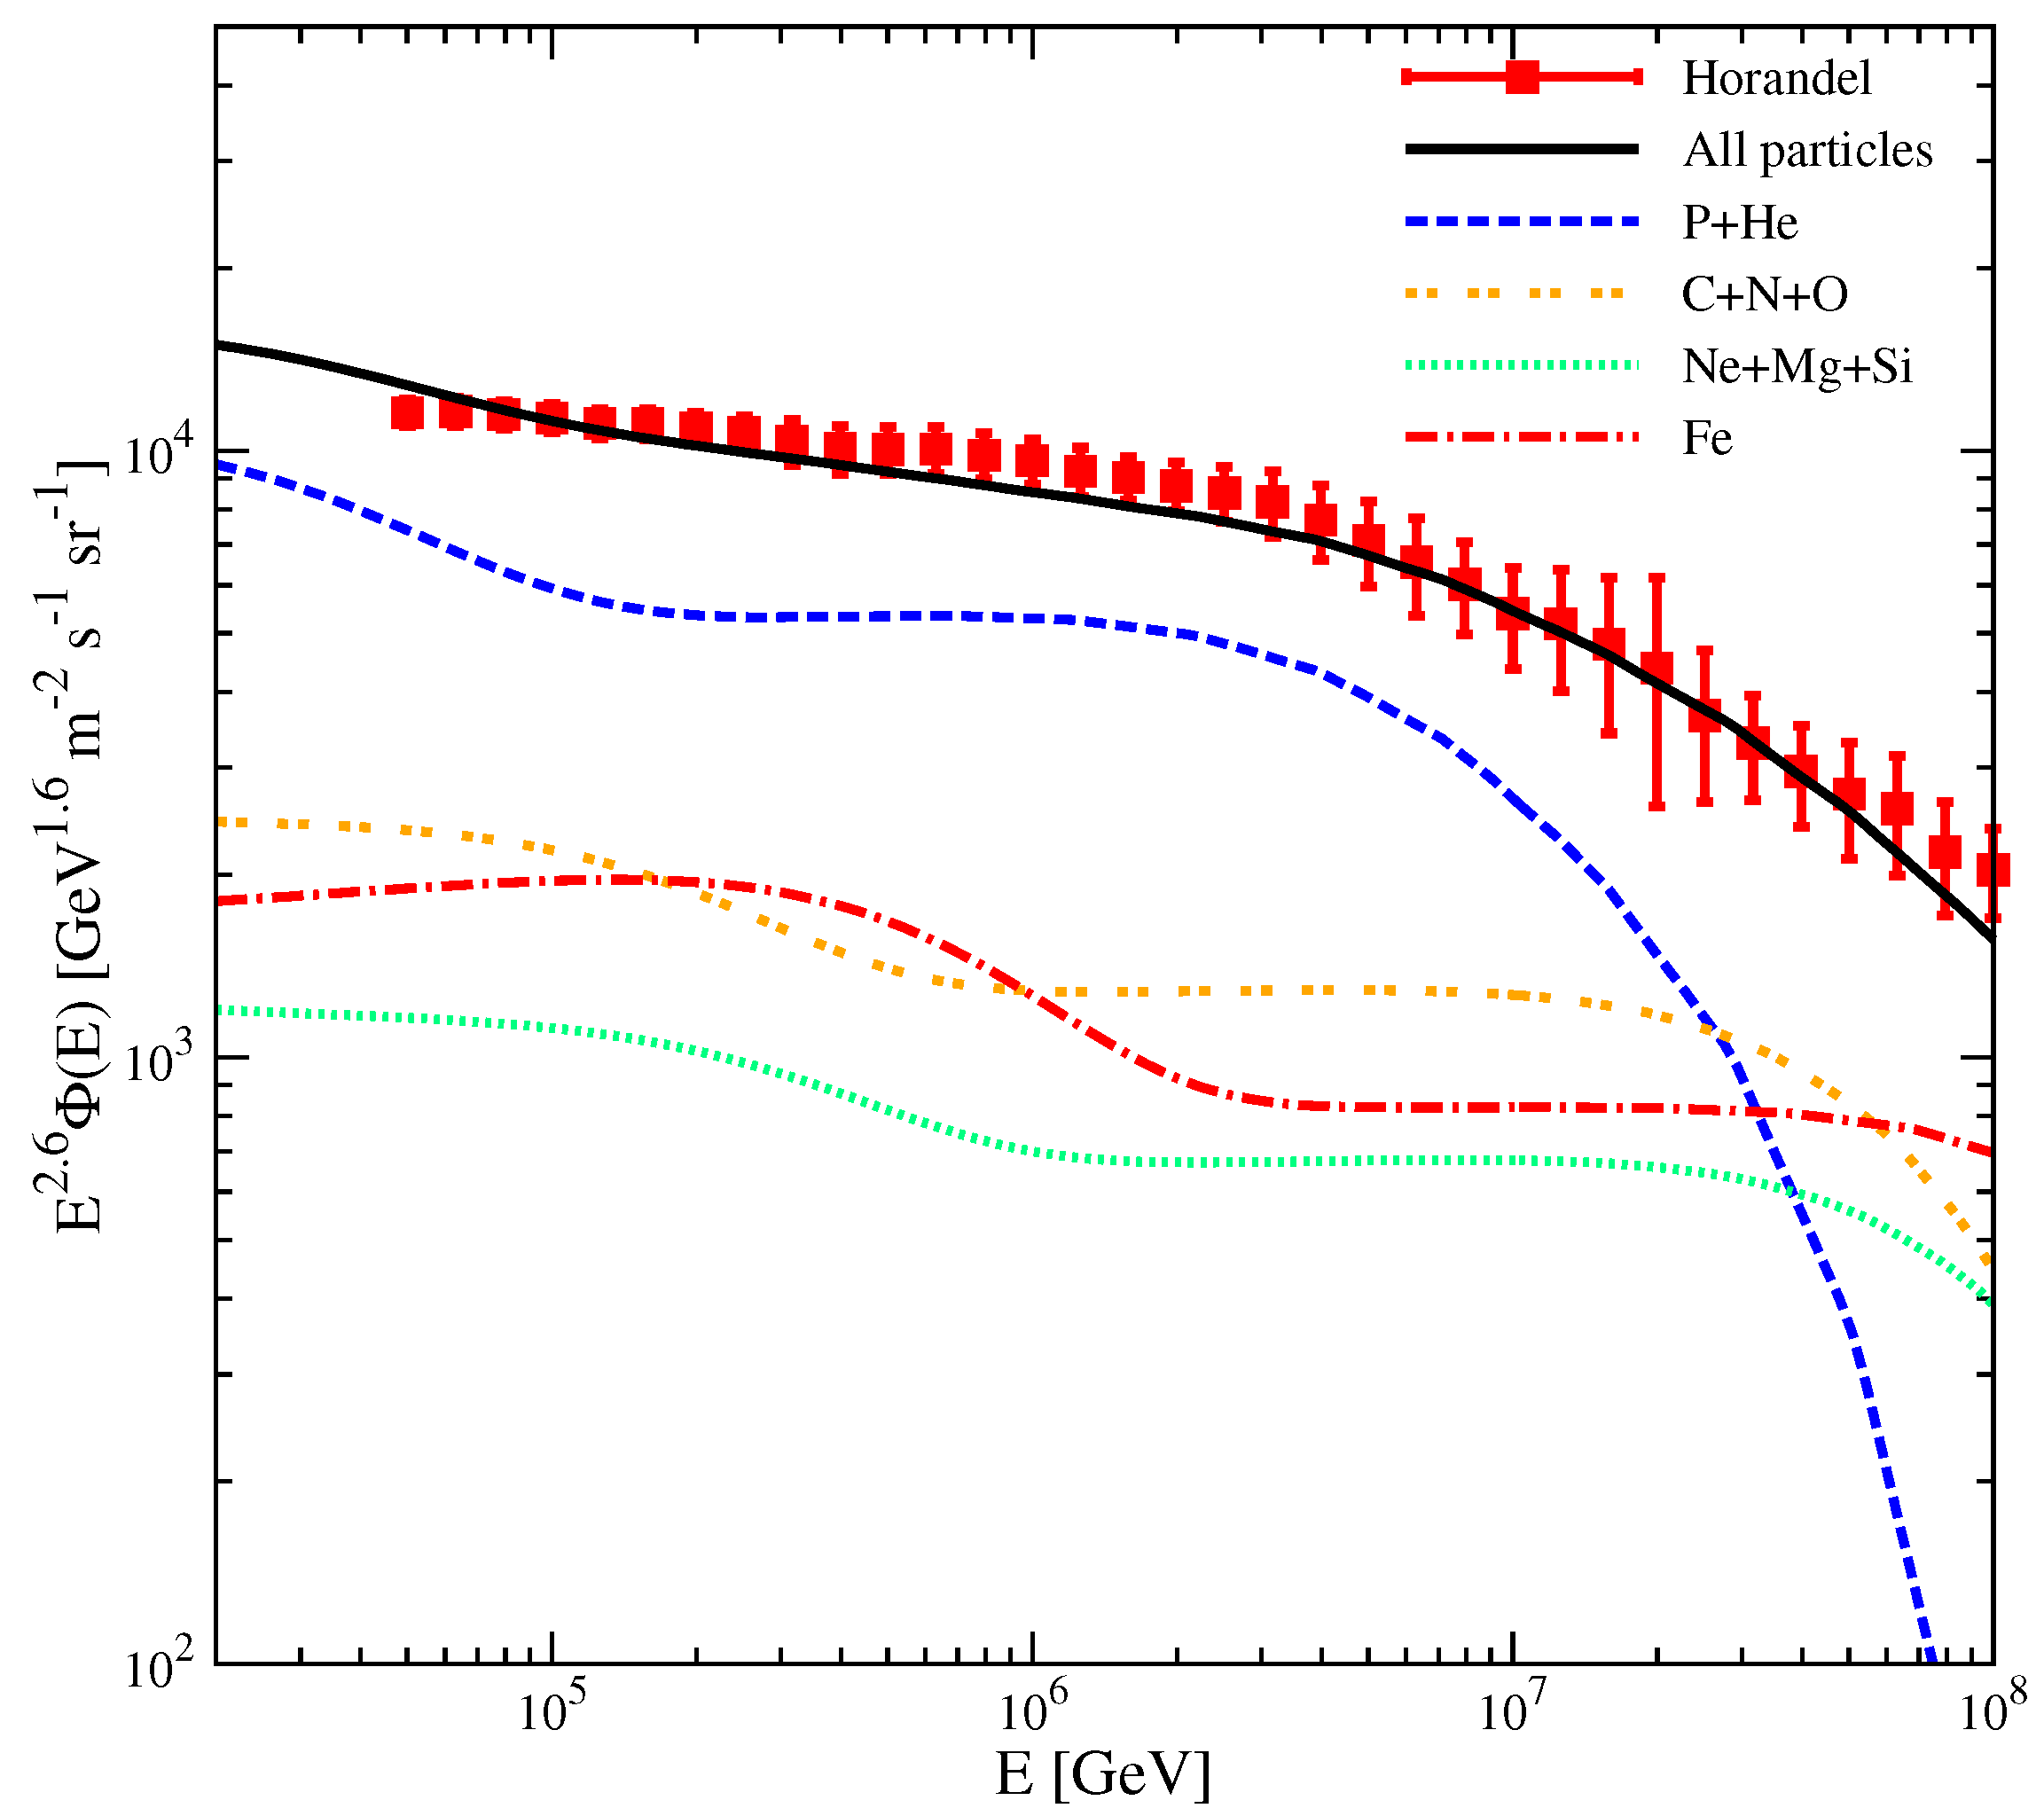
We also present the all-particle spectrum of CRs, as shown in Figure 3. These results are in good agreement with the Hörandel experiment and successfully reproduce the “knee” structure.

3.2. Anisotropy

Contrary to the energy spectra of CRs, the LRMF can significantly deflect the propagation direction of CRs below 100 TeV, subsequently influencing the dipole anisotropy. Therefore, when calculating the anisotropy, we incorporate the anisotropic diffusion effect of CRs induced by the LRMF. The parameters of the parallel diffusion coefficient D are set to be the same as those of the diffusion coefficient in the isotropic propagation model, as referenced in Section 2.1. CRs included in an energy range of a few GeV to several hundred GeV are believed to propagate faster parallel to the LRMF than perpendicular to it. Therefore, we set D > D , with ε = 0.01 and δ = δ δ = 0.32 .
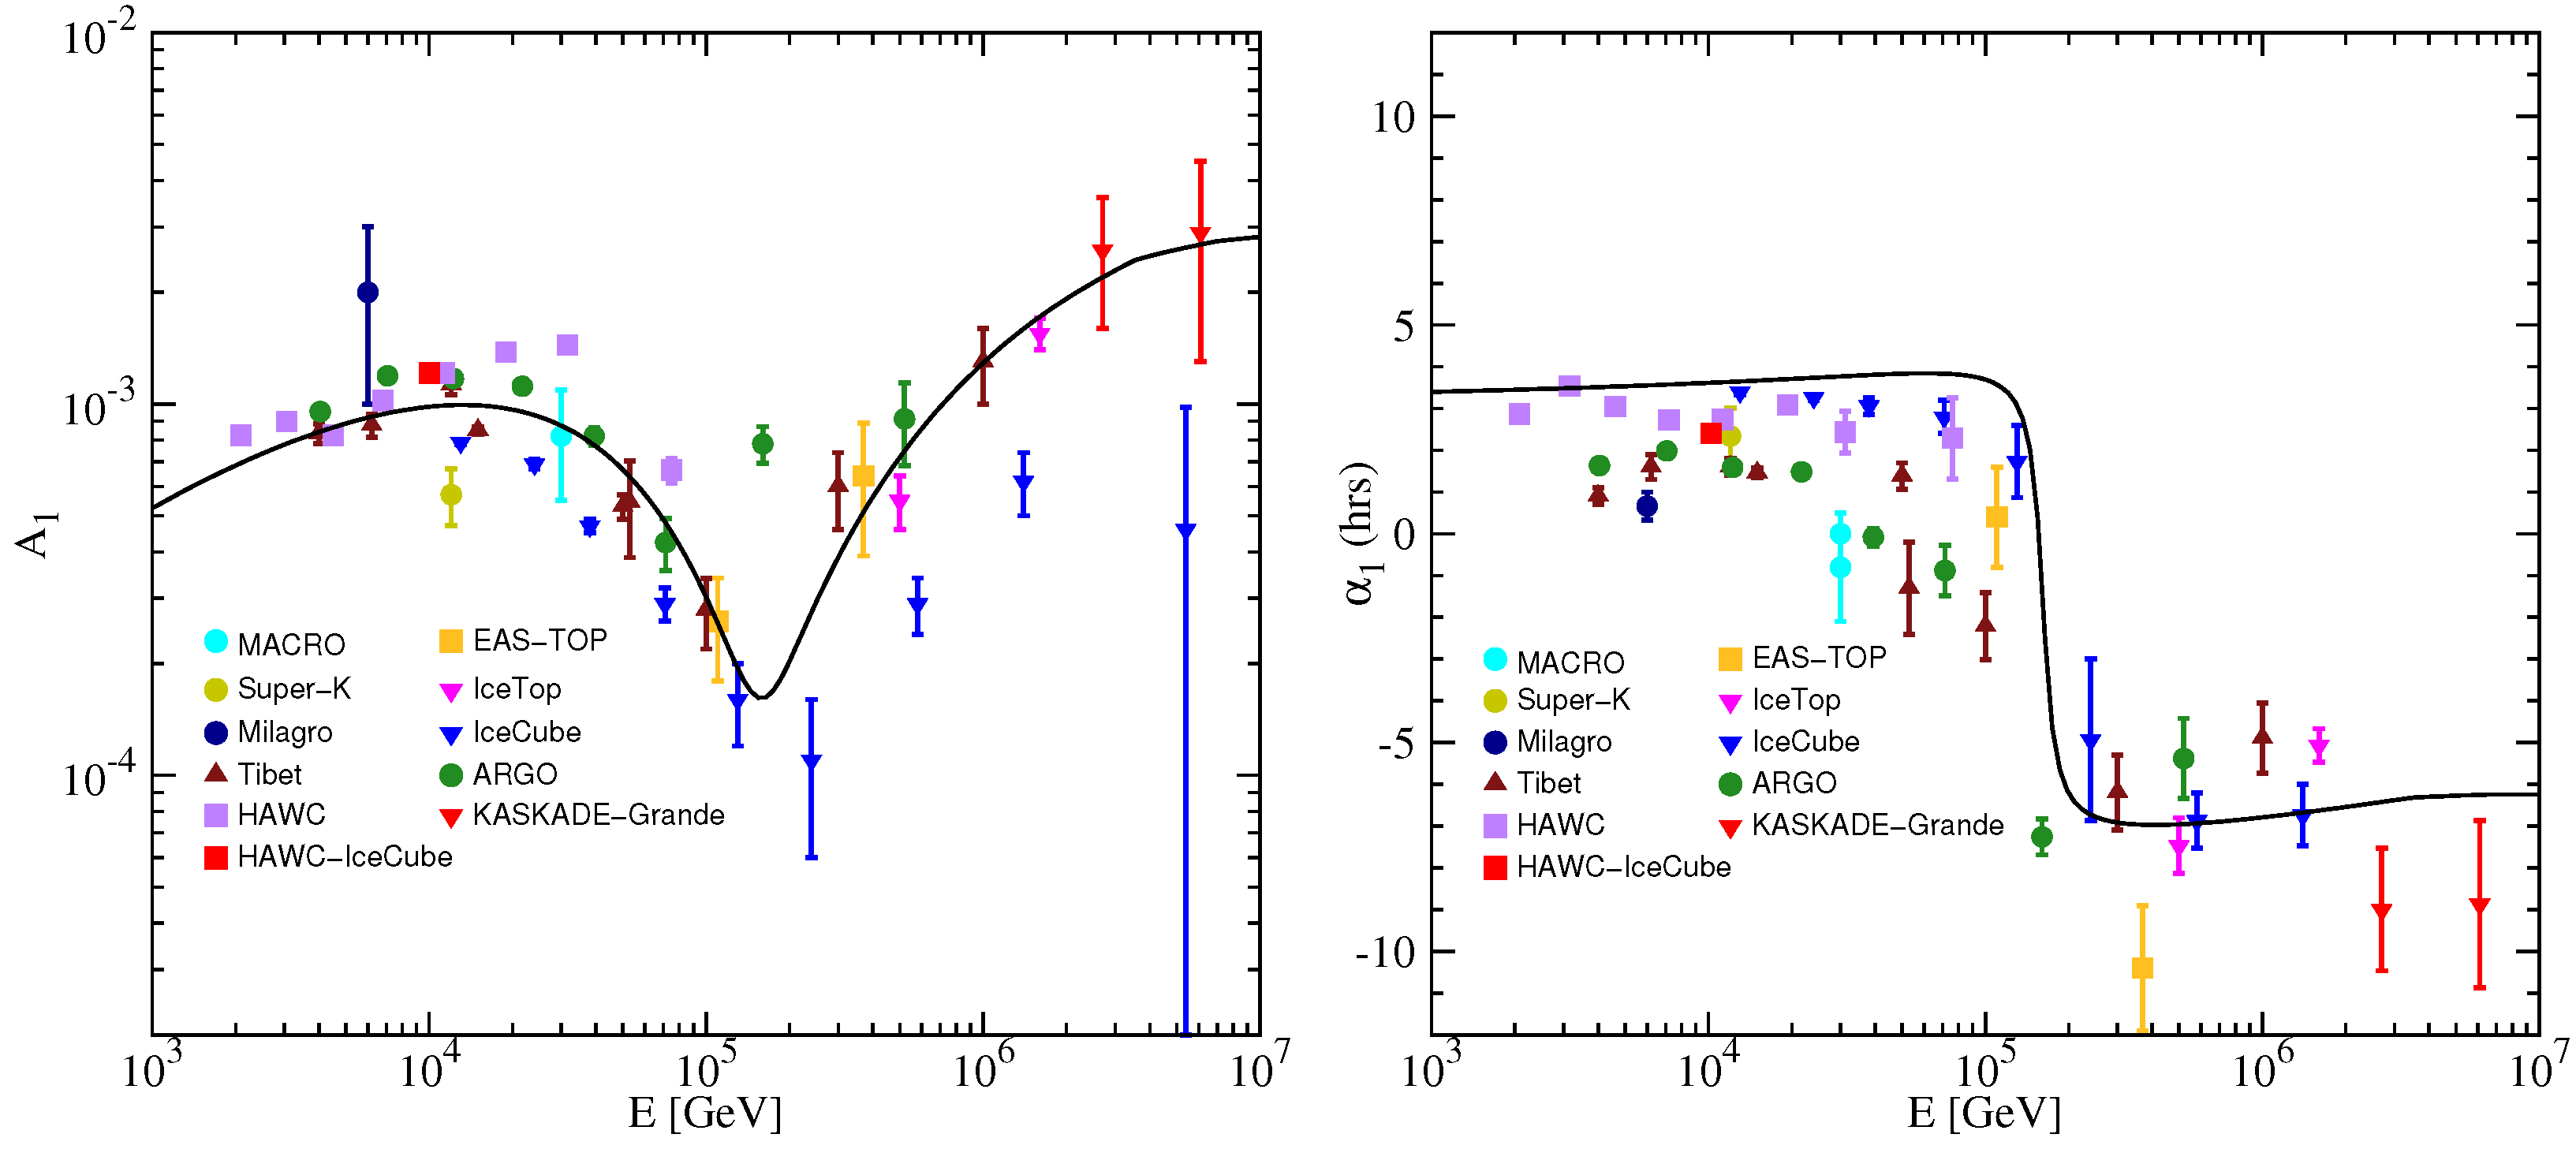
Figure 4 illustrates the evolution of anisotropic amplitude A 1 and phase α 1 with energy, within the context of the spiral distribution of background sources, incorporating contributions from the Geminga SNR and LRMF. It is evident that both the phase and amplitude agree well with experimental data, validating the reasonableness of our model. Below 100 TeV, the phase points in the direction of the LRMF. The results suggest that, although the nearby flux is subdominant, the Geminga source and the deflection caused by the LRMF are the primary factors influencing the anisotropic phase. Above 100 TeV, the phase points to the GC, indicating background sources dominate, since galactic CR sources are more abundant in the inner galaxy.
We conducted a comparison of the results obtained from the spiral and axisymmetric source distribution, with the latter referencing our previous work [38,42]. It was found that the energy spectra and anisotropies under both source distribution models align well with experimental observations. However, the propagation parameters and spectral indices of the sources differ. The diffusion coefficient for the spiral distribution is larger than that for the axisymmetric distribution, and the spectral index of the former is slightly harder than that of the latter. These differences may be attributed to the fact that the source distribution affects the propagation of CRs.
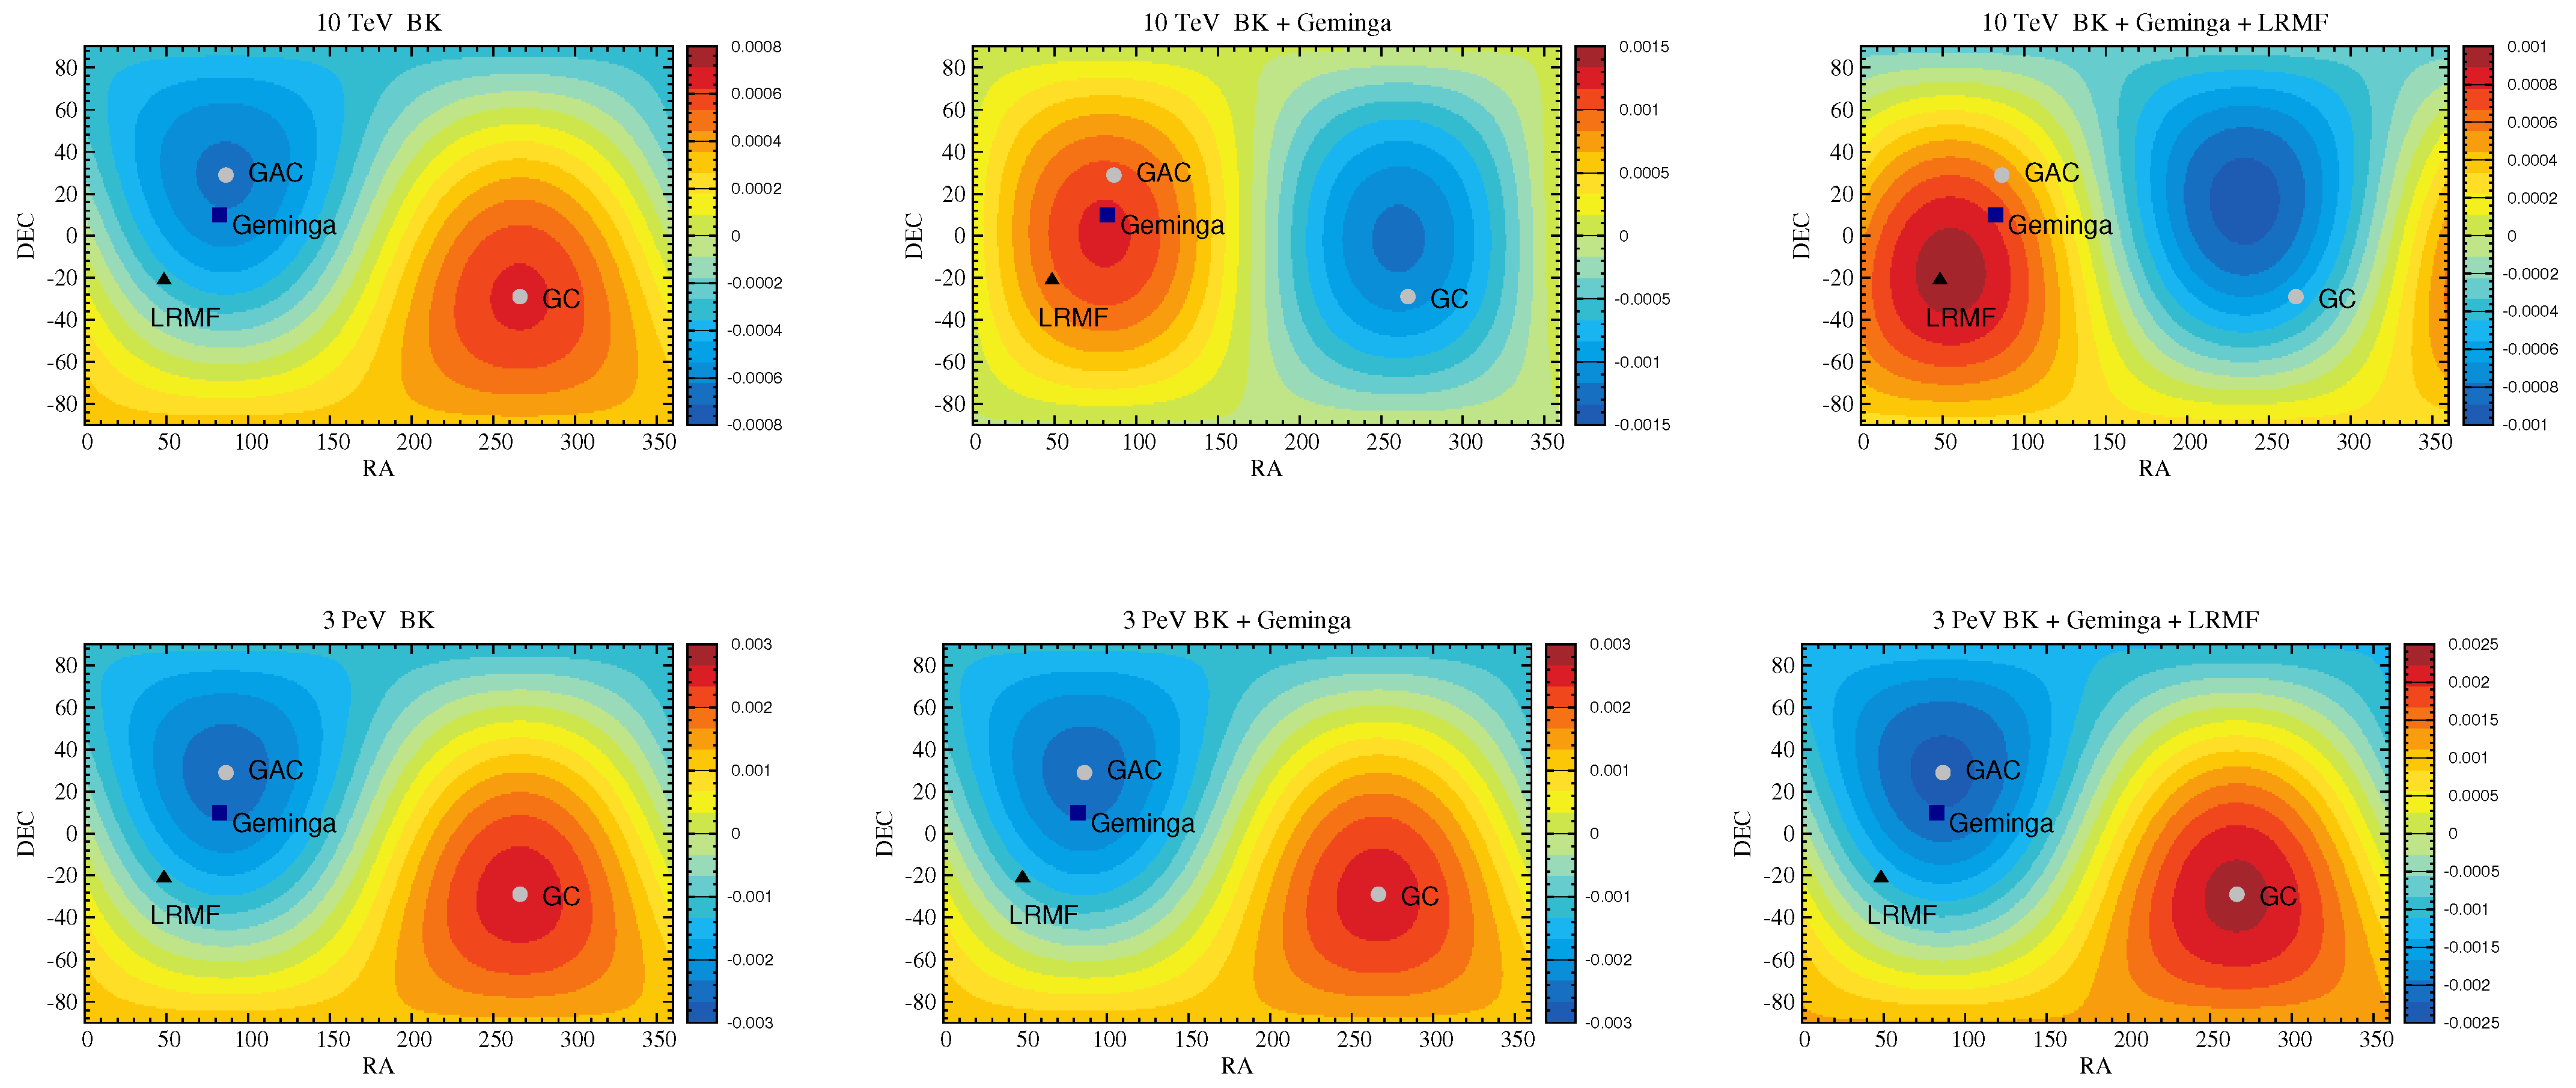
In order to further understand the impacts of background sources, nearby sources, and the LRMF on anisotropy, we present 2D anisotropy sky maps as a function of right ascension RA and declination DEC, illustrating the contribution of each factor. Figure 5 displays the 2D anisotropic sky maps at 10 TeV (top) and 3 PeV (bottom), where the left, middle, and right are the results of background sources (BK), background sources plus the nearby Geminga source (BK + Geminga), and background sources plus the nearby Geminga source plus the LRMF (BK + Geminga + LRMF), respectively. In the low-energy region, when only the background sources are considered, the anisotropy points to the GC, as illustrated in Figure 5 (10 TeV BK). The result is clearly inconsistent with experimental observations. When the contribution of the nearby Geminga source is introduced, the phase points towards Geminga, as shown in Figure 5 (10 TeV BK + Geminga). This variation is attributed to the fact that the nearby source significantly alters the gradient of CR intensity in its direction. While the BK + Geminga model results are closer to those of the experiments, there are still some deviations between them. When the contribution of the LRMF is further introduced, the anisotropy points in the direction of the LRMF. Figure 5 (10 TeV BK + Geminga +LRMF) is completely consistent with the experimental observations. This good agreement is due to the anisotropic diffusion effect of the LRMF on CR particles. Figure 5 (bottom) depicts the 2D anisotropic sky maps in the high-energy region, influenced by various factors. Above 100 TeV, the anisotropic sky maps exhibit a relatively straightforward pattern, with the phase consistently directed towards the GC. This indicates that the contribution of background sources is predominant, whereas the contribution of the nearby source is nearly negligible. Additionally, it suggests that the LRMF is unable to deflect CRs at energies exceeding 100 TeV.

4. Summary

Recently, a large number of scientific observations have confirmed that the Milky Way possesses a spiral arm structure. In our previous work, we developed a self-consistent propagation model to analyze energy spectra and anisotropy, assuming an axisymmetric galactic source distribution. The comprehensive model builds upon the SDP model, while also accounting for the contribution from the nearby Geminga source and the anisotropic diffusion effects of the LRMF on CRs. In this work, we further utilize the model to investigate the energy spectra and anisotropy under the framework of the spiral arm source distribution.
Our model can simultaneously explain spectral hardening at 200 GeV and the amplitude and phase variation of anisotropy with energy from 100 GeV to PeV. We found that the results of the spiral distribution are similar to those of the axisymmetric distribution. However, it is worth noting that their propagation parameters differ. Specifically, the diffusion coefficient of the spiral distribution is larger than that of the axisymmetric distribution, and the spectral indices for the spiral distribution are slightly harder. These discrepancies may be attributed to the influence of the source distribution on the propagation of CRs.
To demonstrate the effects of the nearby Geminga source and LRMF, we compare two-dimensional anisotropy sky maps under various contributing factors. Below 100 TeV, it is clear that the nearby Geminga source contributes to the spectral hardening at 200 GeV. Although the contribution of the nearby source to the CR flux is less than that of the background sources, its impact on the anisotropy is predominant. Under the isotropic diffusion model, the anisotropic phase is approximately oriented towards the direction of the nearby Geminga source. If the anisotropic diffusion effect of the LRMF on CRs is further taken into account, the anisotropic phase shifts to align with the direction of the LRMF. Above 100 TeV, the contribution of background sources becomes dominant, and the anisotropic phase is consistently directed towards the GC. High-precision experiments, such as the LHAASO experiment [74], will provide valuable measurements of CR spectra and anisotropies in the future, which will verify our model.

Author Contributions

Conceptualization, A.L. and W.L.; methodology, A.L. and Y.G.; software, Z.L. and F.Z.; validation, A.L., Y.G. and Z.L.; formal analysis, W.L. and Z.L.; investigation, A.L.; resources, A.L. and Z.L.; data curation, W.L.; writing—original draft preparation, A.L. and Y.G.; writing—review and editing, A.L. and W.L.; visualization, A.L. and Y.G.; supervision, A.L. and W.L.; project administration, W.L.; funding acquisition, A.L. All authors have read and agreed to the published version of the manuscript.

Funding

This work is supported by the National Natural Science Foundation of China (U2031110, 11963004, 12275279) and Shandong Province Natural Science Foundation (ZR2020MA095).

Data Availability Statement

Data are contained within the article.

Conflicts of Interest

The authors declare no conflicts of interest.

References

  1. Panov, A.D.; Adams, J.H.; Ahn, H.S.; Batkov, K.E.; Bashindzhagyan, G.L.; Watts, J.W.; Wefel, J.P.; Wu, J.; Ganel, O.; Guzik, T.G.; et al. Elemental energy spectra of cosmic rays from the data of the ATIC-2 experiment. Bull. Russ. Acad. Sci. Phys. 2007, 71, 494–497. [Google Scholar] [CrossRef]
  2. Ahn, H.S.; Allison, P.; Bagliesi, M.G.; Beatty, J.J.; Bigongiari, G.; Childers, J.T.; Conklin, N.B.; Coutu, S.; DuVernois, M.A.; Ganel, O.; et al. Discrepant Hardening Observed in Cosmic-ray Elemental Spectra. Astrophys. J. Lett. 2010, 714, L89–L93. [Google Scholar] [CrossRef]
  3. Yoon, Y.S.; Ahn, H.S.; Allison, P.S.; Bagliesi, M.G.; Beatty, J.J.; Bigongiari, G.; Boyle, P.J.; Childers, J.T.; Conklin1, N.B.; Coutu, S.; et al. Cosmic-ray Proton and Helium Spectra from the First CREAM Flight. Astrophys. J. 2011, 728, 122. [Google Scholar] [CrossRef]
  4. Adriani, O.; Barbarino, G.C.; Bazilevskaya, G.A.; Bellotti, R.; Boezio, M.; Bogomolov, E.A.; Bonechi, L.; Bongi, M.; Bonvicini, V.; Borisov, S.; et al. PAMELA Measurements of Cosmic-Ray Proton and Helium Spectra. Science 2011, 332, 69. [Google Scholar] [CrossRef] [PubMed]
  5. Aguilar, M.; Aisa, D.; Alpat, B.; Alvino, A.; Ambrosi, G.; Andeen, K.; Arruda, L.; Attig, N.; Azzarello, P.; Bachlechner, A.; et al. Precision Measurement of the Proton Flux in Primary Cosmic Rays from Rigidity 1 GV to 1.8 TV with the Alpha Magnetic Spectrometer on the International Space Station. Phys. Rev. Lett. 2015, 114, 171103. [Google Scholar] [CrossRef] [PubMed]
  6. Aguilar, M.; Aisa, D.; Alpat, B.; Alvino, A.; Ambrosi, G.; Andeen, K.; Arruda, L.; Attig, N.; Azzarello, P.; Bachlechner, A.; et al. Precision Measurement of the Helium Flux in Primary Cosmic Rays of Rigidities 1.9 GV to 3 TV with the Alpha Magnetic Spectrometer on the International Space Station. Phys. Rev. Lett. 2015, 115, 211101. [Google Scholar] [CrossRef] [PubMed]
  7. DAMPE Collaboration; An, Q.; Asfandiyarov, R.; Azzarello, P.; Bernardini, P.; Bi, X.J.; Cai, M.S.; Chang, J.; Chen, D.Y.; Chen, H.F.; et al. Measurement of the cosmic ray proton spectrum from 40 GeV to 100 TeV with the DAMPE satellite. Sci. Adv. 2019, 5, eaax3793. [Google Scholar]
  8. Adriani, O.; Akaike, Y.; Asano, K.; Asaoka, Y.; Bagliesi, M.G.; Berti, E.; Bigongiari, G.; Binns, W.R.; Bonechi, S.; Bongi, M.; et al. Direct Measurement of the Cosmic-Ray Proton Spectrum from 50 GeV to 10 TeV with the Calorimetric Electron Telescope on the International Space Station. Phys. Rev. Lett. 2019, 112, 181102. [Google Scholar] [CrossRef]
  9. Alemanno, F.; An, Q.; Azzarello, P.; Barbato, F.C.T.; Bernardini, P.; Bi, X.J.; Cai, M.S.; Catanzani, E.; Chang, J.; Chen, D.Y.; et al. Measurement of the Cosmic Ray Helium Energy Spectrum from 70 GeV to 80 TeV with the DAMPE Space Mission. Phys. Rev. Lett. 2021, 126, 201102. [Google Scholar] [CrossRef] [PubMed]
  10. Yoon, Y.S.; Anderson, T.; Barrau, A.; Conklin, N.B.; Coutu, S.; Derome, L.; Han, J.H.; Jeon, J.A.; Kim, K.C.; Kim, M.H.; et al. Proton and Helium Spectra from the CREAM-III Flight. Astrophys. J. 2017, 839, 5. [Google Scholar] [CrossRef]
  11. Atkin, E.; Bulatov, V.; Dorokhov, V.; Gorbunov, N.; Filippov, S.; Grebenyuk, V.; Karmanov, D.; Kovalev, I.; Kudryashov, I.; Kurganov, A.; et al. New Universal Cosmic-Ray Knee near a Magnetic Rigidity of 10 TV with the NUCLEON Space Observatory. J. Exp. Theor. Phys. Lett. 2018, 108, 5–12. [Google Scholar] [CrossRef]
  12. Adriani, O.; Akaike, Y.; Asano, K.; Asaoka, Y.; Berti, E.; Bigongiari, G.; Binns, W.R.; Bongi, M.; Brogi, P.; Bruno, A.; et al. Direct Measurement of the Cosmic-Ray Helium Spectrum from 40 GeV to 250 TeV with the Calorimetric Electron Telescope on the International Space Station. J. Exp. Theor. Phys. Lett. 2023, 130, 171002. [Google Scholar] [CrossRef] [PubMed]
  13. Thoudam, S.; Hörandel, J.R. Nearby supernova remnants and the cosmic ray spectral hardening at high energies. Mon. Not. Roy. Astron. Soc. 2012, 421, 1209–1214. [Google Scholar] [CrossRef]
  14. Liu, W.; Guo, Y.Q.; Yuan, Q. Indication of nearby source signatures of cosmic rays from energy spectra and anisotropies. J. Cosmol. Astropart. Phys. 2019, 10, 010. [Google Scholar] [CrossRef]
  15. Biermann, P.L.; Becker, J.K.; Dreyer, J.; Meli, A.; Seo, E.S.; Stanev, T. The Origin of Cosmic Rays: Explosions of Massive Stars with Magnetic Winds and Their Supernova Mechanism. Astrophys. J. 2010, 725, 184–187. [Google Scholar] [CrossRef]
  16. Thoudam, S.; Rachen, J.P.; Van Vliet, A.; Achterberg, A.; Buitink, S.; Falcke, H.; Hörandel, J.R. Cosmic-ray energy spectrum and composition up to the ankle: The case for a second Galactic component. Astron. Astrophys. 2016, 595, A33. [Google Scholar] [CrossRef]
  17. Tomassetti, N. Origin of the Cosmic-Ray Spectral Hardening. Astrophys. J. Lett. 2012, 752, L13. [Google Scholar] [CrossRef]
  18. Yuan, Q.; Zhang, B.; Bi, X.J. Cosmic ray spectral hardening due to dispersion in the source injection spectra. Phys. Rev. D 2011, 84, 043002. [Google Scholar] [CrossRef]
  19. Zatsepin, V.I.; Sokolskaya, N.V. Three component model of cosmic ray spectra from 10 GeV to 100 PeV. Astron. Astrophys. 2006, 458, 1–5. [Google Scholar] [CrossRef]
  20. Amenomori, M.; Ayabe, S.; Bi, X.J.; Chen, D.; Cui, S.W.; Danzengluobu; Ding, L.K.; Ding, X.H.; Feng, C.F.; Feng, Z.; et al. Anisotropy and Corotation of Galactic Cosmic Rays. Science 2006, 314, 439–443. [Google Scholar] [CrossRef]
  21. Amenomori, M.; Bi, X.J.; Chen, D.; Cui, S.W.; Ding, L.K.; Ding, X.H.; Fan, C.; Feng, C.F.; Feng, Z.; Feng, Z.Y.; et al. On Temporal Variations of the Multi-TeV Cosmic Ray Anisotropy using the Tibet III Air Shower Array. Astrophys. J. 2010, 711, 119–124. [Google Scholar]
  22. Amenomori, M.; Bi, X.J.; Chen, D.; Chen, T.L.; Chen, W.Y.; Cui, S.W.; Danzengluobu; Ding, L.K.; Feng, C.F.; Feng, Z.Y.; et al. Northern Sky Galactic Cosmic Ray Anisotropy between 10 and 1000 TeV with the Tibet Air Shower Array. Astrophys. J. 2017, 836, 153. [Google Scholar] [CrossRef]
  23. Guillian, G.; Hosaka, J.; Ishihara, K.; Kameda, J.; Koshio, Y.; Minamino, A.; Mitsuda, C.; Miura, M.; Moriyama, S.; Nakahata, M.; et al. Observation of the anisotropy of 10 TeV primary cosmic ray nuclei flux with the Super-Kamiokande-I detector. Phys. Rev. D 2007, 75, 062003. [Google Scholar] [CrossRef]
  24. Abdo, A.A.; Allen, B.; Aune, T.; Berley, D.; Blaufuss, E.; Casanova, S.; Chen, C.; Dingus, B.L.; Ellsworth, R.W.; Fleysher, L.; et al. Discovery of Localized Regions of Excess 10-TeV Cosmic Rays. Phys. Rev. Lett. 2008, 101, 221101. [Google Scholar] [CrossRef] [PubMed]
  25. Abdo, A.A.; Allen, B.T.; Aune, T.; Berley, D.; Casanova, S.; Chen, C.; Dingus, L.; Ellsworth, R.W.; Fleysher, L.; Fleysher, R.; et al. The Large-Scale Cosmic-Ray Anisotropy as Observed with Milagro. Astrophys. J. 2009, 698, 2121–2130. [Google Scholar] [CrossRef]
  26. Abbasi, R.; Abdou, Y.; Abu-Zayyad, T.; Adams, J.; Aguilar, J.A.; Ahlers, M.; Andeen, K.; Auffenberg, J.; Bai, X.; Baker, M.; et al. Measurement of the Anisotropy of Cosmic-ray Arrival Directions with IceCube. Astrophys. J. Lett. 2010, 718, L194–L198. [Google Scholar] [CrossRef]
  27. Abbasi, R.; Abdou, Y.; Abu-Zayyad, T.; Adams, J.; Aguilar, J.A.; Ahlers, M.; Altmann, D.; Andeen, K.; Auffenberg, J.; Bai, X.; et al. Observation of Anisotropy in the Arrival Directions of Galactic Cosmic Rays at Multiple Angular Scales with IceCube. Astrophys. J. 2011, 740, 16. [Google Scholar] [CrossRef]
  28. Abbasi, R.; Abdou, Y.; Abu-Zayyad, T.; Ackermann, M.; Adams, J.; Aguilar, J.A.; Ahlers, M.; Allen, M.M.; Altmann, D.; Andeen, K.; et al. Observation of Anisotropy in the Galactic Cosmic-Ray Arrival Directions at 400 TeV with IceCube. Astrophys. J. 2011, 746, 33. [Google Scholar] [CrossRef]
  29. Aartsen, M.G.; Abbasi, R.; Abdou, Y.; Ackermann, M.; Adams, J.; Aguilar, J.A.; Ahlers, M.; Altmann, D.; Andeen, K.; Auffenberg, J.; et al. Observation of Cosmic-Ray Anisotropy with the IceTop Air Shower Array. Astrophys. J. 2013, 765, 55. [Google Scholar] [CrossRef]
  30. Aartsen, M.G.; Abraham, K.; Ackermann, M.; Adams, J.; Aguilar, J.A.; Ahlers, M.; Ahrens, M.; Altmann, D.; Anderson, T.; Ansseau, I.; et al. Anisotropy in Cosmic-Ray Arrival Directions in the Southern Hemisphere Based on Six Years of Data from the IceCube Detector. Astrophys. J. 2016, 826, 220. [Google Scholar] [CrossRef]
  31. Bartoli, B.; Bernardini, P.; Bi, X.J.; Bolognino, I.; Branchini, P.; Budano, A.; Calabrese Melcarne, A.K.; Camarri, P.; Cao, Z.; Cardarelli, R.; et al. Medium scale anisotropy in the TeV cosmic ray flux observed by ARGO-YBJ. Phys. Rev. D 2013, 88, 082001. [Google Scholar] [CrossRef]
  32. Bartoli, B.; Bernardini, P.; Bi, X.J.; Cao, Z.; Catalanotti, S.; Chen, S.Z.; Chen, T.L.; Cui, S.W.; Dai, B.Z.; D’Amone, A.; et al. ARGO-YBJ Observation of the Large-scale Cosmic Ray Anisotropy During the Solar Minimum between Cycles 23 and 24. Astrophys. J. 2015, 809, 90. [Google Scholar] [CrossRef]
  33. Aglietta, M.; Alekseenko, V.V.; Alessandro, B.; Antonioli, P.; Arneodo, F.; Bergamasco, L.; Bertaina, M.; Bonino, R.; Castellina, A.; Chiavassa, A.; et al. Evolution of the Cosmic-Ray Anisotropy Above 1014 eV. Astrophys. J. 2009, 692, L130–L133. [Google Scholar] [CrossRef]
  34. Chiavassa, A.; Apel, W.; Arteaga-Velazquez, J.; Bekk, K.; Bertaina, M.; Blümer, J.; Bozdog, H.; Brancus, I.M.; Cantoni, E.; Cossavella, F.; et al. A study of the first harmonic of the large scale anisotropies with the KASCADE-Grande experiment. In Proceedings of the 34th International Cosmic Ray Conference (ICRC2015), Den Haag, The Netherlands, 30 July–6 August 2015; Volume 236, p. 281. [Google Scholar]
  35. Apel, W.D.; Arteaga-Velázquez, J.C.; Bekk, K.; Bertaina, M.; Blümer, J.; Bonino, R.; Bozdog, H.; Brancus, I.M.; Cantoni1, E.; Chiavassa, A.; et al. Search for Large-scale Anisotropy in the Arrival Direction of Cosmic Rays with KASCADE-Grande. Astrophys. J. 2019, 870, 91. [Google Scholar] [CrossRef]
  36. Abeysekara, A.U.; Alfaro, R.; Alvarez, C.; Álvarez, J.D.; Arceo, R.; Arteaga-Velázquez, J.C.; Solares, H.A.A.; Barber, A.S.; Baughman, B.M.; Bautista-Elivar, N.; et al. Observation of Small-scale Anisotropy in the Arrival Direction Distribution of TeV Cosmic Rays with HAWC. Astrophys. J. 2014, 796, 108. [Google Scholar] [CrossRef]
  37. Abeysekara, A.U.; Alfaro, R.; Alvarez, C.; Álvarez, J.D.; Arceo, R.; Arteaga-Velázquez, J.C.; Rojas, D.A.; Solares, H.A.A.; Becerril, A.; Belmont-Moreno, E.; et al. Observation of Anisotropy of TeV Cosmic Rays with Two Years of HAWC. Astrophys. J. 2018, 865, 57. [Google Scholar] [CrossRef]
  38. Li, A.; Yin, S.; Liu, M.; Wang, H.; Li, X.; Li, Y. Interpretation of the Spectra and Anisotropy of Galactic Cosmic Rays. Universe 2022, 8, 307. [Google Scholar] [CrossRef]
  39. Abeysekara, A.U.; Alfaro, R.; Alvarez, C.; Arceo, R.; Arteaga-Velázquez, J.C.; Rojas, D.A.; Belmont-Moreno, E.; BenZvi, S.Y.; Brisbois, C.; Capistrán, T.; et al. All-sky Measurement of the Anisotropy of Cosmic Rays at 10 TeV and Mapping of the Local Interstellar Magnetic Field. Astrophys. J. 2019, 871, 96. [Google Scholar] [CrossRef]
  40. Ahlers, M. Deciphering the Dipole Anisotropy of Galactic Cosmic Rays. Phys. Rev. Lett. 2016, 117, 151103. [Google Scholar] [CrossRef]
  41. Compton, A.H.; Getting, I.A. An Apparent Effect of Galactic Rotation on the Intensity of Cosmic Rays. Phys. Rev. 1935, 47, 817–821. [Google Scholar] [CrossRef]
  42. Li, A.-f.; Yuan, Q.; Liu, W.; Guo, Y.-q. Large-scale Anisotropy of Galactic Cosmic Rays as a Probe of Local Cosmic-Ray Propagation. Astrophys. J. 2024, 962, 43. [Google Scholar] [CrossRef]
  43. Levine, E.S.; Blitz, L.; Heiles, C. The Spiral Structure of the Outer Milky Way in Hydrogen. Science 2006, 312, 1773–1777. [Google Scholar] [CrossRef] [PubMed]
  44. Xu, Y.; Hou, L.G.; Bian, S.B.; Hao, C.J.; Liu, D.J.; Li, J.J.; Li, Y.J. Local spiral structure based on the Gaia EDR3 parallaxes. Astron. Astrophys. 2021, 645, L8. [Google Scholar] [CrossRef]
  45. Tian, Z.; Liu, W.; Yang, B.; Fu, X.-D.; Xu, H.-B.; Yao, Y.-H.; Guo, Y.-Q. Electron and positron spectra in three-dimensional spatial-dependent propagation. model. Chin. Phys. C 2022, 44, 085102. [Google Scholar] [CrossRef]
  46. Zhang, P.-p.; Qiao, B.-q.; Liu, W.; Cui, S.-w.; Yuan, Q.; Guo, Y.-q. Possible bump structure of cosmic ray electrons unveiled by AMS-02 data and its common origin along with the nuclei and positron. J. Cosmol. Astropart. Phys. 2021, 5, 012. [Google Scholar] [CrossRef]
  47. Guo, Y.-Q.; Tian, Z.; Jin, C. Spatial-dependent Propagation of Cosmic Rays Results in the Spectrum of Proton, Ratios of p/p, and B/C, and Anisotropy of Nuclei. Astrophys. J. 2016, 819, 54. [Google Scholar] [CrossRef]
  48. Liu, W.; Yao, Y.-h.; Guo, Y.-Q. Revisiting the Spatially Dependent Propagation Model with the Latest Observations of Cosmic-Ray Nuclei. Astrophys. J. 2016, 869, 176. [Google Scholar] [CrossRef]
  49. Yuan, Q.; Qiao, B.-Q.; Guo, Y.-Q.; Fan, Y.-Z.; Bi, X.-J. Nearby source interpretation of differences among light and medium composition spectra in cosmic rays. Front. Phys. 2021, 16, 24501. [Google Scholar] [CrossRef]
  50. Guo, Y.-Q.; Yuan, Q. Understanding the spectral hardenings and radial distribution of Galactic cosmic rays and Fermi diffuse γ rays with spatially-dependent propagation. Phys. Rev. D 2018, 97, 063008. [Google Scholar] [CrossRef]
  51. Qiao, B.-Q.; Liu, W.; Guo, Y.-Q.; Yuan, Q. Anisotropies of different mass compositions of cosmic rays. J. Cosmol. Astropart. Phys. 2019, 12, 007. [Google Scholar] [CrossRef]
  52. Zhao, B.; Liu, W.; Yuan, Q.; Hu, H.B.; Bi, X.J.; Wu, H.R.; Zhou, X.-X.; Guo, Y.-Q. Geminga SNR: Possible Candidate of the Local Cosmic-Ray Factory. Astrophys. J. 2022, 926, 41. [Google Scholar] [CrossRef]
  53. Abeysekara, A.U.; Alfaro, R.; Alvarez, C.; Arceo, R.; Arteaga-Velázquez, J.C.; Avila Rojas, D.; Ayala Solares, H.A.; Barber, A.S.; Bautista-Elivar, N.; Becerril, A.; et al. Extended gamma-ray sources around pulsars constrain the origin of the positron flux at Earth. Science 2017, 358, 911–914. [Google Scholar] [CrossRef] [PubMed]
  54. Aharonian, F.; An, Q.; Axikegu; Bai, L.X.; Bai, Y.X.; Bao, Y.W.; Bastieri, D.; Bi, X.J.; Cai, H.J.; Cai, T.; et al. Extended Very-High-Energy Gamma-Ray Emission Surrounding PSR J 0622 +3749 Observed by LHAASO-KM2A. Phys. Rev. Lett. 2021, 126, 241103. [Google Scholar] [CrossRef]
  55. Strong, A.W.; Moskalenko, I.V. Propagation of cosmic-ray nucleons in the galaxy. Astrophys. J. 1998, 509, 212–228. [Google Scholar] [CrossRef]
  56. Evoli, C.; Gaggero, D.; Vittino, A.; Di Bernardo, G.; Di Mauro, M.; Ligorini, A.; Ullio, P.; Grasso, D. Cosmic-ray propagation with DRAGON2: I. numerical solver and astrophysical ingredients. J. Cosmol. Astropart. Phys. 2017, 2, 015. [Google Scholar] [CrossRef]
  57. Kissmann, R. PICARD: A novel code for the Galactic Cosmic Ray propagation problem. Astropart. Phys. 2014, 55, 37–50. [Google Scholar] [CrossRef]
  58. Case, G.; Bhattacharya, D. Revisiting the galactic supernova remnant distribution. Astron. Astrophys. Suppl. 1996, 120, 437–440. [Google Scholar]
  59. Faucher-Giguère, C.-A.; Kaspi, V.M. Birth and Evolution of Isolated Radio Pulsars. Astrophys. J. 2006, 643, 332–355. [Google Scholar] [CrossRef]
  60. Blasi, P.; Amato, E. Diffusive propagation of cosmic rays from supernova remnants in the Galaxy. II: Anisotropy. J. Cosmol. Astropart. Phys. 2012, 1, 11. [Google Scholar] [CrossRef]
  61. Sveshnikova, L.G.; Strelnikova, O.N.; Ptuskin, V.S. Spectrum and anisotropy of cosmic rays at TeV-PeV-energies and contribution of nearby sources. Astropart. Phys. 2013, 50–52, 33–46. [Google Scholar] [CrossRef]
  62. Faherty, J.; Walter, F.M.; Anderson, J. The trigonometric parallax of the neutron star Geminga. Astrophys. Space Sci. 2007, 308, 225–230. [Google Scholar] [CrossRef]
  63. Manchester, R.N.; Hobbs, G.B.; Teoh, A.; Hobbs, M. The Australia Telescope National Facility Pulsar Catalogue. Astrophys. J. 2005, 129, 1993–2006. [Google Scholar] [CrossRef]
  64. Funsten, H.O.; DeMajistre, R.; Frisch, P.C.; Heerikhuisen, J.; Higdon, D.M.; Janzen, P.; Larsen, B.A.; Livadiotis, G.; McComas, D.J.; Möbius, E.; et al. Circularity of the Interstellar Boundary Explorer Ribbon of Enhanced Energetic Neutral Atom (ENA) Flux. Astrophys. J. 2013, 776, 30. [Google Scholar] [CrossRef]
  65. Cerri, S.S.; Gaggero, D.; Vittino, A.; Evoli, C.; Grasso, D. A signature of anisotropic cosmic-ray transport in the gamma-ray sky. J. Cosmol. Astropart. Phys. 2017, 10, 019. [Google Scholar] [CrossRef]
  66. Aguilar, M.; Cavasonza, L.A.; Ambrosi, G.; Arruda, L.; Attig, N.; Aupetit, S.; Azzarello, P.; Bachlechner, A.; Barao, F.; Barrau, A.; et al. Precision Measurement of the Boron to Carbon Flux Ratio in Cosmic Rays from 1.9 GV to 2.6 TV with the Alpha Magnetic Spectrometer on the International Space Station. Phys. Rev. Lett. 2016, 117, 231102. [Google Scholar] [CrossRef] [PubMed]
  67. Aguilar, M.; Cavasonza, L.A.; Ambrosi, G.; Arruda, L.; Attig, N.; Aupetit, S.; Azzarello, P.; Bachlechner, A.; Barao, F.; Barrau, A.; et al. Observation of New Properties of Secondary Cosmic Rays Lithium, Beryllium, and Boron by the Alpha Magnetic Spectrometer on the International Space Station. Phys. Rev. Lett. 2018, 120, 021101. [Google Scholar] [CrossRef]
  68. Antoni, T.; Apel, W.D.; Badea, A.F.; Bekk, K.; Bercuci, A.; Blümer, J.; Bozdog, H.; Brancus, I.M.; Chilingarian, A.; Daumiller, K.; et al. KASCADE measurements of energy spectra for elemental groups of cosmic rays: Results and open problems. Astropart. Phys. 2005, 24, 1–25. [Google Scholar] [CrossRef]
  69. Apel, W.D.; Arteaga-Velázquez, J.C.; Bekk, K.; Bertaina, M.; Blümer, J.; Bozdog, H.; Brancus, I.M.; Cantoni, E.; Chiavassa, A.; Cossavella, F.; et al. KASCADE-Grande measurements of energy spectra for elemental groups of cosmic rays. Astropart. Phys. 2013, 47, 54–66. [Google Scholar] [CrossRef]
  70. Hörandel, J. On the knee in the energy spectrum of cosmic rays. Astropart. Phys. 2003, 19, 193–220. [Google Scholar] [CrossRef]
  71. Ambrosio, M.; Antolini, R.; Baldini, A.; Barbarino, G.C.; Barish, B.C.; Battistoni, G.; Becherini, Y.; Bellotti, R.; Bemporad, C.; Bernardini, P.; et al. Search for the sidereal and solar diurnal modulations in the total MACRO muon data set. Phys. Rev. D 2003, 67, 042002. [Google Scholar] [CrossRef]
  72. Aglietta, M.; Alessandro, B.; Antonioli, P.; Arneodo, F.; Bergamasco, L.; Bertaina, M. Study of the Cosmic Ray Anisotropy at Eo ∼100 TeV from EAS-TOP: 1992–1994. In Proceedings of the 24th International Cosmic Ray Conference (ICRC1995), Rome, Italy, 28 August–8 September 1995; Volume 2, p. 800. [Google Scholar]
  73. Amenomori, M.; Ayabe, S.; Cui, S.W.; Danzengluobu; Ding, L.K.; Ding, X.H.; Feng, C.F.; Feng, Z.Y.; Gao, X.Y.; Geng, Q.X.; et al. Large-Scale Sidereal Anisotropy of Galactic Cosmic-Ray Intensity Observed by the Tibet Air Shower Array. Astrophys. J. 2005, 626, L29–L32. [Google Scholar] [CrossRef]
  74. Ma, X.-H.; Bi, Y.-J.; Cao, Z.; Chen, M.-J.; Chen, S.-Z. Chapter 1 LHAASO Instruments and Detector technology. Chin. Phys. C 2022, 46, 030001. [Google Scholar] [CrossRef]
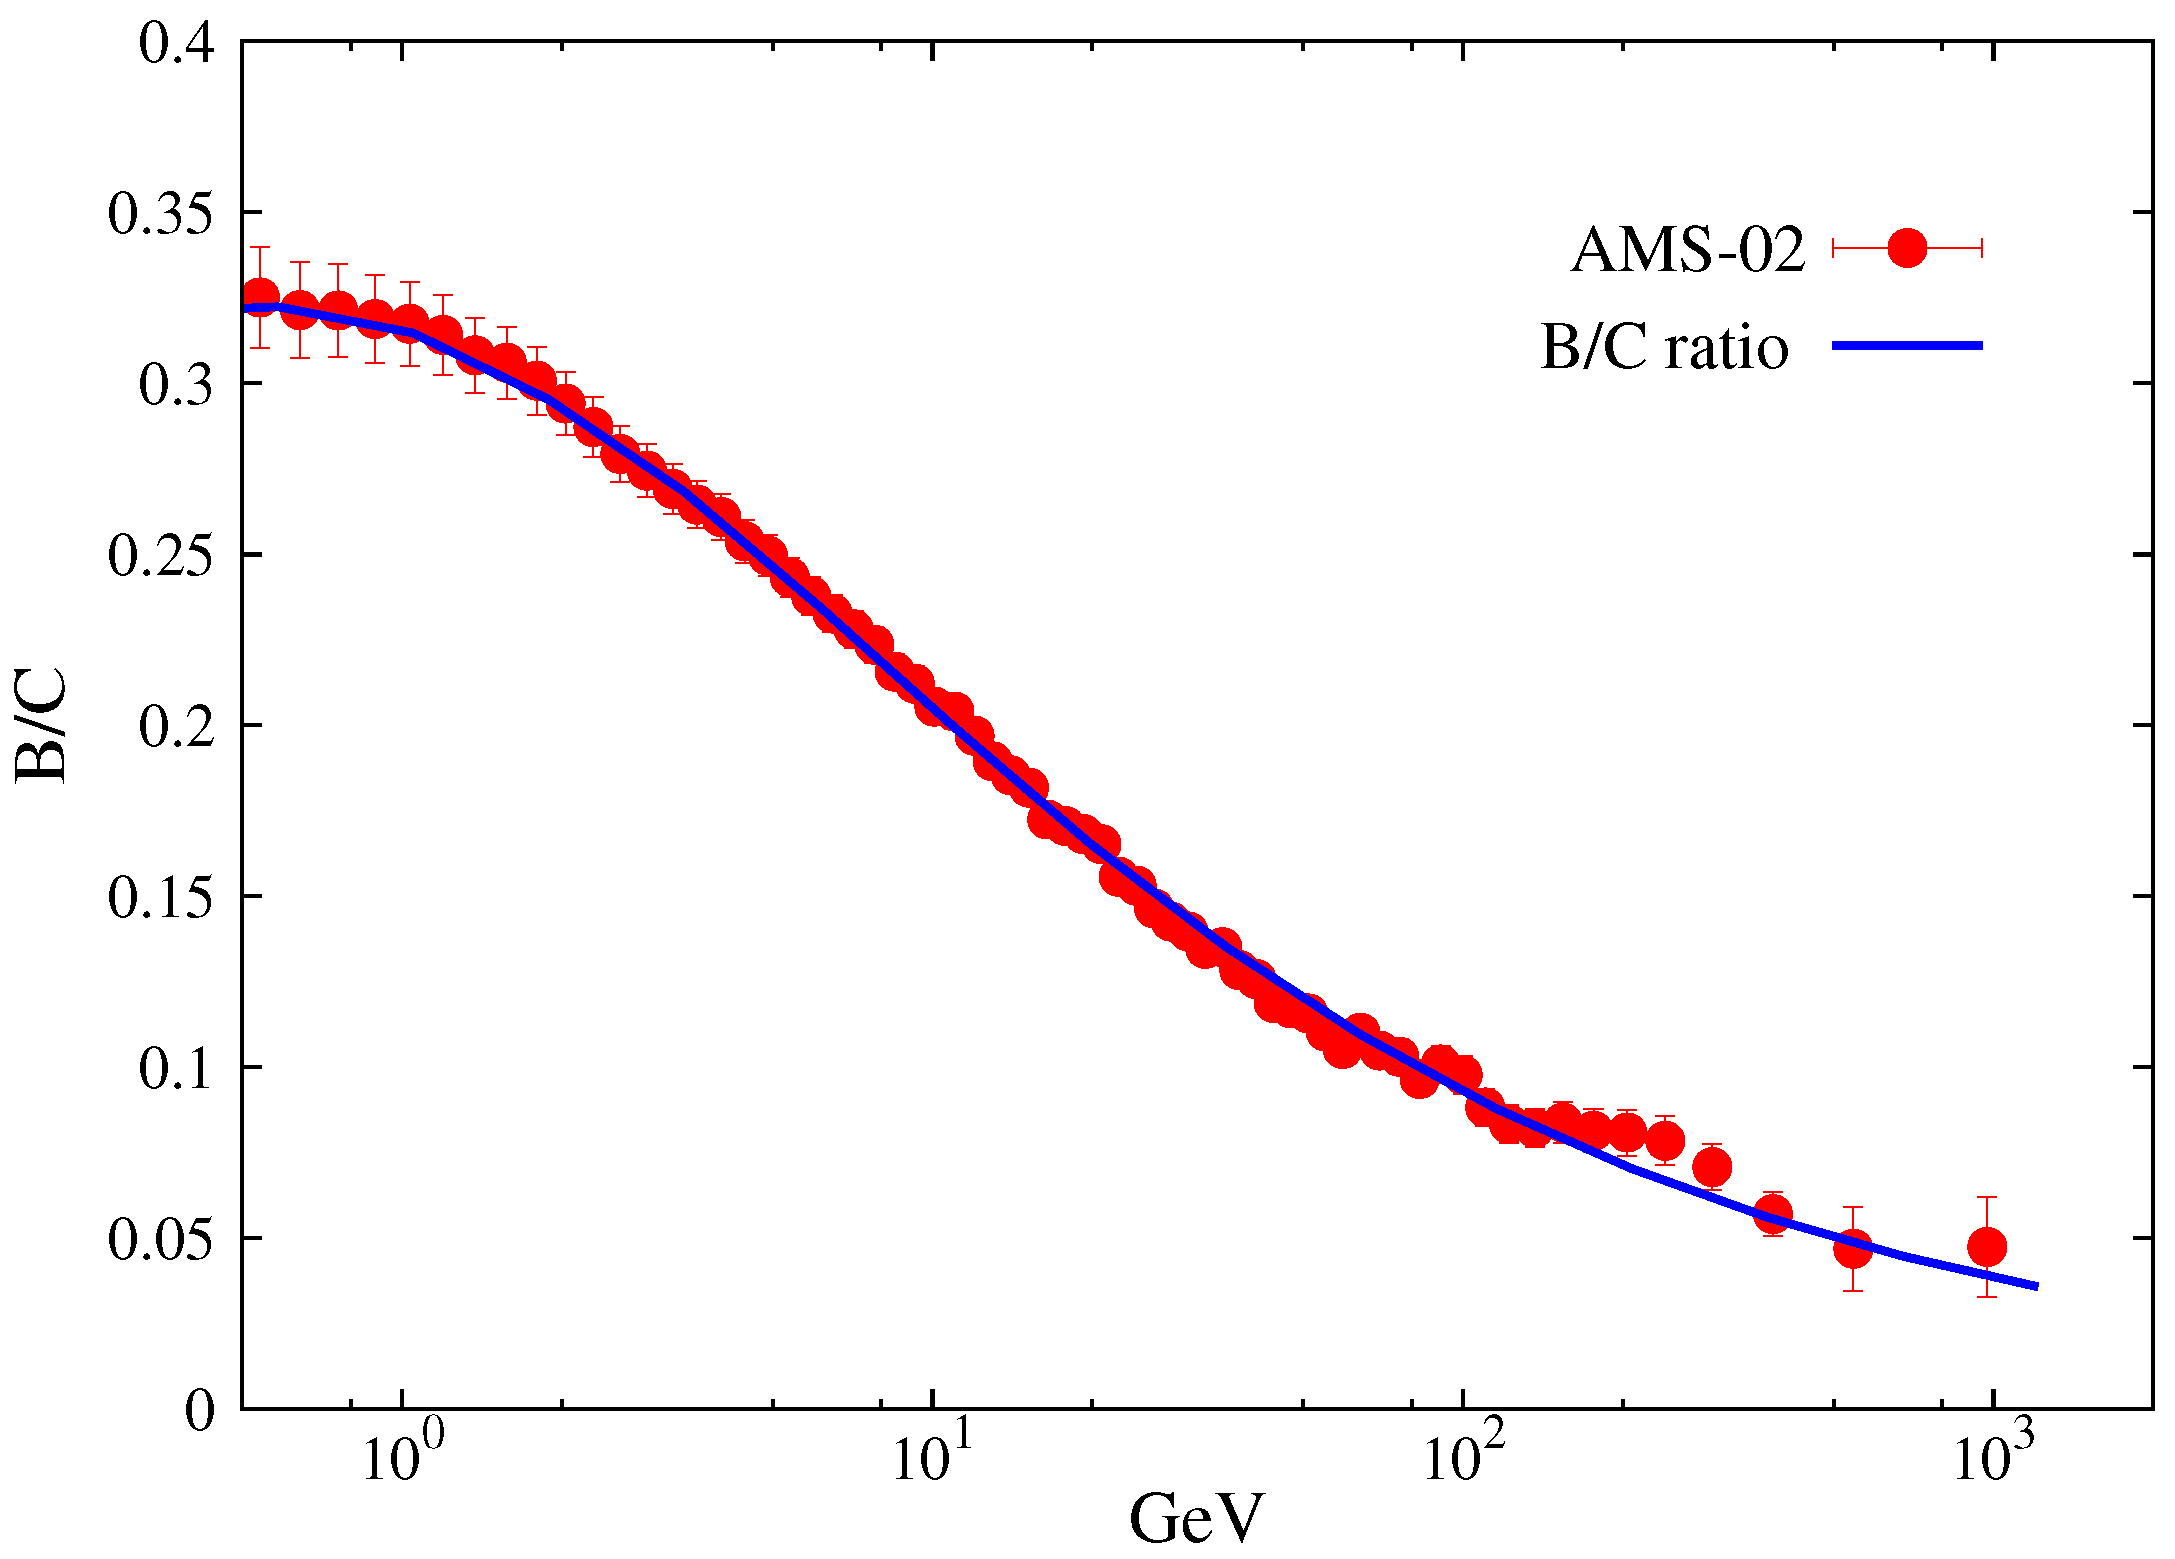
Figure 1. Fitting to the B/C ratio of the model prediction. The B/C data points are taken from the AMS-02 experiment [66,67].
Universe 11 00053 g001
Figure 2. Energy spectra of protons (left) and helium nuclei (right) multiplied by E 2.6 . The dashed blue and red dash-dotted lines are the background fluxes and the fluxes from a nearby Geminga SNR source, respectively. The black solid lines represent the total fluxes. The data points are taken from DAMPE [7,9], AMS-02 [5,6], CREAM-III [10], CALET [12], KASCADE [68], and KASCADE-Grande [69], respectively.
Universe 11 00053 g002
Figure 3. The all-particle spectra multiplied by E 2.6 . The data points are taken from reference [70]. The solid lines with different colors represent the model predictions of different mass groups, while the black solid line is the total contribution.
Universe 11 00053 g003
Figure 4. Energy dependences of the amplitude A 1 (left) and phase α 1 (right) of the dipole anisotropies. The data points are taken from MACRO [71], Super-Kamiokande [23], EAS-TOP [33,72], Milagro [25], IceCube [26,28,30], IceTop [29], ARGO [32], Tibet [21,22,73], KASCADE-Grande [34,35] HAWC [36], and HAWC-IceCube [37].
Universe 11 00053 g004
Figure 5. Two-dimensional anisotropy maps, as a function of right ascension RA and declination DEC, at 10 TeV (up) and 3 PeV (bottom), respectively, i.e., BK (left), BK + Geminga (middle), and BK + Geminga + LRMF (right). The gray circles indicate the GC and galactic anticenter (GAC) directions, and the dark blue square represents the Geminga source, while the black triangle indicates the magnetic field direction measured by IBEX [64].
Universe 11 00053 g005
Table 1. Injection parameters of the background and nearby Geminga source.
ElementBackgroundGeminga Source
q 0 ν R c q 0 α R c
GeV 1 m 2 s 1 sr 1 PVGeV−1TV
p 4.36 × 10 2 2.305 7.74 × 10 52 2.1622
He 2.27 × 10 3 2.215 2.35 × 10 52 2.1022
C 1.0 × 10 4 2.245 7.80 × 10 50 2.1322
N 1.16 × 10 5 2.205 1.03 × 10 50 2.1322
O 1.24 × 10 4 2.255 9.0 × 10 50 2.1322
Ne 1.22 × 10 5 2.205 1.10 × 10 50 2.1322
Mg 1.83 × 10 5 2.235 1.02 × 10 50 2.1322
Si 2.35 × 10 5 2.295 1.02 × 10 50 2.1322
Fe 2.47 × 10 5 2.265 2.75 × 10 50 2.1322
The normalization is set at total energy E = 100 GeV.
Disclaimer/Publisher’s Note: The statements, opinions and data contained in all publications are solely those of the individual author(s) and contributor(s) and not of MDPI and/or the editor(s). MDPI and/or the editor(s) disclaim responsibility for any injury to people or property resulting from any ideas, methods, instructions or products referred to in the content.