Abstract
Angular resolution is crucial for the detailed study of gamma-ray sources and current Cherenkov telescopes (e.g., HESS, MAGIC, and VERITAS) that operate below tens of TeV. Several gamma-ray sources with a photon energy larger than 100 TeV have been revealed by the LHAASO in recent years; the angular resolution of the LHAASO is around . A gamma-ray detector with an angular resolution of less than operating beyond 100 TeV is needed to study the detailed morphology of ultra-high-energy gamma-ray sources further. The cost-effectiveness is crucial for such large-area detectors. In this paper, the impact of telescope aperture, field of view, pixel size, optical point spread function, and signal integration time window on angular resolution is studied. These results can provide essential elements for the design of telescope arrays.
1. Introduction
Ground-based gamma-ray detectors detect primary gamma rays by measuring the air shower in the Earth’s atmosphere. For gamma rays with an energy below ∼10 TeV, only a few secondaries reach ground level. However, there are Cherenkov photons reaching ground level, and these are emitted by high-energy charged secondary particles during the longitudinal development of an air shower [1]. The imaging atmospheric Cherenkov technique (referred to as IACT hereafter) is an instrument used in ground-based gamma-ray astronomy to detect and study high-energy gamma rays from astrophysical sources [2]. It involves using large optical telescopes equipped with fast photomultiplier tubes or silicon photomultipliers to detect Cherenkov photons in an air shower. The telescopes are typically positioned in an array, with multiple telescopes covering a large area to increase detection efficiency. By measuring the arrival time, intensity, and spatial distribution of the Cherenkov photons, the energy, direction, and nature (gamma ray or background particle) of the original gamma ray are reconstructed [3]. An angular resolution of less than 0.1 degree above 10 TeV was achieved using this technique [4,5,6,7,8].
Angular resolution of the gamma-ray detector is essential for the detailed study of gamma-ray sources. For example, angular resolution is a key element in increasing the sensitivity of instruments because the signal/background ratio is proportional to the square of the angular resolution times the rejection efficiency for cosmic rays for the point source, and angular resolution is also critical for the morphology study of the gamma-ray source; the detection of fine structures in morphologies would help to identify the origin of the gamma rays. The inverse Compton scattering of electrons should show narrow structures, which are governed by the rapid cooling of the radiating electrons [9,10], whereas hadronic interactions are expected to generate much smoother structures [11,12].
Current IACT experiments (e.g., HESS, MAGIC, and VERITAS) operate below tens of TeV [5,7,8]. Several gamma-ray sources with a photon energy larger than 100 TeV have been revealed by the Large High-Altitude Air Shower Observatory (LHAASO) in recent years [13]; the angular resolution of the LHAASO is around at 100 TeV [14]. A gamma-ray detector with an angular resolution of less than operating beyond 100 TeV is needed to study the detailed morphology of those ultra-high-energy gamma-ray sources further [15]. The cost-effectiveness is crucial for such large-area detectors.
The design of the detectors is mainly characterised by the configuration of each telescope and by the number and arrangement of these telescopes. The configuration of a single telescope is governed by several key factors. The diameter of the telescope (referred to as aperture below) is critical for obtaining sufficient Cherenkov statistics from air showers. Additionally, in order to reject the night-sky background, the camera needs to capture the Cherenkov photon pulse in a very short time (on the scale of nanoseconds). A good optical point spread function and finely pixelated image over a large field of view are critical for achieving excellent angular resolution of gamma-ray direction and good /proton discrimination abilities. Currently, most Cherenkov telescopes are based on single-dish optical systems, with mirror facets attached to either a spherical dish (e.g., Davies-Cotton) or a parabolic dish. The parabolic dish can reduce the time spread of the Cherenkov signal but suffers from significant off-axis aberrations, such as coma. The Davies-Cotton design provides compensation against spherical aberrations and coma. However, global coma still dominates for off-axis images and has significant consequences for the design of a wide field-of-view telescope. In general, off-axis distortions can be reduced by increasing the f-number (f/D, where f is the focal length and D is the aperture of the telescope), as coma scales use 1/f2. These single-dish designs are appealing due to their relatively low cost. In recent years, Schwarzschild–Couder telescopes with two mirror surfaces have been developed. The dual-mirror setup corrects spherical and coma aberrations, allowing for finer shower image pixelation and enhancing the optical point spread function and off-axis performance over a large field of view. Significant computing resources and time are required to optimise numerous parameters.
The impacts of the parameters of the telescope, including the pixel size of the camera, aperture, and trigger threshold, on the performances of the whole array were studied mainly for the optimisation of the Cherenkov Telescope Array [16,17,18,19,20]. The muon detector of the LHAASO provides excellent /proton discrimination capabilities, with a high detection efficiency above ∼20 TeV [14]. By operating in synergy with the LHAASO, an imaging Cherenkov telescope array at the LHAASO site combines the /proton discrimination capability of the LHAASO’s muon detector with the excellent angular resolution of the IACT. This is very important for identifying processes responsible for gamma-ray production. Given that the muon detector has a fixed detection area, its /proton discrimination capability is primarily provided above ∼20 TeV. This paper investigates the impact of telescope parameters on the angular resolution of the IACT at the LHAASO site. However, the detection area and /proton discrimination ability of the IACT are also important. These results can provide essential elements for the design of a telescope and help narrow down the parameter space in a relatively simple manner without detailed simulations of specific detector parameters and the layout of the array. It is important to note that the detailed optimisation of the layout of telescope arrays is beyond the scope of this study.
Several methods have been developed to reconstruct the direction of gamma rays for IACT experiments. They can be divided into two classes: one is the transitional stereo-reconstruction method, which is based on the second moment parameterisation of the Cherenkov images [21]. The shower direction is determined by a weighted mean of all pairwise intersections of the major axes of two suitable images mapped into a common co-ordinate system [22], which is easy to implement and is computationally inexpensive. The other one is based on the maximum likelihood method, which predicts the Cherenkov images of all telescopes based on 3D air shower models or MC templates; the shower direction is derived by performing a maximum likelihood fitting, which is more complicated and consumes more computing sources [23,24]. In this study, the transitional stereo-reconstruction method will be used to reconstruct the shower direction.
This paper is organised as follows: the simulation procedures, reconstruction method, and image cleaning are introduced in Section 2. The results regarding the impact of several parameters on the angular resolution are presented in Section 3. The differences in the results for the vertical incidence and zenith angle events, as well as the possible application of the results, are also discussed in Section 3, and, finally, Section 4 presents the summary.
2. Approach Used
There are numerous parameters to be determined for the design of a telescope; therefore, it is highly beneficial to narrow down the parameter space of the array in a manner that does not consume significant computing resources. In this study, our main focus is on the impact of the parameters of a single telescope on angular resolution. The angular resolution of gamma rays heavily depends on the number of triggered telescopes, the coordinates of the telescopes relative to the shower core position, and the array layouts. In reality, the array layout is fixed, and the core position of the shower is uniformly distributed on the detection plane. The positions of telescopes with respect to the shower core change for each event. As a result, the angular resolution of a sample is an average of many different arrangements of the telescopes with respect to the shower core. It is important to note that the shower core position in this study is always fixed at the origin, and the positions of the telescopes are located at various impact distances and different directions with respect to the shower core. The detector response of a single telescope is modelled using several parameters, which is similar to the method used in reference [19]. The main idea is to avoid reproducing the data for each layout and each parameter of a single telescope.
2.1. Simulation
The simulation of extensive air showers (EASs) was performed using CORSIKA software (version v7.7410) [25]. Only gamma rays were simulated; the EGS4 model was used for the electromagnetic interactions. The energy of the primary particles was fixed at (E/GeV) = 3.1, 3.7, 4.1, 4.5, and 5.1, representing an energy range from ∼1 TeV to ∼100 TeV. The detection plane was set at an altitude of 4400 m above sea level (the LHAASO’s altitude), and the horizontal and vertical components of the Earth’s magnetic field at the observation site were set to be 34.618 T and 36.13 T, respectively. The US standard model was applied for the atmospheric profile. The simulation was performed at two fixed zenith angles (referred to as hereafter), which were and , corresponding to an atmosphere depth of approximately 600 g/cm2 and 850 g/cm2, respectively, for the altitude chosen in this study. The azimuth angle of the incident gamma ray was fixed at to fix the perpendicular distance (referred to as Rp) between the telescope and the shower axis; the telescope’s pointing direction remained parallel to the direction of the incoming primary particles. For both zenith angles, the number of simulated gamma-ray events was 2 , 2 , 2 , 1 , and 5 , and the energy (E/GeV) = 3.1, 3.7, 4.1, 4.5, and 5.1, respectively.
In extensive air showers, various secondary particles and Cherenkov photons are produced, including electrons, gamma rays, muons, neutrons, and more [26,27]. However, in this study, our focus is solely on Cherenkov photons, specifically in the wavelength band of 200–1000 nm. In order to simulate reality as closely as possible, the atmospheric absorption and the quantum efficiency of the SiPM were applied; the atmospheric extinction coefficient was calculated using MODTRAN [28], and the result in reference [29] was used for quantum efficiency. The number of photons was converted into the number of photo-electrons after applying the quantum efficiency. Meanwhile, seven Rp values (Rp = 20, 50, 100, 150, 200, 300, and 400 m) and 12 positions (uniformly distributed, Rp = 20 m only has 4 positions to avoid shadowing between adjacent telescopes) were selected to sample the Cherenkov photons. The position of the telescopes for is shown in Figure 1; the configuration “A/B/C/D”, defined in Figure 1, was selected as the typical configuration so as to study the impact of telescope parameters on the angular resolution of gamma rays. A circular region around each telescope (corresponding to the aperture of the telescope), was defined, and only photons within these specific regions at the observation level were recorded. The diameter of the circular region was chosen to be 20 m for (E/GeV) = 3.1, 12 m for (E/GeV) = 3.7 and 4.1, and 6 m for (E/GeV) = 4.5 and 5.1, due to limited disk space. Only a portion of the Cherenkov photons enter the detector response to simulate the different aperture and detection efficiency of the telescope.
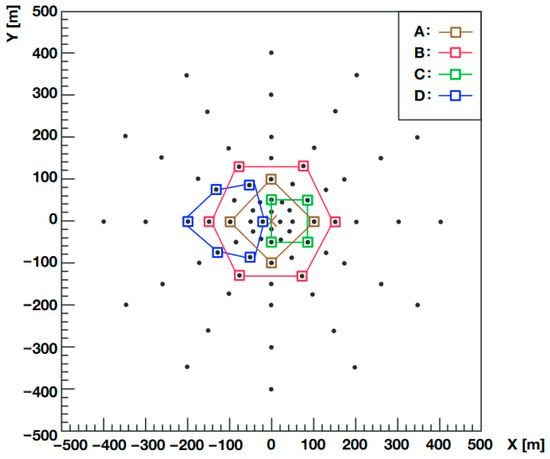
Figure 1.
The location of telescopes on the observational plane (indicated by the black dots), along with the four configurations of telescopes (labelled A, B, C, and D in the legend). These four configurations are used as typical configurations for the study in this work. The red cross at the centre indicates the position of the shower core.
In order to study the telescope parameter space efficiently, a simplified telescope simulation tool similar to the one presented in reference [19] was developed. This tool mainly describes the telescope characteristics by three groups of parameters, without involving ray tracing or camera technology. The first group is related to design parameters, including the effective aperture, field of view, and the pixel size of the camera. The second group is related to the optical properties of the telescope, specifically the optical point spread function of the telescope. The last group is related to the analysis method, specifically the signal integration time window of the Cherenkov pulse.
The variable of the effective aperture (referred to as aperture hereafter) was used to represent the effects, including the physical aperture of the telescope, the reflecting efficiency of the mirrors, the collecting efficiency of the Winston cone, and any other efficiencies, such as the efficiency of the filter, if applicable. In order to capture the imaging response of the telescope optical system, a straightforward conversion of the Cherenkov photon direction to co-ordinates in the camera frame was employed. Each Cherenkov photon was given a random offset drawn from the optical point spread function, which was parameterised as a 2D Gaussian function with a 68.3% containment radius (referred to as the spot size below). The pixel shape was square, and there were no gaps between the pixels. The telescope’s field of view is determined by removing the pixels with an angular distance to the origin of the camera frame that is less than the radius (referred to as the radius of the field of view). The night-sky background (referred to as the NSB) generated for each pixel follows a Poisson distribution, with an average most probable value of around 0.2 [30,31]. This is proportional to the signal integration time window. The result of the simulated events in the camera plane is shown in Figure 2. The default parameters in this study were 6 m for the aperture, for the pixel size, for the spot size, for the radius of the field of view, and 200 ns for the signal integration time window.

Figure 2.
The simulated Cherenkov image is depicted with no image cleaning (left), cleaned using the single-threshold cleaning method (middle, with a threshold of 35 p.e.), and cleaned using the tail-cut clean method (right, with thresholds of 35 p.e. and 17.5 p.e.). The image was observed by using a telescope located at Rp = 100 m, and the primary energy of this gamma-ray event is GeV. The color bar represents the number of photo-electrons detected per pixel (referred to as Npe).
It is important to note that the simulation did not account for the timing of signals and assumed an ideal data acquisition system limited only by irreducible noise. Therefore, the crosstalk, after-pulsing, timing jitter, nonlinearity, and saturation effects of SiPMs were also not simulated; only photo-electrons were simulated by applying quantum efficiency for the camera technology. The reliability of this simple model was verified with the well-tested sim_telarray package [19].
2.2. Image Analysis
The NSB was added to the Cherenkov images observed by the telescopes as noise; this needed to be cleaned to obtain a maximum signal from the shower itself and reject the maximum NSB contamination in each image. Traditionally, the tail-cut method is the standard image-cleaning method for the IACT [22,32]; in the tail-cut method, two thresholds (called thr1 and thr2) are applied to the image in the following way: all pixels with a photo-electron (referred to as p.e. below) signal above the higher threshold (thr1) are kept; in addition, pixels with signals above the lower threshold (thr2) are also kept if they are adjacent to at least one pixel with content above thr1. In recent years, other alternative cleaning methods have been developed [33], such as the single-threshold method [34]. In the single-threshold method, only pixels with signals above the single threshold are kept. The advantage of the single-threshold method is that it is easy and quick to implement and provides reasonable cleaning regarding the image. The Cherenkov image of one telescope with a different cleaning method is shown in Figure 2. The images were cleaned and then subsequently analysed to reconstruct the shower direction of the gamma ray.
The methods mentioned in this paper [22] that are currently in common use are referred to as traditional methods in this work. The direction of the gamma ray was determined by using a traditional method which involves calculating a weighted mean of all the pairwise intersections of the major axes of two suitable images mapped into a common co-ordinate system. “Suitable”, in this context, refers to images with at least three pixels that survive the cleaning procedures. This traditional method is based on the Hillas parameters of the Cherenkov image, derived from zero-order (amplitude or size, referred to as A), first-order (centre of gravity position), and second-order (width, length, and orientations, referred to as w, l, and , respectively) moments of the images. The weights for the intersection pairs were calculated using , according to reference [22], where is the weight for the pairwise intersection of , is the telescope, = is the reduced amplitude of the paired telescope, and is the simplified variant of the disp parameter for the telescope.
The distribution of for gamma-ray events with different energies detected by configuration A (see Figure 1) is shown in Figure 3. The blue vertical lines correspond to the region that contains 68.3% of the events, and the associated angle is defined as angular resolution. The shaded red area that contains the blue vertical line represents the region with event fractions of 68.3% and 68.3%+; is the statistical error associated with the event fraction of 68.3%. The lower and upper errors of angular resolution can be derived from the shaded red region.
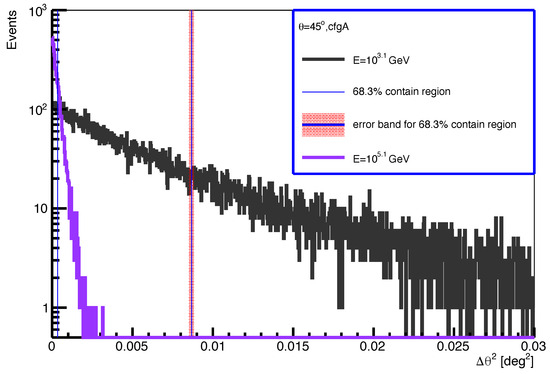
Figure 3.
The distribution of for the gamma-ray events detected by configuration A. The energies of the samples are 103.1 GeV (black) and 105.1 GeV (purple), and the zenith angle is 45 degrees. represents the angle between the reconstructed and true gamma-ray directions. The blue vertical lines at ∼0.009 and correspond to the region that contains 68.3% of the events for E = 103.1 GeV and E = 105.1 GeV, respectively. The shaded red area defines the error band of the region containing 68.3% of the events. Further details can be found in the main text.
The comparisons between the derived angular resolution vs. the threshold and between the tail-cut method and the single-threshold method are shown in Figure 4. The layout of the telescopes is configuration A and . In the tail-cut method, the x-axis represents the threshold thr1, while the threshold thr2 is fixed at half of the high threshold. As demonstrated, both methods indicate that angular resolution initially worsens with the increasing threshold and then improves with further threshold increases before stabilising; this agrees with the results shown in reference [34]. As explained in this reference, the single-threshold method is slightly better than the tail-cut method with a threshold of 15 p.e.; this is due to the improved exclusion of clumps of pixels at the periphery of the image caused by multiple scattered particles in the EAS. The threshold should be optimised to achieve better performance. A threshold that is too high results in a smaller collection area, especially for low-energy events, while a threshold that is too low results in poor angular resolution. In this study, the threshold was selected when the angular resolution stabilised, achieving a relatively good angular resolution, and the fraction of events that did not trigger the arrays A/B/C/D was negligible. The optimised threshold of 35 p.e. was found to be similar for all energies and zenith angles. The associated error of angular resolution (due to the difference between the optimal threshold and 35 p.e.) is indicated with the filled horizontal band in Figure 4. This error is around 10% at E = 103.1 GeV and 4% at E = 105.1 GeV; it contributes to the main error of angular resolution. It is important to note that for pixel sizes other than 0.1∘ or apertures other than 6 m, the chosen threshold differs from 35 p.e. Depending on the specific pixel size or aperture of the telescope, the thresholds are 120 p.e., 70 p.e., 25 p.e., and 20 p.e. for apertures of 20 m, 12 m, 4 m, and 2 m, respectively, and 50 p.e., 70 p.e., and 100 p.e. for pixel sizes of 0.15 deg, 0.2 deg, and 0.3 deg, respectively. the optimisation procedures are the same for all cases. After optimising the threshold, both methods resulted in similar outcomes, and the single-threshold image-cleaning method was utilised in this study.
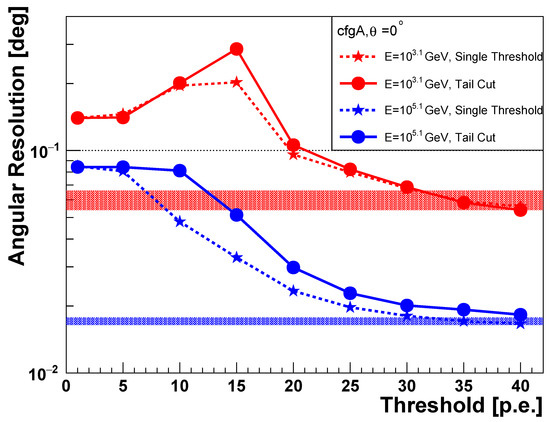
Figure 4.
The angular resolution against the threshold used during the image-cleaning procedures for configuration A and . The red lines indicate an energy of GeV, while the blue lines indicate an energy of GeV. The solid lines represent the application of the tail-cut clean method, and the dashed lines represent the application of the single-threshold cleaning method. Details can be found in the main text.
3. Results
In addition to the telescope parameters, the number of telescopes triggered and the distance between the telescopes and the shower core are also important for angular resolution. In this section, first, the impact of the number of telescopes triggered and the shower impact distance on angular resolution is studied. Then, the study of the impact of the aperture, field of view, pixel size, spot size, and the signal integration time window of the telescope on angular resolution is presented.
3.1. Number of Telescopes and Rp
In addition to the parameters of a single telescope, the layout of the telescope also plays a key role in determining angular resolution. Two particularly important factors are the number of telescopes triggered for stereo reconstruction and the distance between the telescopes and the core position.
The left panel of Figure 5 illustrates the angular resolution vs. the number of telescopes triggered for and , with the Rp of the telescopes fixed at 100 m and the positions of the telescopes uniformly distributed. Meanwhile, the middle panel of Figure 5 depicts the angular resolution vs. the Rp of the telescope for and . There are a total of four telescopes, and the directions of the telescopes with respect to the shower core position are the same as those in configuration A, as shown in Figure 1. As illustrated, the angular resolution improves when a higher number of telescopes are triggered. There is an optimal range of Rp values for angular resolution, which is around 100 m for and 100–150 m for . This is due to the telescopes that are far from the core being affected by statistical fluctuations. Conversely, in the region with small Rp, it is more challenging to reconstruct the shower detection plane (or SDP) accurately. It is also observed that at larger zenith angles, the angular resolutions of telescopes at large Rp values are significantly improved. This can be understood based on the lateral distribution (density of photo-electrons vs. Rp) comparison between and shown in the right panel of Figure 5. As seen, the density of photo-electrons is higher when the telescope is close to the shower axis for compared to , and it is lower when the telescope is further away from the shower axis. This is explained in reference [35]. This is due to the fact that the observation plane is far away from the shower maximum for , and the “Cherenkov pool” effect is more obvious.

Figure 5.
The angular resolution vs. the number of telescopes triggered (left), and the angular resolution vs. the Rp (perpendicular distance between the telescope and shower axis) of the telescope (middle). The different colors represent different energy levels, with the solid lines corresponding to and the dashed lines corresponding to . Detailed information about the configuration can be seen in the main text. The right panel is the mean density of the photo-electrons (total photo-electrons divided by the effective area of the telescope) vs. the Rp of the telescope.
A configuration for the telescopes, namely configuration A with , was selected to study the impact of singular telescope parameters on angular resolution. Three additional configurations (Rp = 20–200 m and the number of telescopes being four and six), as shown in Figure 1, were selected to study the dependency on the configuration. The results with different zenith angles and the possible application of the results are also discussed.
3.2. Signal Integration Time Window
We integrated the signal from extensive air showers and the night-sky background within a time window to mimic reality. This time window should capture the EAS signals while being as short as possible to minimise the NSB. The duration time determines the noise level of the telescope, which was around 16 ns for the HESS experiment [36]. In order to simulate the high NSB level, a time window ranging from 0 ns to 200 ns was simulated, and the resulting angular resolution vs. the signal integration time window is depicted in Figure 6. As illustrated, the angular resolution does not appear to be affected much by the signal integration time window for all the energies and configurations studied in this work.
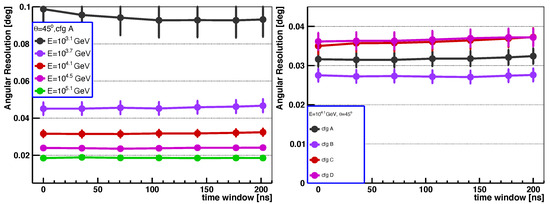
Figure 6.
The angular resolution vs. signal integration time window for different energy levels (left) and for different configurations of telescopes (right).
3.3. Field of View
The field of view of a telescope is typically limited due to various technical limitations; it was for the HESS experiment [4]. Increasing the field of view of telescopes is costly. For high-energy events and those with large Rp values, it is highly probable that the Cherenkov image may not be fully contained by the camera. In such instances, the event’s reconstruction is likely to be affected. On the other hand, the shower-to-shower fluctuation of the Cherenkov image tail also contributes to worsening angular resolution. Figure 7 illustrates the angular resolution vs. the radius of the field of view for different energies and configurations. As observed, the angular resolution significantly improves with an increasing field of view, particularly at small field-of-view angles, and the angular resolution stabilised when the radius of the field of view was larger than for all the energies and configurations studied in this work.
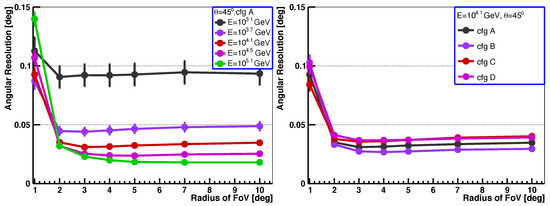
Figure 7.
The angular resolution vs. the radius of the field of view of the telescope for different energy levels (left) and different telescope configurations (right).
3.4. Effective Aperture
As described in the simulation Section 2.1, the aperture in this study refers to the effective aperture, encompassing the physical aperture and all the associated efficiencies. A smaller aperture results in the collection of fewer Cherenkov photons, which affects the threshold energy and the detection area and increases the likelihood of the Cherenkov image being affected by statistical fluctuations. This can result in the deterioration of the angular resolution. Additionally, it is anticipated that the angular resolution will stabilise after reaching a certain aperture size when statistical fluctuation is not dominated. Given the significant cost associated with increasing the aperture of telescopes, it is crucial to carefully select an appropriate aperture for the telescope. The aperture for current Cherenkov telescopes ranges from less than 5 m to larger than 20 m.
Figure 8 depicts the angular resolution vs. the effective aperture of the telescope for different energies and configurations. It is evident that the angular resolution improves with the increasing aperture and has a tendency to stabilise after reaching a certain aperture size. The dotted lines in the left and right panels represent an exponential function, corresponding to a improvement in the angular resolution for every 1 m increase in the aperture; it is used to guide the eye, although there are no specific physical reasons for its application. It is worth noting that at approximately 1 TeV, there is an improvement of about 20% in the angular resolution when transitioning from an aperture of 6 m to 10 m, after which the angular resolution stabilises.
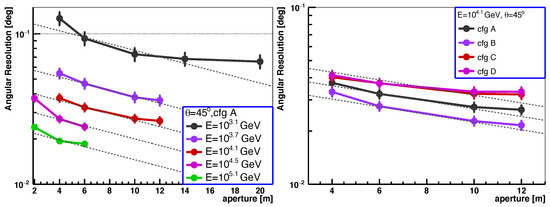
Figure 8.
Angular resolution vs. the aperture of the telescope for different energy levels (left) and different telescope configurations (right). The dotted lines in both panels represent an exponential function, corresponding to a improvement in angular resolution for every 1 m increase in the aperture; they are used to guide the eye, and there are no physical reasons for their application.
3.5. Pixel Size
The pixel size represents the field of view for each PMT or SiPM. The number of SiPMs (or PMTs) is inversely proportional to the pixel size for a given field of view. A larger pixel size will lead to images with worse resolution, thereby worsening angular resolution. Conversely, a smaller pixel size results in more SiPMs, but decreasing the pixel size of telescopes is also costly. The pixel size depends on the design of telescope; the typical pixel size for current Cherenkov telescopes is in the range of ∼0.07∘ to ∼0.2∘ [37].
Figure 9 illustrates angular resolution vs. the pixel size of the telescope for different energies and configurations. It is observed that the difference in angular resolution between a pixel size of and is minimal, but it worsens the angular resolution with further increases in pixel size. The dotted lines in Figure 9 represent an exponential function, indicating a 35% worsening in angular resolution for every increase in pixel size. Meanwhile, a solid green line is included for comparison in the right panel of Figure 9, which corresponds to a 15% decline in angular resolution for every 0.1∘ increase in pixel size. As observed, the worsening of the angular resolution with increasing pixel size is around 15–35% for every increase in pixel size, and this worsening depends on energy and configuration.
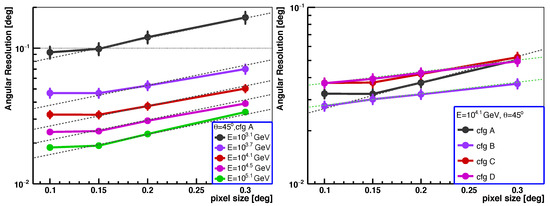
Figure 9.
Angular resolution vs. telescope pixel size for different energy levels (left) and different telescope configurations (right). All the dotted lines represent an exponential function; the black dotted lines in both panels indicate a 35% degradation in angular resolution for every increase in pixel size. The dotted green lines in the right panel represent a 15% degradation in angular resolution for every increase in pixel size; they are used to guide the eye.
3.6. Spot Size
The spot size, representing the radius that contains 68.3% of the optical point spread function, is one of the most critical parameters for telescopic performance. A larger spot size can lead to a worsening in the telescope’s angular resolution, as it causes the light from a point source to be dispersed over a larger area on the camera, resulting in reduced image sharpness and detail. However, reducing the spot size can be very costly, making it crucial to thoroughly study the impact of spot size on angular resolution. The spot size depends on the design of the telescope; the typical spot size for current Cherenkov telescopes is less than 1 mrad.
Figure 10 depicts angular resolution vs. the spot size of the telescope for different energies and configurations. Since the pixel size may be correlated with spot size, the results for two pixel sizes (pixel size = 0.1∘ and pixel size = 0.2∘) are shown. It is evident that the angular resolution worsens with increasing spot size, particularly when the spot size is very small (less than ). To guide the eye, the black dotted lines shown in Figure 10 represent an exponential function, indicating a 30% worsening in the angular resolution for every increase in spot size. Meanwhile, the dotted orange line in the middle panel and the green lines in the right panel are included for comparison, which represent a 20% and 25% worsening in the angular resolution for every increase in spot size, respectively. As observed, the worsening of the angular resolution with increasing spot size is around 20–30% for every increase in spot size, and this worsening slightly depends on the energy.

Figure 10.
Angular resolution vs. telescope spot size for different energy levels with a pixel size of 0.1∘ (left), different energy levels with a pixel size of 0.2∘ (middle), and different telescope configurations (right). All the dotted lines represent an exponential function; the black dotted lines in all three panels indicate a 30% degradation in angular resolution for every increase in spot size. The dotted orange line in the middle panel represents a 20% degradation in angular resolution for every increase in spot size. The dotted green lines in the right panel represent a 25% degradation in angular resolution for every increase in spot size; they are used to guide the eye.
3.7. Zenith Angle Dependence
The impact of the signal integration time window, field of view, aperture, pixel size, and spot size on angular resolution for was studied. It was found that angular resolution is highly sensitive to the aperture, pixel size, and spot size of the telescope. For different gamma-ray sources located at varying zenith angles, it is meaningful to study those effects at different zenith angles. Comparisons of angular resolution vs. aperture, pixel size, and spot size between and are shown in Figure 11, Figure 12 and Figure 13, respectively.
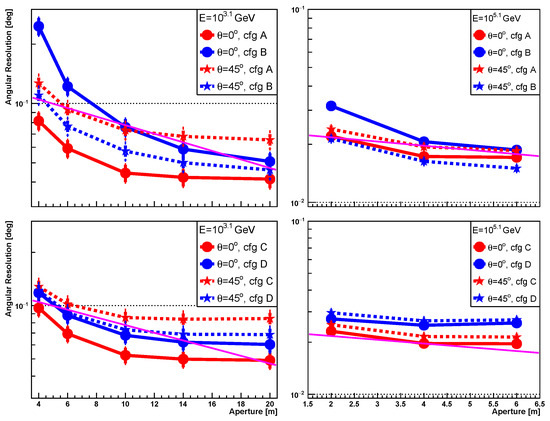
Figure 11.
The comparison of angular resolution vs. telescope aperture between (solid lines) and (dotted lines). The left panel corresponds to an energy of GeV, while the right panel corresponds to an energy of GeV. The upper panel corresponds to configurations A and B, while the lower panel corresponds to configurations C and D (cfg in the legend is abbreviated from configurations). The magenta line represents an exponential function, corresponding to a improvement in angular resolution for every 1 m increase in aperture; it is the same as the one shown in the left panel of Figure 8, and it is used to guide the eye.
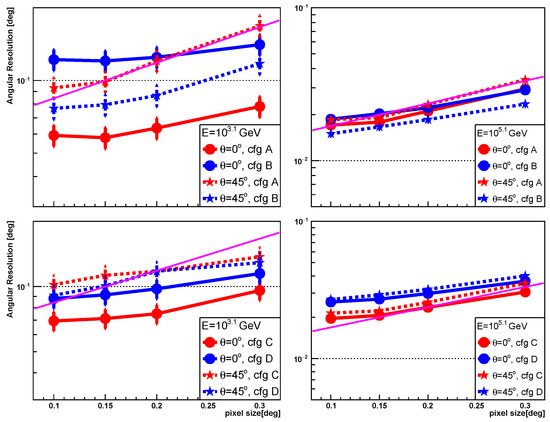
Figure 12.
The comparison of angular resolution vs. telescope pixel size between (solid lines) and (dotted lines). The left panel corresponds to an energy of GeV, while the right panel corresponds to an energy of GeV. The upper panel corresponds to configurations A and B, while the lower panel corresponds to configurations C and D (cfg in the legend is abbreviated from configurations). The magenta line represents an exponential function, indicating a 35% worsening in angular resolution for every increase in pixel size; it is the same as the one shown in the left panel of Figure 9, and it is used to guide the eye.
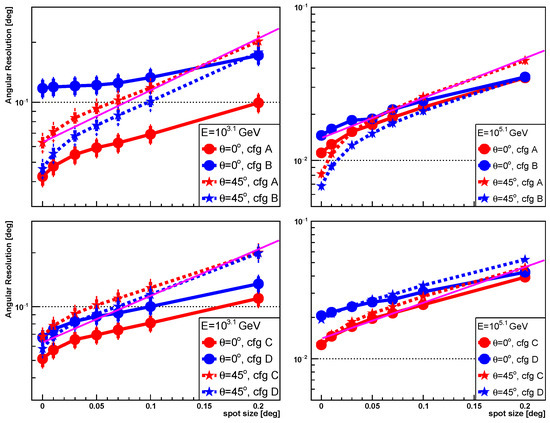
Figure 13.
The comparison of angular resolution vs. telescope spot size between (solid lines) and (dotted lines). The left panel corresponds to an energy of GeV, while the right panel corresponds to an energy of GeV. The upper panel corresponds to configurations A and B, while the lower panel corresponds to configurations C and D (cfg in the legend is abbreviated from configurations). The magenta line represents an exponential function, indicating a 30% worsening in angular resolution for every increase in spot size; it is the same as the one shown in the left panel of Figure 10, and it is used to guide the eye.
For the aperture, the dependencies of angular resolution on the aperture are similar between (solid lines) and (dotted lines), with the exception of configuration B at . The greater dependency on the aperture for configuration B may be attributed to the fact that all telescopes have an Rp of 150 m; this is located outside the Cherenkov pool region for and inside the Cherenkov pool for with an energy of 103.1 GeV, as shown in the right panel of Figure 5. For pixel size and spot size, the angular resolution is less dependent on pixel size (or spot size) for compared to , especially at low energies.
3.8. Application
The worsening rate of angular resolution due to aperture, pixel size, and spot size can be utilised during the design of telescopes, with input from the cost model. A large field of view is important for observing extended sources, and it is also crucial for containing the Cherenkov image for high-energy and large-Rp events. However, as described in the Introduction section, single-dish telescopes have the advantage of lower cost, but the pixel size and the spot size for off-axis observations are limited. To achieve better off-axis performance, the f/D parameter needs to be optimised. The typical pixel size is around or less than 0.2 degrees. Alternatively, Schwarzschild–Couder telescopes with two mirror surfaces allow for finer shower image pixelation and a smaller spot size for off-axis instances over a large field of view, for example, a pixel size of 0.07 degrees, but they come with a much higher cost. An increase in pixel size leads to poorer angular resolution but requires fewer pixels (SiPMs or PMTs) and reduces costs, allowing for the possibility of more telescopes. Consequently, a larger detection area or enhanced /proton discrimination ability can be achieved for a fixed total cost of the array. This also applies to spot size and aperture. By incorporating a cost model as a function of aperture, pixel size, and spot size for single-dish and two-dish telescopes, the parameter space can be narrowed down for improved overall performance.
4. Summary
Several key telescope array parameters were investigated, and their influence on angular resolution was studied in detail. The parameters include the aperture, field of view, pixel size, spot size, signal integration time window of the telescope, number of telescopes used, and the distance between telescopes. It was found that the angular resolution is almost independent of the signal integration time window and field of view (except for a very small field of view). The angular resolution is very sensitive to the array layout, aperture, pixel size, and spot size. The angular resolution performs better when the Rp of the telescope is around 100 m for and 100–150 m for . The angular resolution improves with increasing aperture and has a tendency to stabilise after reaching a certain aperture size; at approximately 1 TeV, the improvement in the angular resolution is about 20% when transitioning from an aperture of 6 m to 10 m. The worsening rate of the angular resolution with pixel size and spot size is around 15–35% for every increase in pixel size and around 20–30% for every increase in spot size. These results provide important information for the design of the telescope array.
Author Contributions
Generation of Monte Carlo simulation data, F.Z.; the effect of the number and distance of telescopes on angular resolution, H.W.; the effect of angular resolution on the shape of the telescope placement, Q.L.; the effect of angular resolution on the telescope field of view, R.X.; the effect of angular resolution on the telescope pixel size, J.L.; data check, Y.J.; draft version and verification of results, H.L. All authors have read and agreed to the published version of the manuscript.
Funding
This work was funded by the National Natural Science Foundation of China (Grant number 12205244) and “the Fundamental Research Funds for the Central Universities” (Project Number 2023160).
Data Availability Statement
Data will be made available upon request.
Acknowledgments
We gratefully acknowledge financial support from Southwest Jiaotong University.
Conflicts of Interest
The authors declare no conflicts of interest.
References
- Holder, J. TeV gamma-ray astronomy: A summary. Astropart. Phys. 2012, 39, 61–675. [Google Scholar] [CrossRef]
- Sitarek, J. TeV Instrumentation: Current and Future. Galaxies 2022, 10, 21. [Google Scholar] [CrossRef]
- D’Amico, G. Statistical Tools for Imaging Atmospheric Cherenkov Telescopes. Universe 2022, 8, 90. [Google Scholar] [CrossRef]
- Hinton, J.A. et al. [HESS Collaboration] The status of the HESS project. New Astron. Rev. 2004, 48, 331–337. [Google Scholar] [CrossRef]
- Holler, M. et al. [HESS Collaboration] Observations of the Crab Nebula with H.E.S.S. Phase II. arXiv 2015, arXiv:1509.02902. [Google Scholar] [CrossRef]
- Lorenz, E. et al. [MAGIC Collaboration] Status of the 17 m ⌀ MAGIC telescope. New Astron. Rev. 2004, 48, 339–344. [Google Scholar] [CrossRef]
- Aleksić, J. et al. [MAGIC Collaboration] The major upgrade of the MAGIC telescopes, Part II: A performance study using observations of the Crab Nebula. Astropart. Phys. 2016, 72, 76–94. [Google Scholar] [CrossRef]
- Park, N. et al. [VERITAS Collaboration] Performance of the VERITAS experiment. In Proceedings of the 34th International Cosmic Ray Conference (ICRC2015), Hague, The Netherlands, 30 July–6 August 2015; Volume 34, p. 771. [Google Scholar] [CrossRef]
- Acciari, V.A. et al. [MAGIC Collaboration] Study of the GeV to TeV morphology of the γ Cygni SNR (G 78.2+2.1) with MAGIC and Fermi-LAT. Evidence for cosmic ray escape. Astron. Astrophys. 2023, 670, A8. [Google Scholar] [CrossRef]
- Hofmann, W. Performance Limits for Cherenkov Instruments. arXiv 2006, arXiv:astro-ph/0603076. [Google Scholar] [CrossRef]
- Berezhko, E.G.; Ksenofontov, L.T.; Völk, H.J. Emission of SN 1006 produced by accelerated cosmic rays. Astron. Astrophys. 2002, 395, 943–953. [Google Scholar] [CrossRef][Green Version]
- Cao, Z. et al. [LHAASO Collaboration] An Ultrahigh-energy γ-ray Bubble Powered by a Super PeVatron. arXiv 2023, arXiv:2310.10100. [Google Scholar] [CrossRef]
- Cao, Z.; Aharonian, F.A.; An, Q.; Axikegu Bai, L.X.; Bai, Y.X.; Bao, Y.W.; Bastieri, D.; Bi, X.J.; Bi, Y.J.; Cai, H.; et al. Ultrahigh-energy photons up to 1.4 petaelectronvolts from 12 γ-ray Galactic sources. Nature 2021, 594, 33–36. [Google Scholar] [CrossRef]
- Aharonian, F. et al. [LHAASO Collaboration] Observation of the Crab Nebula with LHAASO-KM2A—A performance study. Chin. Phys. C 2021, 45, 025002. [Google Scholar] [CrossRef]
- Cao, Z. LHAASO: A milestone of the cosmic ray research. Chin. Sci. Bull. 2022, 67, 1558–1566. [Google Scholar] [CrossRef]
- Bernlöhr, K. CTA simulations with CORSIKA/sim_telarray. AIP Conf. Proc. 2008, 1085, 874–877. [Google Scholar] [CrossRef][Green Version]
- Funk, S.; Hinton, J.A. Monte-Carlo studies of the angular resolution of a future Cherenkov gamma-ray telescope. AIP Conf. Proc. 2008, 1085, 878–881. [Google Scholar] [CrossRef]
- Fegan, S.J.; Vassiliev, V.V. The performance of an idealized large-area array of moderate-sized IACTs. Int. Cosm. Ray Conf. 2008, 3, 1441–1444. [Google Scholar] [CrossRef]
- Wood, M.; Jogler, T.; Dumm, J.; Funk, S. Monte Carlo studies of medium-size telescope designs for the Cherenkov Telescope Array. Astropart. Phys. 2016, 72, 11–31. [Google Scholar] [CrossRef]
- Krennrich, F. Gamma ray astronomy with atmospheric Cherenkov telescopes: The future. New J. Phys. 2009, 11, 115008. [Google Scholar] [CrossRef]
- Hillas, A.M. Cerenkov Light Images of EAS Produced by Primary Gamma Rays and by Nuclei. In Proceedings of the 19th International Cosmic Ray Conference (ICRC19), San Diego, CA, USA, 11–23 August 1985; Volume 3, p. 445. [Google Scholar]
- Bernlöhr, K.; Barnacka, A.; Becherini, Y.; Blanch Bigas, O.; Carmona, E.; Colin, P.; Decerprit, G.; Di Pierro, F.; Dubois, F.; Farnier, C.; et al. Monte Carlo design studies for the Cherenkov Telescope Array. Astropart. Phys. 2013, 43, 171–188. [Google Scholar] [CrossRef]
- de Naurois, M.; Rolland, L. A high performance likelihood reconstruction of γ-rays for imaging atmospheric Cherenkov telescopes. Astropart. Phys. 2009, 32, 231–252. [Google Scholar] [CrossRef]
- Parsons, R.D.; Hinton, J.A. A Monte Carlo template based analysis for air-Cherenkov arrays. Astropart. Phys. 2014, 56, 26–34. [Google Scholar] [CrossRef]
- Heck, D.; Knapp, J.; Capdevielle, J.N.; Schatz, G.; Thouw, T. CORSIKA: A Monte Carlo Code to Simulate Extensive Air Showers; Forschungszentrum Karlsruhe GmbH: Karlsruhe, Germany, 1998. [Google Scholar]
- Zhang, F.; Liu, H.; Zhu, F.R. Properties of secondary components in extensive air shower of cosmic rays in knee energy region. Acta Phys. Sin. 2022, 71, 249601. [Google Scholar] [CrossRef]
- Zhang, F.; Liu, H.; Zhu, F.R.; Oloketuyi, J. Study of longitudinal development of air showers in the knee energy range. Astropart. Phys. 2023, 152, 102877. [Google Scholar] [CrossRef]
- Kneizys, F.X.; Robertson, D.C.; Abreu, L.W.; Acharya, P.; Rothman, L.S. The MODTRAN 2/3 Report and LOWTRAN 7 MODEL; Phillips Laboratory: Hanscom AFB, MA, USA, 1996. [Google Scholar]
- Aharonian, F. et al. [LHAASO Collaboration] Absolute calibration of LHAASO WFCTA camera based on LED. Nucl. Instruments Methods Phys. Res. A 2022, 1021, 165824. [Google Scholar] [CrossRef]
- Ma, X.H.; Bi, Y.J.; Cao, Z.; Chen, M.J.; Chen, S.Z.; Cheng, Y.D.; Gong, G.H.; Gu, M.H.; He, H.H.; Hou, C.; et al. Chapter 1 LHAASO Instruments and Detector technology. Chin. Phys. C 2022, 46, 030001. [Google Scholar] [CrossRef]
- Aharonian, F. et al. [LHAASO Collaboration] Construction and on-site performance of the LHAASO WFCTA camera. Eur. Phys. J. C 2021, 81, 657. [Google Scholar] [CrossRef]
- Daum, A.; Hermann, G.; Heß, M.; Hofmann, W.; Lampeitl, H.; Pühlhofer, G.; Aharonian, F.; Akhperjanian, A.G.; Barrio, J.A.; Beglarian, A.S.; et al. First results on the performance of the HEGRA IACT array. Astropart. Phys. 1997, 8, 1–11. [Google Scholar] [CrossRef]
- Shayduk, M.; Consortium, C. Optimized Next-neighbour Image Cleaning Method for Cherenkov Telescopes. Int. Cosm. Ray Conf. 2013, 33, 3000. [Google Scholar] [CrossRef]
- Sajjad, S. The effect of night sky background on source reconstruction in atmospheric Cherenkov telescope arrays and implications for image cleaning. New J. Phys. 2023, 25, 083038. [Google Scholar] [CrossRef]
- Hillas, A.M.; Patterson, J.R. Characteristics and brightness of Cerenkov shower images for gamma-ray astronomy near 1 TeV. J. Phys. Nucl. Phys. 1990, 16, 1271–1281. [Google Scholar] [CrossRef]
- Funk, S.; Hermann, G.; Hinton, J.; Berge, D.; Bernlöhr, K.; Hofmann, W.; Nayman, P.; Toussenel, F.; Vincent, P. The trigger system of the H.E.S.S. telescope array. Astropart. Phys. 2004, 22, 285–296. [Google Scholar] [CrossRef]
- Acharyya, A.; Agudo, I.; Angüner, E.O.; Alfaro, R.; Alfaro, J.; Alispach, C.; Aloisio, R.; Alves Batista, R.; Amans, J.P.; Amati, L.; et al. Monte Carlo studies for the optimisation of the Cherenkov Telescope Array layout. Astropart. Phys. 2019, 111, 35–53. [Google Scholar] [CrossRef]
Disclaimer/Publisher’s Note: The statements, opinions and data contained in all publications are solely those of the individual author(s) and contributor(s) and not of MDPI and/or the editor(s). MDPI and/or the editor(s) disclaim responsibility for any injury to people or property resulting from any ideas, methods, instructions or products referred to in the content. |
© 2024 by the authors. Licensee MDPI, Basel, Switzerland. This article is an open access article distributed under the terms and conditions of the Creative Commons Attribution (CC BY) license (https://creativecommons.org/licenses/by/4.0/).