Article

Metabolomic Profiling of Submaximal Exercise at a Standardised Relative Intensity in Healthy Adults

1
Strathclyde Institute of Pharmacy and Biomedical Sciences, University of Strathclyde, The John Arbuthnott Building, 161 Cathedral Street, Glasgow G4 0RE, UK; [email protected] (A.M.A.); [email protected] (E.D.); [email protected] (T.Z.)
2
College of Science, Thi-Qar University, Nassiriya, Thi-Qar, Iraq
3
Institute for Clinical Exercise and Health Science, University of the West of Scotland, Hamilton ML3 0JB, UK; [email protected] (M.B.); [email protected] (C.E.)
*
Author to whom correspondence should be addressed.
Metabolites 2016, 6(1), 9; https://doi.org/10.3390/metabo6010009
Submission received: 22 December 2015 / Revised: 18 February 2016 / Accepted: 22 February 2016 / Published: 26 February 2016

Abstract

:
Ten physically active subjects underwent two cycling exercise trials. In the first, aerobic capacity (VO2max) was determined and the second was a 45 min submaximal exercise test. Urine samples were collected separately the day before (day 1) , the day of (day 2), and the day after (day 3) the submaximal exercise test (12 samples per subject). Metabolomic profiling of the samples was carried out using hydrophilic interaction chromatography (HILIC) coupled to an Orbitrap Exactive mass spectrometer. Data were extracted, database searched and then subjected to principle components (PCA) and orthogonal partial least squares (OPLSDA) modelling. The best results were obtained from pre-treating the data by normalising the metabolites to their mean output on days 1 and 2 of the trial. This allowed PCA to separate the day 2 first void samples (D2S1) from the day 2 post-exercise samples (D2S3) PCA also separated the equivalent samples obtained on day 1 (D1S1 and D1S3). OPLSDA modelling separated both the D2S1 and D2S3 samples and D1S1 and D1S3 samples. The metabolites affected by the exercise samples included a range of purine metabolites and several acyl carnitines. Some metabolites were subject to diurnal variation these included bile acids and several amino acids, the variation of these metabolites was similar on day 1 and day 2 despite the exercise intervention on day 2. Using OPLS modelling it proved possible to identify a single abundant urinary metabolite provisionally identified as oxo-aminohexanoic acid (OHA) as being strongly correlated with VO2max when the levels in the D2S3 samples were considered.

1. Introduction

Physical activity and exercise have a major impact on health [1] and can reduce the incidence of several diseases including cardiovascular disease (CVD) [2], diabetes [2], and mild-to-moderate depression [1]. The World Health Organisation has reported that CVDs are the leading cause of mortality (17.5 million deaths) followed by diabetes (1.5 million deaths) [3]. In the UK this is equates to more than 200,000 (37% of total) deaths due to CVD per annum [4]. The five leading global risk factors for death from CVD are: high blood pressure (13%), tobacco use (9%), high blood glucose (6%), physical inactivity (6%), and overweight/obesity (5%) [5]. These risks can be modified by choice of diet, moderation of alcohol use, and regular physical activity. It has been estimated that the indirect cost of physical inactivity in England is £8.2 billion per annum [6], in developed countries this is 1.5%–3% of total direct healthcare costs [7]; Scotland is one of the least physically active countries in Europe [8].
The type of exercise which is optimal for individuals of different cohorts (e.g., sedentary vs. already active) largely remains to be explored as do the molecular mechanisms underlying health improvement through exercise. Exercise optimisation may depend on various factors including gender, age, life-style, and body mass index (BMI). Directly investigating the effect of exercise on the human metabolome by using metabolomics could provide an insight into phenotypic responses and might allow personalised training regimes that are reflective of the initial metabolic status of each individual. [9]. Given that cardiorespiratory fitness is strongly associated with morbidity and mortality outcomes [10], assessing the effects of exercise on the human metabolome may also yield vital diagnostic and prognostic indicators for clinicians. Cardiorespiratory fitness is most commonly expressed as the maximal rate of oxygen consumption (VO2max) which can be determined during by measuring respiratory variables during an incremental exercise test to exhaustion. Of further interest is that VO2max is also a primary determinant of endurance exercise performance [11].
Following on from our pilot study on the acute impact of exercise on individuals [12] we conducted a carefully controlled follow up study with 10 participants with a slightly modified exercise protocol. We utilised our well established hydrophilic interaction chromatography-mass spectrometry method to carry out the analysis [13,14,15,16]. The primary aim was to establish the effects of exercise on the human metabolome using a bout of exercise that was standardised to a relative intensity. The secondary aim was to explore potential predictive markers for VO2max.

2. Materials and Methods

2.1. Chemicals and Solvents

HPLC grade Acetonitrile (ACN) was purchased from Fisher Scientific (Loughborough, UK) and HPLC grade water was produced by a Direct-Q 3 Ultrapure Water System (Millipore, Watford, UK). AnalaR-grade formic acid (98%) was obtained from BDH-Merck (Poole, UK). Authentic stock standards were prepared as stated previously in the literature [15] and diluted four times with ACN before LC-MS analysis. Ammonium carbonate was purchased from Sigma-Aldrich (Poole, UK).

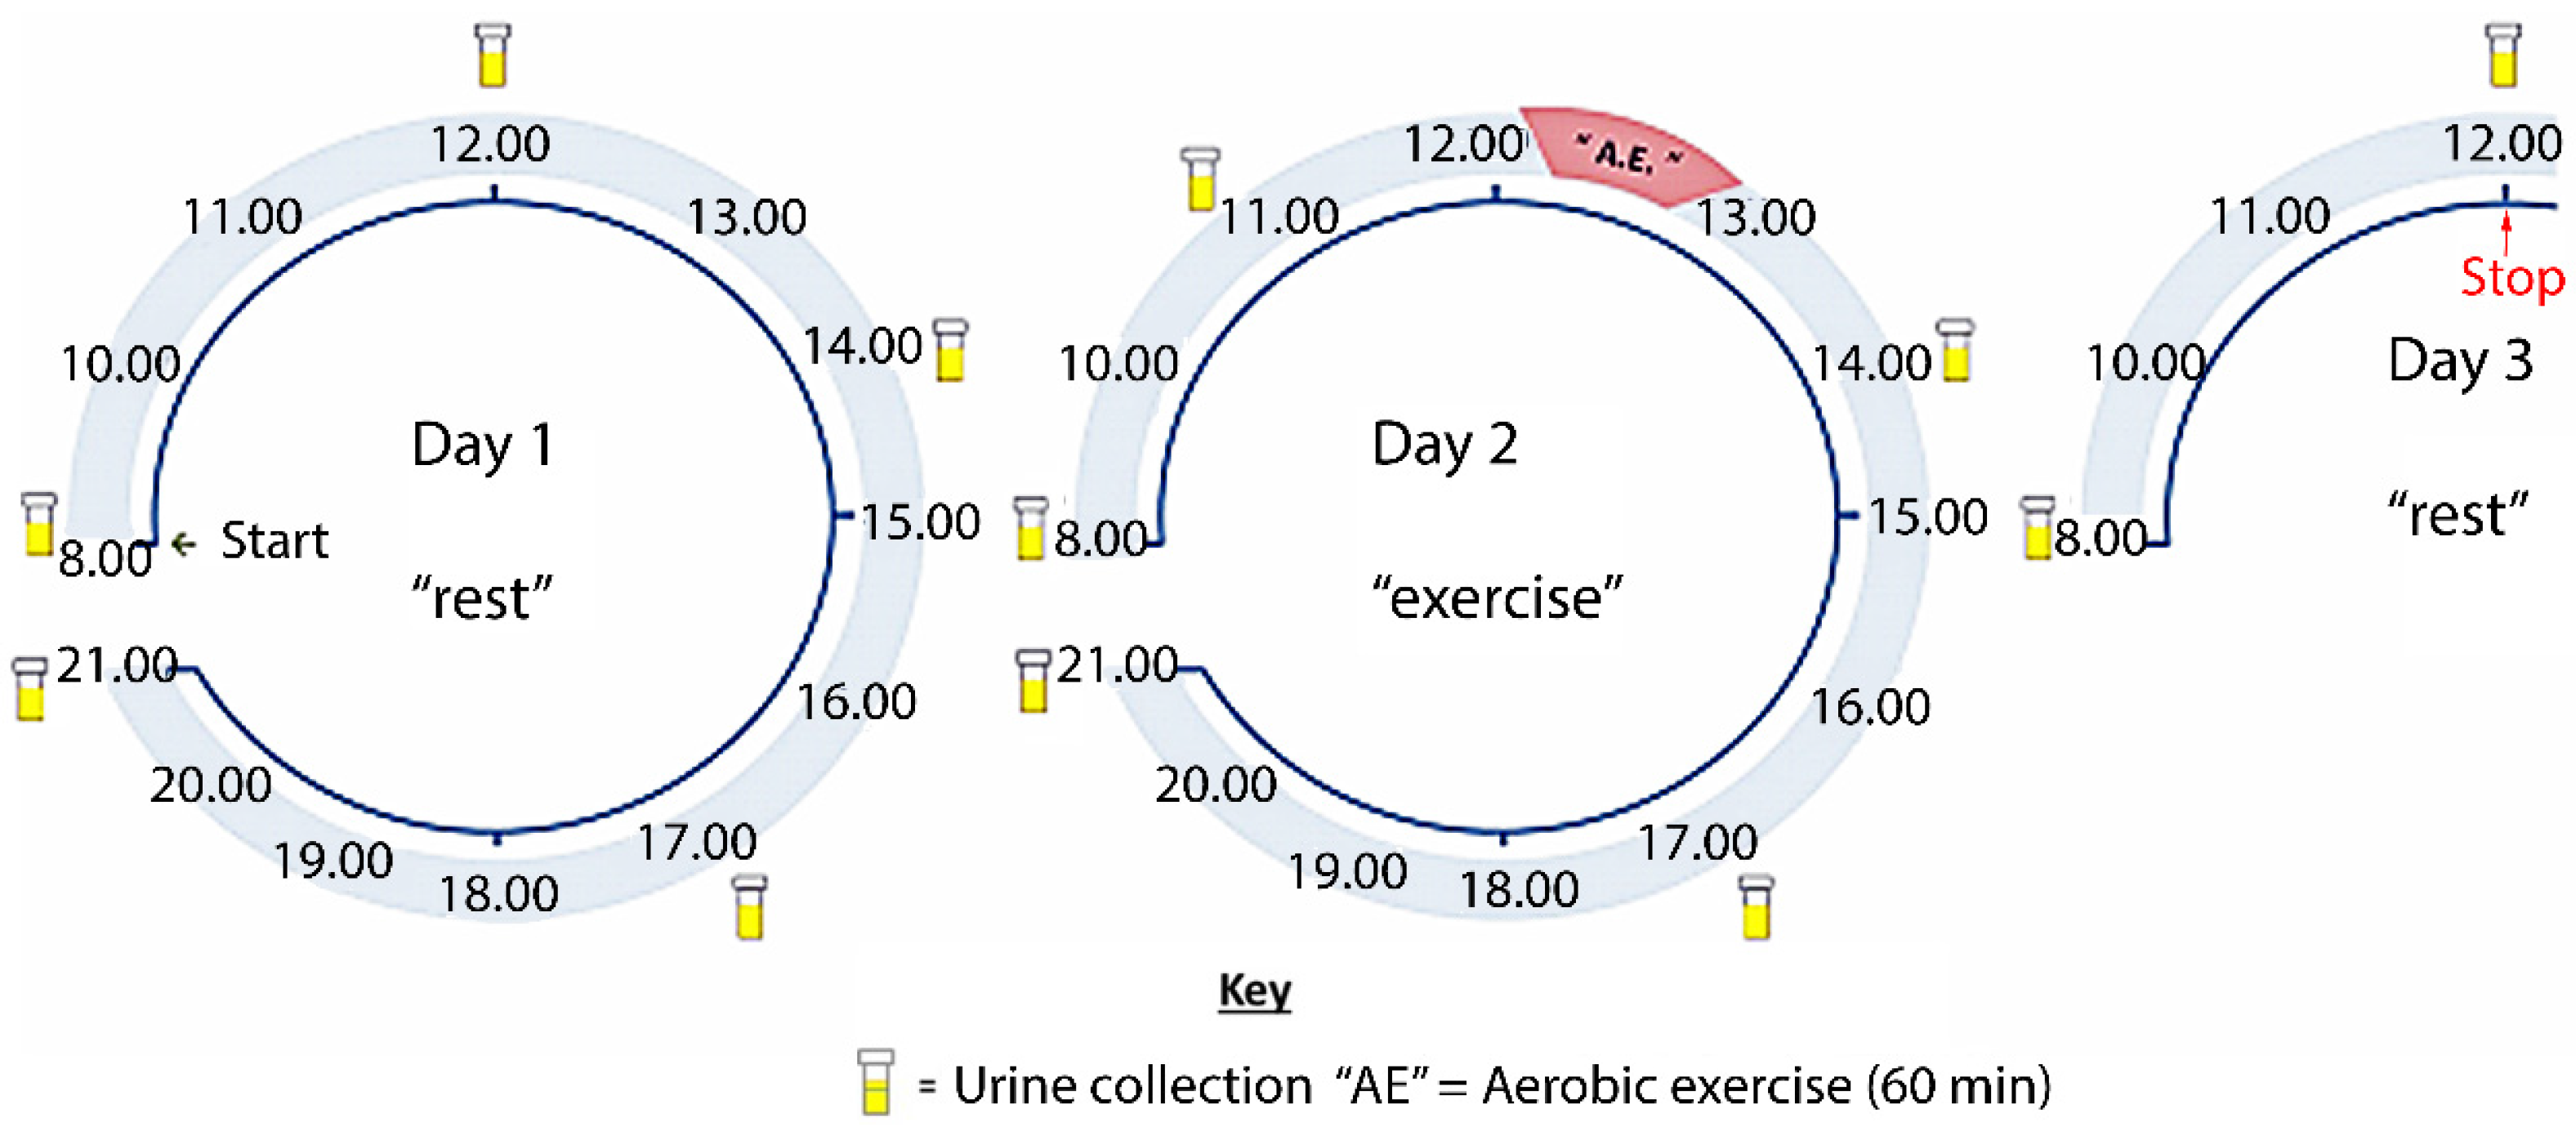
2.2. Subjects and Experimental Design

Ten healthy recreationally active adults, two female, eight male (mean ± S.D. (minimum–maximum) age 28 ± 7 (23–48) years.; stature, 167 ± 30 (165–189) cm; body mass, 68.5 ± 14.7 (54.5–107.5) kg; VO2max, 42.1 ± 5.4 (33.5–53.4)mL/kg−1/min−1; maximal cycling work rate (WRmax) 134 ± 61 (155–369) W) volunteered and provided written informed consent to participate in the study, which was approved by the ethics committee of the School of Science and Sport, University of the West of Scotland. Participants recruited were staff and students from the University of the West of Scotland, Hamilton Campus and all had previously taken part in several maximal exercise tests. All procedures were conducted in accordance with the declaration of Helsinki.
Each participant visited the laboratory on two separate occasions to complete two cycling exercise trials. Trials were separated by at least five, but no more than 10 days. The first trial was an incremental exercise test until exhaustion in order to determine aerobic capacity (VO2max) and the second was a 45 min submaximal exercise test. Urine samples were collected the day before, the day of, and the day after the submaximal exercise test (Figure 1). Participants were asked not to exercise 24 h prior to the maximal test and for the duration of the urine collection period other than the submaximal trial. They were also asked to refrain from the consumption of alcohol 24 h before each test, caffeine for 6 h before testing, or consume anything other than water for 3 h before testing.

2.3. VO2max Test

On their first visit after standard anthropological measurements, VO2max and WRMax were measured using a continuous graded exercise test on an electronically braked cycle ergometer (Lode Excalibur, Groningen, The Netherlands) maintaining an initial workload of 50 W. Work rate was increased in a ramp protocol at a rate of 15 W/min until the participant could no longer maintain a cadence of 50 revolutions per minute at which point the test was stopped. Throughout the test, heart rate was measured by telemetry (Polar Electro Oy, Kempele, Finland) and expired gas was measured breath by breath via indirect calorimetry (Medgraphics, Milan, Italy) and analysed for respiratory variables. The indirect calorimeter was calibrated immediately prior to each test using calibration and reference gases (calibration gas: 12% O2, 5% CO2; reference Gas: 21% O2, 0% CO2). Volume was calibrated using a 3 L syringe. Following data collection, VO2 data was filtered to delete values that were less than or greater than the rolling seven breath mean ± two standard deviations. All 10 participants obtained a plateau in VO2 (as determined by a rise in VO2 of <50% of the expected increase for the given WR) fulfilling the criteria for VO2max [16]. Seven of the 10 participants achieved a true plateau in VO2 (defined as no increase or a reduction in VO2 despite increased WR). Although rating of perceived exertion was not recorded in the present study, all 10 particpants also achieved two of the three secondary criteria for the determination of VO2max. Specifically, the respiratory exchange ratio (ratio between carbon dioxide production and VO2) exceeded 1.10 and heart rate at the end of the maximal exercise test was within 10 beats/min of the theoretical maximum (determined by 220 − age). Smoothed data was subsequently averaged over a rolling seven breath mean and the largest value obtained was determined as the participant’s VO2max.

2.4. Submaximal Test

Participants cycled on an electronically braked cycle ergometer at light and moderate intensities for a total duration of 45 min. The exercise protocol comprised of a 5 min warm up at 50 W, 15 min at 40% of WRMax (established from the initial VO2max test), 15 min at 50% WRMax, and 10 min at 60% WRMax. Heart rate and expired gas were continuously monitored throughout as previously described.

2.5. Sample Collection and Preparation

Coded pre-labelled sterilised urine containers, Eppendorf tubes, disposable pipettes, and ziplock bags were distributed to the subjects. Subjects collected their first urine pass after waking (sample 1) on the day before, the day of, and the day after the submaximal exercise session. Typically the first sample was collected between 6 am and 8 am The time of the remaining urine collections was standardized as illustrated in Figure 1. Subjects were not restricted from urinating at any other time outside the sample windows for ethical reasons. Urine samples collected between 11 am and 17 pm were transferred to Eppendorf tubes within 5 min and deposited in a laboratory freezer at −80 °C until analysis. First pass samples and 21 pm samples were collected at home. The Eppendorf tubes were deposited inside sealed ziplock bags in the subject’s home freezer (~−20 °C) within 5 min of collection. Following completion of the study, the samples were transferred to a polystyrene freezer box surrounded by ice and ice blocks and transported to the laboratory freezer where they remained until analysis. Samples were thawed at room temperature and prepared for LC-MS analysis. Urine (200 μL) was thoroughly mixed with 800 μL of ACN, followed by centrifugation at 7840 relative centrifugal force for 5 min; 800 μL of supernatant was then transferred to a LC auto-sampler vial (Thermo Fisher, Loughborough, UK). The instrumental variation was also minimised by running the 12 samples for each subject in blocks. Since the final normalisation is subject specific, rather than being based on the full cohort this reduces the impact of technical variations in a long run. Samples are designated as follows D = day, S = sample number within a day e.g., D1S1 = day 1 sample 1. Pooled samples were interspersed throughout the run to check for technical variation. Within the blocks of 12, the samples were randomised. Four standard mixtures containing 252 standards were run also after the samples.

2.6. LC-MS Method

LC-MS data were acquired on an Dionex 3000 HPLC (Thermo Fisher Scientific, Hemel Hempstead, UK) coupled to an Exactive Orbitrap (Thermo Fisher Scientific) in both positive and negative mode set at 50,000 resolution (controlled by Xcalibur version 2.1.0; Thermo Fisher Scientific, Hemel Hempstead, UK). The mass scanning range was m/z 75–1200, the capillary temperature was 320 °C and the sheath and auxiliary gas flow rates were 50 and 17 arbitrary units, respectively. The separation was performed on a ZIC-pHILIC column (150 mm × 4.6 mm, 5 μm from HiChrom, Reading, UK) in binary gradient mode. The mobile phase used was 20 mM ammonium carbonate buffer (pH 9.2) and pure ACN; the flow rate was 300 μL·min−1. The gradient was programed as follows: 0 min 20% A 80% B to time 30 min 80% A 20% B. The injection volume was 10 μL and the sample tray temperature was controlled at 12 °C during the measurement. Samples were run in a stratified method with between subject samples placed in randomised order. MS2 spectra were obtained at 35 V by using an LTQ-Orbitrap under the same conditions described for the Exactive Orbitrap.

2.7. LC-MS Data Processing and Statistical Analysis

Raw LC-MS files were processed by using m/z Mine 2.14 [17] and the accurate masses were searched against an in house metabolite database prepared by including data from the Human Metabolome database, Lipid Maps and the Metlin database. Graphical representations, tabular features and statistical analysis (p-value generation) were performed in Excel (Microsoft Office 2013). The mean of the peak areas for each metabolite across the samples within each day was calculated and then the area for each metabolite was divided by the mean. This provided a subject-specific normalisation within the non-exercise and exercise days. All subsequent metabolite responses, paired t-test and fold changes (ratio) were conducted on the new data set. The raw data files can be accessed on the Metabolights website [18] with the identifier number MTBLS306.

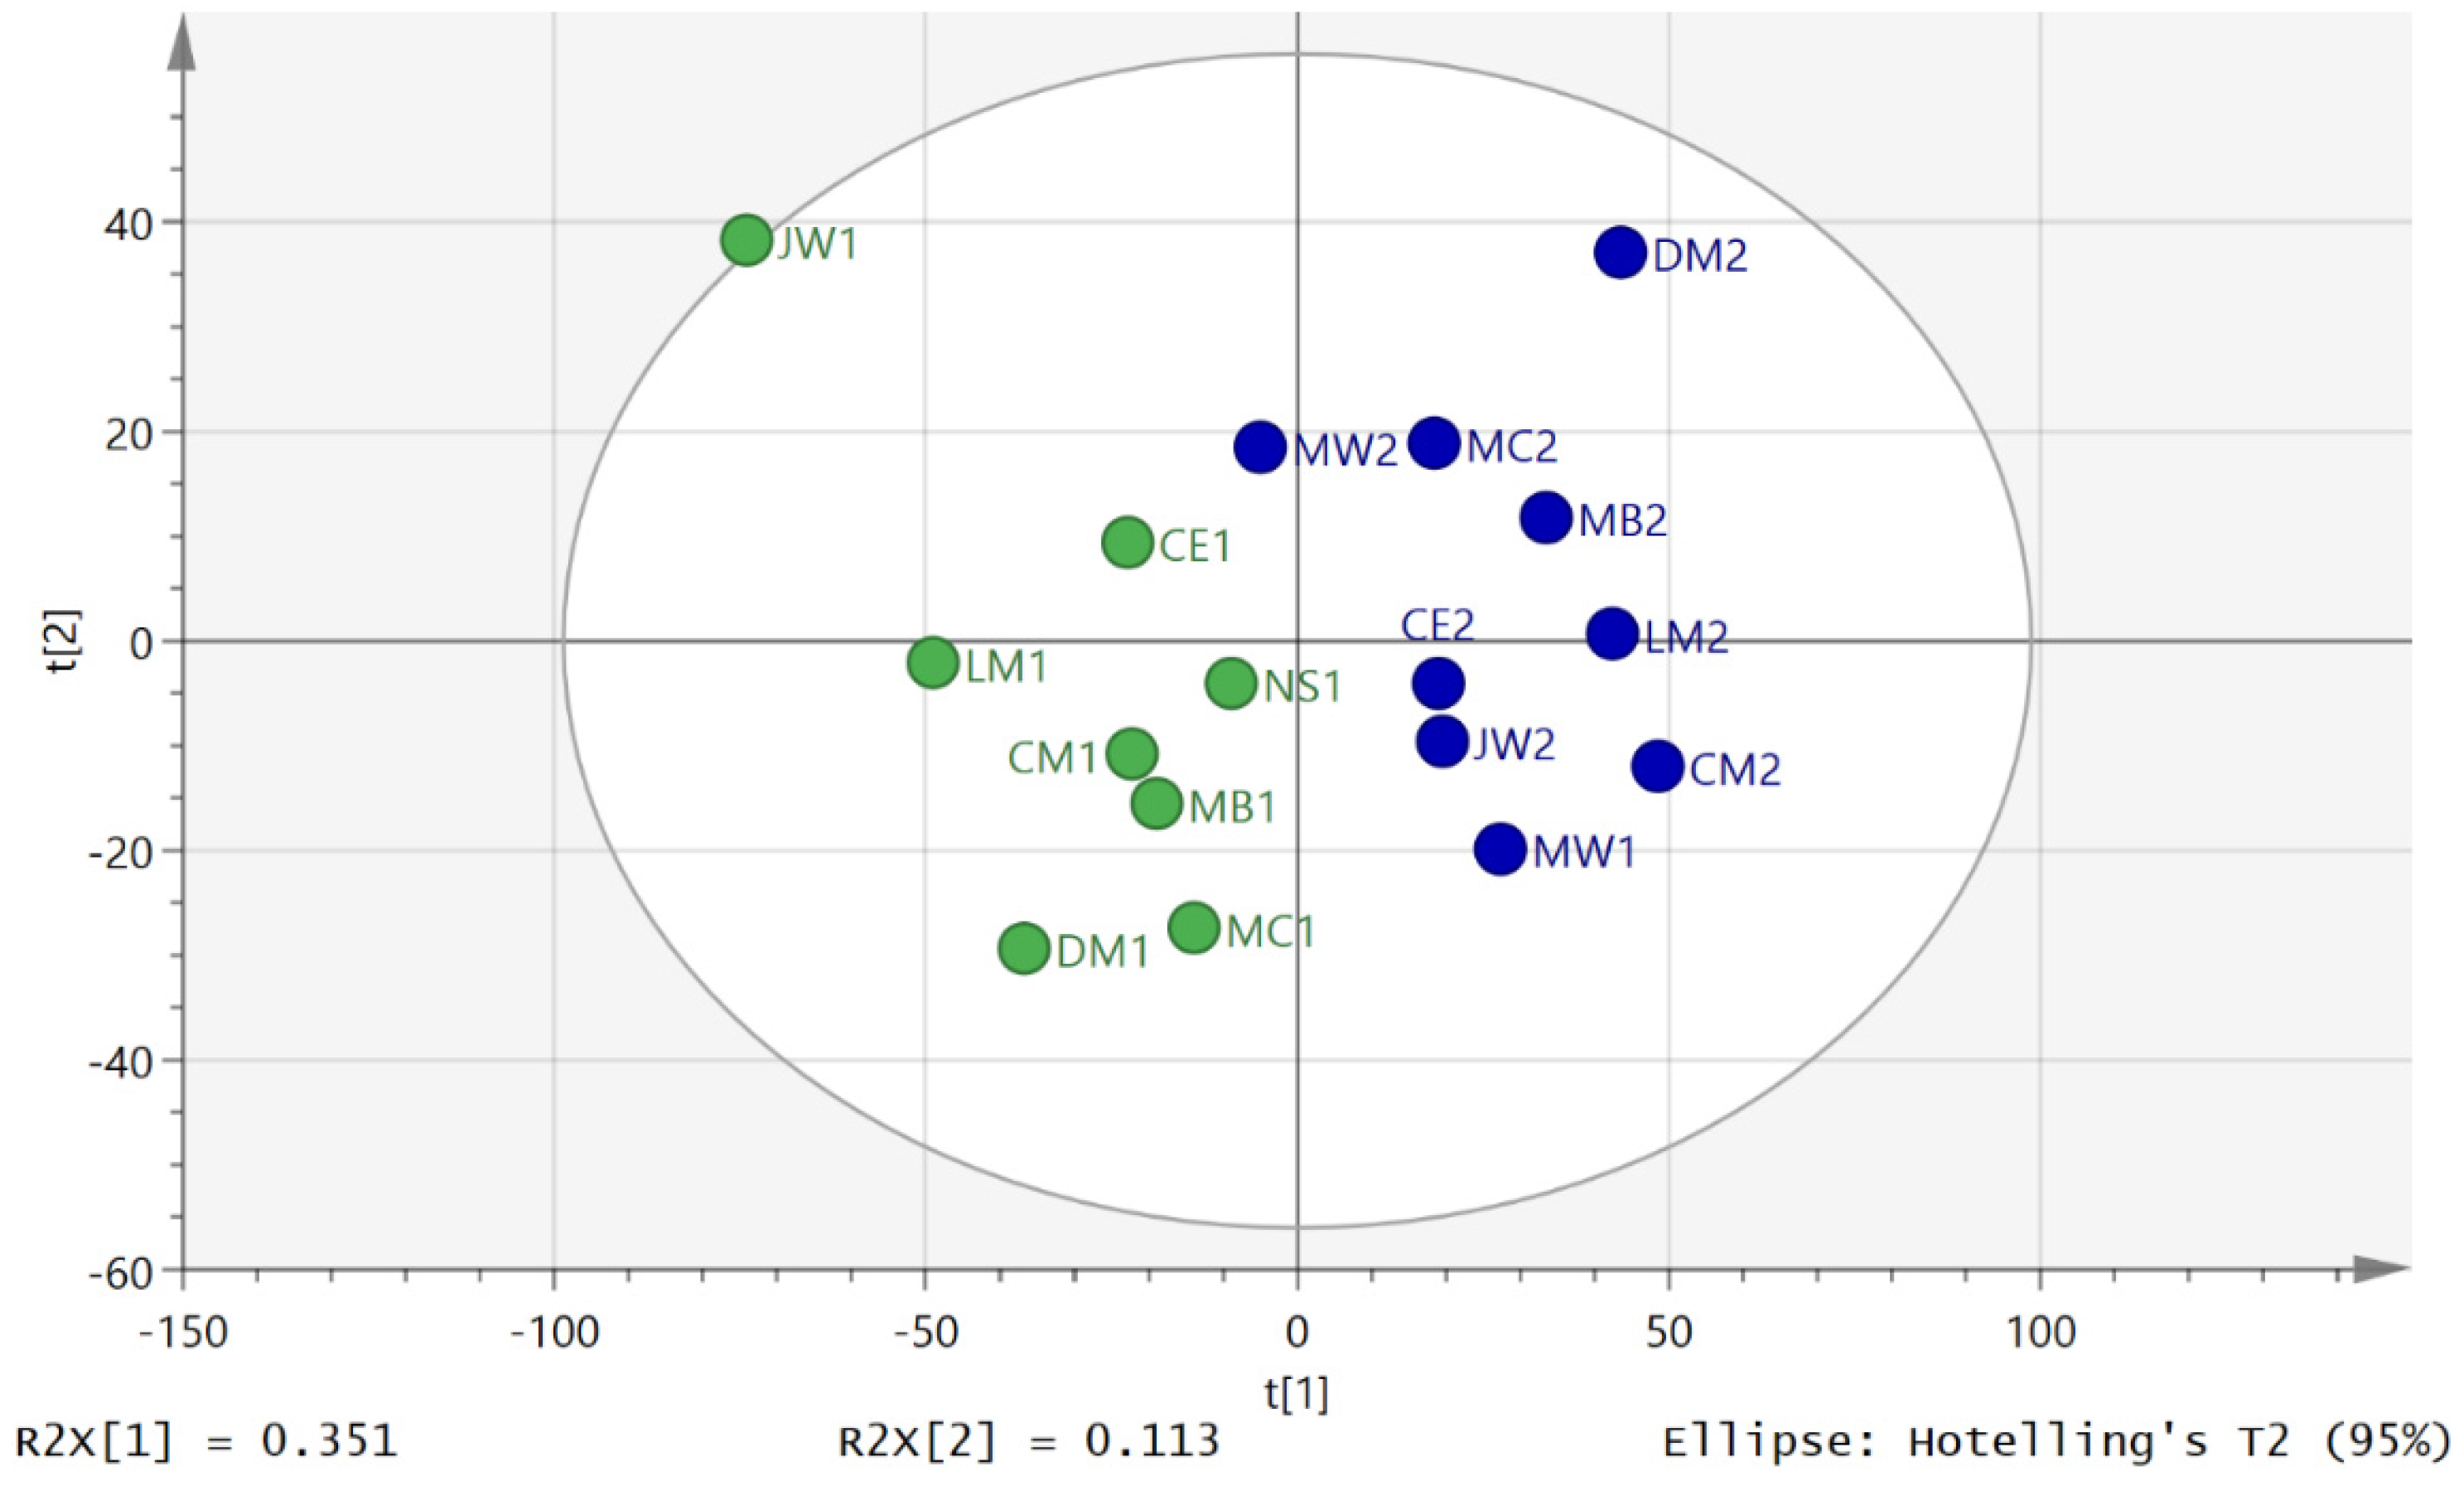
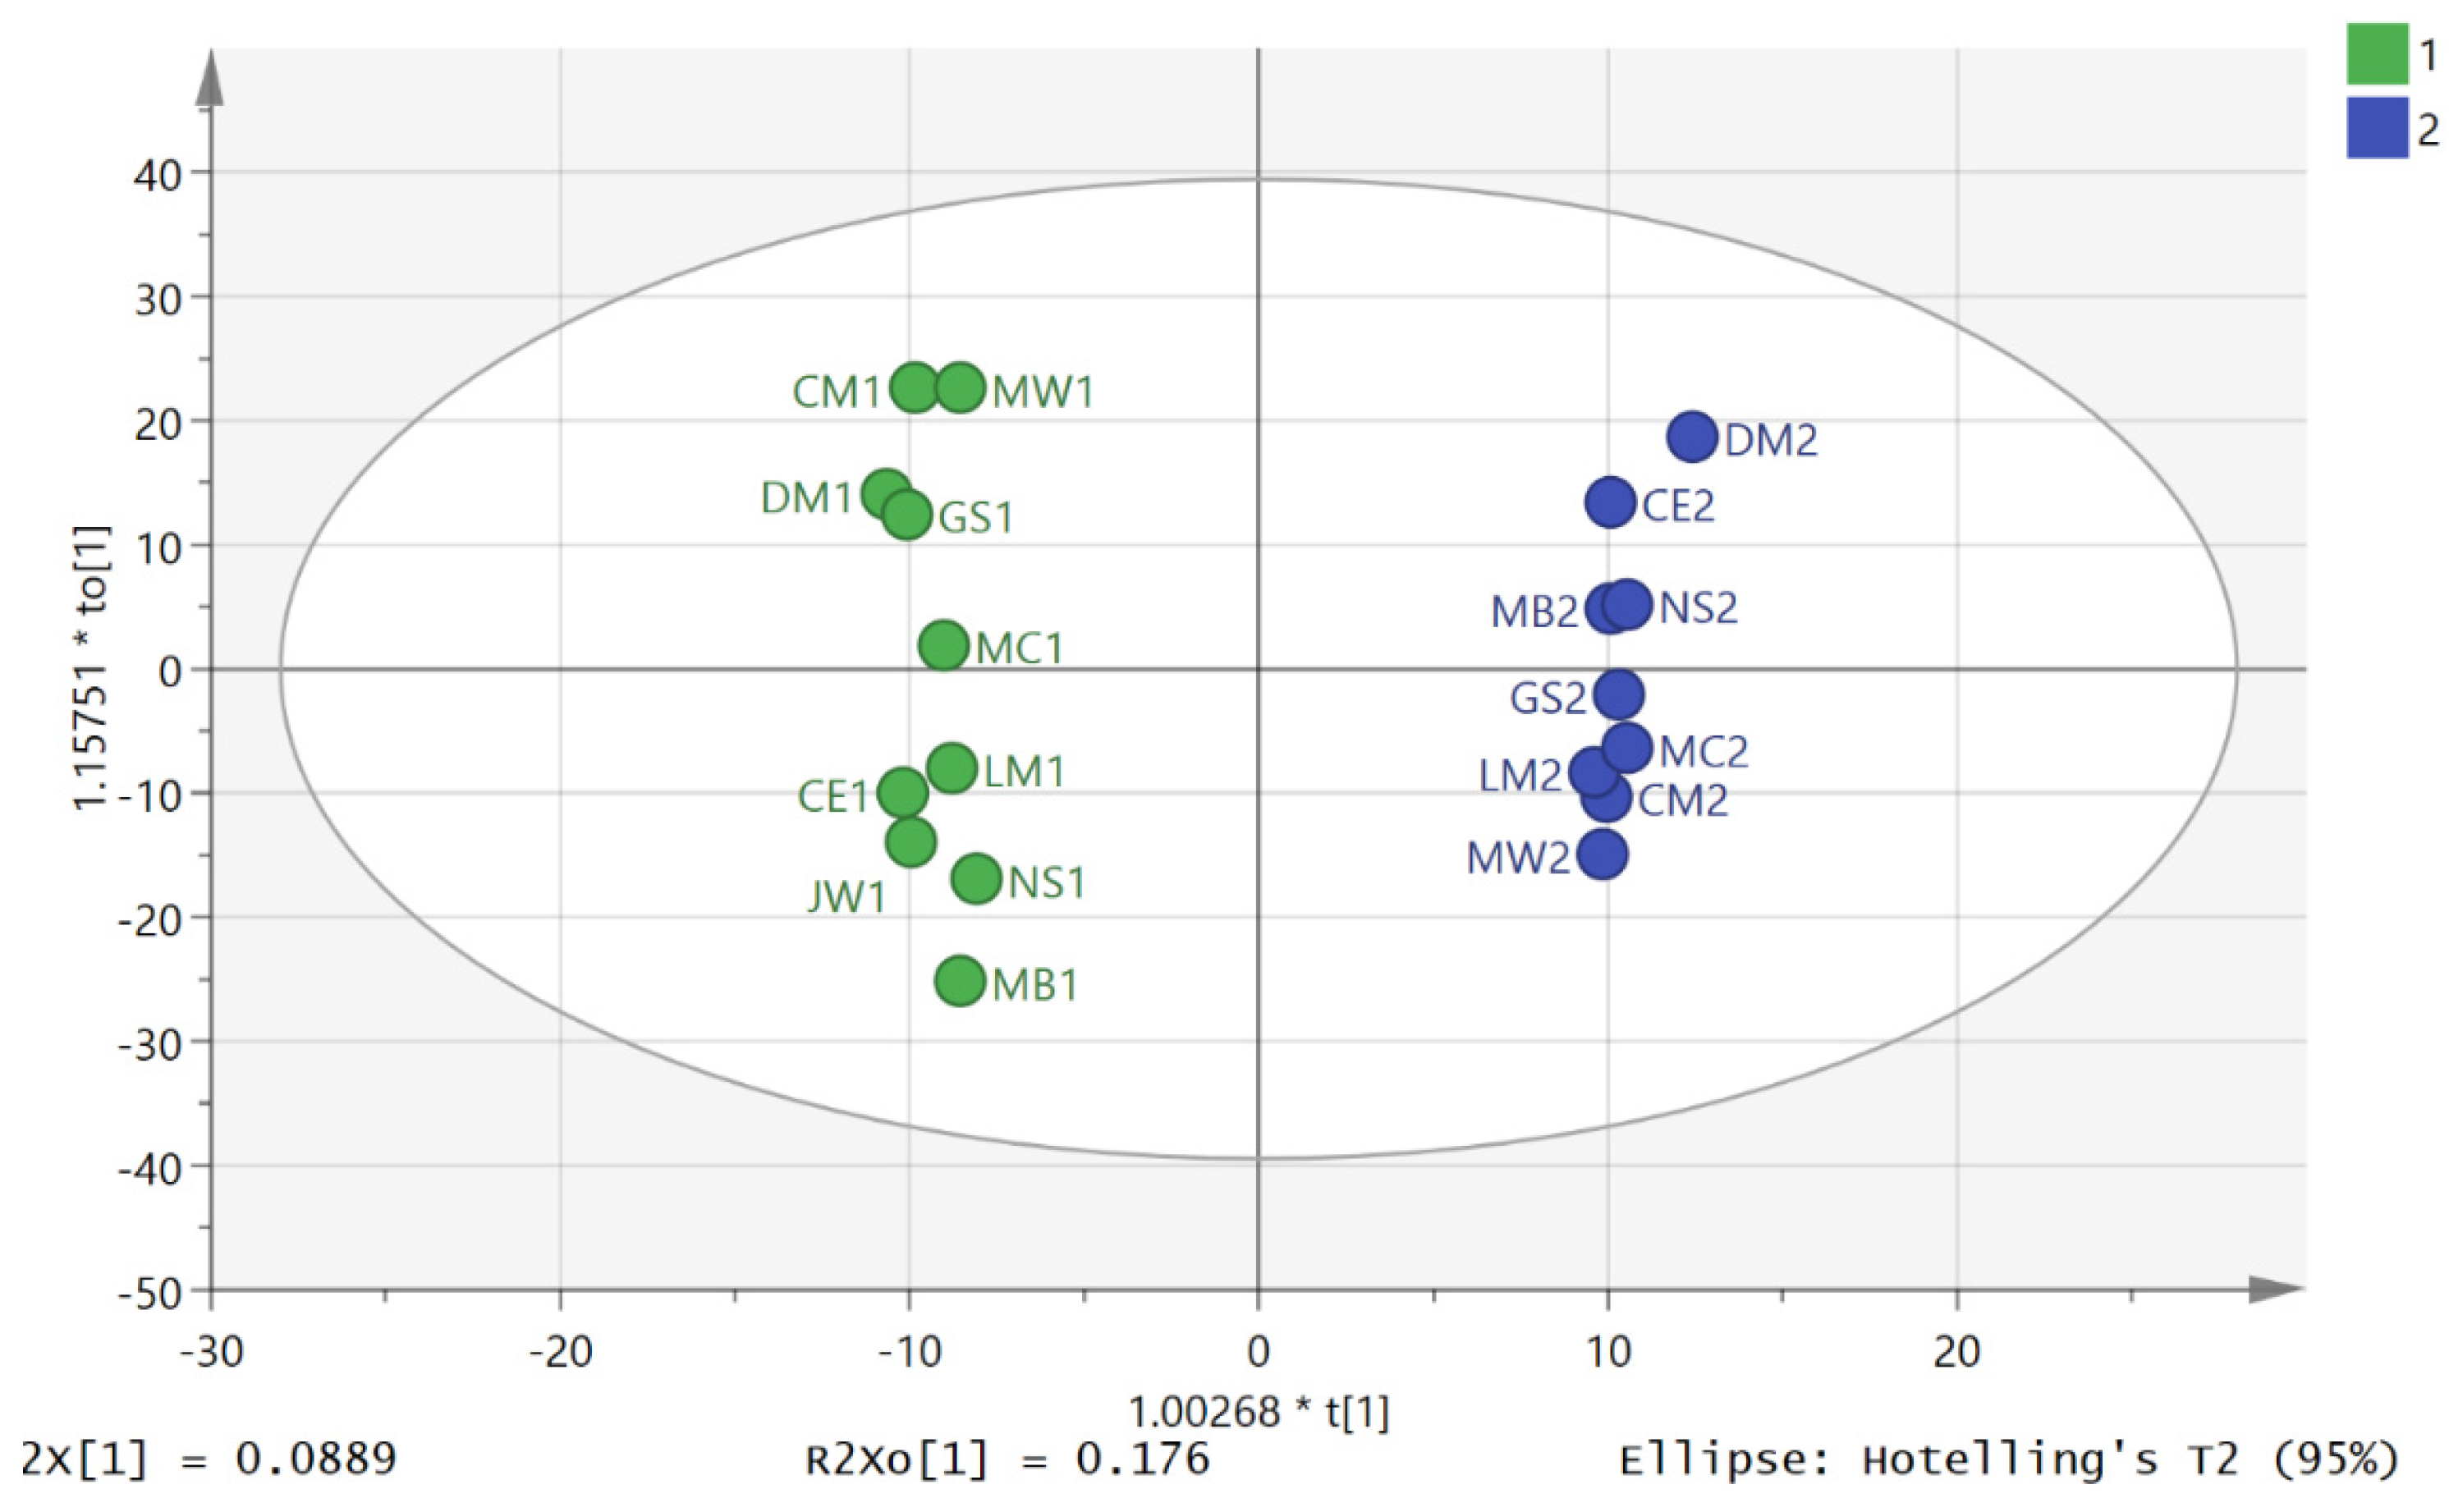
2.8. Multivariate Analysis

SIMCA-P version 14.0 (Umetrics, Sweden) was used for multivariate analysis which included PCA, OPLS-DA and Orthogonal Partial Least Squares (OPLS). The data were centred, and Pareto scaled for PCA and OPLS-DA and OPLS in order to generate S-plots for visualisation of the components with significant influence in the dataset.

3. Results

3.1. Physiological Responses to Submaximal Exercise

The mean VO2 at 40%, 50%, and 60% of WRmax was 21.2 ± 2.5 mL/kg−1/min−1, 25.8 ± 2.5 mL/kg−1/min−1, and 30.8 ± 4.1 mL/kg−1/min−1, respectively. The mean HR during the submaximal exercise test was 115 ± 12.8 bpm, 156 ± 14 bpm, and 169 ± 13.6 bpm and 40%, 50%, and 60% or WRmax, respectively.

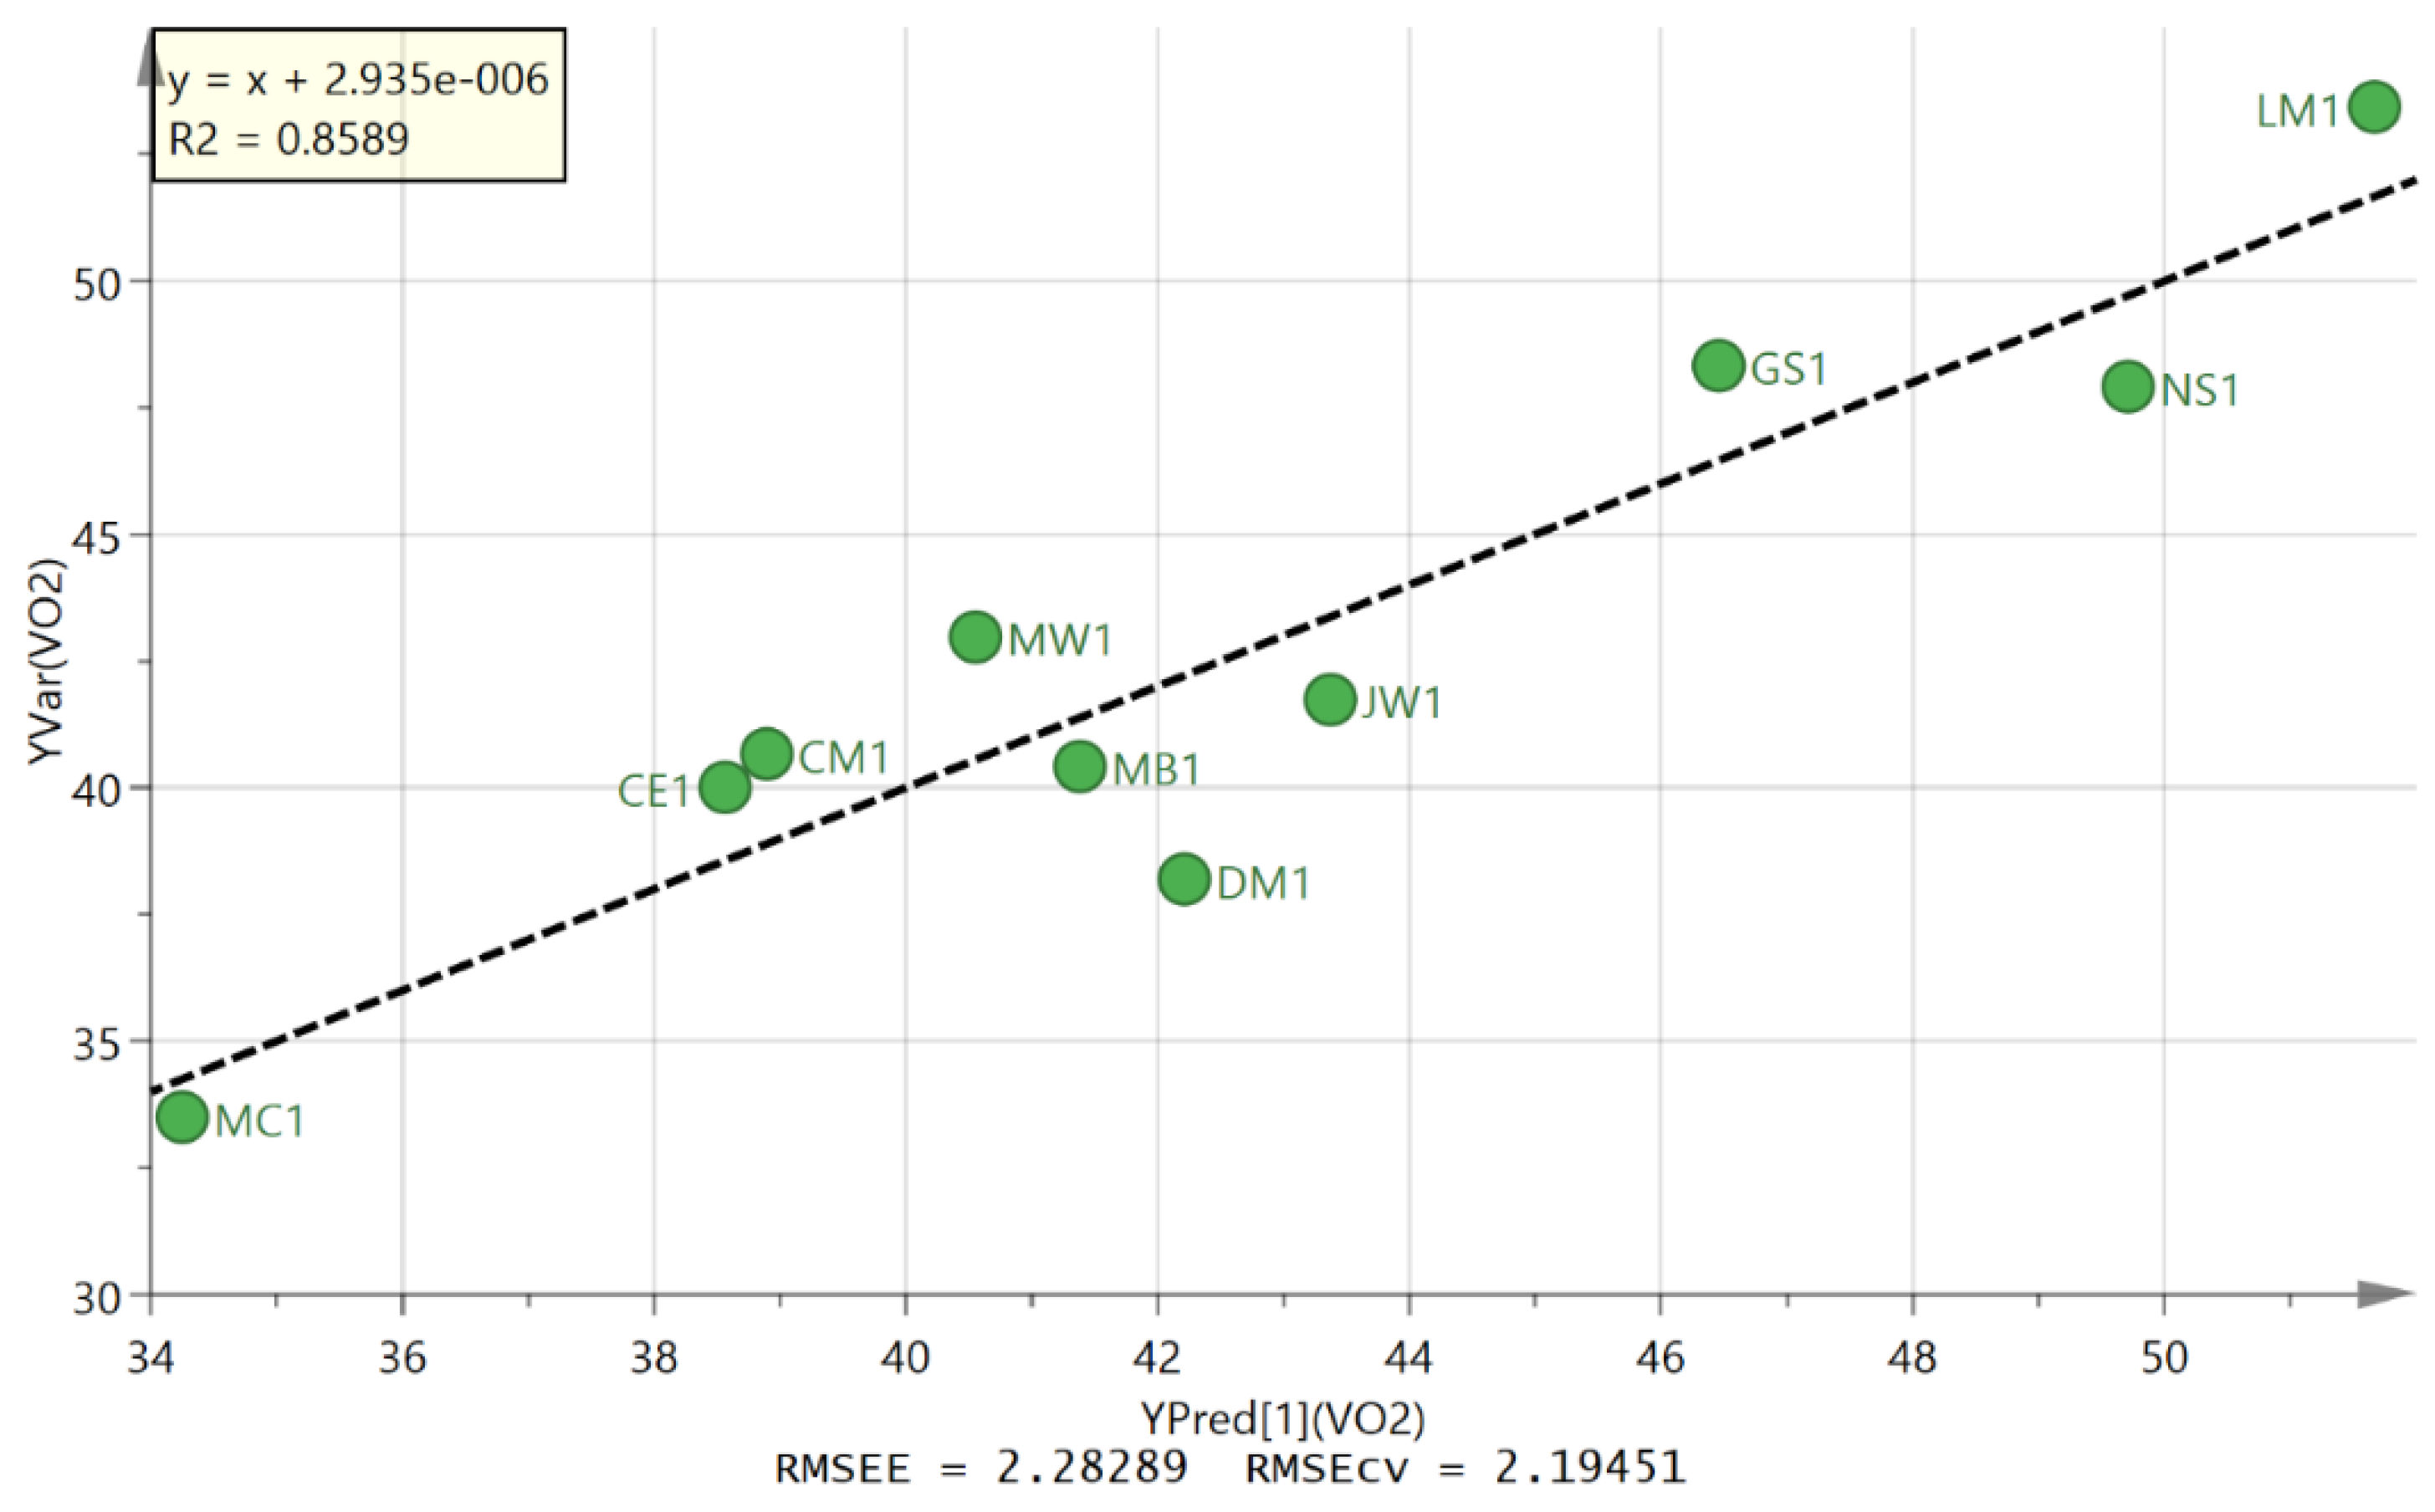
3.2. Metabolite Profiling

Longitudinal sampling of urine provides a non-invasive method of sample collection that provides rich data sets and produces samples with greater volume than plasma, as well as containing higher concentrations of particular metabolite over the period between samplings. In contrast, even if plasma is taken frequently it will always represent an open system where taking a sample at a slightly different time might give a different answer. In this study we used a 37 h protocol (Figure 1) in order to generate an understanding of the acute effects of exercise and the duration of that response in the metabolite profiles. In addition, sampling on the pre-exercise day allowed observation of metabolite variations occurring as a diurnal rhythm. The samples were run in blocks of 12 samples for each individual with the samples randomised within each block. This method of running minimises instrumental drift since the instrument only has to remain stable over each block of 12 samples since the normalisation process for the individual within removes instrumental effects in relation to earlier or later blocks.
The output from data extraction followed by searching against the data base yielded metabolites which were identified to MSI levels 1 or 2 [19] according to either exact mass (with <3 ppm deviation) or exact mass plus retention time matching to a standard.There was no classification of the samples by PCA when the raw data was used as the basis of the model and it was also not possible to fit an OPLSDA model to the raw data was used. This was in line with our experience in our pilot study [12] where the was no separation in the PCA model when the raw data was used. In addition, in the previous study normalisation against creatinine did not make any difference to the fit of the model and it was concluded as has been observed by others that creatinine normalisation is not always effective [20].
Thus, in order to compare metabolites on the same axis, the areas for each metabolite across all the time-points for day 1 and day 2 were averaged for each individual and then each metabolite area at each time-point was divided by the average to give the proportion contributed to the total output during the day. This approach was similar to that used in our previous study and was discussed at some length in that paper [12]. Figure 2 shows the PCA separation of 19 out 20 samples in the study for the D2S1 and D2S3 following normalisation to individual metabolic output over the five urine samples collected during day 2. One sample was excluded because there were problems with the analytical run. It is clear that there is a marked difference in metabolite profile between the two groups. The same comparison on day 1 between the first (D1S1) and third (D1S3) samples of the day, where there was no exercise intervention, gave a clear separation if one individual’s samples (GS) were excluded from the model (Figure 3). Table S1 summarises univariate comparisons for all the metabolites that are significantly changed between D2S3 in comparison with the rest of the day 2 samples and D1S3 and the rest of the day1 samples. There are a large number of changes and in order to get a clearer picture of the differences between the first and third samples on day 2 and day OPLSDA models of the data were made. Such models emphasise the importance of key variables as variables of importance (VIPs).
There was a very clear separation of D2S1 and D2S3 (Figure 4) obtained by using OPLSDA for classifying D2S1/D2S3 samples. The cross validation plot indicated a strong model as can be seen in Figure S1 where all the points for the blue squares are below the blue square on the right and the plot intersects the y-axis below 0, and the CV ANOVA score for the model was 0.0029. However, a clear separation was also found between the D1S1 and D1S3 samples and the cross validation model for this was also good (Figure 5 and Figure S2), and the CV ANOVA for this model was 0.00097. Thus the composition of the metabolites in urine varies markedly throughout the day whether exercise is used as an intervention or not. Figure S3 shows an S-plot highlighting the features with the most impact (largest VIPs) on the OPLSDA model for the D2S3 and D2S1 samples and table S2 lists the highlighted metabolites. In many cases, exact identity of these features is poorly defined. However, some of the metabolites match the retention times of analytical standards or are well known urinary metabolites. Table 1 shows the metabolites which are important in the OPLSDA model shown in Figure 4 and can be identified with some confidence, the majority have p-values < 0.05. Application of the Benjimini-Hochberg FDR statistical test [21,22] with Q = 0.1 and including 1000 metabolites indicated that all metabolites with a p-value < 0.05 can be regarded as being significantly changed following exercise. Figure S4 shows an S-plot highlighting the features with the most impact on the OPLSDA model for the D1S1 and D1S3 samples and table S3 lists the metabolites with VIP values > 1.5. Some of the important changes in metabolites between the equivalent time points on day 1 and day 2 are similar.
Thus, overall, the number of changes observed as a result of exercise were fewer than in our previous smaller study but some of the changes were consistent with our previous observations particularly with regard to the impact on several purine metabolites and effects on carnitines [12]. In the current study the level of exercise was more carefully controlled than in our previous study and the subjects were in a narrow age range. The additional measurement which was made in the current study was the determination of of VO2max for each of the subjects.
OPLS modelling was used to predict VO2max from the metabolic pattern in urine post-exercise. A weakly fitted model was built by using the D2S3 and day 2 fourth samples (D2S4) samples and then discarding variables of low importance with VIP values < 1. There seems to be no standard way to build such models and it is easy to be misled with regard to their robustness when several variables are used. It is quite surprising how easy it is for software to fit a model based on even a few variables when the number of samples is low. Eventually, by reducing the number of variables, it was possible to produce a plot of predicted against measure VO2max based on a single putatively identified as being an oxoaminohexanoic acid (OHA) (Figure 6). The correlation of predicted VO2max and measured VO2max against normalised level of OHA gave R2 = 0.8589. The formula for the marker compound matched that of 11 compounds in the Metlin database [23] although there are no MS/MS spectra for any of these compounds in the database. Only seven of these compounds have an amine group which would be required for the retention time to be 13.2 min on the HILIC column as observed for the current compound. Three of the isomers occur in the lysine degradation pathway. The marker is an abundant compound in urine and two main isomers of it occur in urine with the marker compound the later running of the pair of isomers (extracted ion trace Figure 7).
The MS2 spectrum (Figure S5) showed losses of formic acid and water, confirming the presence of a carboxylic acid group followed by loss of a hydroxyl group but not much else. Since it seemed likely that this marker compound was in the lysine degradation pathway, another model was constructed to include all the metabolites present in the samples identified or putatively identified as being in the lysine degradation pathway according to the database search. Although it was possible to fit apparently strong models using several of these variables it was clear from the non-significant CVANOVA scores that using several variables produced over-fitting and the majority of the predictive power belonged to OHA. Table 2 shows all the predicted values for VO2max based on a linear plot of the normalised levels for OHA for each individual in each sample collected on day 2. The D2S3 samples have the best predictive power although some of the other data points are predictive and this was generally in the case for the samples that did not have a strong spike in OHA post-exercise and hence are those with lower VO2max values. Thus, clearly, the most important marker of VO2max is the compound putatively identified as OHA. The candidate marker compound was also assessed by using an alternative method of normalisation based on absolute peak areas. It was observed that the OHA isomer remained relatively constant between D2S1 and D2S3 in comparison to OHA. The plot shown in figure S6 plots VO2max against the following ratio:
(area OHA D2S3/area OHA isomer D2S3)/(area OHA D2S1/area OHA isomer D2S1)
This simpler treatment produces a plot with R2 = 0.654. Although the R2 value for this plot is not as good as the peak area normalised to individual metabolic output this gives some confidence that the observation is not an artefact of the data pre-treatment which introduces additional smoothing into the data. Thus, OHA shows some promise as a predictor of VO2max.

4. Discussion

Comparing the compounds responsible for the separation between D2S1 and D2S3, the post-exercise samples have higher levels of the purine metabolites hypoxanthine, guanine, deoxyinosine, inosine, and xanthosine. Increases in purine metabolites following exercise been observed for many years athough the focus is usually on hypoxanthine [24,25,26,27,28,29]. In our previous study we observed the same wider effect on several purine metabolites as is observed in the current data [12]. None of the above purines are significantly changed between D1S1 and D1S3 and uric acid levels decrease between D1S1 and D1S3. Thus the “purine response” obviously requires vigorous physical exercise rather than normal everyday activity to manifest. Methyl adenosine, dimethyladenosine, and dimethyl guanosine all decrease significantly between D1S1 and D1S3 but no significant changes are observed for these metabolites between D2S1 and D2S3. There are other classes of metabolites which typify the response to acute exercise. Nonanoyl carnitine, decanoyl carnitine, and ketodecanoyl carnitine all increase between D2S1 and D2S3. In contrast, several acylcarnitines are significantly decreased between D1S1 and D1S3. The increase in acyl carnitines between D2S1 and D2S3 may be related to a decreased demand for fatty acids during a short bout of exercise where there is a switch towards glycolysis and in order to maintain ATP levels under conditions of high oxygen demand. Fatty acids are removed from the mitochondria as their carnitine conjugates in order to allow acetyl CoA to enter the Krebs cycle. Panthothenic acid levels have been observed to rise following exercise previously and this is the case in the current study where there is an increase between D2S1and D2S3 whereas there is a decrease between D1S1 and D1S3. It has been proposed that increased levels of pantothenate in urine might indicate an increased requirement for CoA but it is more likely that this indicates inhibition of CoA biosynthesis which is tightly regulated by pantothenate kinase (PK) activity [30]. Acetyl CoA inhibits PK by allosteric binding and an increase in pantothenate indicates a decrease in CoA biosynthesis. Fatty acid oxidation requires an excess of CoA and a decrease in CoA levels would decrease fatty acid oxidation since it is energetically more favourable to rely on oxidation of acetyl CoA generated from glycolysis in the Krebs cycle. Lactate as the end product of glycolysis increases between D2S1 and D2S3 (Table 1) but there is no change between D1S1 and D1S3 (Table 1). Increased lactate indicates that not all the pyruvate produced by glycolysis can be used by the Krebs cycle which mainly produces energy on the form of NADH which has to oxidised via the terminal respiratory chain in order to yield ATP and thus requires oxygen. The adrenaline metabolite metanephrine is elevated post-exercise as is methoxyhydroxy phenylethyleneglycol sulfate which is also a metabolite of adrenaline. Increases in adrenaline metabolites post-exercise have been observed previously [31]. GABA levels are lower after exercise and the GABA metabolites oxobutanoate and hydroxy butyrate sulfate are elevated. Dihydroxyphenyl lactate, dihydroxybenzoate, and phenacetyl glycine acid are elevated between D2S1 and D2S3 and these are generally regarded as being products of gastrointestinal bacterial action. Elevation of microbial products has previously been reported post-exercise [9,32]. These metabolites were not changed between D1S1 and D1S3. Testosterone sulphate is elevated between D2S1 and D2S3 which might reflect and increase in testosterone levels post-exercise which has been observed previously and linked to increased anabolic metabolism [33]. Similarly, the hydrocortisone metabolite tetrahydroaldosterone glucuronide is elevated post-exercise and relects the fact the hydrocortisone is strongly involved in energy metabolism and it has been proposed that it is directly involved in nitric oxide production [34,35,36]. There are three bile acids which are important in the separation between D2S1and D2S3. Two of the bile acids are glucuronide conjugates and such conjugates are used to remove excess bile acids from the body. In the current case the levels of the conjugates fall thus indicating and possibly and increased demand for bile acids to facilitate uptake of lipids from the gut since post exercise there is an increased requirement for fatty acids. However, the same pattern is observed in the D1S1 and D1S3 comparison thus the demand for bile acids seems to be at its lowest in the early morning since none of the other time points in table S1 differ significantly from the the S3 time points and both day 1 and day 2. Several amino acids and amino acid derivatives are lowered between D2S1 and D2S3 but these changes are largely the same between D1S1 and D1S3. Exceptions include an elevation in an isomer of 5-hydroxytryptophan, possibly 3-hydroxytryptophan which was found to be elevated in our previous study [12] and carboxyethyl arginine (CEA). CEA is an advanced glycation end product that has been observed previously to occur in human urine and plasma [37,38]. This compound forms by reaction between arginine and methylglyoxal which is formed as a side product of glycolysis and it has been shown that CEA is an inhibitor of nitric oxide synthase [38] in which case its presence in the body where vassodilation is required may not be desirable.
The observation of a single metabolic marker which is apparently correlated to VO2max is of great interest. A previous study aimed to find markers which could predict VO2max and found that a model based on a combination of 4-ethylphenylsulfate, tryptophan, γ-tocopherol, and α-hydroxyisovalerate was predictive of VO2max in a cohort of 77 subjects with R2 = 0.66 [39]. Although the current study is small the single OHA marker in the current case gave R2 = 0.8589 and thus a greater degree of correlation to VO2max than the previous study. The current study can only be considered to have made a preliminary observation and a follow up trial with an independent cohort of subjects would be require to definitely prove this association. The trial could be reduced in terms of sample collection since it is the difference between the first void sample and the first post-exercise sample which is most predictive of VO2max and with a high ratio of first post-exercise to first void sample indicating a high VO2max as indicated by the plot shown in figure S6. Although the MW of the marker compound is small, further work is required in order to make a definitive identification since several isomers of it are known. A notable strength of the current study is that we were able to obtain valid determinations of VO2max in all participants which is of vital importance in terms of assessing the predictive of any metabolic markers. This is likely due to the fact that particpants had completed several previous maximal exercise tests prior to participation in the present study. This is an important point to consider for future larger scale research work in this area.

5. Conclusions

The current study further validates our approach of collecting every urine sample over a period of time and then normalising each individual to their total output for each metabolite over that time. This approach allowed separation of pre- and post-exercise samples based on PCA analysis whereas without using this approach the separation was not possible. In our previous study we observed many of the changes which can be seen in the current study but there were also more changes in microbial metabolites, amino acids metabolites, acyl carnitines, and steroids [12]. The current results clearly revealed the impact of exercise on established markers for exercise such as hypoxanthine and inosine and, in addition, many other compounds were affected by exercise. In order to differentiate metabolites which vary through the day and those affected by exercise the metabolites which varied during the non-exercise day were evaluated. Some of these were the same as the metabolites changing on the non-exercise day such as bile acid metabolites but there were many metabolites which were affected only by exercise. A potential predictive marker for VO2max was identified but further trials will be required to determine whether or not this is an artefact of the large number of metabolites available as variables. The approach of collecting longitudinal urine samples is simple and non-invasive and the observed output gives real sense of metabolism in action and could have a role in assessing overall fitness and diagnosing underlying disease.

Supplementary Materials

The following are available online at https://www.mdpi.com/2218-1989/6/1/9/s1, Figure S1: Cross validation model for the classification of D2S1S3 by OPLSDA, Figure S2: Cross validation of the separation of D1S1 and D1S3 by OPLSDA, Figure S3: S-plot for OPLSDA model of D2S3 vs. D2S1 highlighting the metabolites listed in Table S1, Figure S4: S-plot for OPLSDA model of D1S3 vs. D1S1 highlighting the metabolites listed in Table S2, Figure S5: MS2 of oxoaminohexanoic acid obtained with a collision energy of 35 V, Figure S6: Plot of (area OHA D2S3/area OHA isomer D2S3)/(area OHA D2S1/area OHA isomer D2S1), Table S1: Comparison of D1S3 and D2S3 sample to the other samples on days 1 and 2, Table S2: Metabolites with the highest correlation to the OPLSDA model for D2S3 vs. D2S1, Table S3: Metabolites with the highest correlation to the OPLSDA model for D1S3 vs. D1S1.

Author Contributions

Chris Easton, Mia Burleigh organized the study, made physiological measurements, and collected samples, Dave Watson, Tong Zhang, Ali Muhsen Ali prepared and analysed samples and extracted data. Dave Watson and Ali Muhsen Ali modeled data. Eva Daskalaki, Dave Watson, Chris Easton, Tong Zhang wrote the manuscript.

Conflicts of Interest

The authors declare no conflict of interest.

References

  1. Sarris, J.; O’Neil, A.; Coulson, C.E.; Schweitzer, I.; Berk, M. Lifestyle Medicine for Depression. BMC Psychiatry 2014, 14, 107. [Google Scholar] [CrossRef] [PubMed]
  2. World Health Organization. Unhealthy Diets & Physical Inactivity; World Health Organization: Geneva, Switzerland, 2009; pp. 1–2. [Google Scholar]
  3. World Health Organization. Deaths from Cardiovascular Diseases and Diabetes. Available online: http://www.who.int/mediacentre/factsheets/fs317/en/ (accessed on 23 February 2016).
  4. Allender, S.; Foster, C.; Scarborough, P.; Rayner, M. The Burden of Physical Activity-Related Ill Health in the UK. J. Epidemiol. Community Health 2007, 61, 344–348. [Google Scholar] [CrossRef] [PubMed]
  5. World Health Organization. Global Health Risks: Mortality and Burden of Disease Attributable to Selected Major Risks; World Health Organization: Geneva, Switzerland, 2009. [Google Scholar]
  6. Scarborough, P.; Bhatnagar, P.; Wickramasinghe, K.K.; Allender, S.; Foster, C.; Rayner, M. The Economic Burden of Ill Health due to Diet, Physical Inactivity, Smoking, Alcohol and Obesity in the UK: An Update to 2006–07 NHS Costs. J. Public Health 2011, 33, 527–535. [Google Scholar] [CrossRef] [PubMed]
  7. British Heart Foundation National Centre. Economic Costs of Physical Inactivity; British Heart Foundation National Centre: Loughborough, UK, 2013; pp. 1–8. [Google Scholar]
  8. Reilly, J.J.; Dick, S.; McNeill, G.; Tremblay, M.S. Results From Scotland’s 2013 Report Card on Physical Activity for Children and Youth. J. Phys. Act. Health 2014, 11, S93–S97. [Google Scholar] [CrossRef] [PubMed] [Green Version]
  9. Daskalaki, E.; Easton, C.; Watson, D. The Application of Metabolomic Profiling to the Effects of Physical Activity. Curr. Metabolomics 2015, 2, 233–263. [Google Scholar] [CrossRef]
  10. Carnethon, M.R.; Gulati, M.; Greenland, P. Prevalence and cardiovascular disease correlates of low cardiorespiratory fitness in adolescents and adults. J. Am. Med. Assoc. 2005, 294, 2981–2988. [Google Scholar] [CrossRef] [PubMed]
  11. Joyner, M.J.; Coyle, E. Endurance exercise performance: The physiology of champions. J. Physiol. 2008, 586, 35–44. [Google Scholar] [CrossRef] [PubMed]
  12. Daskalaki, E.; Blackburn, G.; Kalna, G.; Zhang, T.; Anthony, N.; Watson, D.G. A Study of the Effects of Exercise on the Urinary Metabolome Using Normalisation to Individual Metabolic Output. Metabolites 2015, 5, 119–139. [Google Scholar] [CrossRef] [PubMed] [Green Version]
  13. Creek, D.J.; Jankevics, A.; Breitling, R.; Watson, D.G.; Barrett, M.P.; Burgess, K.E.V. Toward global metabolomics analysis with hydrophilic interaction liquid chromatography-mass spectrometry: Improved metabolite identification by retention time prediction. Anal. Chem. 2011, 83, 8703–8710. [Google Scholar] [CrossRef] [PubMed]
  14. Zhang, T.; Watson, D.G.; Wang, L.; Abbas, M.; Murdoch, L.; Bashford, L.; Ahmad, I.; Lam, N.Y.; Ng, A.C.F.; Leung, H.Y. Application of Holistic Liquid Chromatography-High Resolution Mass Spectrometry Based Urinary Metabolomics for Prostate Cancer Detection and Biomarker Discovery. PLoS ONE 2013, 8, e65880. [Google Scholar] [CrossRef] [PubMed]
  15. Zhang, R.; Watson, D.G.; Wang, L.; Westrop, G.D.; Coombs, G.H.; Zhang, T. Evaluation of mobile phase characteristics on three zwitterionic columns in hydrophilic interaction liquid chromatography mode for liquid chromatography-high resolution mass spectrometry based untargeted metabolite profiling of Leishmania parasites. J. Chromatogr. A 2014, 1362, 168–179. [Google Scholar] [CrossRef] [PubMed]
  16. Taylor, H.L.; Buskirk, E.; Henschel, A. Maximal oxygen uptake as an objective measure of cardiorespiratory performance. J. Appl. Physiol. 1955, 8, 73–80. [Google Scholar] [PubMed]
  17. Pluskal, T.; Castillo, S.; Villar-Briones, A.; Orešič, M. MZmine 2: Modular framework for processing, visualizing, and analyzing mass spectrometry-based molecular profile data. BMC Bioinform. 2010, 11, 395. [Google Scholar] [CrossRef] [PubMed]
  18. MetaboLights. Available online: http://www.ebi.ac.uk/metabolights/ (accessed on 22 February 2016).
  19. Sumner, L.W.; Amberg, A.; Barrett, D.; Beale, M.H.; Beger, R.; Daykin, C.A.; Fan, T.W.-M.; Fiehn, O.; Goodacre, R.; Griffin, J.L. Proposed minimum reporting standards for chemical analysis. Metabolomics 2007, 3, 211–221. [Google Scholar] [CrossRef] [PubMed]
  20. Ryan, D.; Robards, K.; Prenzler, P.; Kendall, M. Recent and potential developments in the analysis of urine: A review. Anal. Chim. Acta 2011, 684, 17–29. [Google Scholar] [CrossRef] [PubMed]
  21. Benjamini, Y.; Hochberg, Y. Controlling the False Discovery Rate a Practical and powerful Approach to Multiple Testing. J. Roy. Stat. Soc. B 1995, 57, 289–300. [Google Scholar]
  22. McDonald, J.H. Handbook of Biological Statistics, 3rd ed.; Sparky House Publishing: Baltimore, MD, USA, 2014. [Google Scholar]
  23. Scripps Center for Metabolomics. METLIN. Available online: https://metlin.scripps.edu/index.php (accessed on 22 February 2016).
  24. Zieliński, J.; Krasińska, B.; Kusy, K. Hypoxanthine as a predictor of performance in highly trained athletes. Int. J. Sports Med. 2013, 34, 1079–1086. [Google Scholar] [CrossRef] [PubMed]
  25. Zieliński, J.; Kusy, K. Training-induced adaptation in purine metabolism in high-level sprinters vs. triathletes. J. Appl. Physiol. 2012, 112, 542–551. [Google Scholar] [CrossRef] [PubMed]
  26. Stathis, C.G.; Carey, M.F.; Hayes, A.; Garnham, A.P.; Snow, R.J. Sprint training reduces urinary purine loss following intense exercise in humans. Appl. Physiol. Nutr. Metab. 2006, 31, 702–708. [Google Scholar] [CrossRef] [PubMed] [Green Version]
  27. Sahlin, K.; Tonkonogi, M.; Söderlund, K. Plasma hypoxanthine and ammonia in humans during prolonged exercise. Eur. J. Appl. Physiol. Occup. Physiol. 1999, 80, 417–422. [Google Scholar] [CrossRef] [PubMed]
  28. Dudzinska, W.; Lubkowska, A.; Dolegowska, B.; Safranow, K.; Jakubowska, K. Adenine, guanine and pyridine nucleotides in blood during physical exercise and restitution in healthy subjects. Eur. J. Appl. Physiol. 2010, 110, 1155–1162. [Google Scholar] [CrossRef] [PubMed]
  29. Zieliński, J.; Kusy, K.; Rychlewski, T. Effect of training load structure on purine metabolism in middle-distance runners. Med. Sci. Sports Exerc. 2011, 43, 1798–1807. [Google Scholar] [CrossRef] [PubMed]
  30. Dansie, L.E.; Reeves, S.; Miller, K.; Zano, S.P.; Frank, M.; Pate, C.; Wang, J.; Jackowski, S. Physiological Roles of the Pantothenate Kinases. Biochem. Soc. Trans. 2014, 42, 1033–1036. [Google Scholar] [CrossRef] [PubMed]
  31. Bracken, R.M.; Linnane, D.M.; Brooks, S. Plasma catecholamine and nephrine responses to brief intermittent maximal intensity exercise. Amino Acids. 2009, 36, 209–217. [Google Scholar] [CrossRef] [PubMed]
  32. Lustgarten, M.S.; Price, L.L.; Chalé, A.; Fielding, R.A. Metabolites Related to Gut Bacterial Metabolism, Peroxisome Proliferator-Activated Receptor-Alpha Activation, and Insulin Sensitivity Are Associated with Physical Function in Functionally-Limited Older Adults. Aging Cell 2014, 13, 918–925. [Google Scholar] [CrossRef] [PubMed]
  33. Dovio, A.; Roveda, E.; Sciolla, C.; Montaruli, A.; Raffaelli, A.; Saba, A.; Calogiuri, G.; de Francia, S.; Borrione, P.; Salvadori, P. Intense physical exercise increases systemic 11β-hydroxysteroid dehydrogenase type 1 activity in healthy adult subjects. Eur. J. Appl. Physiol. 2010, 108, 681–687. [Google Scholar] [CrossRef] [PubMed]
  34. Hafezi-Moghadam, A.; Simoncini, T.; Yang, Z.; Limbourg, F.P.; Plumier, J.-C.; Rebsamen, M.C.; Hsieh, C.-M.; Chui, D.-S.; Thomas, K.L.; Prorock, A.J.; et al. Acute cardiovascular protective effects of corticosteroids are mediated by non-transcriptional activation of endothelial nitric oxide synthase. Nat. Med. 2002, 8, 473–479. [Google Scholar] [CrossRef] [PubMed]
  35. Gatti, R.; Cappellin, E.; Zecchin, B.; Antonelli, G.; Spinella, P.; Mantero, F.; de Palo, E.F. Urinary high performance reverse phase chromatography cortisol and cortisone analyses before and at the end of a race in elite cyclists. J. Chromatogr. B 2005, 824, 51–56. [Google Scholar] [CrossRef] [PubMed]
  36. Tremblay, M.S.; Copeland, J.L.; van Helder, W. Effect of training status and exercise mode on endogenous steroid hormones in men. J. Appl. Physiol. 2004, 96, 531–539. [Google Scholar] [CrossRef] [PubMed]
  37. Balderas, C.; Rupérez, F.J.; Ibañez, E.; Señorans, J.; Guerrero-Fernández, J.; Casado, I.G.; Gracia-Bouthelier, R.; García, A.; Barbas, C. Plasma and urine metabolic fingerprinting of type 1 diabetic children. Electrophoresis 2013, 34, 2882–2890. [Google Scholar] [CrossRef] [PubMed]
  38. Lai, Y.-L.; Aoyama, S.; Nagai, R.; Miyoshi, N.; Ohshima, H. Inhibition of L-arginine metabolizing enzymes by L-arginine-derived advanced glycation end products. J. Clin. Biochem. Nutr. 2010, 46, 177. [Google Scholar] [CrossRef] [PubMed]
  39. Lustgarten, M.S.; Price, L.L.; Logvinenko, T.; Hatzis, C.; Padukone, N.; Reo, N.V.; Phillips, E.M.; Kirn, D.; Mills, J.; Fielding, R.A. Identification of serum analytes and metabolites associated with aerobic capacity. Eur. J. Appl. Physiol. 2013, 113, 1311–1320. [Google Scholar] [CrossRef] [PubMed]
Figure 1. Indicative representation of urine collection schematic. The first urine sample on each day was the first pass after waking (typically 6 am–8 am).
Metabolites 06 00009 g001
Figure 2. Separation of D2S3 (green) from the post exercise D2S1 samples (blue) by using PCA (R2X (cum) 0.548 Q2 (cum) 0.295, three components) following normalisation to individual metabolic output on day 2.
Metabolites 06 00009 g002
Figure 3. Separation of day 1 first void (D1S1 blue) and third samples (D1S3 green) by using PCA (R2X(cum) 0.536, Q2 (cum) 0.263, three components).
Metabolites 06 00009 g003
Figure 4. Separation of D2S1 (blue) and D2S3 (green) samples by using OPLSDA. R2X (cum) 0.35, R2Y (cum) 0.99, Q2 (cum) 0.77), three components). Based on 3078 features.
Metabolites 06 00009 g004
Figure 5. Separation of D1S1 (blue) and D1S3 (green) by OPLSDA (R2X (cum) 0.56, R2Y (cum) 0.997, Q2 (cum) 0.847, four components). Based on 3540 features.
Metabolites 06 00009 g005
Figure 6. Plot of measured against predicted VO2max against normalised levels of OHA.
Metabolites 06 00009 g006
Figure 7. Extracted ion trace for OHA isomers in urine comparing a pre- and post-exercise sample for samples D2S1 and D2S3 for a subject with VO2max 53.4.
Metabolites 06 00009 g007
Table 1. Metabolites differing between D2S1 and D2S3 in comparison with D1S1 and D1S3.
Polaritym/zRtMetabolitep-Value*** D2S1D2S3Ratio D2S3D2S1p-Value*** D1S1D1S3Ratio D1S3D1S1
Purine Metabolism
+137.04610.8* Hypoxanthine<0.0013.750.5160.832
+152.05713.1* Guanine0.022.56nana
167.02113.5* Urate0.0150.748<0.0010.534
181.03710.81-Methyluric acid0.010.590.0120.561
+253.0939.2Deoxyinosine0.014.97nana
+269.08811.5* Inosine0.0216.270.9470.967
+285.08313.1* Xanthosine0.012.330.0120.506
+282.1213.9Methyladenosine0.240.856<0.010.516
+296.13617.8Dimethyladenosine0.202.390<0.010.491
+312.139.2Dimethylguanosine0.900.983<0.0030.562
Neurotransmitter Metabolism
101.02412.7Oxobutanoate0.0301.2120.6900.953
+104.07114.9* 4-Aminobutanoate< 0.0010.7370.0030.801
182.99717.0Hydroxybutyric acid sulfate<0.0012.1720.5191.133
+198.11316.8* Metanephrine0.0823.0000.0740.762
246.99212.8Dihydroxy phenyl acetic acid sulfate or isomer0.0201.4420.5131.212
261.00710.5Homovanillicacid sulfate0.1421.3970.8570.932
263.0238.5Methoxyhydroxy phenylethyleneglycol sulfate0.0711.3850.4050.833
Collagen Metabolism
+173.09213.3Glycylproline<0.0010.540.8201.064
+189.12313.6Glycylleucine<0.0010.720.0010.370
Sugar Metabolism
87.00928.6* Pyruvate0.2561.1790.0170.565
89.024210.2* Lactate0.022.190.8671.04
151.06113.6* Xylitol or isomer0.0160.7340.0360.617
163.0619.9* Rhamnose or isomer0.0250.667<0.010.629
165.048.9Arabinonate0.0230.648<0.010.520
181.07214.7* Sorbitol or isomer0.050.700.1260.653
193.03615.2* Glucuronate or isomer0.0180.6280.0240.641
Fatty Acid Conjugates
202.1095.8ǂ Hydroxyhepatonyl glycine<0.011.760.2381.276
+218.1396.0Propanoylcarnitine0.030.3600.3631.124
+288.2176.4Octanoylcarnitine0.53971.1150.0020.540
+300.2186.0Nonanoyl carnitine0.0151.630.4990.850
+314.2345.6Decanoyl carnitine0.011.560.3910.825
+330.2276.6Keto-decanoylcarnitine0.0321.610.4990.850
Steroids
367.1583.9Testosterone sulfate0.041.570.3191.23
539.256.7Tetrahydroaldosterone glucuronide<0.011.620.3691.21
Bile Acids
405.2655.6Dihydroxyoxocholanate<0.010.440.0780.512
407.2816.6Cholic acid<0.010.34<0.010.340
583.31210.3Cholic acid glucuronide<0.010.27< 0.010.170
583.31211.5Cholic acid glucuronide<0.010.23<0.010.170
Amino Acids and Their Metabolites
118.05112.0* Threonine<0.010.640.6851.06
131.04615.8* Asparagine<0.010.760.8791.05
+132.10211.3* Leucine0.0300.5930.0610.675
148.04314.0* Methionine<0.010.580.0610.675
+161.12823.0Methyllysine0.1141.5260.0022.669
172.0986.1N-Acetylleucine<0.010.650.0100.590
+175.1089.3** N-Acetylornithine isomer<0.010.70< 0.010.566
187.07211.4* N-Acetylglutamine<0.010.67< 0.010.628
+221.0926.8** 5-Hydroxytryptophan isomer0.062.240.5300.952
214.02814.0Chlorotyrosine0.042.09<0.012.91
216.09911.8N-Acetylcitrulline<0.010.60<0.010.570
+219.13413.7Carboxyethyllysine<0.010.65<0.010.467
+247.1415.0Carboxyethylarginine<0.012.230.0220.544
Vitamins and Co-Factors
+132.07715.4* Creatine0.0110.5380.0180.440
+220.1189.4* Pantothenate<0.011.40<0.010.529
375.138.1* Riboflavin0.0130.660.0320.500
Microbial Metabolites
153.0214.0Dihydroxybenzoate0.0781.3240.8840.964
192.0676.0Phenylacetylglycine<0.011.760.2770.756
197.0469.8Dihydroxyphenyllactate0.0251.430.3830.855
* Matches retention time of standard. ** Same elemental composition as the standard but different retention time. na = not detected in these samples. Matches retention time of standard. na = not detected in these samples. ǂ Same elemental composition as acetyl carnitine but retention time much earlier. *** Application of the Benjamin-Hochberg false discovery rate with Q = 0.1 and including 1000 features in the test indicated that all p-values < 0.05 are significant.
Table 2. Predicted VO2max values for all samples based on normalised response for OHA.
Primary IDSetOAHA Normalised Level VO2maxPredicted VO2max
105D2S30.4314038.5
65D2S30.46440.738.9
51D2S30.80038.242.2
24D2S31.22548.346.5
91D2S30.91741.743.4
12D2S31.74953.451.7
118D2S30.71740.441.4
78D2S30.00033.534.3
37D2S30.6334340.6
128D2S31.55447.949.7
108D2S11.0004044.2
68D2S11.06940.744.9
54D2S12.54438.259.6
27D2S11.53248.349.5
94D2S12.15241.755.7
15D2S10.33553.437.6
121D2S11.99440.454.1
81D2S11.98933.554.1
40D2S12.8504362.6
133D2S10.39947.938.2
107D2S20.4184038.4
67D2S20.81240.742.3
53D2S20.77738.242.0
26D2S20.63448.340.6
93D2S20.31841.737.4
14D2S21.62453.450.4
120D2S21.18040.446.0
80D2S21.41933.548.4
39D2S20.9484343.7
132D2S21.32047.947.4
103D2S41.7054051.2
63D2S41.38440.748.0
49D2S40.39838.238.2
22D2S40.86748.342.9
89D2S41.01441.744.4
10D2S40.93753.443.6
116D2S40.70640.441.3
76D2S40.66633.540.9
35D2S40.3924338.2
129D2S41.67147.950.9
101D2S51.4464048.7
61D2S51.27040.746.9
47D2S50.48138.239.1
20D2S50.74348.341.7
87D2S50.59941.740.2
8D2S50.35553.437.8
114D2S50.40340.438.3
74D2S50.92633.543.5
33D2S50.1774336.0
127D2S50.05747.934.8

