Abstract
Essentiality (ES) and Synthetic Lethality (SL) information identify combination of genes whose deletion inhibits cell growth. This information is important for both identifying drug targets for tumor and pathogenic bacteria suppression and for flagging and avoiding gene deletions that are non-viable in biotechnology. In this study, we performed a comprehensive ES and SL analysis of two important eukaryotic models (S. cerevisiae and CHO cells) using a bilevel optimization approach introduced earlier. Information gleaned from this study is used to propose specific model changes to remedy inconsistent with data model predictions. Even for the highly curated Yeast 7.11 model we identified 50 changes (metabolic and GPR) leading to the correct prediction of an additional 28% of essential genes and 36% of synthetic lethals along with a 53% reduction in the erroneous identification of essential genes. Due to the paucity of mutant growth phenotype data only 12 changes were made for the CHO 1.2 model leading to an additional correctly predicted 11 essential and eight non-essential genes. Overall, we find that CHO 1.2 was 76% less accurate than the Yeast 7.11 metabolic model in predicting essential genes. Based on this analysis, 14 (single and double deletion) maximally informative experiments are suggested to improve the CHO cell model by using information from a mouse metabolic model. This analysis demonstrates the importance of single and multiple knockout phenotypes in assessing and improving model reconstructions. The advent of techniques such as CRISPR opens the door for the global assessment of eukaryotic models.
1. Introduction
Both budding yeast S. cerevisiae and Chinese Hamster Ovary (CHO) C. griseus are model cell lines for understanding metabolism in eukaryotes [1] as well as versatile bio-production hosts [2,3] for biofuels, biorenewables and proteins [4]. The earliest genome-scale metabolic model of yeast (iFF708 [5]) included 708 ORFs (10.7% of the total number of verified ORFs in yeast genome) and 1175 reactions with only two compartments (i.e., mitochondria and cytosol). Subsequent efforts improved this model not only by including additional ORFs, metabolites and metabolic pathways, but also by integration of enzyme-localization information for compartmentalization (e.g., including peroxisome, nucleus, golgi apparatus, vacuole and endoplasmic reticulum) [6]. The latest consensus model version (Yeast 7.11 [7]) consists of 2,218 metabolites and 910 genes partitioned in 14 distinct compartments. A detailed comparison of the development of yeast genome-scale models is reviewed in [8,9]. CHO cells have emerged as the preferred cell line for recombinant proteins [10]. It has been shown that 70% of therapeutics production [11] worldwide is carried out in CHO cells thereby garnering over $30 billion in sales. An important consideration is for genetic engineering to avoid knockouts of lethal gene sets while designing high yielding strains [12] of commercial importance.
Essentiality and SL analyses [13,14] have been used to systematically assess the validity/accuracy of genome-scale flux models [8]. Essentiality and SL analyses refer to identifying sets of gene deletions (single, double and higher order thereof) that render the strain nonviable. Essentiality analysis identifies the list of genes, each of which when deleted in silico, limits the biomass flux to lower than 10% of its theoretical maximum. Whereas, SL analysis identifies the list of in silico gene pairs (and higher order) whose removal constrains the biomass flux to lower than the aforesaid essentiality criterion. These analyses serve the dual purpose of model refinement (by comparing with available in vivo knockout information) and prediction for identifying genes (or combination of genes) whose knockouts could potentially be lethal. The latter is particularly useful in strain engineering applications for avoiding synthetic lethal gene deletions. In earlier efforts, these analyses were used extensively to curate metabolic models of well-studied organisms such as E. coli [15,16] and S. cerevisiae [8]. Model improvement using network-embedded thermodynamic flux variability analyses to ascertain the directionality of reactions have been used by Martinez et al. [17]. Other related efforts include Stanford et al. [18] and Soh et al. [19], all of which aim to integrate thermodynamic information to curate the yeast genome scale models. In this study, we evaluate the accuracy of the latest genome-scale consensus model first for S. cerevisiae (Yeast 7.11) and thereby update it to iSce926 and subsequently for C. griseus (CHO 1.2) with existing experimental measurements in terms of gene essentiality and synthetic lethality and propose a list of corrections and follow-up assessment of predicted gene deletions.
The proposed model modifications on Yeast 7.11 involve 50 literature-supported changes that improve the sensitivity, specificity of Yeast 7.11 by 2.66% and 20.4% and decrease the false viable rate (FVR) by 8.42% (see Appendix). They build upon the effort by Zomorrodi et al. [8] as they conserve four of earlier identified changes. ES and SL analyses are supplemented by auxotrophy information (for Precursor Identifier algorithm see Supplemental File S2) to help elucidate the cause (i.e., nutrient or biomass precursor deficiency) for lethality. For CHO 1.2, we identified eight instances where model and experiment does not match. Upon supplementing this mismatched set with another 11 cases of model and experiment discrepancies from the mouse model [20], we suggested 14 additional (single, double and higher) gene deletion experiments (see Supplemental File S1) for maximally resolving mutant growth phenotypes in CHO cell lines.
2. Results and Discussion
2.1. S. Cerevisiae Model Yeast 7.11 Curation
In vivo essentiality and synthetic lethality information were mostly obtained from gene deletion studies by Tong et al. [21]. Gene level essentiality analysis (see Table 1) and synthetic lethality predictions for Yeast 7.11 are shown in Figure 1. Resources used to assess in silico results included (i) the Saccharomyces Genome Database (SGD) [22], (ii) single gene deletion studies in minimal media on yeast strain S288C [23], (iii) viability analyses [24], (iv) data from The ORF Report [25,26,27] and analysis of protein encoded transmembrane segments in yeast [28] (See Supplemental File S3 for full gene lists and references of experimental evidence).
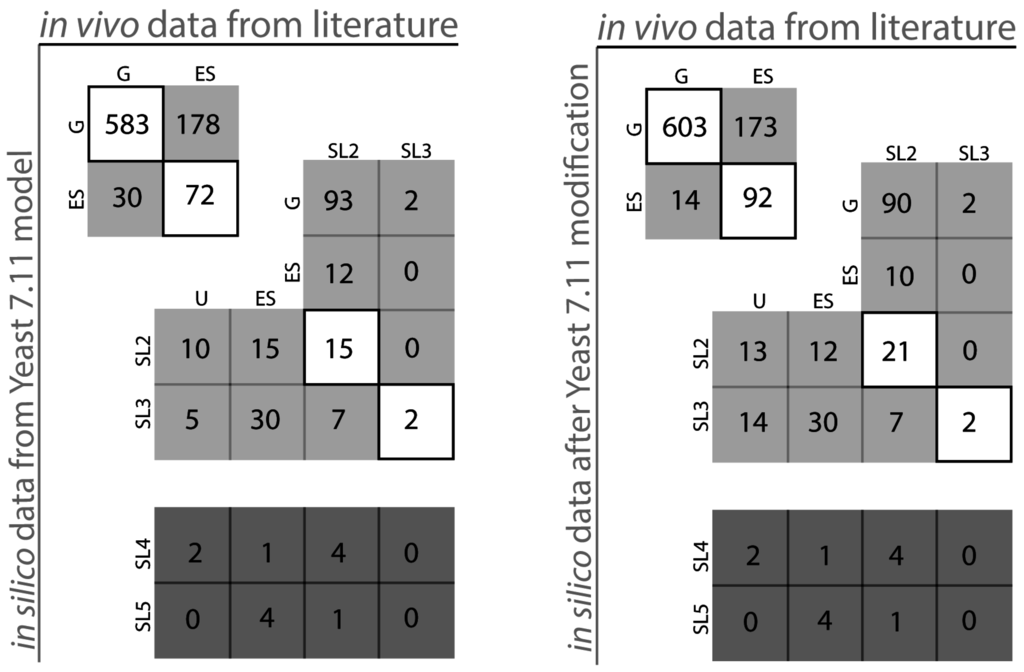
Figure 1.
Yeast 7.11 model performance comparison (Yeast 7.11: left, iSce926: right). The diagonal boxes represent points of in silico-in vivo match. The non-diagonal elements represent points of in silico in vivo inconsistency.
Figure 1.
Yeast 7.11 model performance comparison (Yeast 7.11: left, iSce926: right). The diagonal boxes represent points of in silico-in vivo match. The non-diagonal elements represent points of in silico in vivo inconsistency.
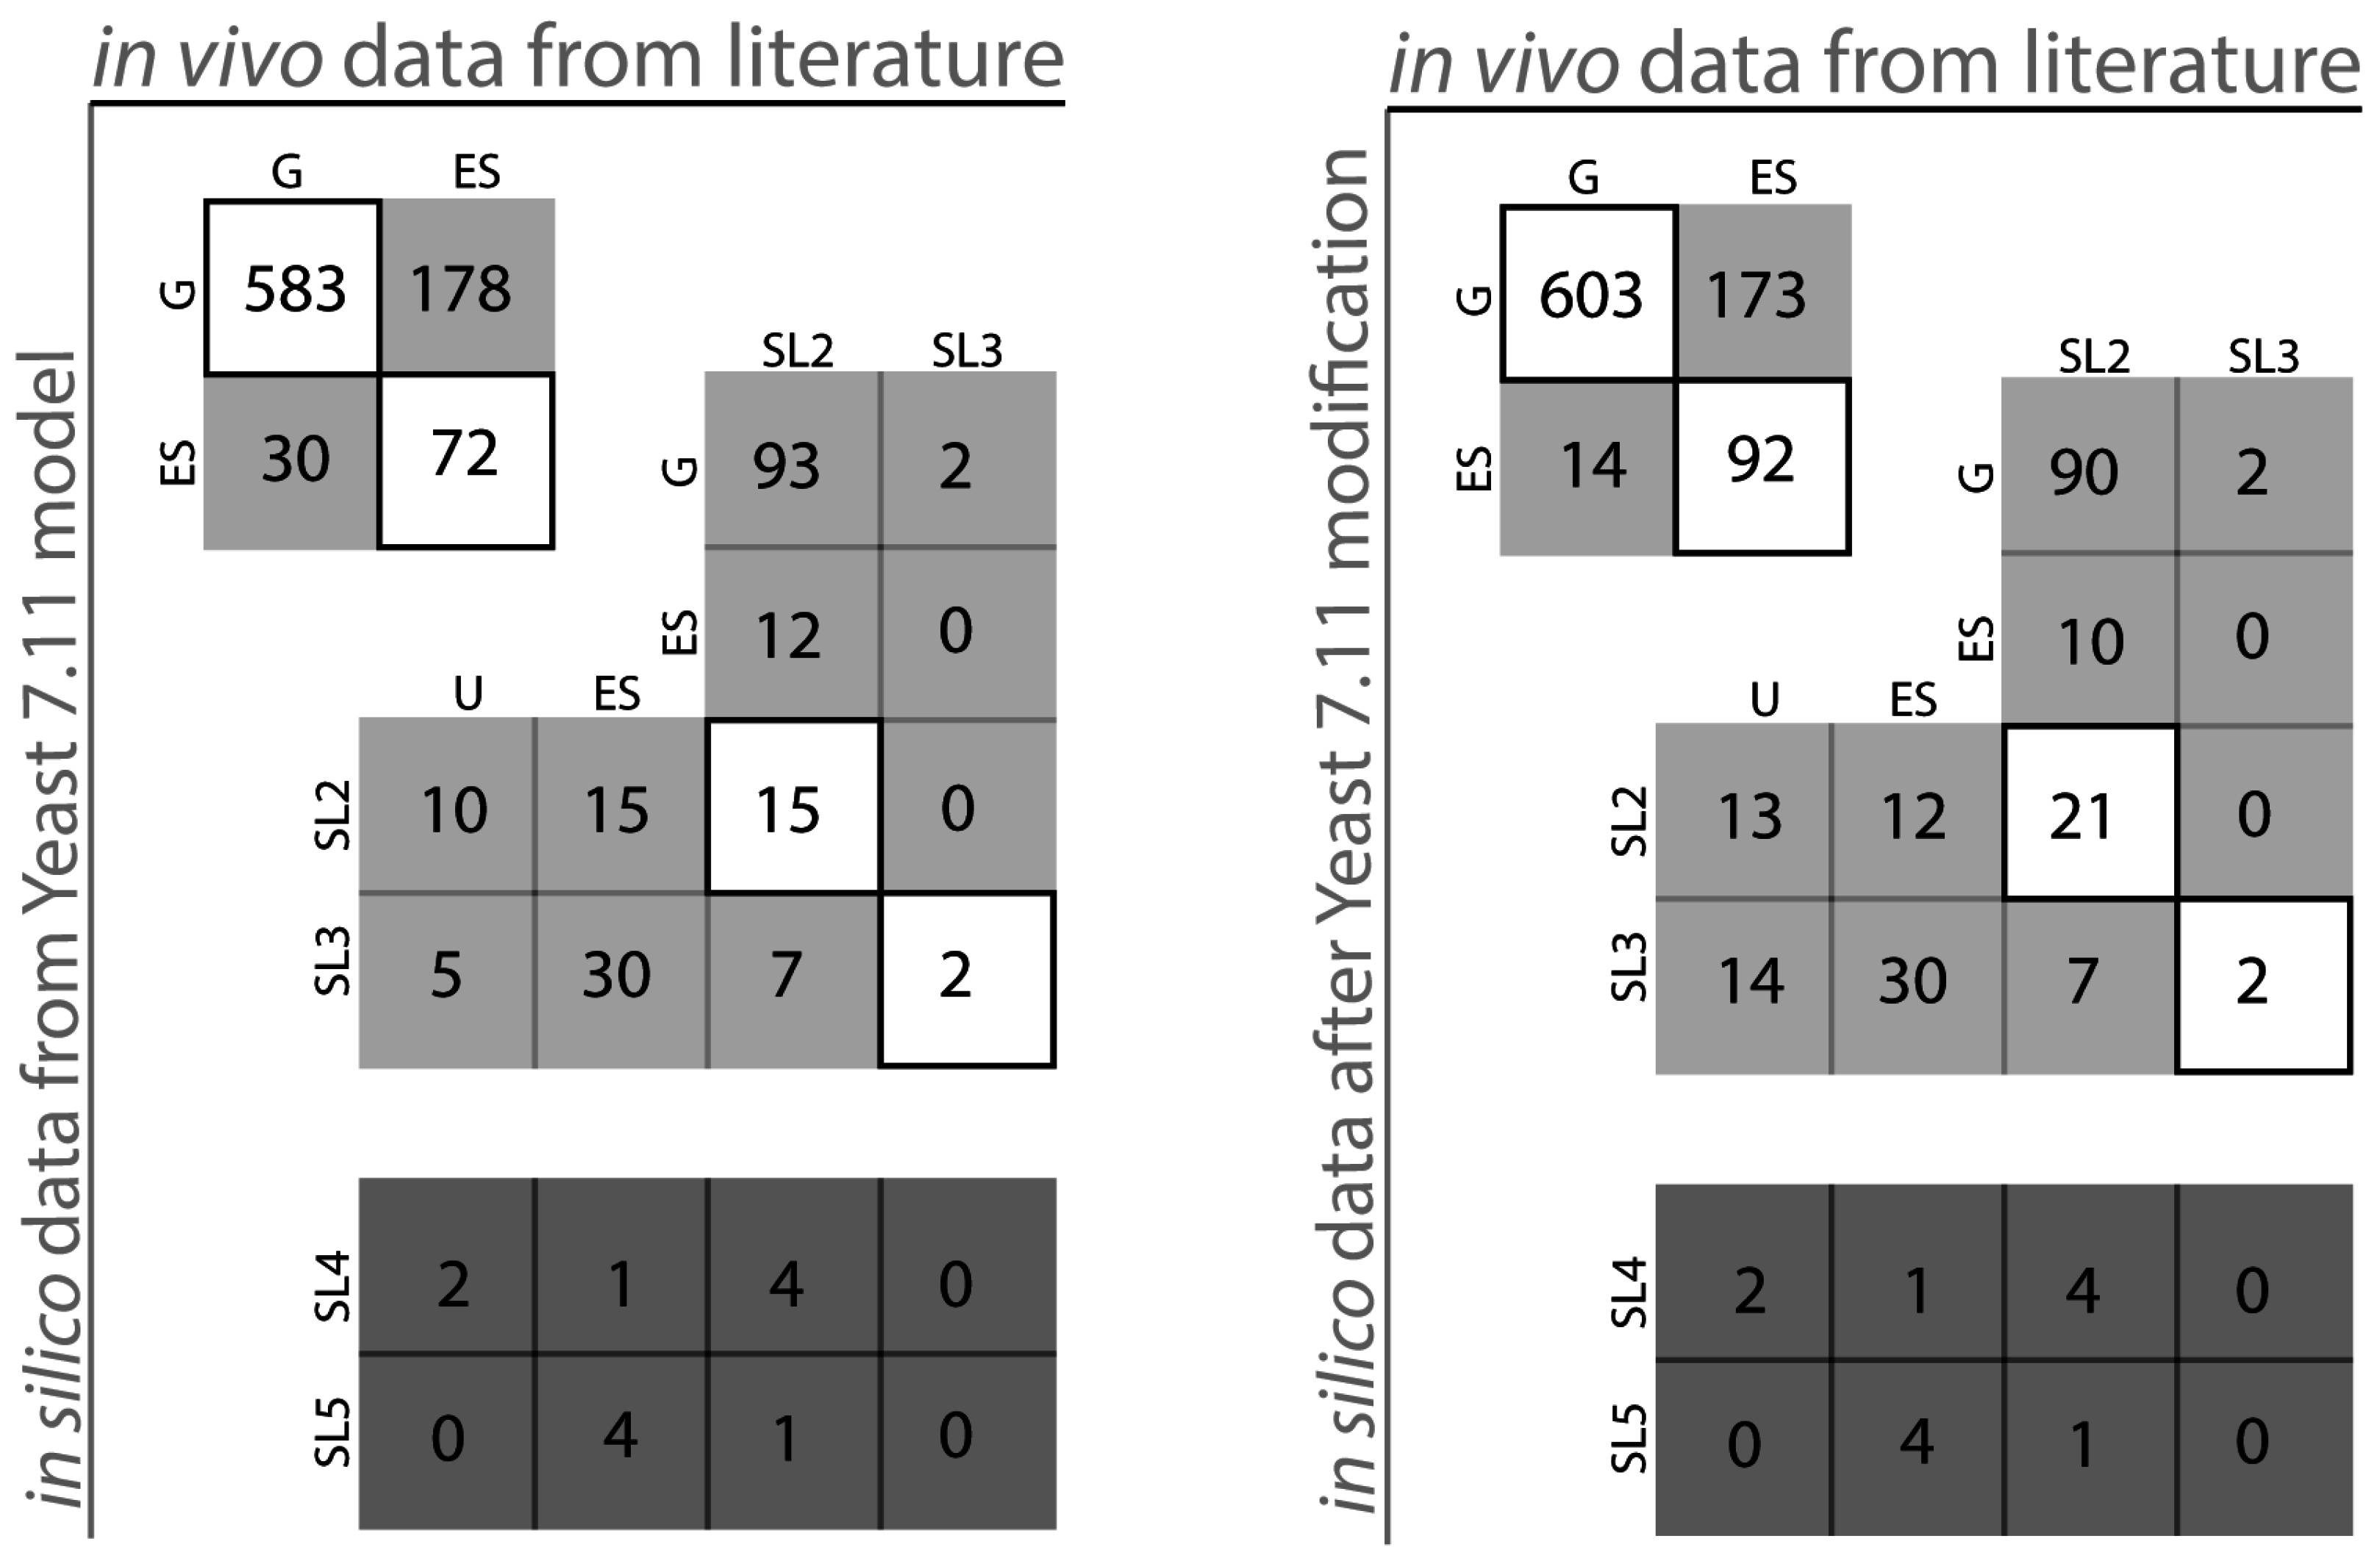

Table 1.
Yeast 7.11 model statistics on Essentiality (ES) and Synthetic Lethality (SL).
| Parameter | Count | |
|---|---|---|
| Essentiality information | Essential Reactions with GPRs | 195 |
| Essential Reactions without GPRs | 248 | |
| Essential genes | 151 | |
| Reaction level lethality | SL Pairs | 70 |
| SL Triplets | 21 | |
| SL Quadruplets | 11 | |
| SL Quintuplets | NP1 | |
| Gene level lethality | SL Pairs | 40 |
| SL Triplets | 44 | |
| SL Quadruplets | 7 | |
| SL Quintuplets | 5 |
1 NP: Not Performed.
Table 1 depicts the number of essential reactions (~13% of total reactions present in the model), essential genes (~16.5% of total genes in the model) and catalogs the number synthetic lethals with up to five simultaneous gene deletions identified by the SL finder for Yeast 7.11. Figure 1 pictorially classifies the agreement of in silico lethality information with in vivo gene deletion information (see Supplemental File S4: Table 2). The vertical axis refers to in silico predictions while the horizontal axis refers to in vivo data. The boxes in the diagonal are instances of compliance between model and experiment whereas boxes off the diagonal signify various modes of disagreement between in silico and in vivo data. For example, box ESG for the Yeast 7.11 encompasses 30 genes which are essential (ES) in silico but are non-essential (G) in vivo whereas box SL2ES refers to gene pairs that have been found to form a synthetic lethal pair in silico (SL2), however at least one of them is essential (ES) in vivo. Overall, our current model iSce926 improves the sensitivity and specificity of Yeast 7.11 from 0.288 to 0.347 and 0.951 to 0.977 respectively and decreases the false viability rate (FVR) from 0.712 to 0.652 (see Appendix). Brief summaries of few of the proposed model modifications have been listed in Table 2, Table 3 and Table 4. Comprehensive information on the exact cause of disagreement between model and experiment can be found in Supplemental File S3. In silico analysis also generates results for deletion combinations unexplored so far. For example, box SL2U (see Figure 1) contains 10 in silico lethal gene pairs for which double deletion experiments have been unverified (U) so far in the literature. These unverified results often reveal non-intuitive lethal gene sets to be avoided while designing overproduction strains. Conversely, predicted viable synthetic lethals are prime candidates to be tested experimentally to assess the functionality of all the pathways present in the model. Absence of isozymes and alternate pathways in the model may also lead to discrepancies between in silico results and in vivo data. For example, gene TYR1 (YBR166C) which is essential (ES) for tyrosine biosynthesis [29] according to the model, is found experimentally to be non-essential instead and found to form synthetic lethals (i.e., a ESSL2 discrepancy). There is a single pathway for the formation of tyrosine in Yeast 7.11; however, chitin synthase (CHS1) [30,31], which is not present in the existing metabolic model, can rescue this mutant phenotype. Another such example involves gene BAT2 (YJR148W) encoding branched-chain amino transferases in isoleucine, leucine and valine biosynthetic pathways [32]. BAT2 forms an in vivo synthetic lethal pair with its paralog BAT1 (YHR208W). However, both have been identified as essential in silico. Reconciliation between model and experiment was achieved by adding the pretyrosine pathway [33] and allowing for the transport of α-keto-isovalerate across the mitochondrial membrane [34].

Table 2.
Yeast 7.11 Model Modifications.
| No. | Model Modification | Improvement on Yeast 7.11 | Remarks | Reference | |
|---|---|---|---|---|---|
| Addition of Reactions | 1 | Addition of alpha-keto isovalerate (KIV) transport 3-methyl 2-oxobutanoate [m] ⬄ 3-methyl 2-oxobutanoate [c] | BAT1 reconciled from ESG to GG BAT1-BAT2 reconciled from ESSL2 to SL2SL2 | The KIV transport provides an alternate path for cytosolic valine formation. | [25] [35] |
| 2 | Mitochondrial acetyl-transferase activity of glycine CoA [m] + L-2 amino 3-oxobutanoate [m] ⬄ acetyl-CoA [m] + L-glycine [m] GPR: YDL040C or YGR147C or YHR013C | Correctly adds NAT1, NAT2 and ARD1 as GG | This adds a missing reaction and identifies the associated genes correctly as non-essential. | [36] [37] | |
| GPR modifications | 3 | GPR modification for reaction r_0195 Old GPR: ((YBR126C and YDR074W and YMR261C) or (YML100W and YBR126C and YDR074W)) New GPR: ((YBR126C and YDR074W and YMR261C and YML100W) or YBR126C) | TPS1 gene is only essential in glucose media whereas both TPS1 and TPS2 genes are essential in galactose media reflected in old GPR TPS2 gene is restored as a GG from an ESG | This shows a media dependent gene essentiality. | [38] [39] [40] |
| 4 | GPR modification for reaction r_0995 Old GPR: YDR023W or YHR011W New GPR: YDR023W or (YDR023W and YHR011W) | SES1 gene is corrected from GES to ESES SES1-DIA1 is corrected from SL2ES and SL2G to ESES and GG cases respectively | The modification identifies SES1 as the major isoform consistent to in vivo information. | [41] [42] | |
| 5 | GPR modification for reaction r_0250 Old GPR: ((YJR019C and YOR303W) or YJL130C) New GPR: YJR019C and YOR303W and YJL130C | SL2ES CPA2-URA2 is resolved correctly to 2 ESES for CPA2 and URA2 SL2ES CPA1-URA2 is resolved correctly to one more ESES case CPA1 At the same time it resolves 3 GES to ESES for the genes CPA1, CPA2, URA2 | This captures the essentiality of all three genes consistent with literature. | [43] [44] | |
| Removal of reactions | 6 | Remove orphan reaction r_2031 It was initially suggested in iAZ900 | Reconciles GSL2 of fur1-ura3 to SL2SL2 | This removes an orphan reaction that might have added extra alternate paths to uridine formation | [8] |
| Addition of GPR to orphan reactions | 7 | Add genes for reaction r_0094 L-alanine [c] +pimeloyl-CoA [c] ⬄ 8-amino-7 oxononanoate [c] + CO2 [c] + CoA [c] + 4H+ [c] | Adds GPR: YAR069W-A or YHR214W-F Adds genes BIO6 and BIO8 putative genes to the model and both are correctly predicted as GG. | This makes the model better in terms of correct identification of non-essential genes. | [45] |
| 8 | Add genes for reaction r_0475 H2O [c] + L-glutamine [c] ⬄ ammonium [c] + L-glutamate [c] | Adds GPR: YMR096W or (YMR095C and YMR096W) Adds genes SNZ1 and SNO1 to the model Correctly identifies SNZ1 and SNO1 genes as GG | This makes the model better in terms of correct identification of non-essential genes. | [46] |

Table 3.
Clarifications on 14 in silico in vivo inconsistencies.
| No. | Gene | Inconsistency | Remarks | Reference |
|---|---|---|---|---|
| 1 | SEC53 | ESG | SEC53 deletion is in silico and in vivo essential, but it was erroneously categorized as non-essential. | [24] [47] |
| 2 | HIS4 | ESG | HIS4 gene deletion is lysine auxotroph, which is in corroboration with in silico result. Yet the in vivo strain was categorized as viable hence causing ESG inconsistency. | [48] |
| 3 | ADK1 | ESG | ADK1 gene in vivo deletion is not inviable initially but over a period of 4 days, cells fail to survive. ADK1 in silico is adenine auxotroph as corroborated in vivo. | [49] |
| 4 | ERG20 | ESG | ERG20 deletion is in silico and in vivo essential, but it was erroneously categorized as non-essential. | [24] [50] |
| 6 | MET2 | ESG | MET2 gene deletion is methionine auxotroph and vegetative growth is reduced to less than 10%, which is in corroboration with in silico result. Yet, the in vivo strain was categorized as viable hence causing ESG inconsistency. | [51] [53] |
| 7 | LYS2 | ESG | LYS2 gene deletion is lysine auxotroph, which is in corroboration with in silico result. Yet, the in vivo strain was categorized as viable hence causing ESG inconsistency. | [54] [53] |
| 8 | DPS1 | ESG | DPS1 gene deletion is aspartate auxotroph, which is in corroboration with in silico result. Yet, the in vivo strain was categorized as viable hence causing ESG inconsistency. | [55] |
| 9 | FRS1 | ESG | FRS1 gene deletion is phenylalanine auxotroph, which is in corroboration with in silico result. Yet, the in vivo strain was categorized as viable hence causing ESG inconsistency. | [55] |
| 10 | ADE13 | ESG | ADE13 gene deletion is adenine auxotroph, which is in corroboration with in silico result. Yet, the in vivo strain was categorized as viable hence causing ESG inconsistency. | [54] [56] [57] [53] |
| 11 | ADE4 | ESG | ADE4 gene deletion is adenine auxotroph, which is in corroboration with in silico result. Yet, the in vivo strain was reported as viable hence causing ESG inconsistency. | [54] [56] [57] [53] |
| 12 | RIB4 | ESG | RIB4 gene deletion is riboflavin auxotroph, which is in corroboration with in silico result. Yet, the in vivo strain was categorized as viable hence causing ESG inconsistency. | [58] [53] |
| 13 | TPI1 | GES | TPI1 gene deletion is not in silico lethal. However, when PIT2m is suppressed, TPI1 is essential for viability. This could possibly be because of short-term Crabtree effect due to F16-bisphosphate accumulation under TPI1 deletion that suppresses mitochondrial respiratory enzymes. | [59] [60] |
| 14 | FBA1 | GES | FBA1 gene deletion is not in silico lethal. However, when PIT2m is suppressed, FBA1 is essential for viability. This could possibly be because of short-term Crabtree effect due to F16-bisphosphate accumulation under FBA1 deletion that suppresses mitochondrial respiratory enzymes. | [59] [60] |

Table 4.
Information about the 12 ESG cases, which form in vivo SL2 due to non-metabolic functions.
| No. | in vivo Lethal Associations from Literature | Reason/Explanation | Reference |
|---|---|---|---|
| 1 | RIB7 gene forms 2 lethal pairs: RIB7-MAD1, RIB7-SGS1 | The candidate genes of lethal combination are non-metabolic and are involved in chromatid cohesion. | [57] |
| 2 | HIS7 gene forms 1 lethal pair: HIS7-RSP5 | RSP5 is involved in endocytosis signaling pathway, a non-metabolic function, hence unable to be captured in a metabolic model. | [61] |
| 3 | RIB5 gene forms 3 lethal pairs: RIB5-BUB1, RIB5-MAD1, RIB5-TAF1 | The candidate genes of lethal combination are non-metabolic and are involved in mitosis. | [57] |
| 4 | TSC10 gene forms 5 lethal pairs: TSC10-CDC74, TSC10-CHL1, TSC10-MAD1, TSC10-MRE11, TSC10-SGS1 | The candidate genes of lethal combination are non-metabolic and are involved in chromatid cohesion. | [57] |
| 5 | HEM13 gene forms 2 lethal pairs: HEM13-CDC73, HEM13-SMC3 | The candidate genes of lethal combination are non-metabolic and are involved in chromatid cohesion. | [57] |
| 6 | PRO3 gene forms 3 lethal pairs and 1 lethal triplet: PRO3-CDC73, PRO3-LRP1, PRO3-NIP7, PRO3-GAP1-PUT4 | The candidate genes are non-metabolic in function. | [54] [57] [62] |
| 7 | GNA1 forms 1 lethal pair: GNA1-CHL1 | The lethality is owing to chromosome loss which is a non-metabolic phenomenon. | [57] |
| 8 | FRS2 gene forms 5 lethal pairs: FRS2-CDC73, FRS2-ELG1, FRS2-RAD51, FRS2-SGS1, FRS2-SMC3 | The candidate genes of lethal combination are non-metabolic and are involved in chromatid cohesion. | [57] |
| 9 | TYS1 gene forms 2 lethal pairs: TYS1-BUB1, TYS1-SGS1 | The candidate genes of lethal combination are non-metabolic and are involved in mitosis. | [57] |
| 10 | ARG7 gene forms 1 lethal quadruplet: ARG7-ALP1-CAN1-GAP1 | The quadruplet association is not entirely metabolic hence cannot be captured by metabolic model. | [54] |
| 11 | OLE1 gene forms 3 lethal pairs: OLE1-BUB1, OLE1-ELO1, OLE1-RML2 | BUB1 gene is involved in mitosis. Δole1Δelo1 double mutant is inviable only in C:14 media RML2 is non-metabolic gene | [57] [63] [64] |
| 12 | YAH1 gene forms 1 lethal pair: YAH1-MRE11 | YAH1 has already been resolved as ESES MRE11-YAH1 double knockout strain will result in meiotic recombination disorder and will be lethal. This is a non-metabolic attribute of yeast. | [57] |
Overall, we reconciled 50 growth discrepancies (for full list of model modifications and comparison of the performance of iSce926 and Yeast 7.11 see Supplemental File S1) between model and experiment (see Table 2 and Table 3). Twelve ESG cases were identified that form ESSL2 inconsistencies in combination with other non-metabolic genes (see Table 4). For example, gene HEM13 whose deletion causes an ESG discrepancy has a non-metabolic function in chromatin assembly and interacts with RNA-polymerase II in transcription. It forms a synthetic lethal with CDC73 [57] (cell division cycle gene) due to the inability to form the pre-rRNA transcript upon simultaneous deletion of the two. We propose a possible interaction schematic (see Figure 2) explaining the cause for the lethal interaction based on information from [65,66,67]. However, it is in general beyond the purview of a metabolic model to resolve inconsistencies whenever non-metabolic genes are implicated in the interaction.
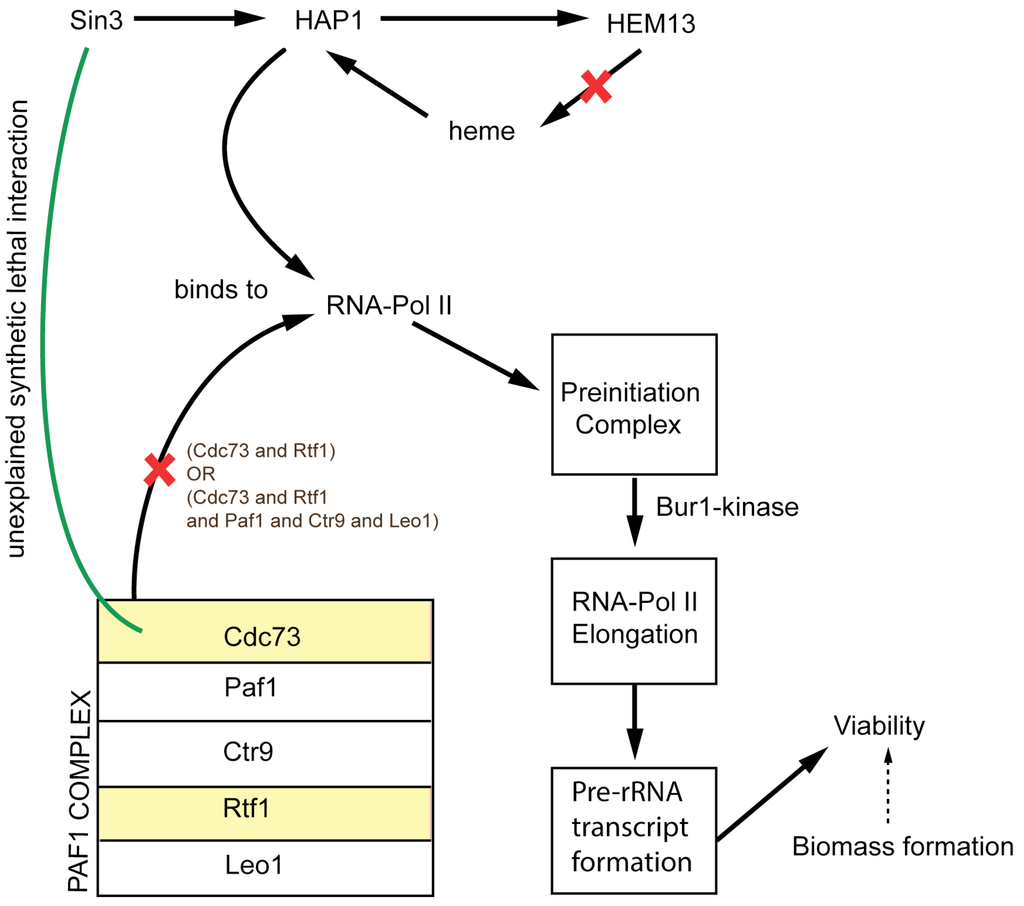
Figure 2.
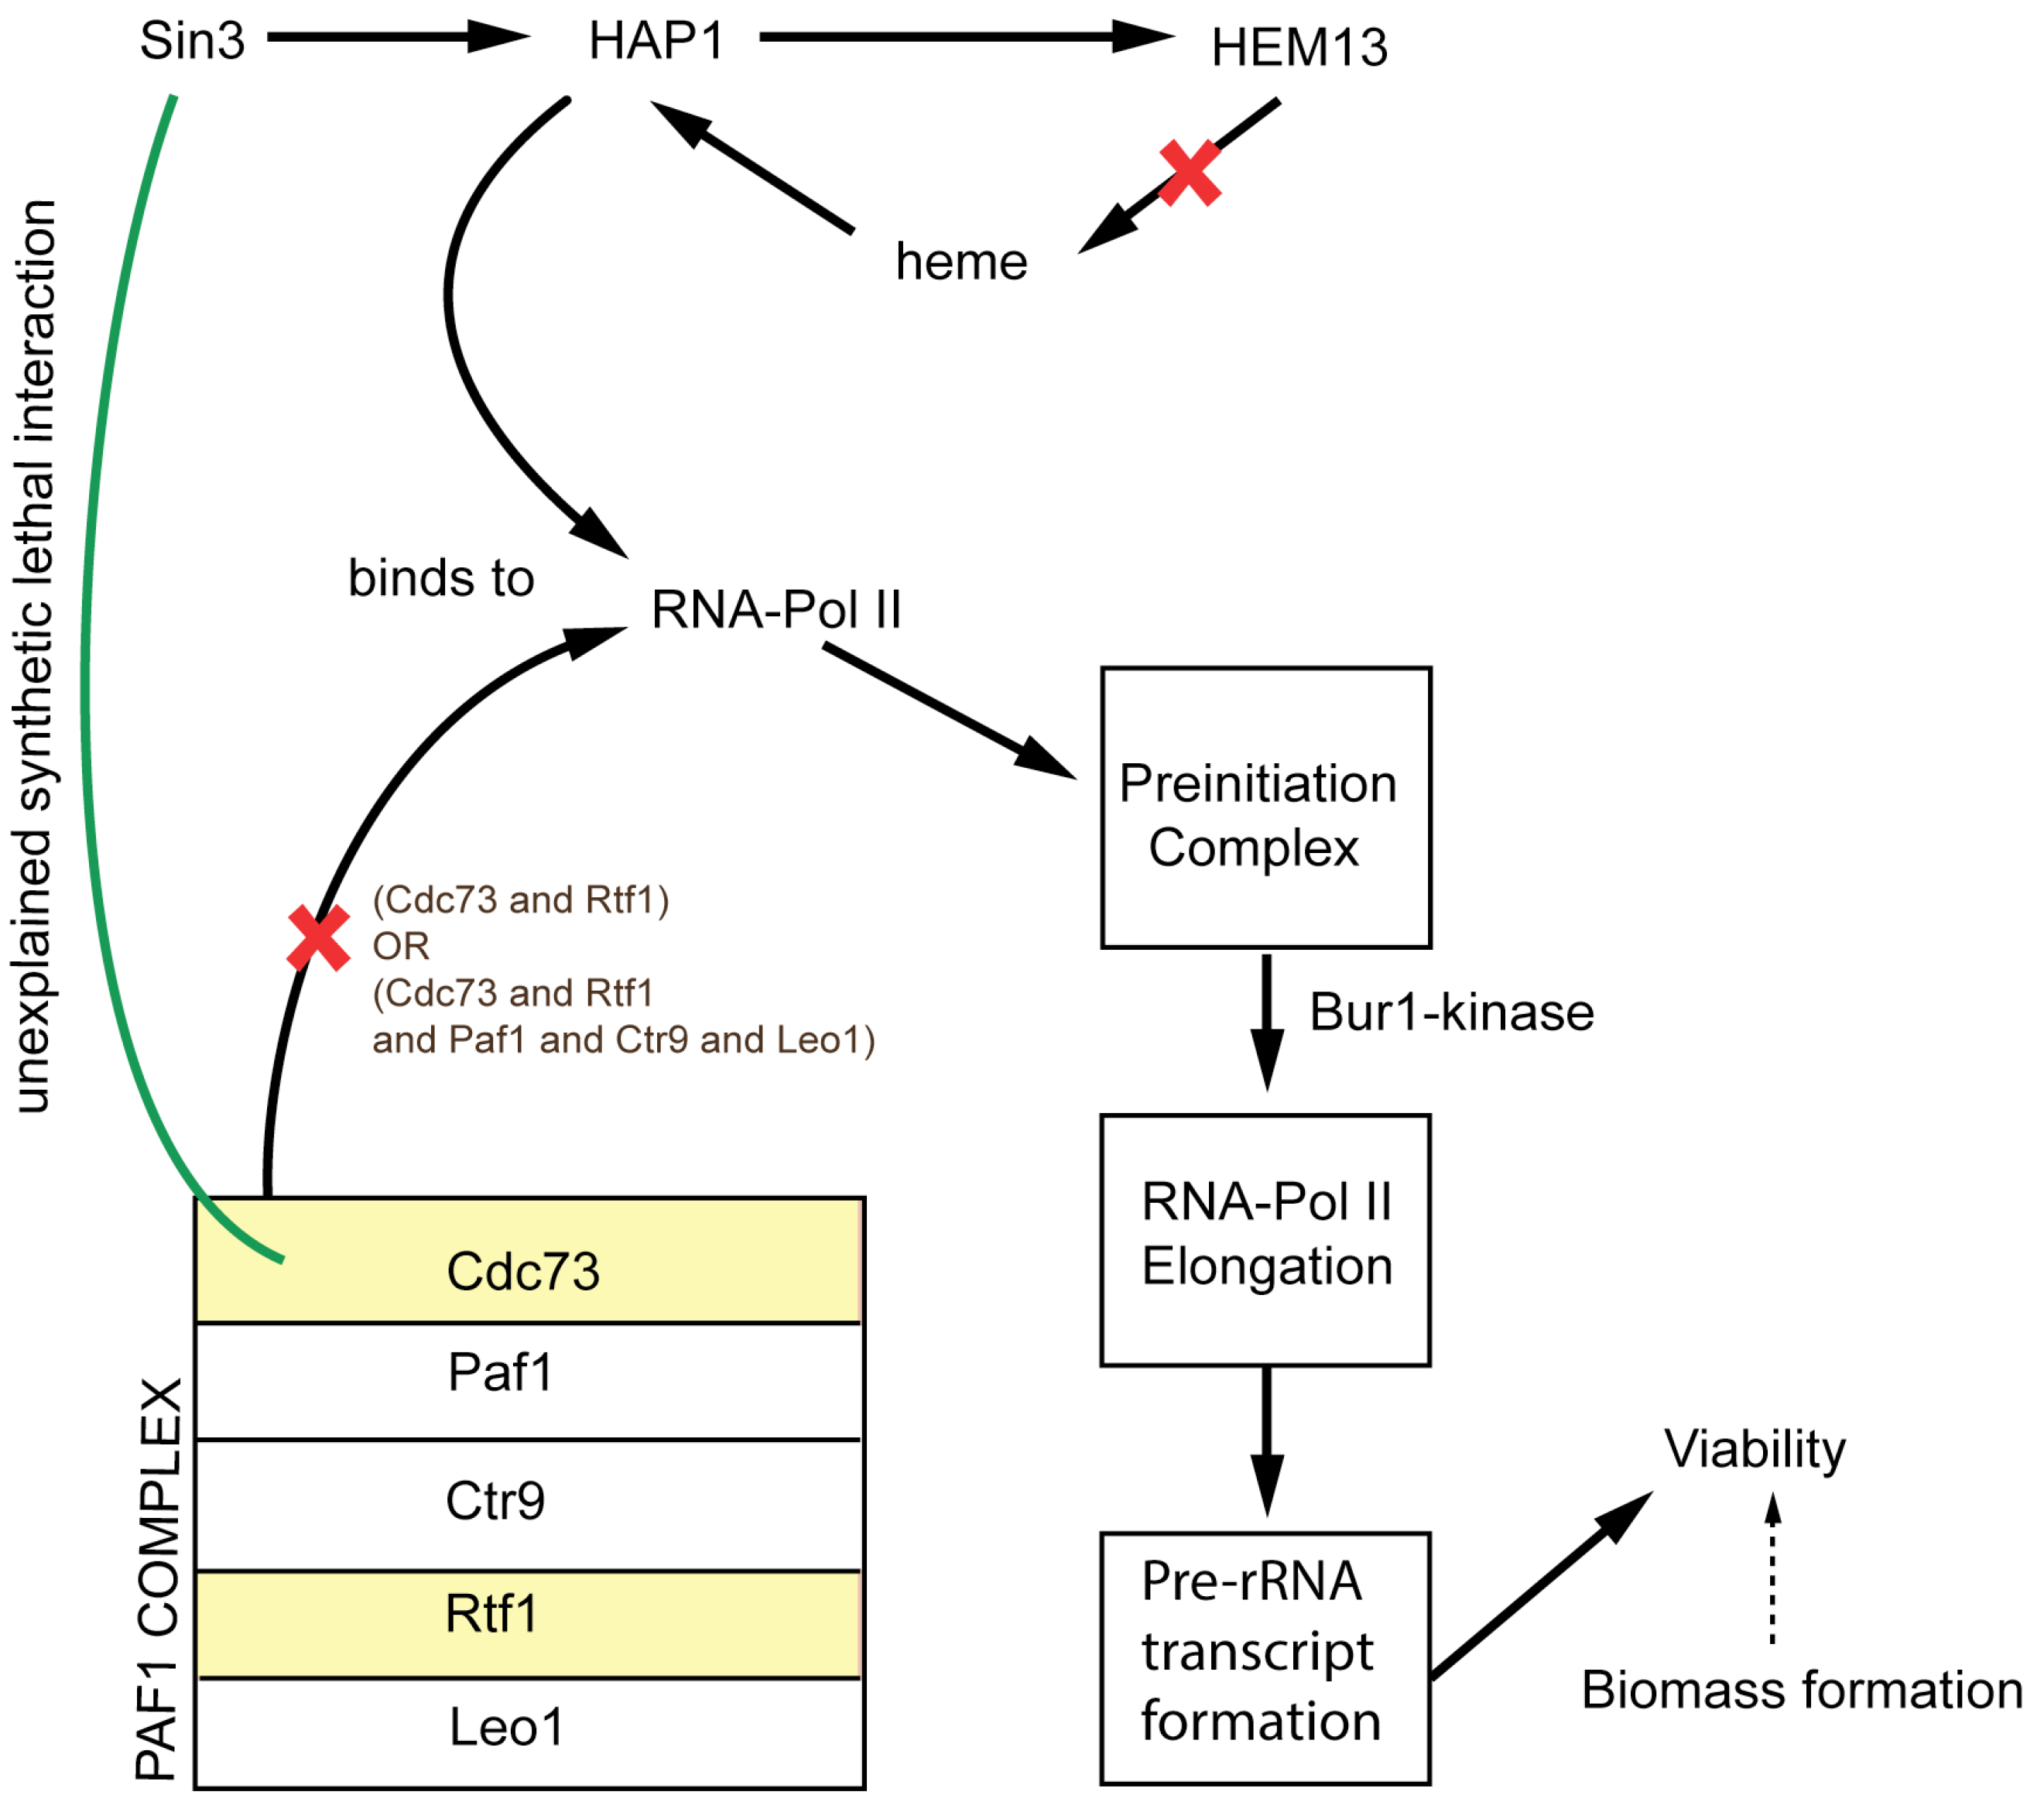
Shows a suggested schematic to exhibit the non-metabolic lethal interaction between Cdc73 and Hem13 gene in yeast. The red crosses represent the loss of function upon deletion of Hem13 and Cdc73 genes.
Figure 2.
Shows a suggested schematic to exhibit the non-metabolic lethal interaction between Cdc73 and Hem13 gene in yeast. The red crosses represent the loss of function upon deletion of Hem13 and Cdc73 genes.
Five separate classes of model modifications were introduced for Yeast 7.11 (see Table 2) including (a) addition of reactions, (b) removal of reactions, (c) GPR modifications, and (d) addition of GPR information for orphan reactions. We have also separately listed 12 ESG cases (see Table 3) where we have explained why they should have been ESES cases instead.
2.1.1. Addition of Reactions
A total of six reactions were added to Yeast 7.11 (see Supplemental File S1: Table 1). They generally fill in gaps in existing pathways by introducing in vivo verified reactions and the corresponding genes in the model. They also reconcile ESSL2 inconsistencies to SL2SL2 agreements. For example, restoring the BAT1-BAT2 in silico synthetic lethal pair by adding α-keto isovalerate transport between mitochondria and cytosol in the model (see Table 2). Another reconciliation of ESG case to GG case involved an iron (II) transporter reaction being added to the model (see Table 2). Yeast 7.11 contains a low-affinity iron (II) transporter gene FET4 causing ESG inconsistency. In vivo evidence [58] revealed the presence of a high-affinity iron (II) transporter (encoded by FET3) that can also transport iron (II) across the plasma membrane rendering the FET3-FET4 gene combination an in vivo synthetic lethal. Thus, adding the FET3 mediated transport reaction for iron (II) reconciles FET4 from ESG to GG and also identifies FET3-FET4 as an SL2SL2 match.
2.1.2. Removal of Reactions
Three reactions (see Supplemental File S1: Table 1) were removed from the model that restored GSL2 inconsistencies to SL2SL2 agreements without affecting any of the correct predictions. For example, removal of the orphan reaction pyrimidine-nucleoside phosphorylase that converts uridine to UMP renders the in silico double mutant ΔFUR1ΔURA3 lethal in agreement with in vivo data. The fact that the removed pyrimidine-nucleoside phosphorylase reaction lacked a GPR association possibly alludes to the putative nature of its inclusion into the model. The reactions (see Supplemental File S1: Table 1) were tagged using the IDs in the Yeast 7.11 model. One of suggested removals (i.e., r_1682 where S-adenosyl L-methionine and zymosterol is converted to ergosta-5, 7, 22, 24 (28)-tetraen-3beta-ol) involved the elimination of a lumped form of a reaction whose elementary steps (i.e., r_0986, r_0242, r_0243 and r_0244) are already present in the Yeast 7.11 model.
2.1.3. GPR Modifications
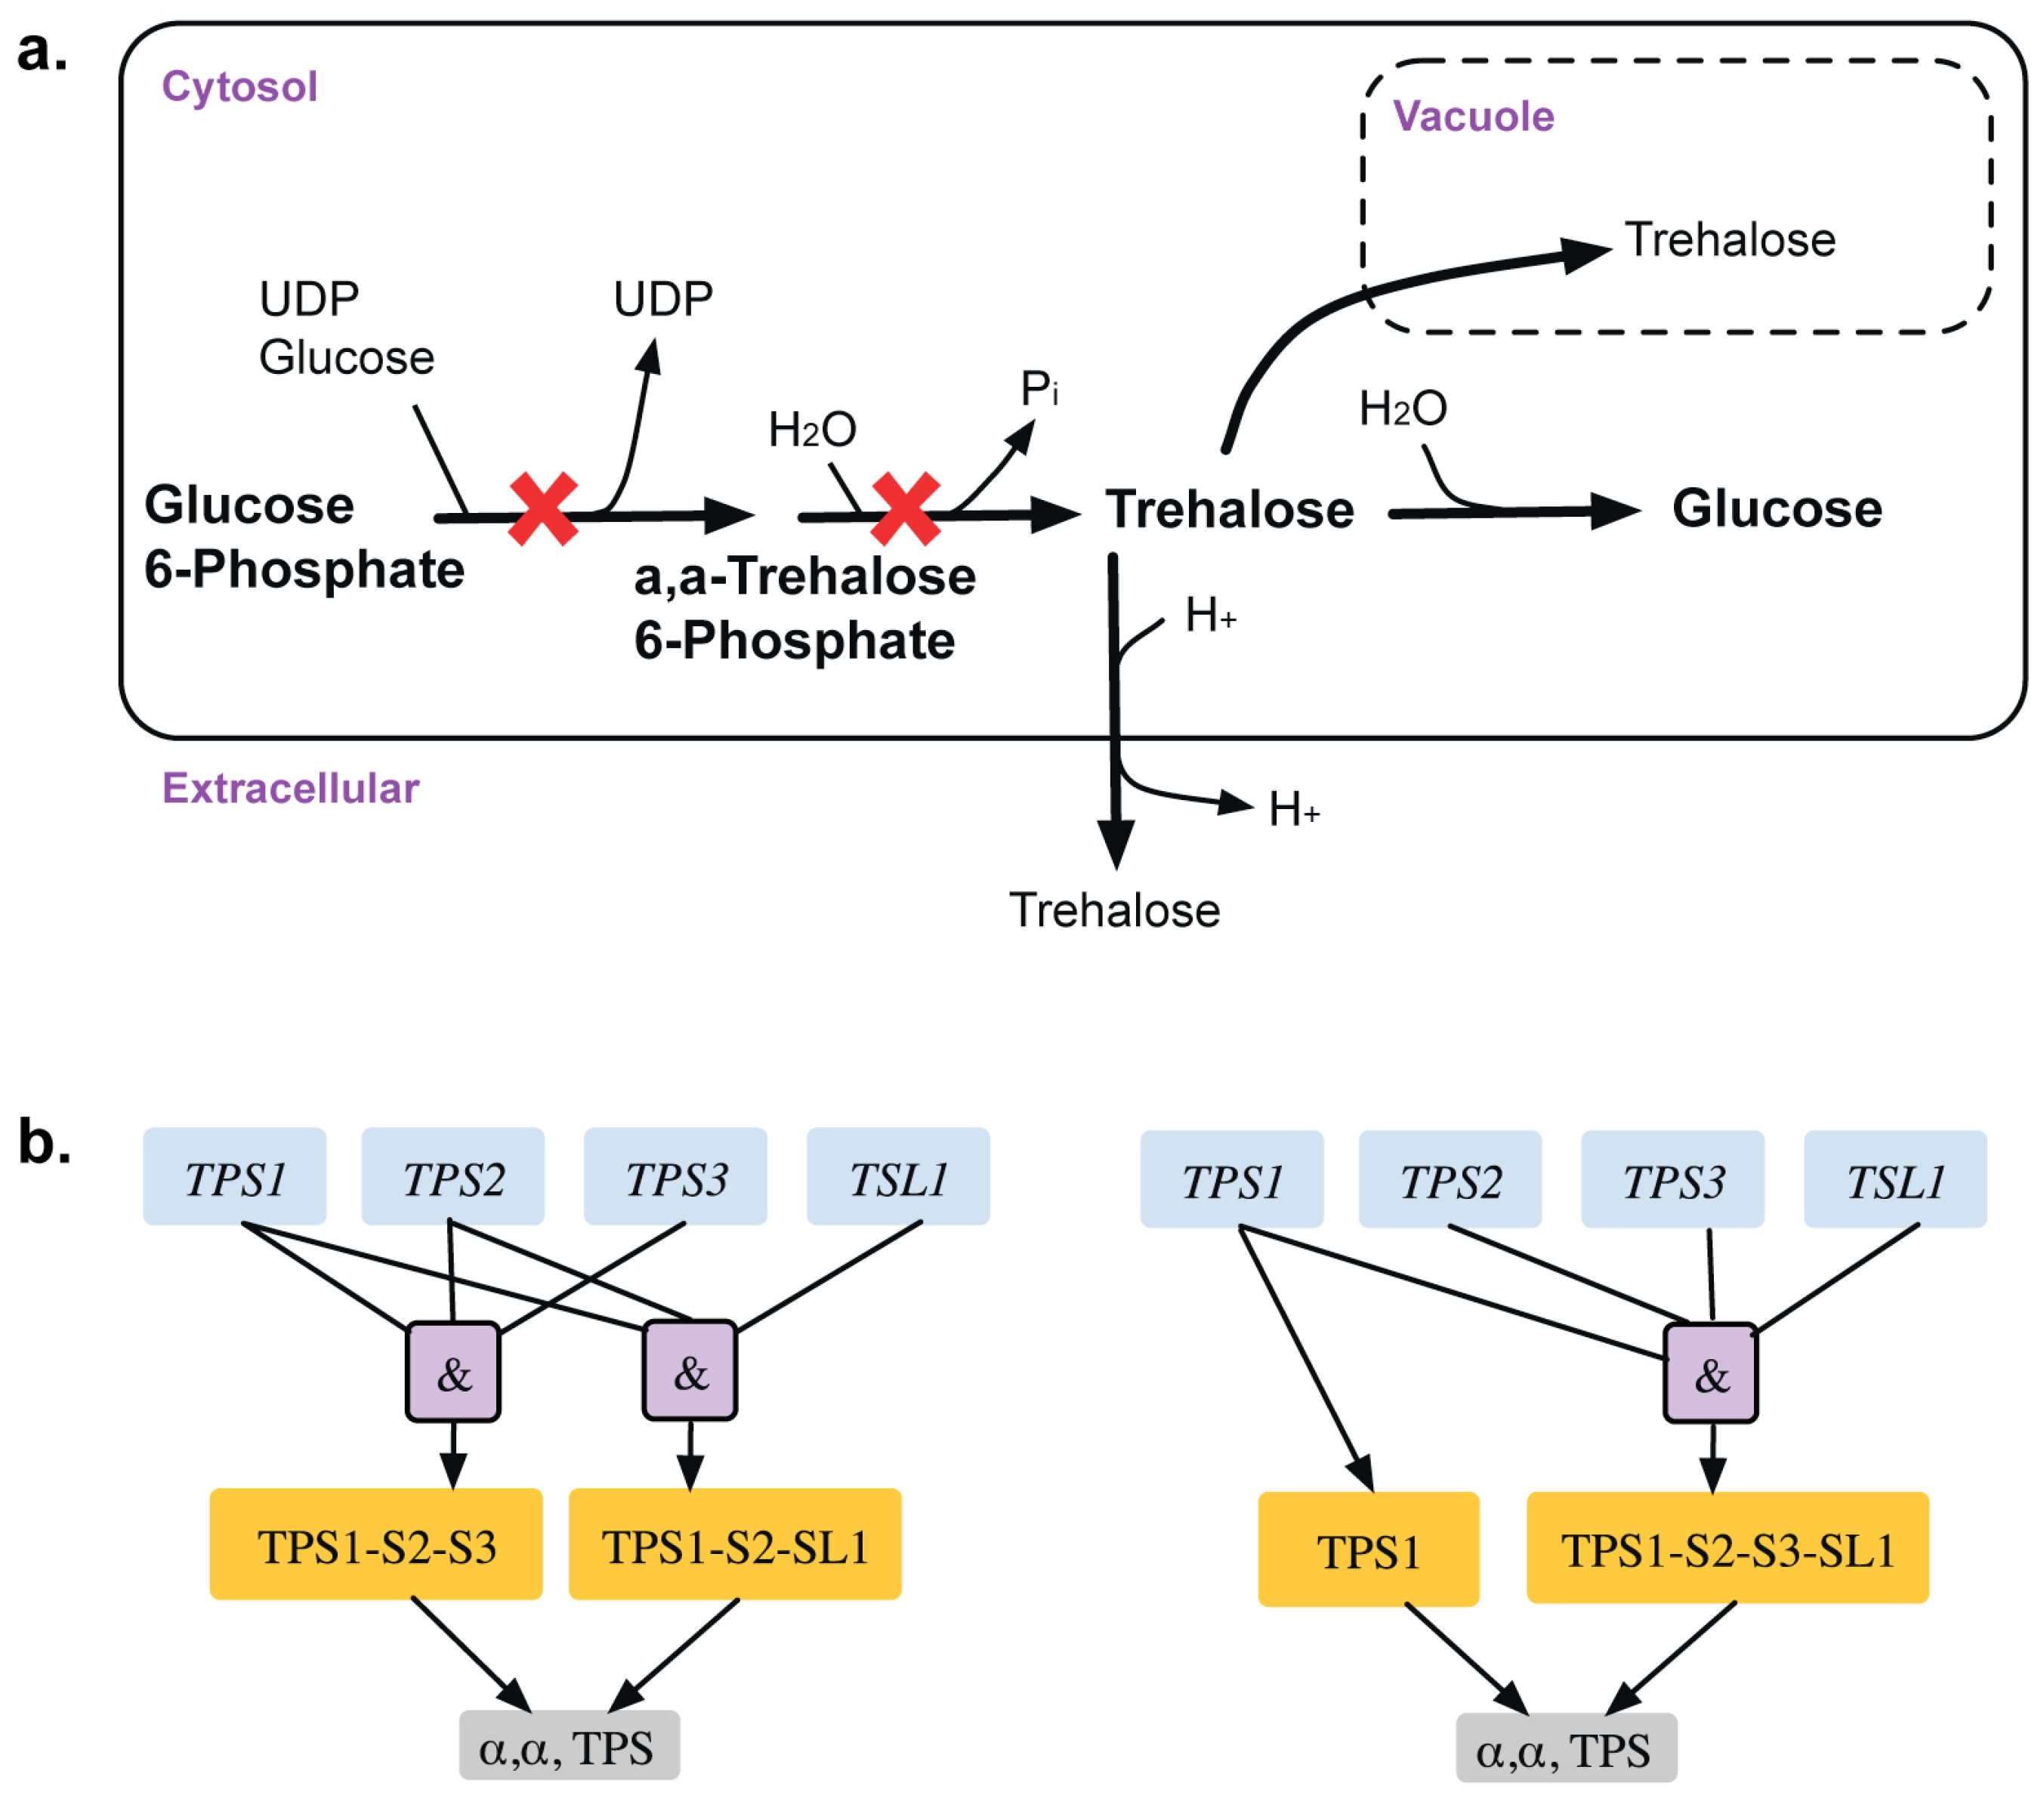
A total of 13 GPR modifications were made to the model that corrected for 15 inconsistencies. For example, α, α-trehalose phosphatase synthase (UDP-forming) and trehalose phosphate phosphatase catalyze the formation of α,α-trehalose phosphate from glucose-6-phosphate, which is converted to trehalose in the presence of UDP-glucose (see Figure 3). The GPR amendment from (TPS1 and TPS2 and TPS3) or (TPS1 and TPS2 and TSL1) to TPS1 or (TPS1 and TPS2 and TPS3 and TSL1) changes the deletion of TPS2 from ESG to GG and identifies only TPS1 as essential [38,39] in glucose or fructose media as elucidated in Bell et al. [40].
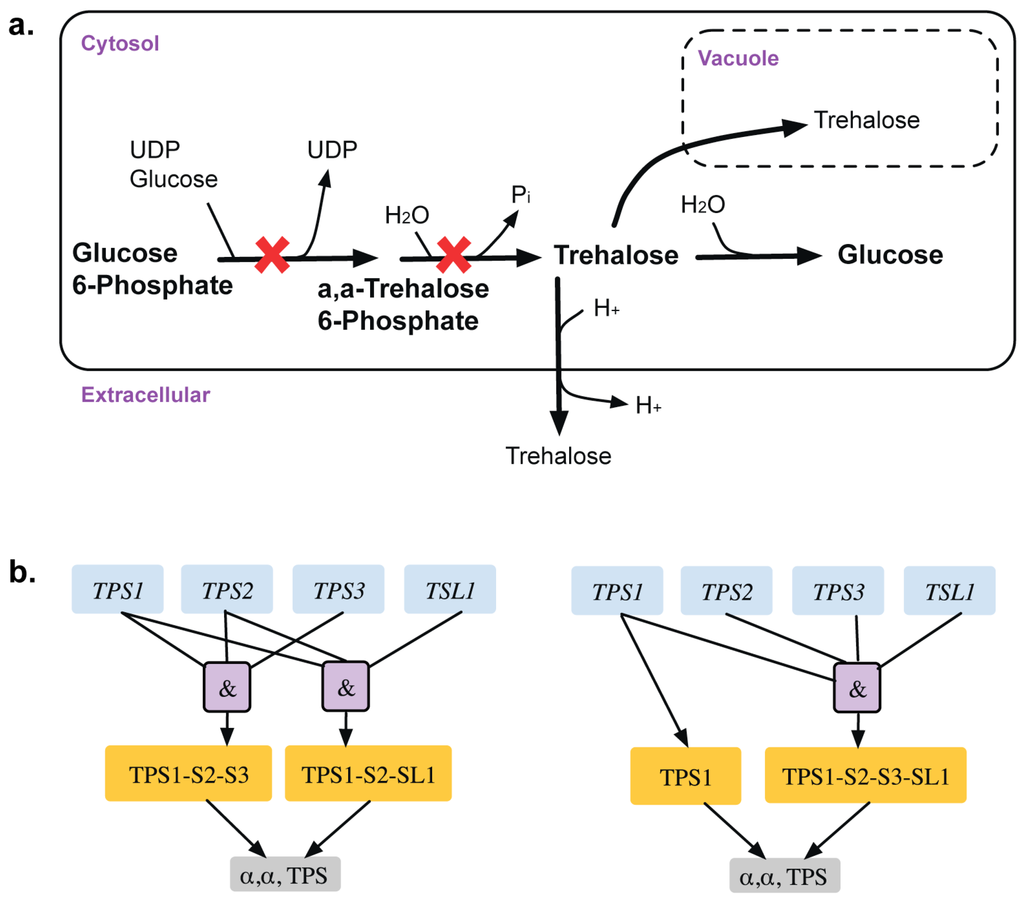
Figure 3.
Trehalose metabolism. (a). Trehalose biosynthetic pathway with essential reactions marked with a red cross. (b). GPR modification revealing that TPS1 gene is only essential for the associated reactions in minimal glucose medium. Old GPR is shown on the left and new GPR on the right.
Figure 3.
Trehalose metabolism. (a). Trehalose biosynthetic pathway with essential reactions marked with a red cross. (b). GPR modification revealing that TPS1 gene is only essential for the associated reactions in minimal glucose medium. Old GPR is shown on the left and new GPR on the right.
In S. cerevisiae, most of the ATP formation occurs from glycolysis. A Δfba1 strain shows more than five-fold reduction in net ATP production in silico, which proportionately reduces the biomass flux (from 2.44 h−1 to 0.465 h−1). However, this is above the in silico viability threshold rendering the fba knockout non-essential. A possible reason for this contradiction could be the inability to capture the in vivo suppression of mitochondrial respiratory enzymes under accumulation of cytosolic fructose 1,6-bisphosphate due to short-term Crabtree effect [59]. In fact turning off MIR1 mediated phosphate/proton mitochondrial symporter (PIt2m) [60] makes fba1 mutant in silico lethal (reducing the net ATP production by ~35-fold) thereby resolving a GES case to an ESES case. The same observation also holds true for a tpi1 deletion in S. cerevisiae.
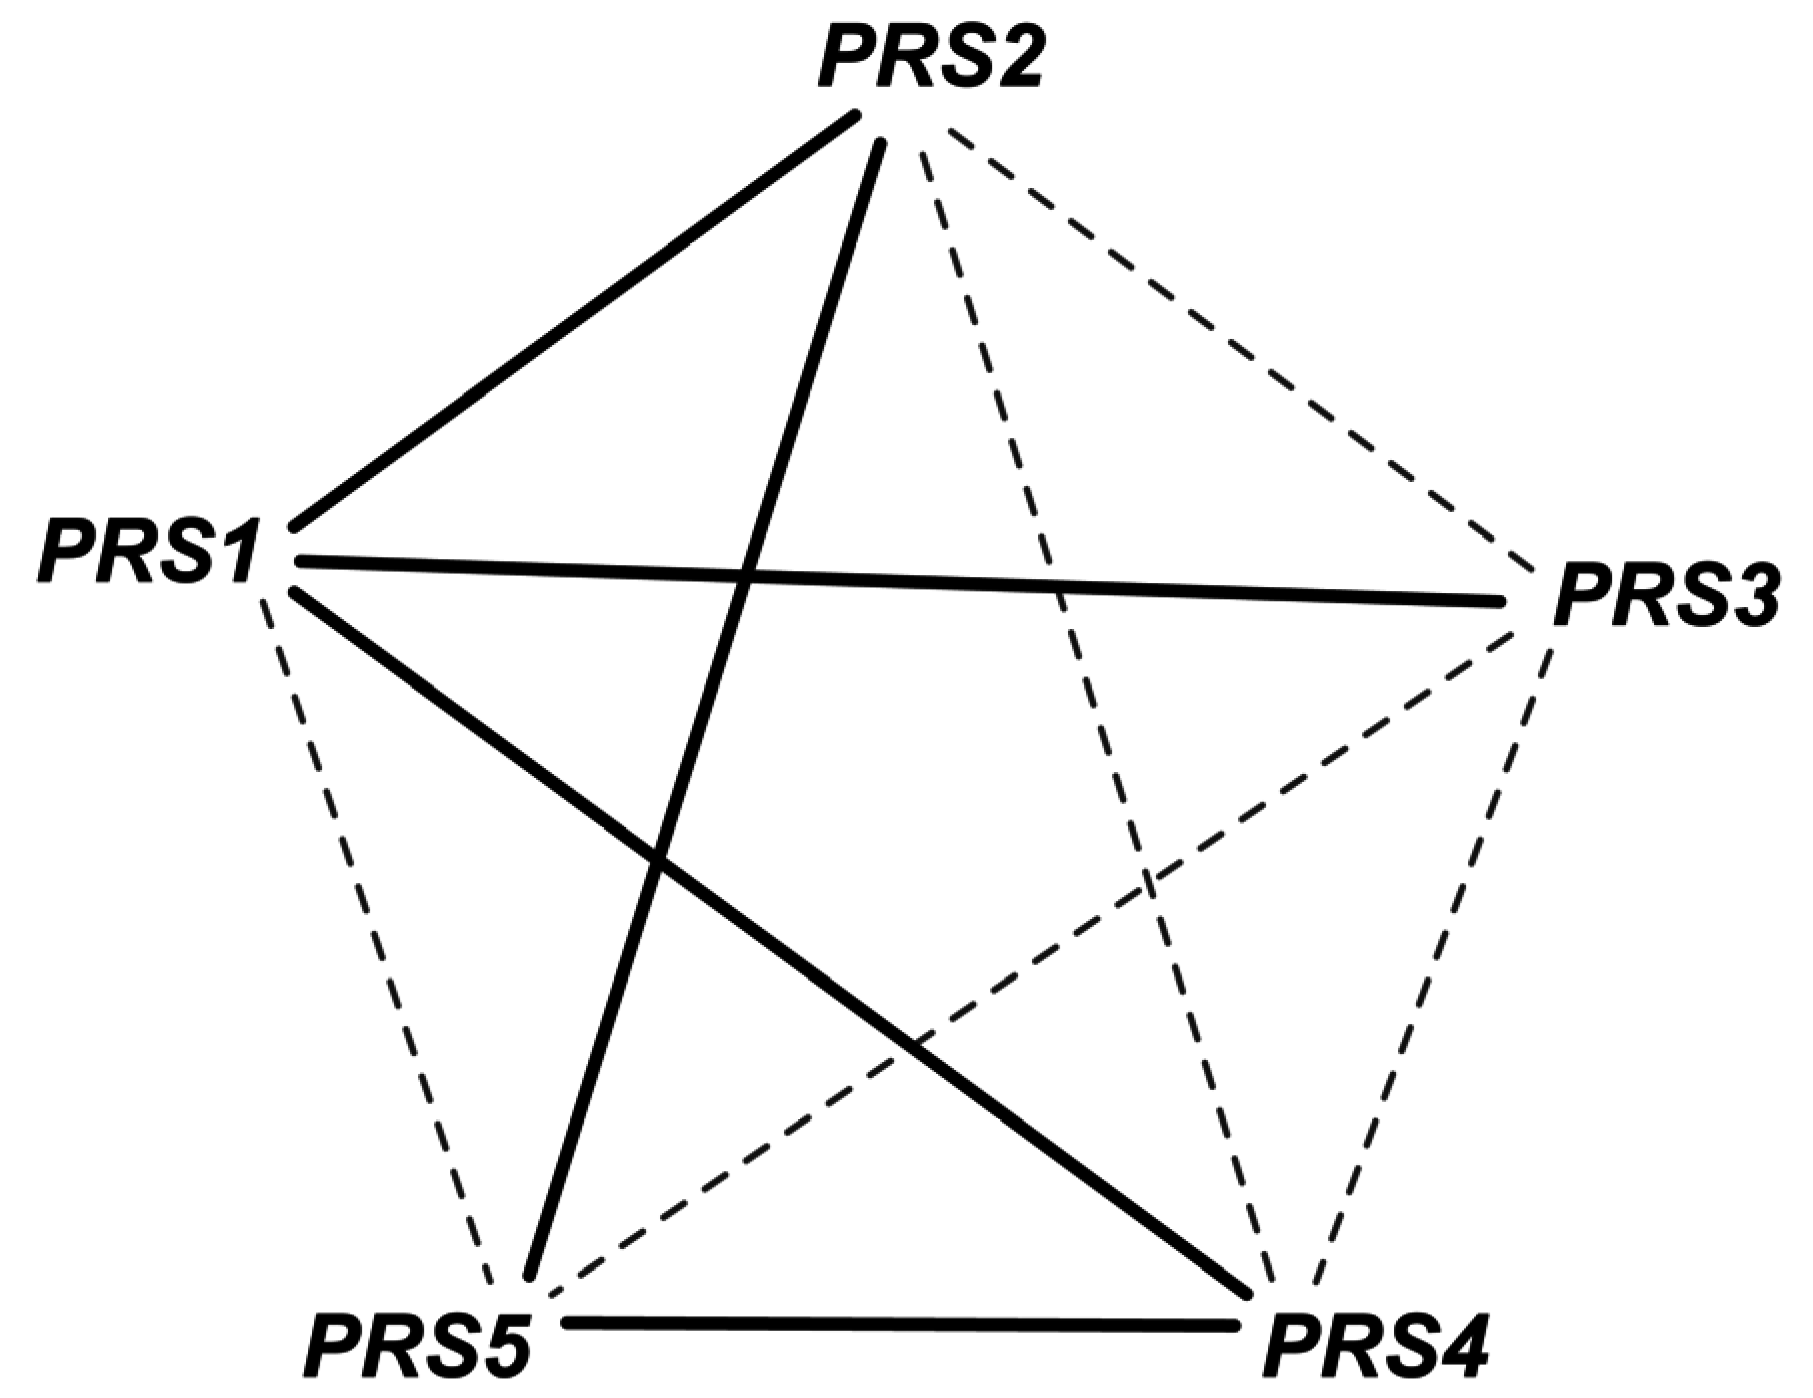
Phosphoribosyl diphosphate synthase catalyzes the essential reaction PRPPS. The inconsistency of this GPR was addressed in iAZ900 [8] and was modified to depict that any of the three PRS gene pairs (PRS1 and PRS3), (PRS2 and PRS5) or (PRS4 and PRS5) is capable of encoding the sub-units required for catalyzing the reaction. However, it was later shown [68] that any of the five viable pairs (see Figure 4) need to be present for growth with one subunit containing an NHR (non-homologous region) and the other without one. Both PRS1 and PRS5 contain NHR while the rest do not. Therefore, the current GPR (YHL011C and YKL181W) or (YOL061W and YBL068W) or (YOL061W and YER099C) was corrected accordingly to (YKL181W and YER099C) or (YKL181W and YHL011C) or (YKL181W and YBL068W) or (YER099C and YOL061W) or (YBL068W and YOL068W). This correction not only recapitulates all in vivo observations but also predicts one lethal pair and two lethal triplet mutants (i.e., Δprs1Δprs5 and Δprs1Δprs2Δprs4, Δprs2Δprs3Δprs4 respectively).
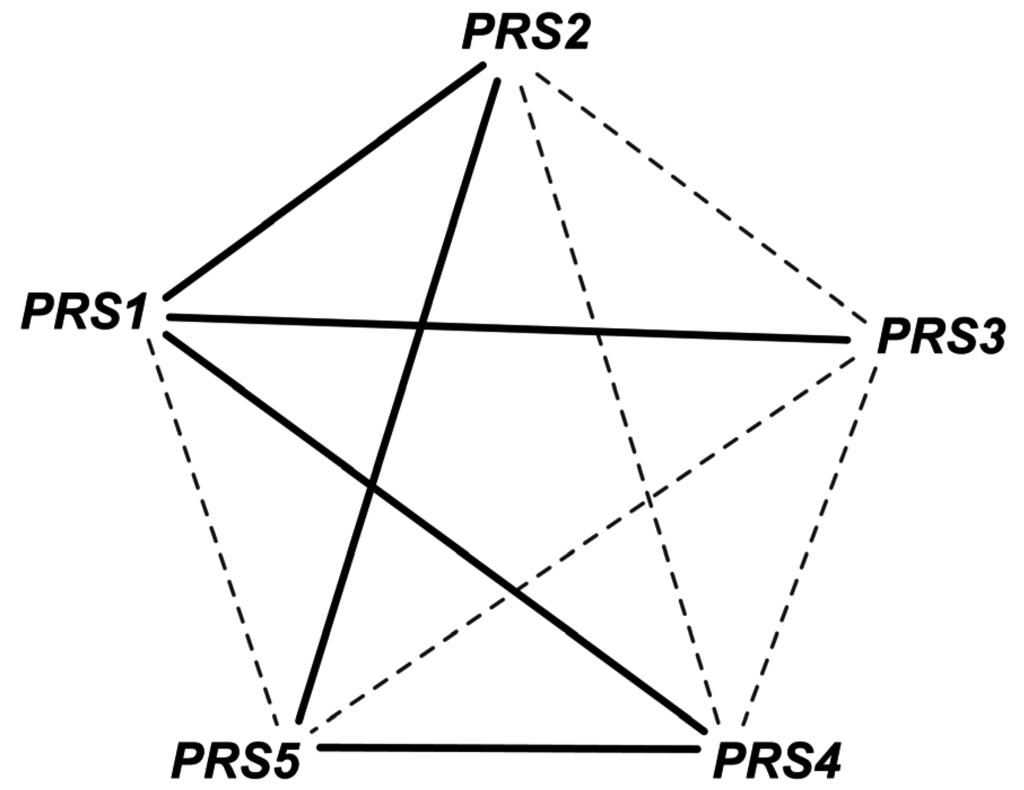
Figure 4.
Gene combinations for PRPPS reaction. The gene pairs connected by solid edges are capable for catalyzing the reaction. Any such simultaneous gene deletion (such as prs1-prs5 double deletion) that prevents the formation of all of these solid-line-connected gene pairs is lethal for the cell.
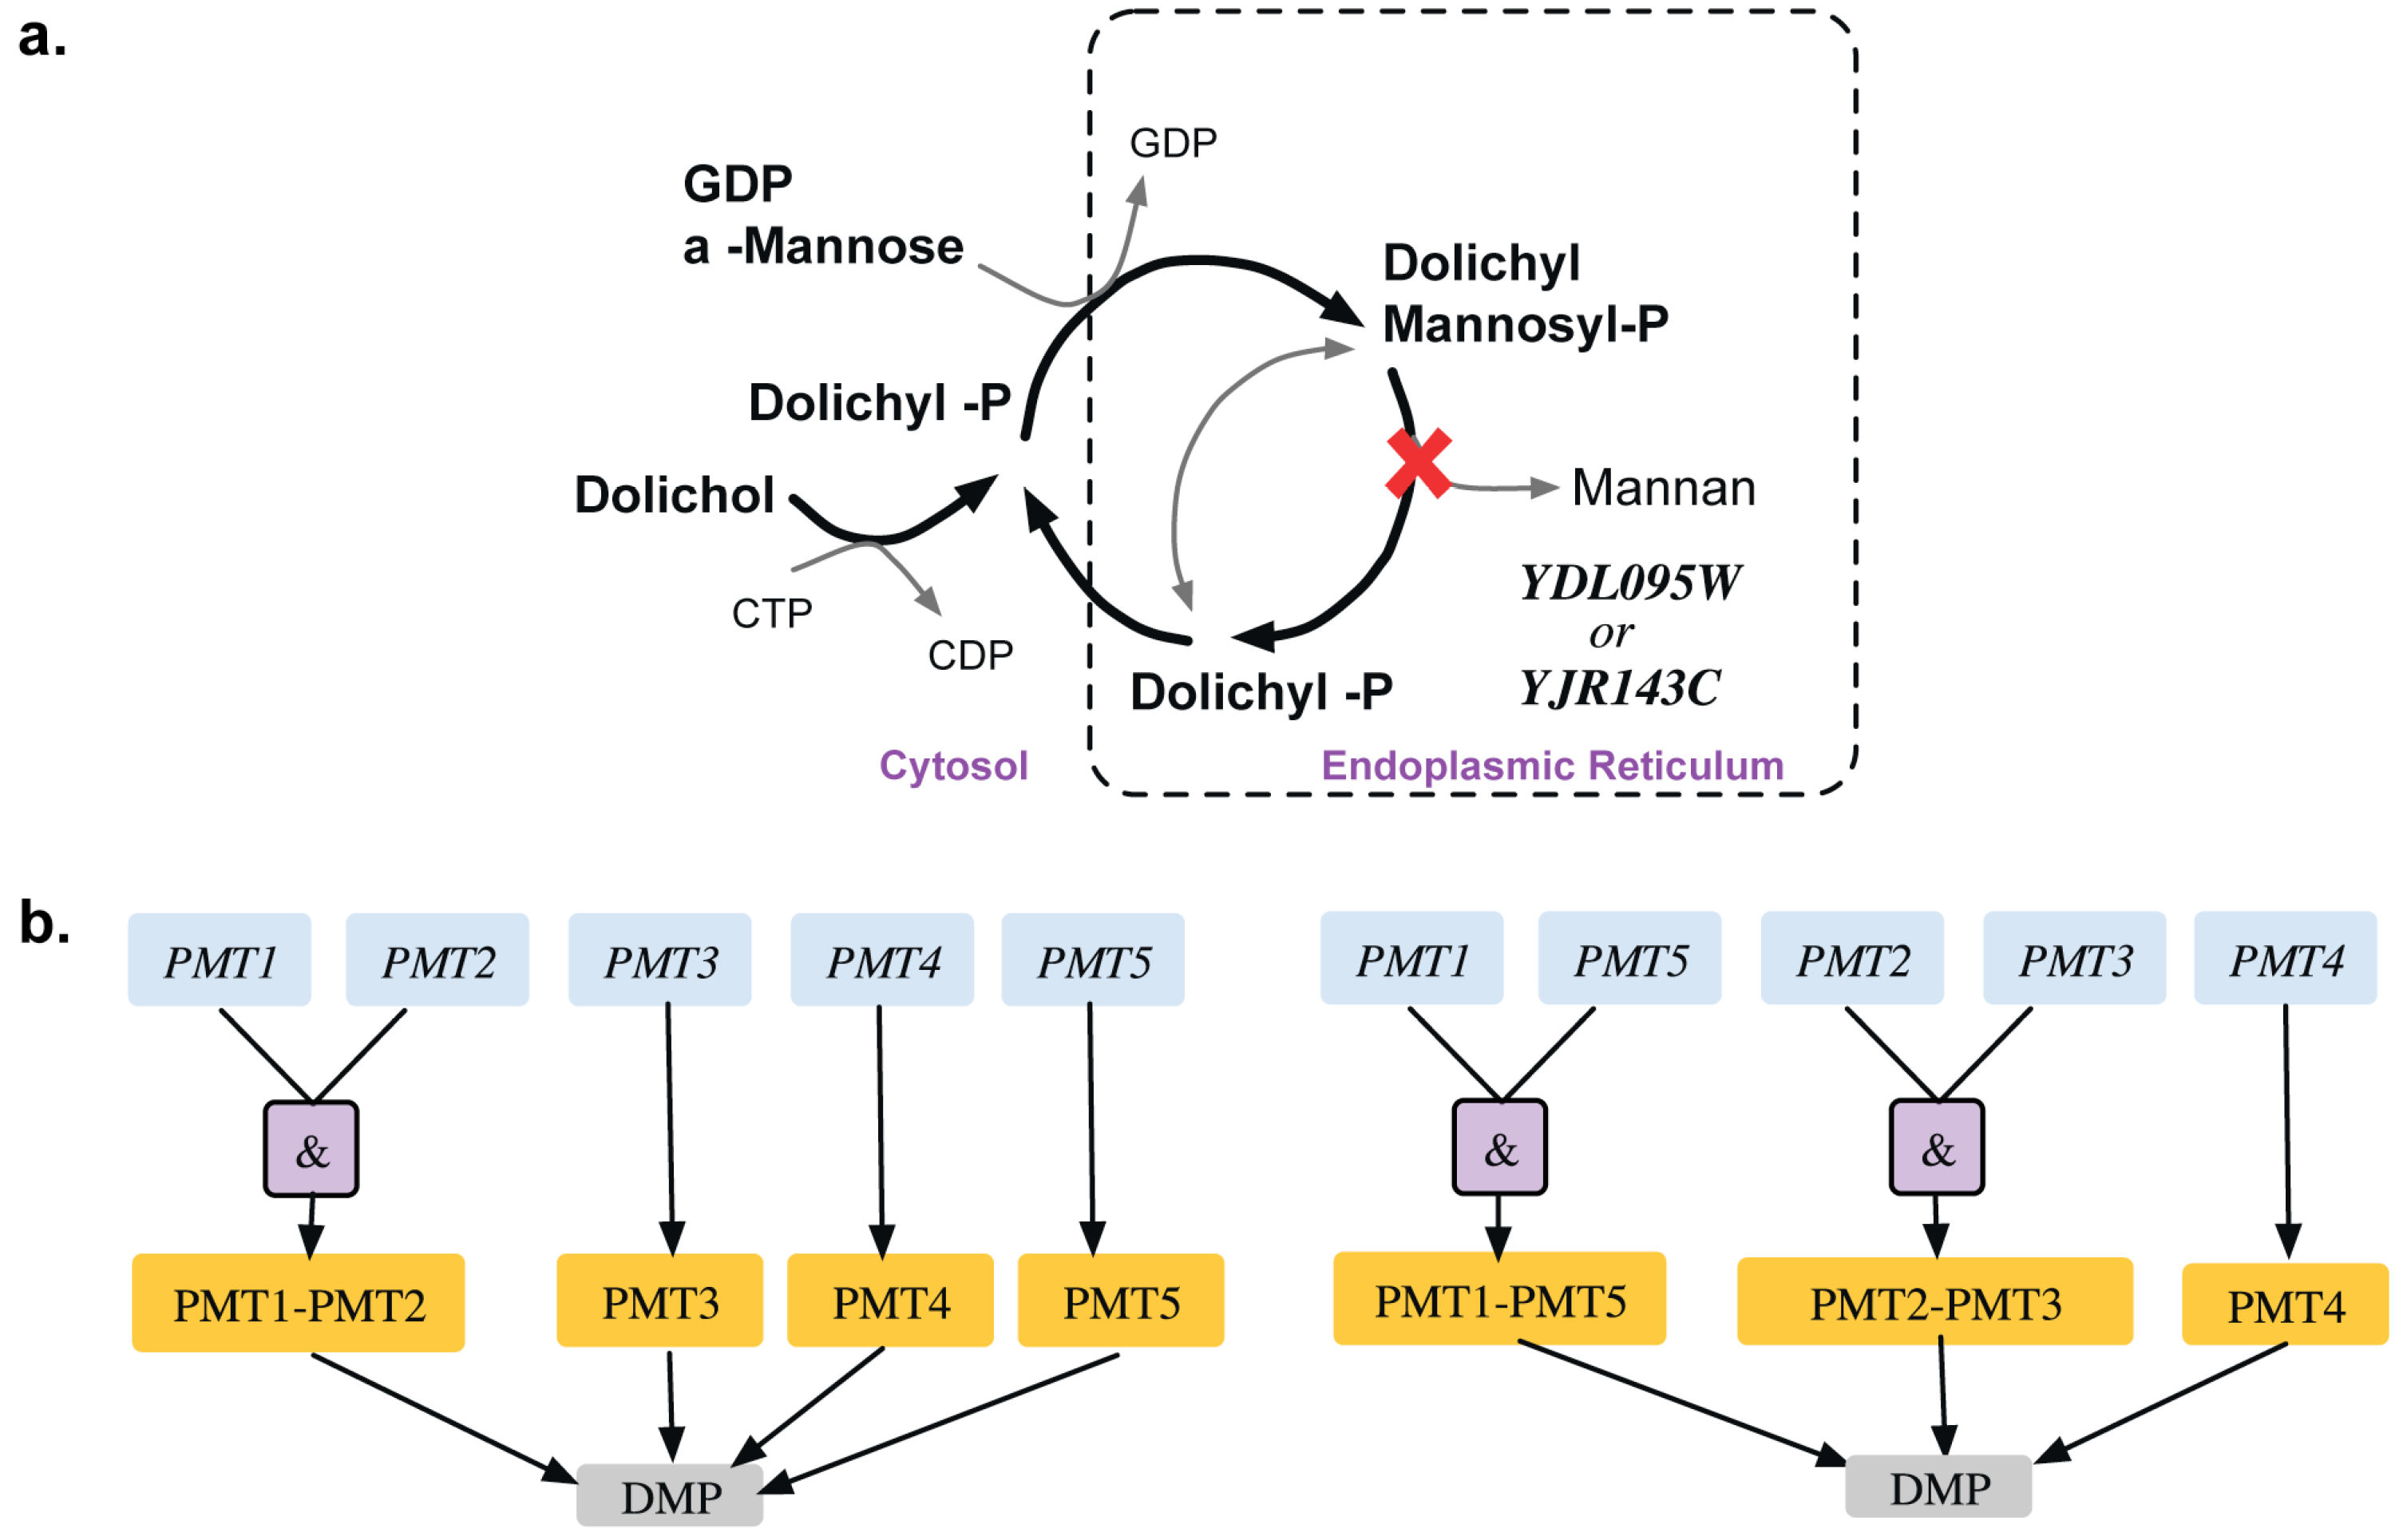
Bifunctional carbamoyl phosphate synthetase catalyzes the first two enzymatic steps in the de novo biosynthesis of pyrimidines both of which undergo feedback inhibition by UTP (uridine tri-phosphate). The existing GPR identifies (CPA1, URA2) and (CPA2, URA2) as SL pairs. In fact, experimental evidence [43] and the Saccharomyces Genome Database [24] reveal that all three of CPA1, CPA2 and URA2 are essential (see Figure 5). Similar evidence was seen in another yeast strain Candida albicans [44]. This GPR modification from ((YJR019C and YOR303W) or YJL130C)) to (YJR019C and YOR303W and YJL130C) rectifies two SL2ES cases to ESES and three GES cases to ESES. Dolichyl phosphate mannose mannosyl transferase catalyzes the conversion of dolichyl mannosyl phosphate to mannan in the endoplasmic reticulum, which is then transported out to the cytosol and forms a biomass precursor. The existing GPR (see Figure 6) suggests that either one of PMT3, PMT4, PMT5 or both of PMT1 and PMT2 need to be present for the reaction to occur. However, recent experimental evidence [69,70] implies that PMT genes are classified in the following three sub-families (sub-family 1: PMT1 and PMT5), (sub-family 2: PMT2 and PMT3) and (sub-family 3: PMT4). Literature evidence [68] suggests that only the removal of PMT4 in combination with deletions in both sub-family members 1 and 2 is lethal. Therefore, the GPR is modified from ((PMT1 and PMT2) or PMT3 or PMT4 or PMT5) to ((PMT1 and PMT5) or (PMT2 and PMT3) or PMT4). This modification puts forth the following four lethal triplet gene deletions: Δpmt1Δpmt2Δpmt4, Δpmt5Δpmt2Δpmt4, Δpmt1Δpmt3Δpmt4 and Δpmt5Δpmt3Δpmt4.
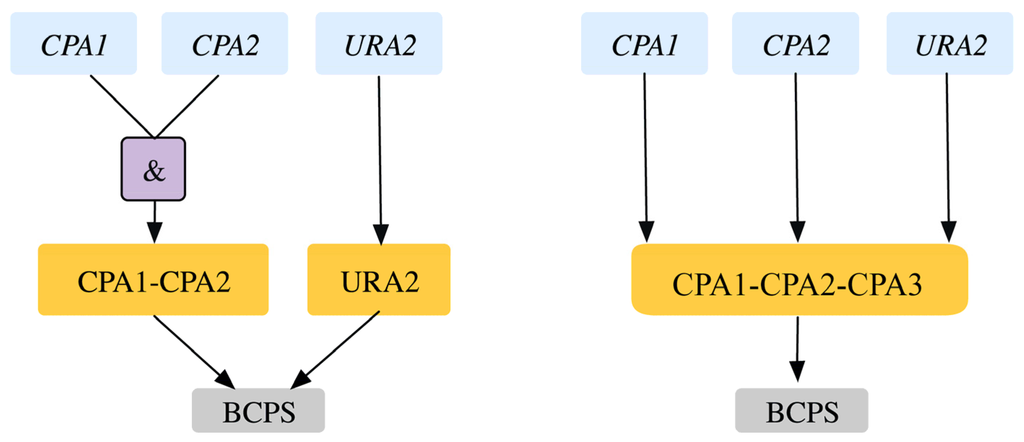
Figure 5.
Gene-protein-reaction association for bifunctional carbamoyl phosphate synthase reaction. The genes (blue) code for the proteins (orange) that catalyze the reaction (gray). Old GPR is shown on the left and new GPR on the right.
Figure 5.
Gene-protein-reaction association for bifunctional carbamoyl phosphate synthase reaction. The genes (blue) code for the proteins (orange) that catalyze the reaction (gray). Old GPR is shown on the left and new GPR on the right.
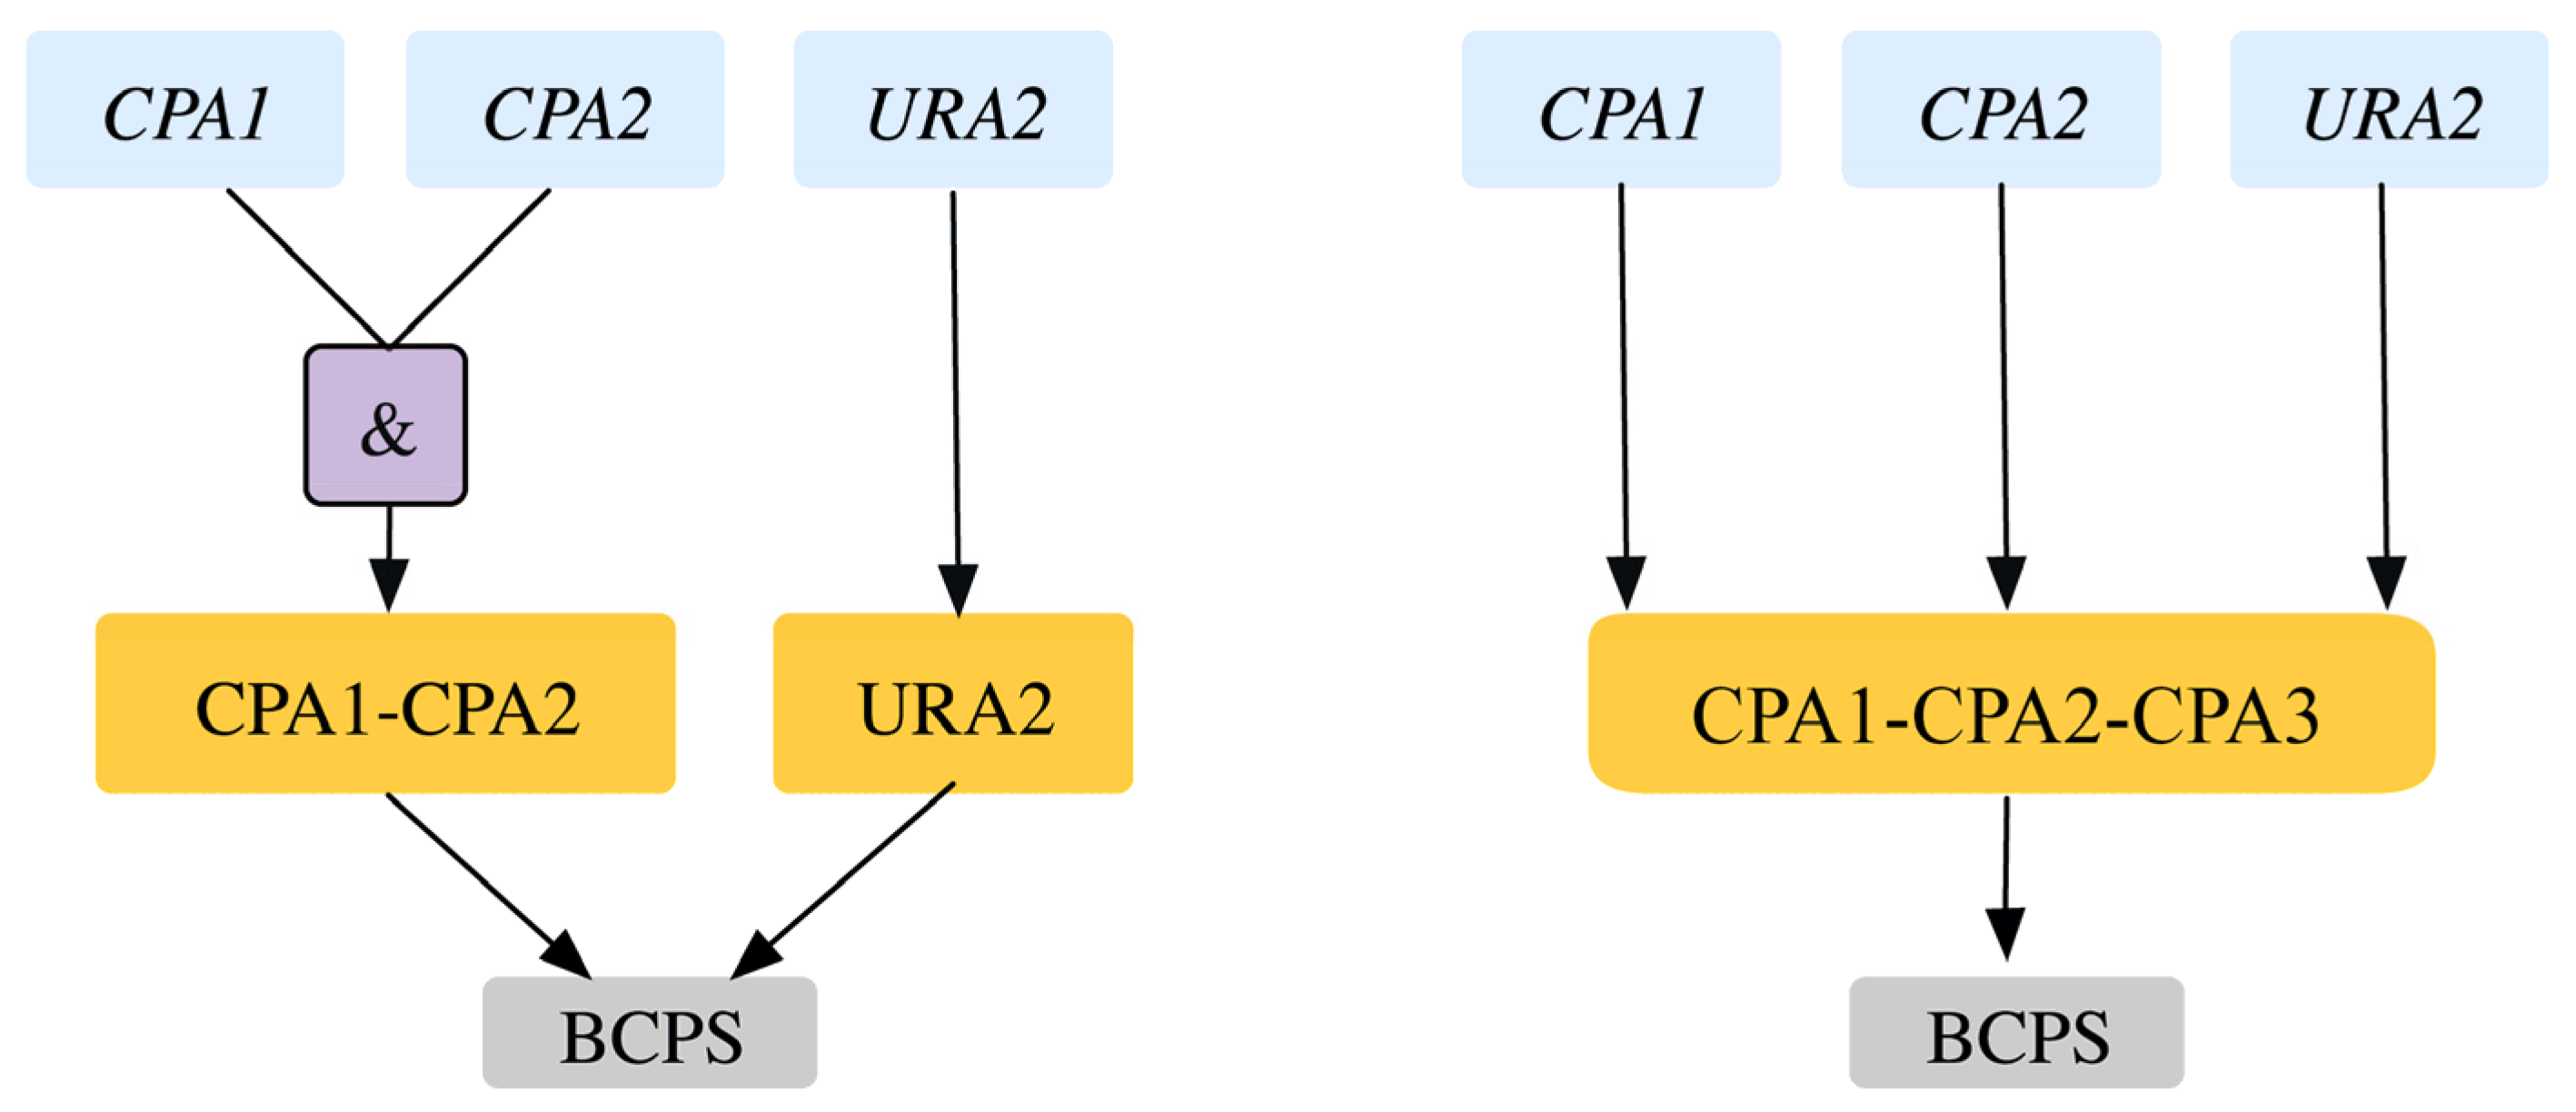
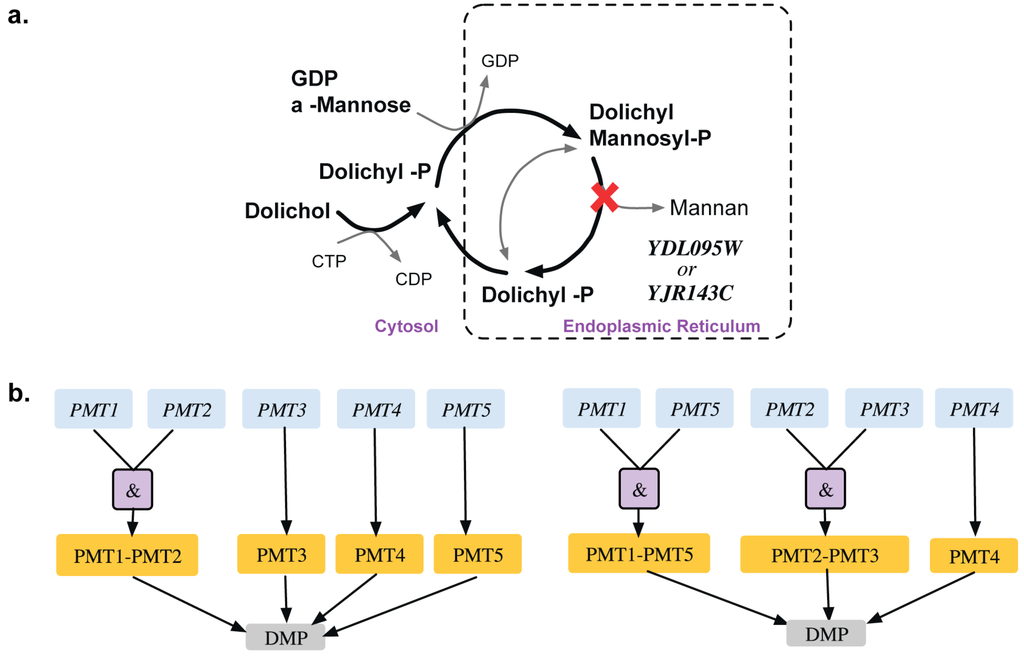
Figure 6.
Auxotrophy of mannan (a). Pathway showing essential reaction (marked with red cross) for mannan biosynthesis (b). Gene-protein-reaction association for conversion of dolichyl-mannosyl phosphate to mannan. The genes (blue) code for the proteins (orange), which catalyze the reaction (gray). Old GPR is shown on the left and new GPR on the right.
2.1.4. Addition of GPR to Orphan Reactions
There are 15 instances where GPR associations were assigned to orphan reactions in the model (see Supplemental File S1: Table 1). This adds 10 new gene loci to the model and correctly identifies them as non-essential based on growth data in budding yeast [43,44] and other well-annotated organisms such as E. coli [35]. For example, it has been shown [35] that S. cerevisiae contains an E. coli ortholog of ubiC gene that encodes for chorismate-pyruvate lyase enzyme, which enables the addition of the corresponding GPR to the reaction that was already present in the model. Gene deletion studies on ubiC reveal that it is non-essential matching model predictions. In another example, assigning BIO6 and BIO8 genes in the GPR for putative KAPA synthetase as seen in the YJM627 and A364a strains of S. cerevisiae [53,54] correctly identifies the deletion of either BIO6 or BIO8 as non-essential.
2.1.5. MSL2 Gaps in the Model
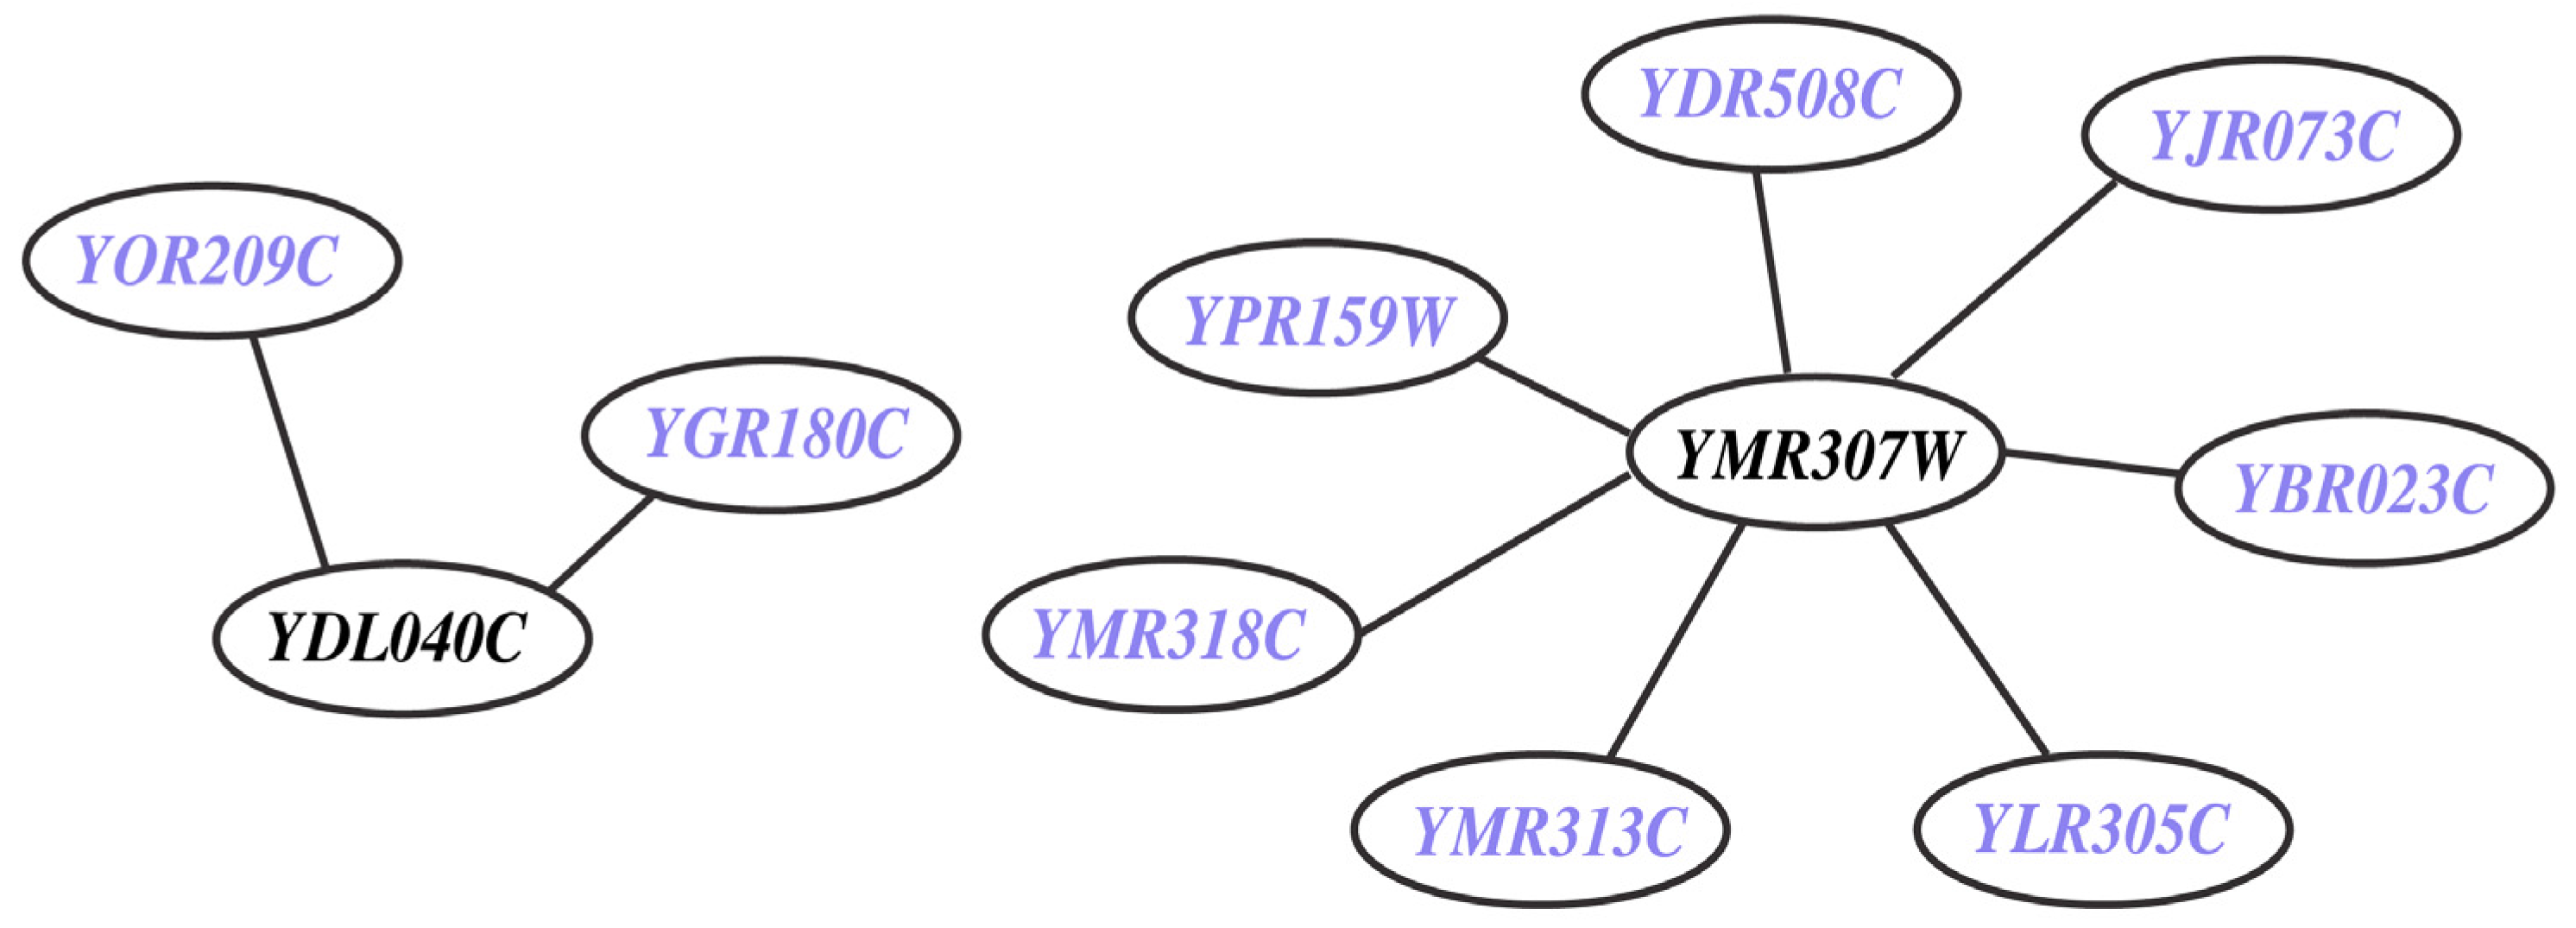
This refers to missing (M) genes (i.e., YDL040C and YMR307W) from the model despite the presence of experimental data on their deletion phenotype. They are integral to nine in vivo SL2 cases (see Figure 7 and Supplemental File S5). YMR307W (GAS1) encodes for beta-1,3-glucanosyltransferase [71] (belonging to the ERAD pathway [72]) a eukaryotic membrane protein embedded in the lipid bilayer that aids anchoring inositol associated glycophospholipids to the cell wall. On the other hand, YDL040C (NAT1) encodes for N-acetyltransferase and is primarily involved in cell wall integrity (CWI-MAPK) signaling pathway with a few ancillary functions such as cell-cycle, heat shock resistance, sporulation and telomeric silencing [73]. The CWI-MAPK signaling pathway [74,75]) involves a cohort of five genes (i.e., NAT1, NAT2, NAT3, NAT4 and NAT5) that are missing in Yeast 7.11. In the current effort we have successfully incorporated NAT1 and NAT2 and have correctly identified them as GG cases.
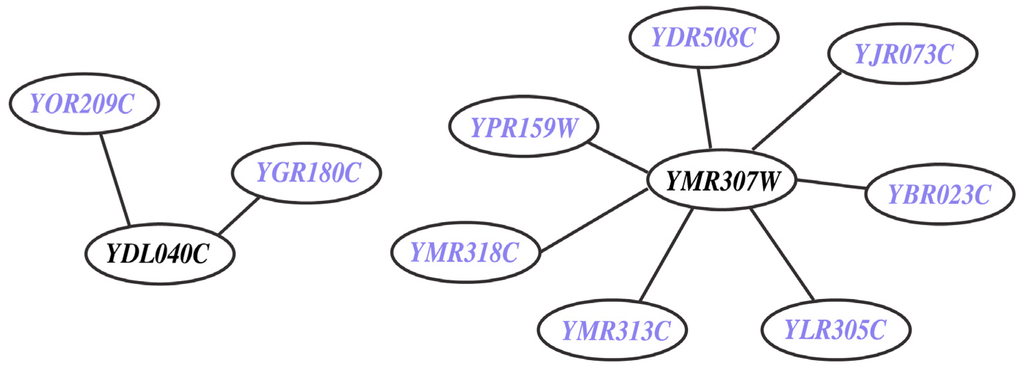
Figure 7.
In vivo lethal gene pairs absent in model (MSL2 case). The genes YDL040C and YMR307W are involved in nine in vivo SL pairs but they are not present in Yeast 7.11 reconstruction. The participating genes (in blue) are found to be non-essential in silico.
Figure 7.
In vivo lethal gene pairs absent in model (MSL2 case). The genes YDL040C and YMR307W are involved in nine in vivo SL pairs but they are not present in Yeast 7.11 reconstruction. The participating genes (in blue) are found to be non-essential in silico.
2.2. Model Predictions for Synthetic Lethals in S. Cerevisiae
Experimental gene deletion compilations such as the Keio collection [15] and Saccharomyces Genome Database [22,44] are available for single gene deletion mutants. Exhaustive information for growth deficiency for single gene deletions is available but for higher gene deletion combinations the task becomes prohibitive. For example, S. cerevisiae genome with 3,912 metabolic genes would require approximately 7.5 million double-knockout experiments to verify the viability of all double deletion mutants. Computational tools, such as the SL finder can identify in silico synthetic lethal combinations thus narrowing down the combinations to be tested in vivo. Supplementary Tables 3 and 4 (see Supplemental File S4) tabulate the list of gene pairs and higher order gene deletions in Yeast 7.11 that are in silico lethal but have not been tested yet in vivo. While the lethal effect of some of these deletions is straightforward, a number of cases reveal non-intuitive lethal deletion combinations from distal parts of metabolism that either hinder cofactor synthesis or transport to another compartment. Four such cases identified using the corrected Yeast 7.11 model are described next in more detail.
2.2.1. Proline Auxotrophy (Δpro1Δcar2 Double Mutant)
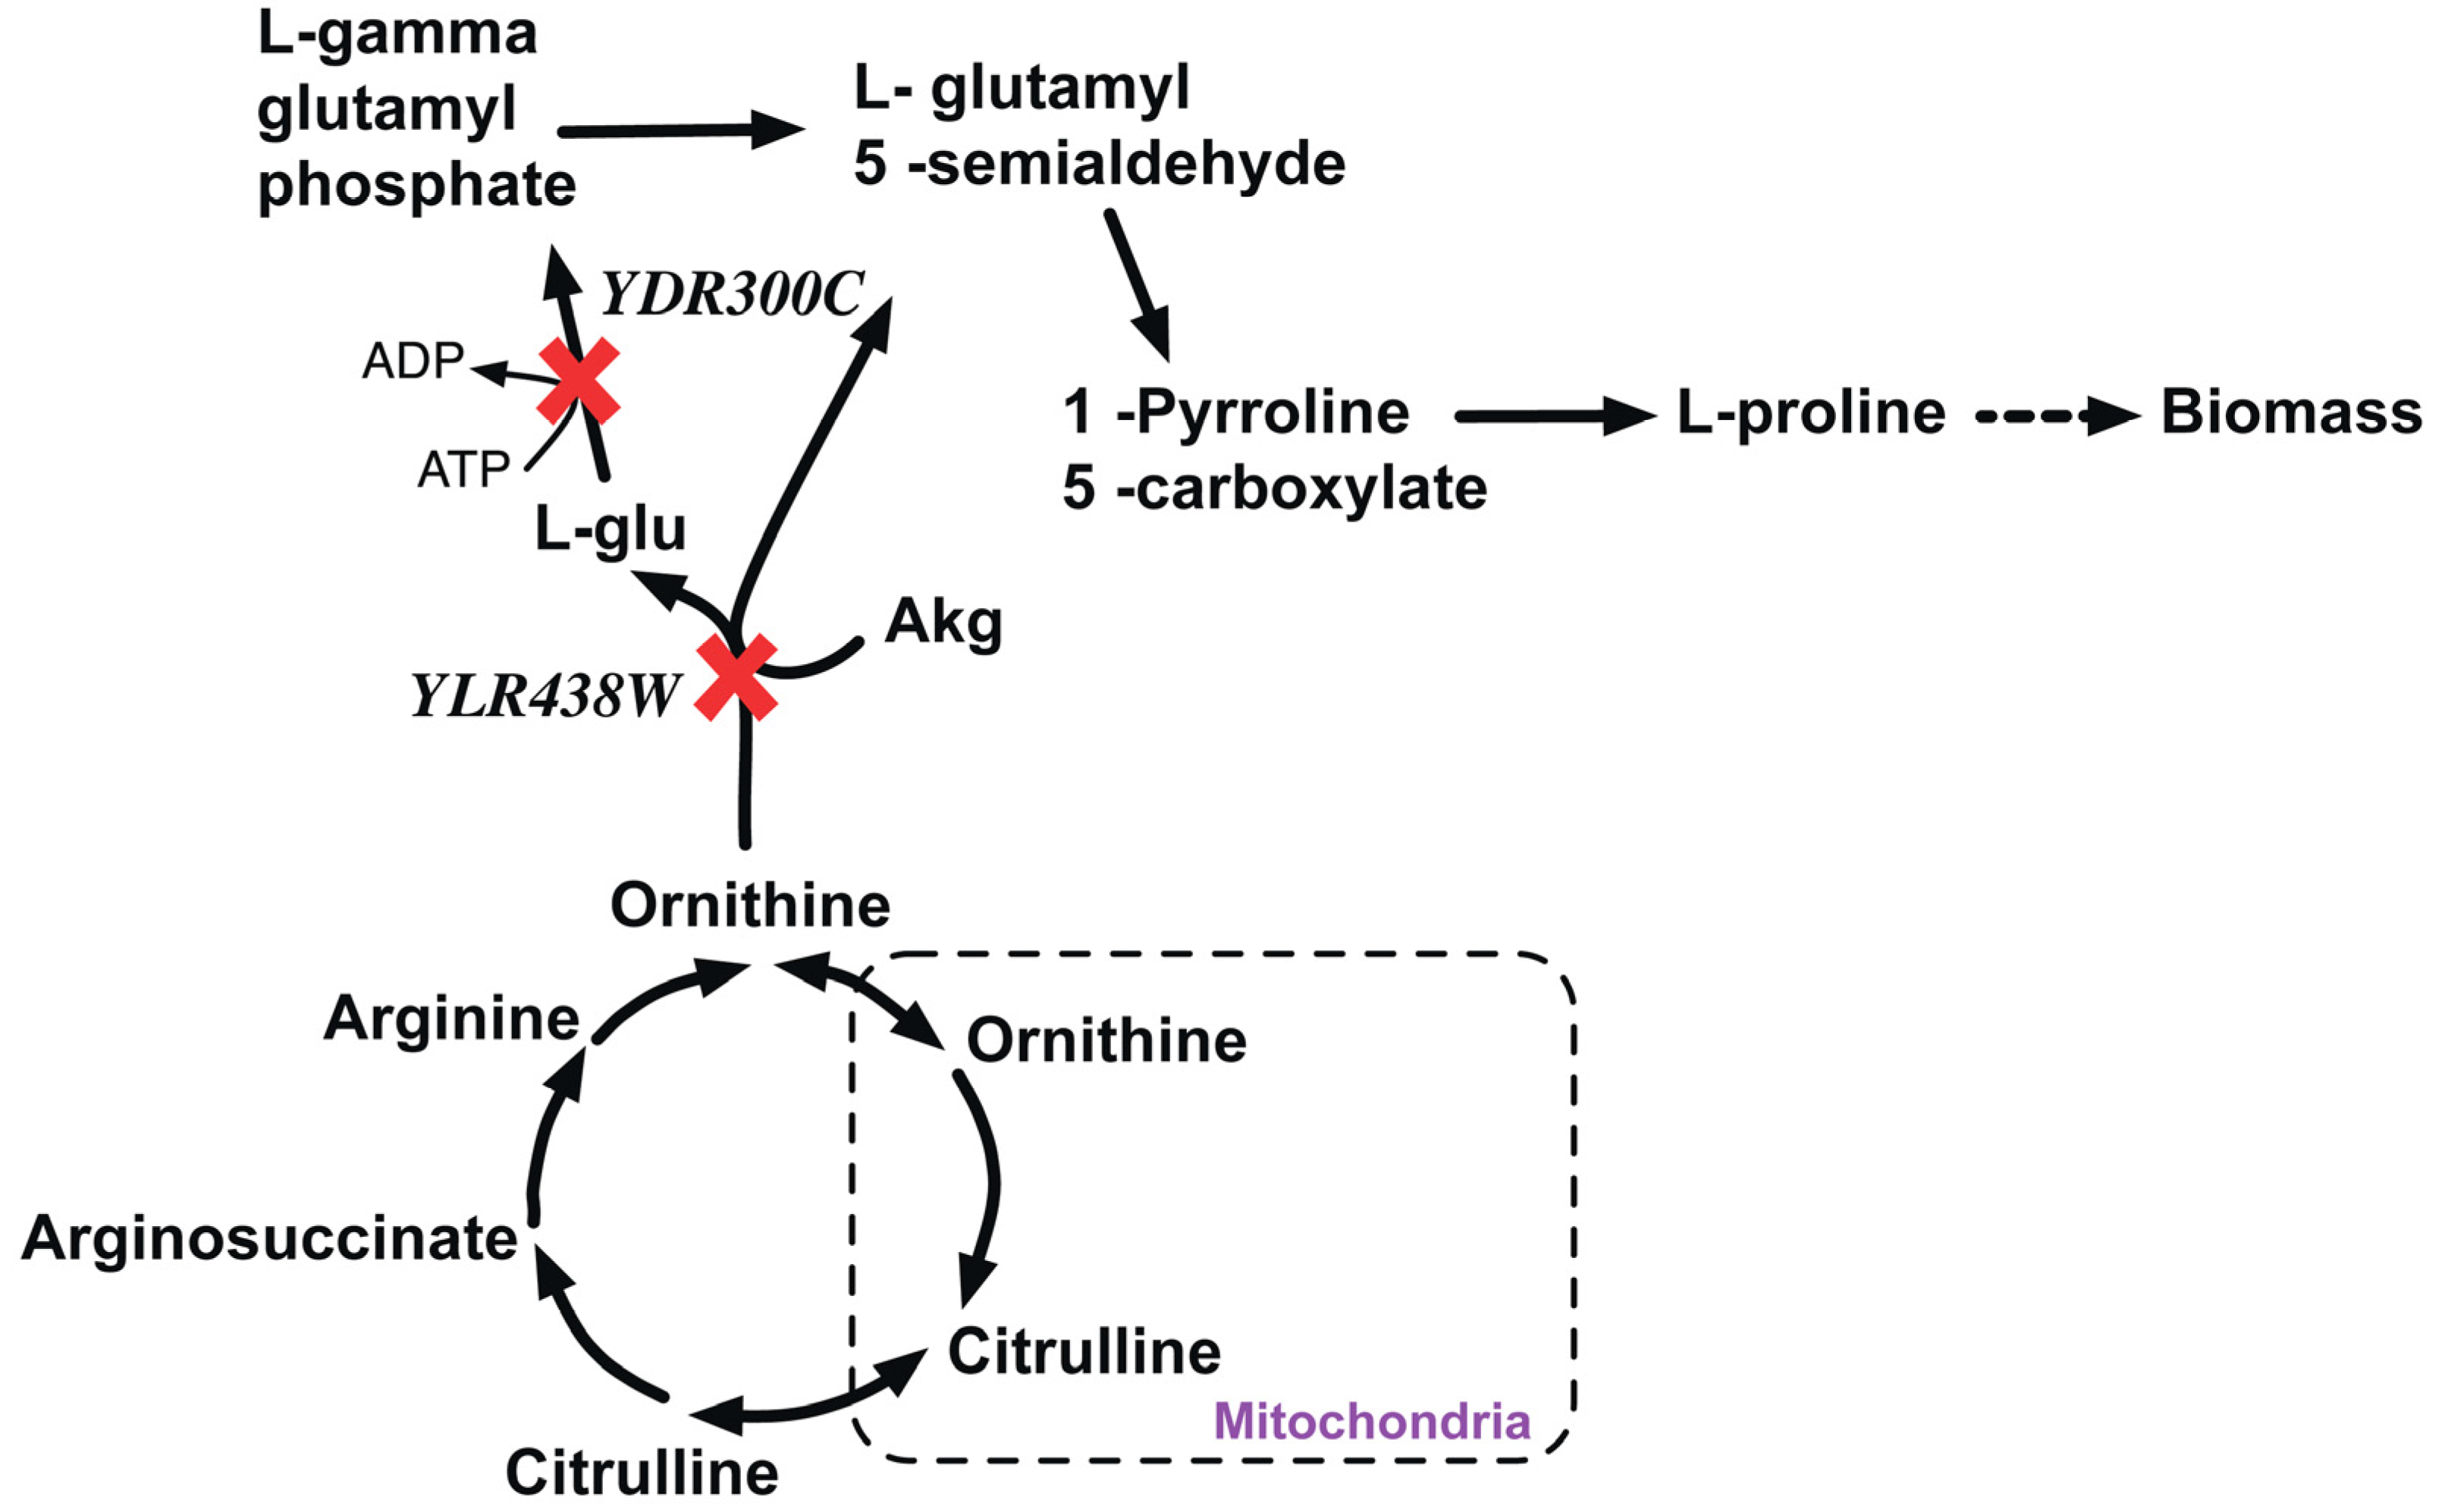
YDR300C (PRO1) is a gamma-gluatmyl kinase that initiates proline biosynthesis by catalyzing the conversion of cytosolic glutamate to L-gamma glutamyl-5-phosphate. In silico removal of PRO1 redirects the flux through the L-ornithine transaminase reaction to produce proline via L-glutamate 5-semialdehyde (LG5S) (see Figure 8). In silico removal of YLR438W (ΔCAR2) cannot catalyze the conversion of ornithine to LG5S. Therefore, the double deletion Δpro1Δcar1 strain cannot form LG5S and hence it is proline auxotrophic and thereby lethal.
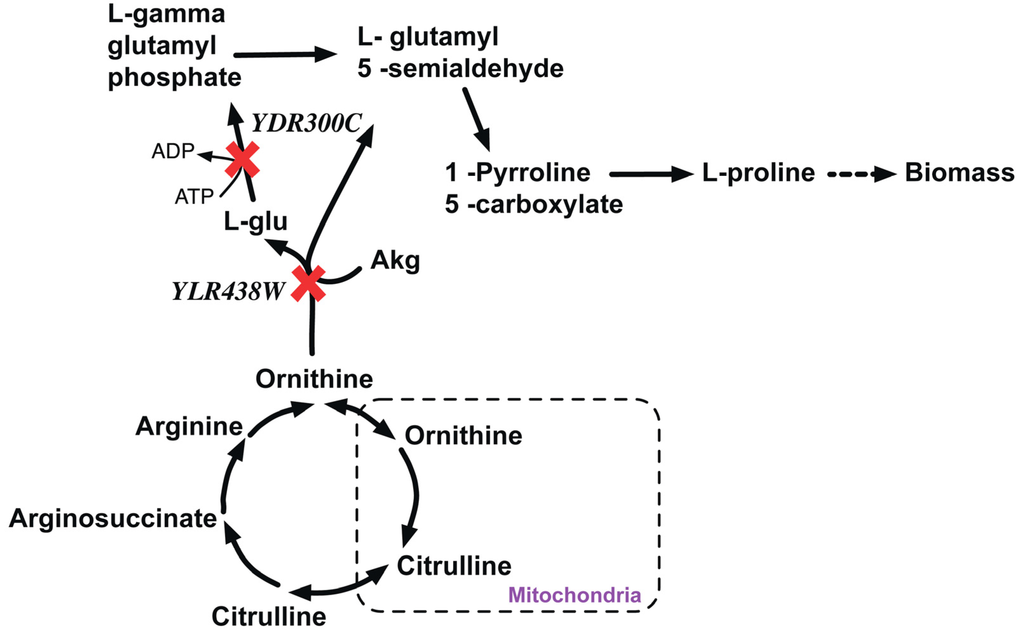
Figure 8.
Proline metabolism disrupted due lethal gene pair knockout. YDR300C and YLR438W are genes encoding the proteins to catalyze the alternate paths for the formation of L-Gamma glutamyl phosphate that synthesizes in L-Proline. Red crosses mark knocked out genes.
Figure 8.
Proline metabolism disrupted due lethal gene pair knockout. YDR300C and YLR438W are genes encoding the proteins to catalyze the alternate paths for the formation of L-Gamma glutamyl phosphate that synthesizes in L-Proline. Red crosses mark knocked out genes.
2.2.2. Leucine Auxotrophy (Δleu4Δleu9 Double Mutant)
Δleu4Δleu9 double mutant is devoid of α-isopropylmalate synthase (IPMS) activity leading to leucine auxotrophy. YNL104C (LEU4) encodes IPMS that catalyzes 2- isopropylmalate formation from 3-methyl 2-oxobutanoate essential in leucine biosynthesis. YOR108W (LEU9) is alpha-isopropylmalate synthase II and can carry out a residual α-IPMS activity in a ΔLEU4 strain. Existing in vivo studies [76] suggest the single deletions of LEU4 or LEU9 are non-essential which makes the double mutant a candidate for a synthetic lethal pair as suggested by the metabolic model.
2.2.3. Arginine and Valine Auxotrophy (Δctp1Δmae1 Double Mutant)
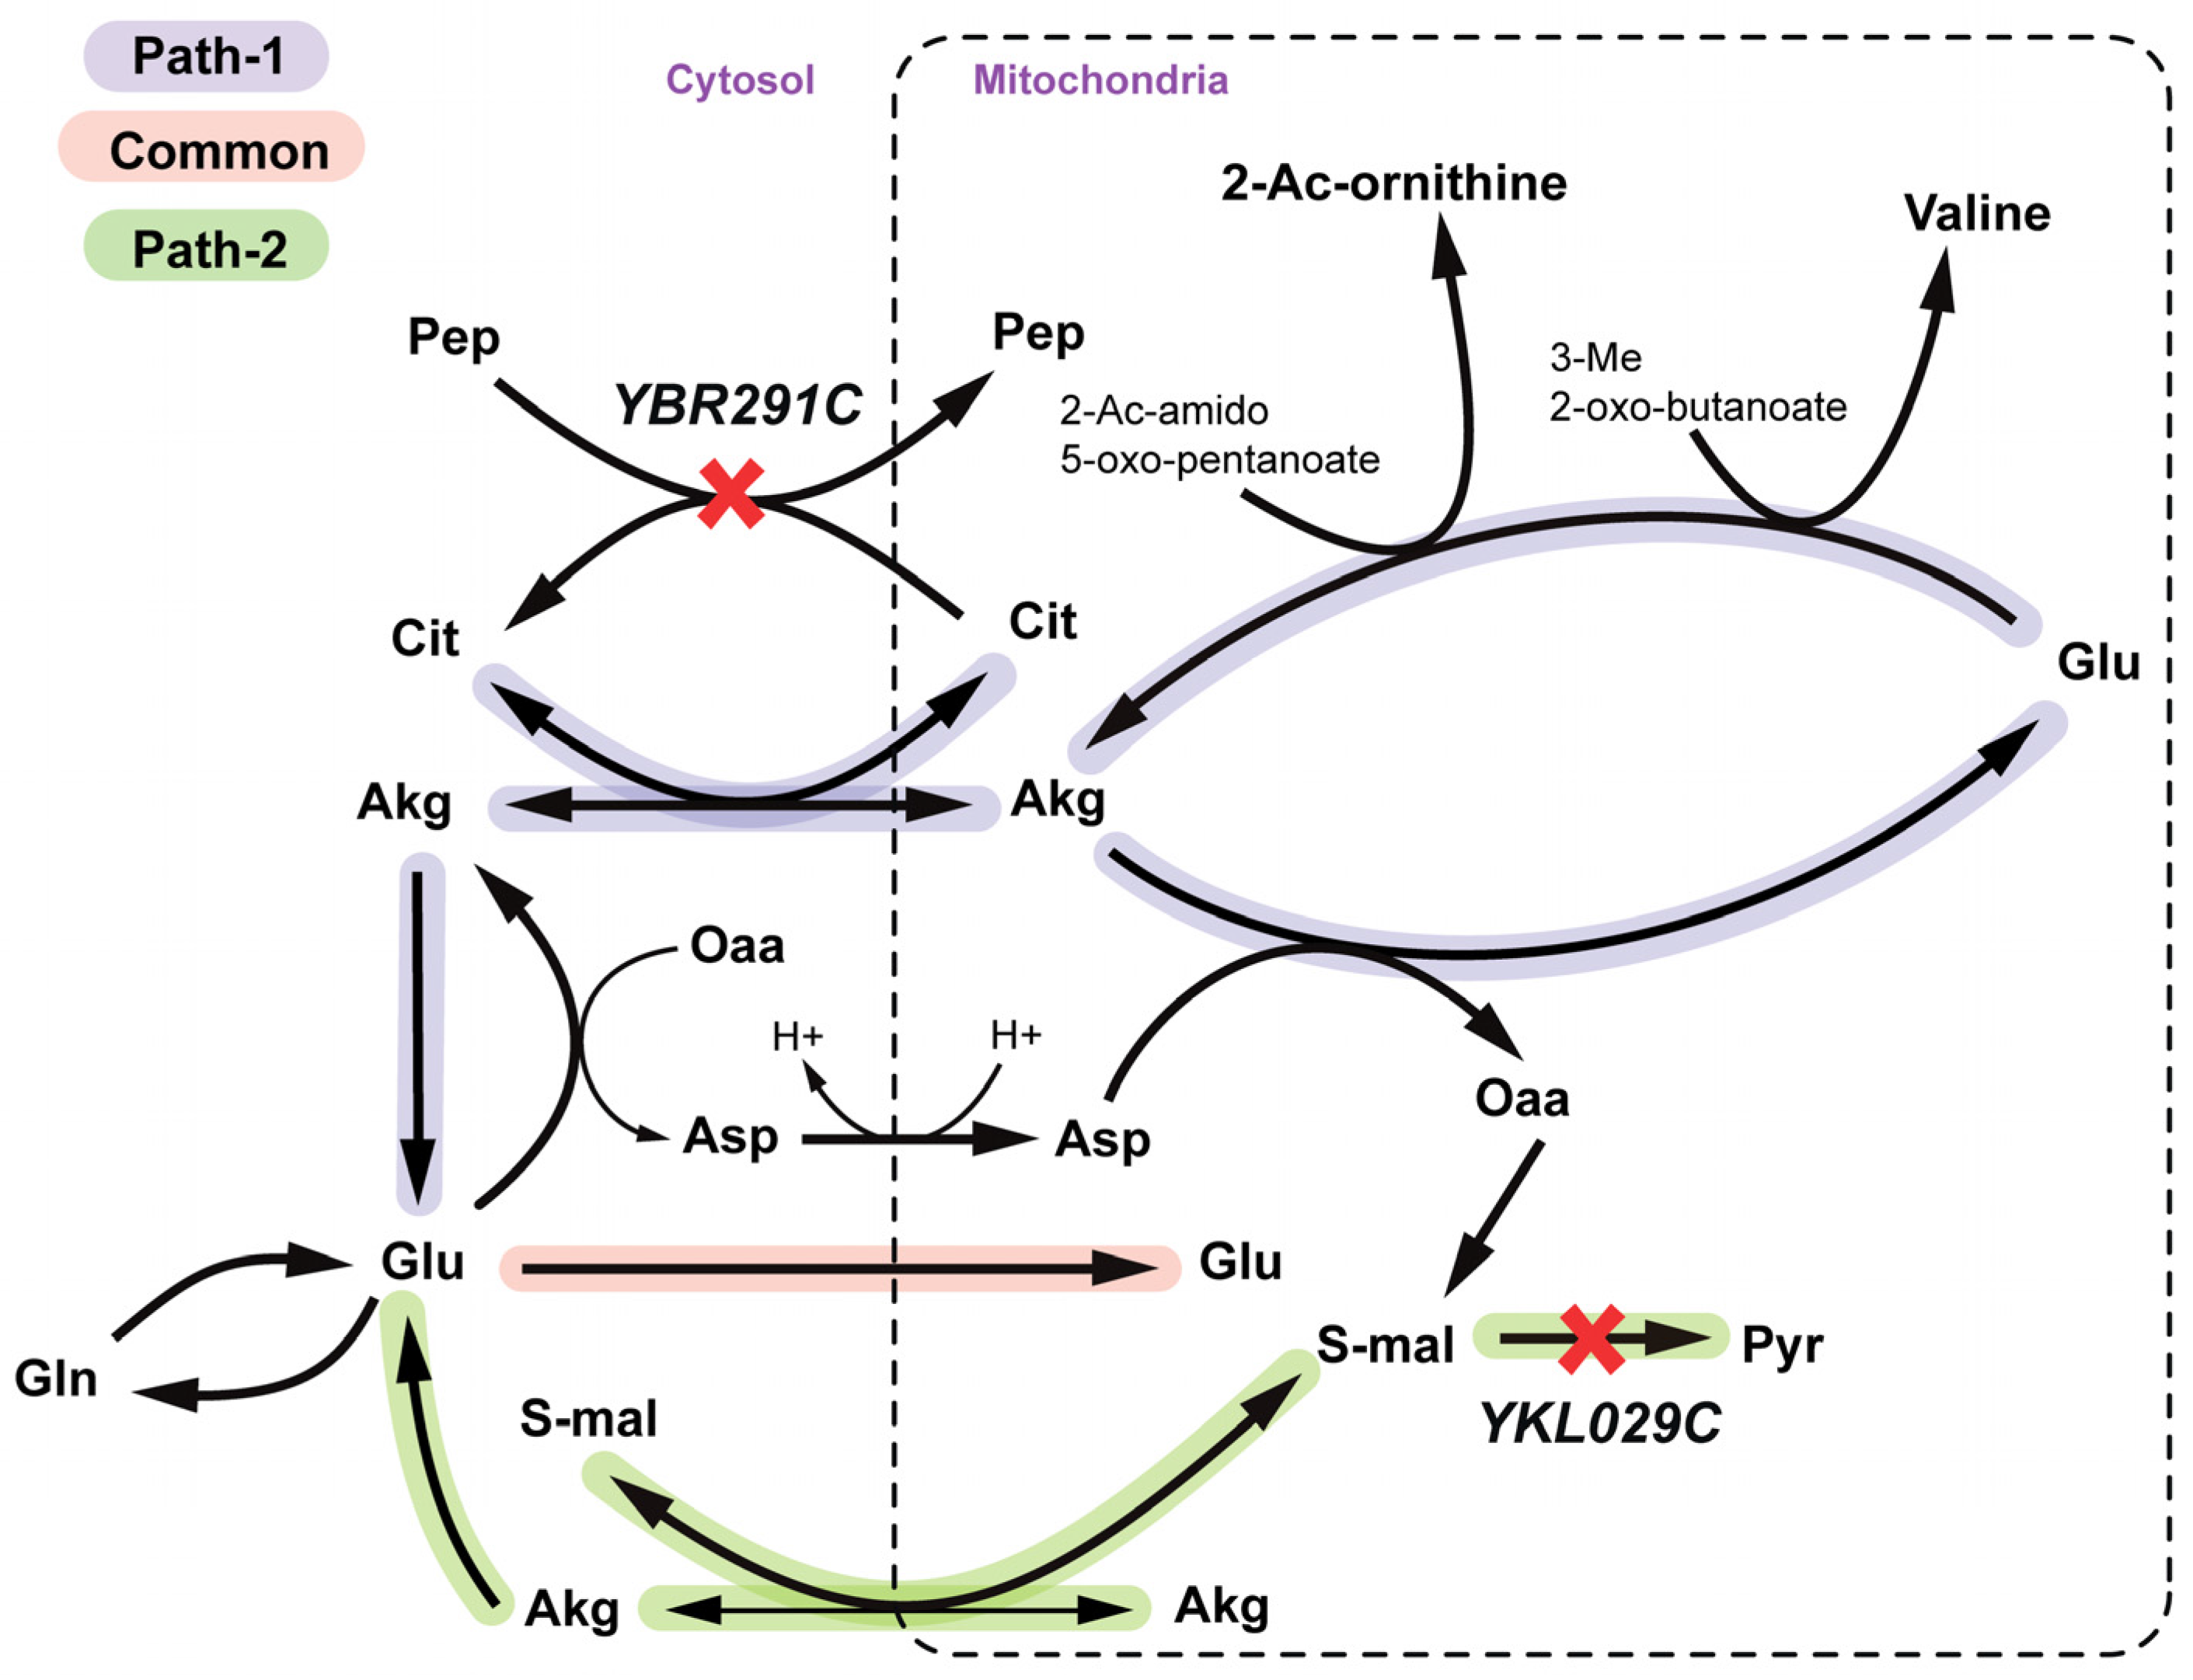
YBR291C (CTP1) encodes the citrate-Pep antiporter from peroxisome and mitochondria to cytosol. YKL029C (MAE1) codes for the mitochondrial malic enzyme, which catalyzes oxidative decarboxylation of cytosolic S-malate to pyruvate (see Figure 9). There exist two alternate ways of providing mitochondrial L-glutamate (see Figure 9) required for valine and arginine biosynthesis. Pathway 1 uses Akg-citrate antiport to translocate mitochondrial Akg to cytosol reversibly, which is coupled to ctp1 catalyzed citrate-pep antiport. Pathway 2 uses S-malate-Akg antiport to synthesize mitochondrial Akg which is prevented in a Δmae1 strain. A Δctp1Δmae1 double mutant is thus both cytosolic and mitochondrial-Akg auxotrophic and thereby is unable to synthesize mitochondrial L-glutamate.
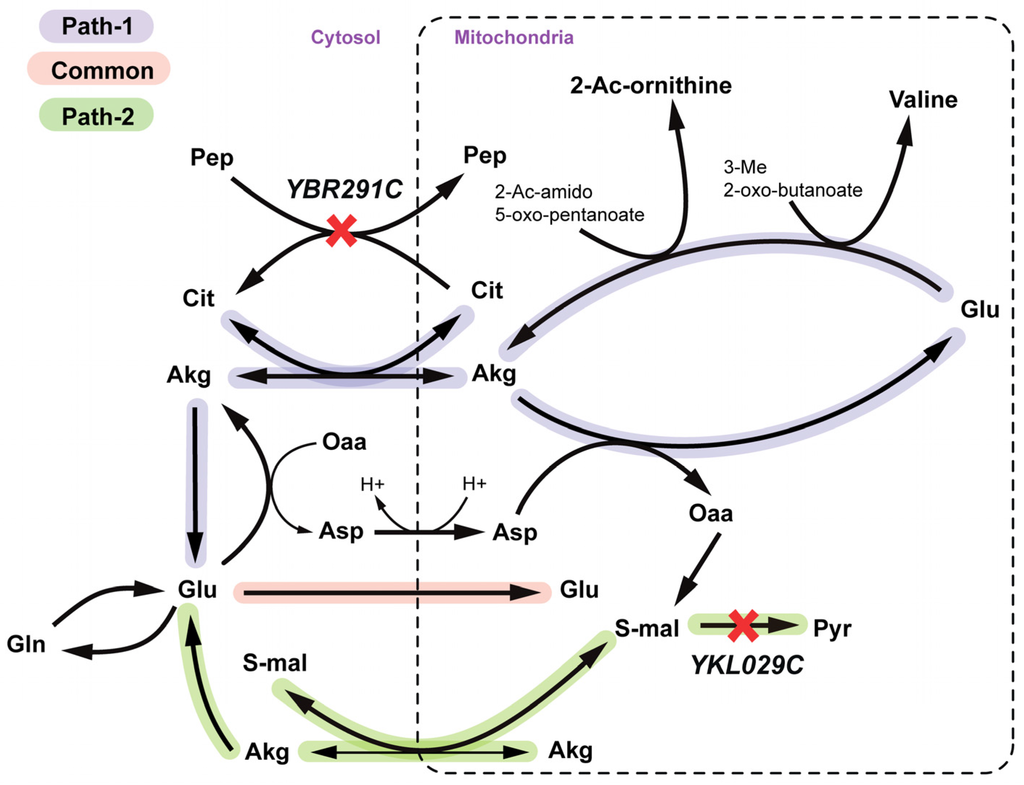
Figure 9.
Valine and Arginine auxotrophy due to simultaneous deletion of YBR291C and YKL029C gene. Paths 1 and 2 represent two alternate routes to regenerate mitochondrial glutamate and the yellow path shows the part that is common to both paths. Mitochondrial valine goes to valine biosynthesis and 2-acetyl ornithine goes to arginine production. SL gene pairs are marked with red crosses.
2.2.4. Disruption of Lipid Metabolism (Δitr1Δino1Δitr2 triple mutant)
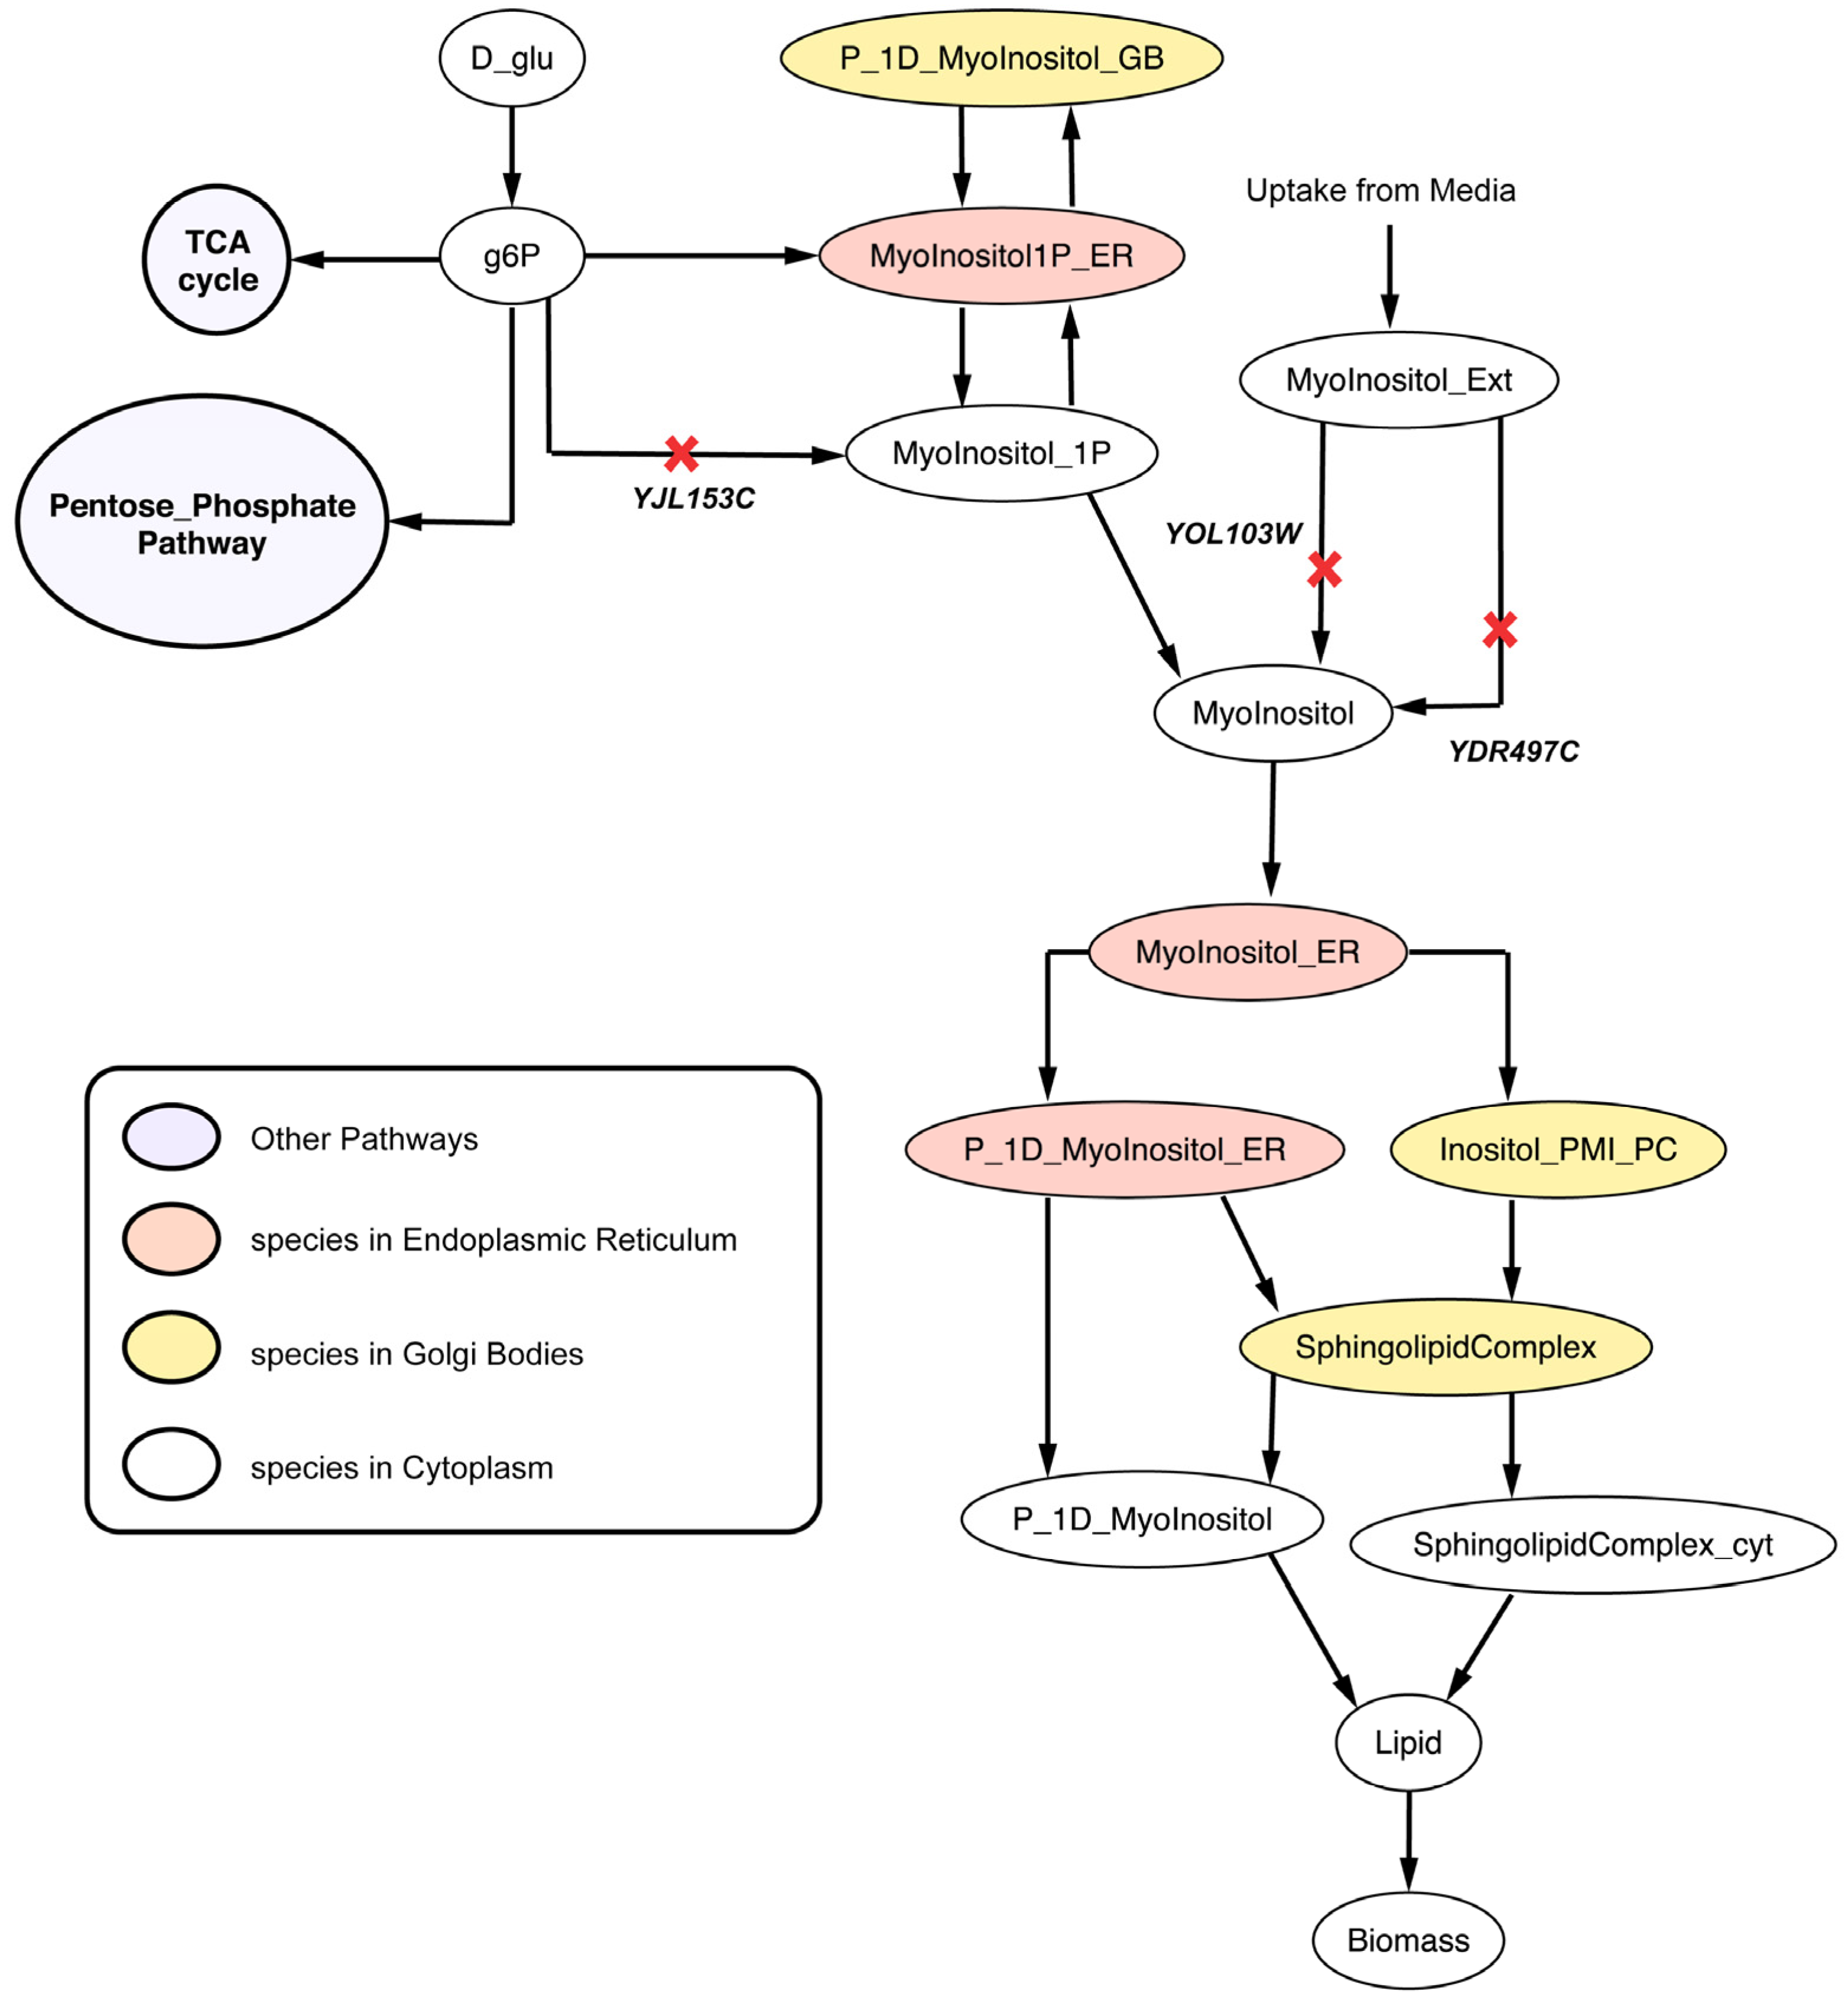
Lipid (a biomass precursor) is an intermediate metabolite formed by 15 precursor molecules in appropriate biological ratios in Yeast 7.11. The in silico ΔYDR497CΔYOL103W (Δitr1Δitr2) double deletion strain cannot uptake myo-inositol thereby showing decrease in vegetative growth in corroboration with in vivo studies [77]. ΔYJL153C (Δino1) cannot convert cytosolic glucose-6-phosphate to myo-inositol-1-phosphate conversion according to the model (see Figure 10). Therefore, the Δitr1Δino1Δitr2 triple mutant is found to be unable to form cytosolic myo-inositol and thus lipids. Single gene deletion studies [78,79] with inositol supplied in the media suggest that Δino1 is not lethal but minimal media [23] without inositol makes ino1 essential for viability. Note that in silico minimal media are supplemented with inositol (see Methods) in all calculations explaining why Δino1 is found to be non-essential in silico.
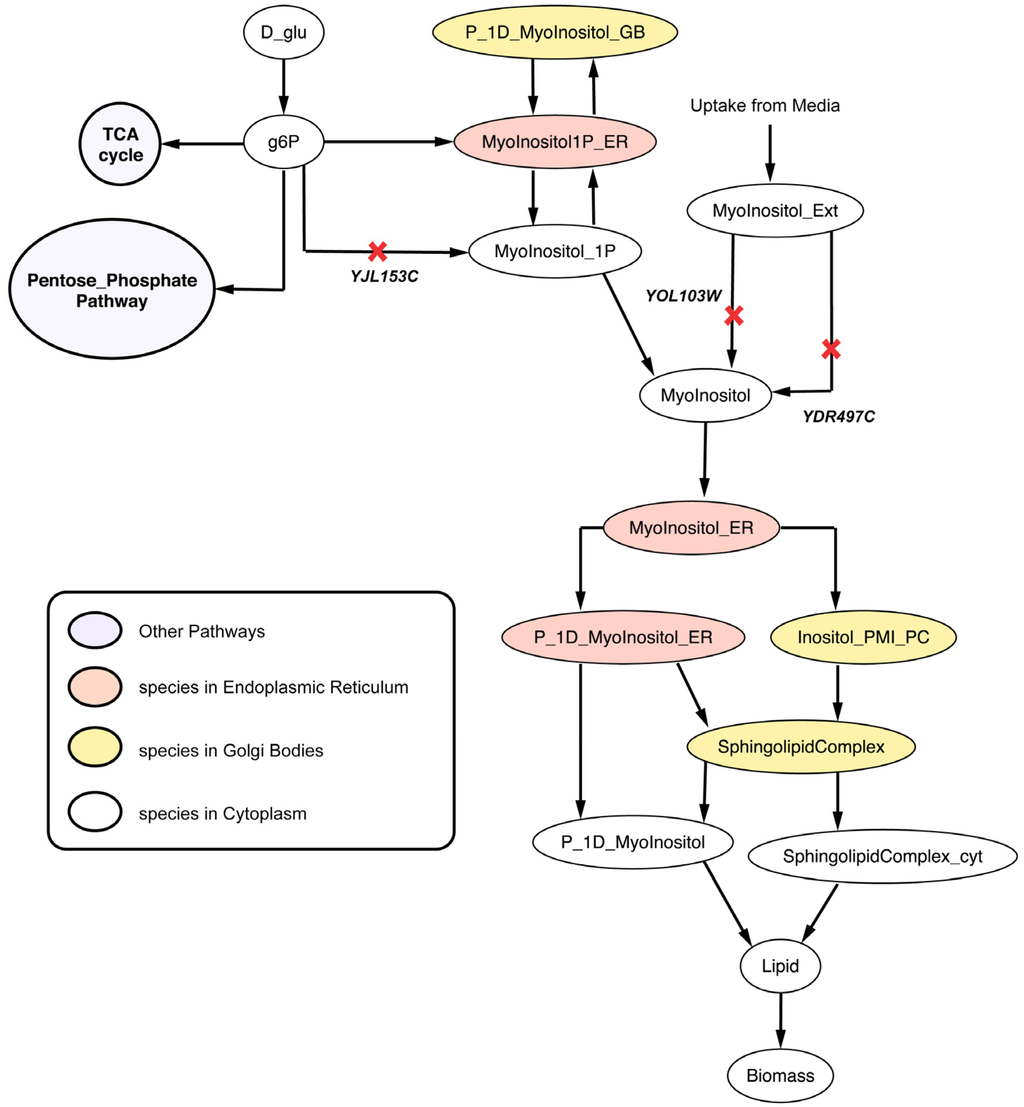
Figure 10.
Lipid metabolism disrupted due deletion of synthetic lethal gene triplet. YDR497C and YOL103W are isozymes coding for the protein catalyzing the myo-inositol transport into the cytosol from media. Reactions catalyzed by SL gene triplet are marked with red crosses.
Figure 10.
Lipid metabolism disrupted due deletion of synthetic lethal gene triplet. YDR497C and YOL103W are isozymes coding for the protein catalyzing the myo-inositol transport into the cytosol from media. Reactions catalyzed by SL gene triplet are marked with red crosses.
The essentiality and synthetic analysis for the well-curated Yeast 7.11 model revealed a number of opportunities for model improvement and predictions for non-intuitive synthetic lethals to be tested experimentally for providing additional backing for the model and/or ways to remedy shortcomings. Subsequently, we switch our attention to a CHO cell model with significantly fewer mutant growth phenotypes tested.
2.3. C. Griseus Model CHO 1.2 Curation and Suggestion of Gene Knockout Experiments
The absence of a comprehensive single-gene knockout database for Chinese Hamster Ovary (CHO) cells (unlike yeast) makes the assessment CHO 1.2 genome-scale model [80] more difficult. Therefore, we supplemented limited experimental data with predicted lethal gene deletions based on the most recent mouse model [20] and gene knockout studies in mouse embryonic stem cells [81] that exhibited high degree of sequence similarity (functionality of the encoded protein is at least 70% conserved across all mammalian systems [81]) with the CHO cell genome. Any inconsistencies between mouse and CHO cell lethality was used as an opportunity to correct the CHO model (see Supplemental File S6). Eight GPR modifications were proposed for CHO 1.2 in order to address and reconcile five ESG cases to GG, three GES cases to ESES, three SL2ES cases to ESES and one ESSL2 case to SL2SL2. In addition, we propose a number of gene deletion experiments to verify non-intuitive synthetic lethal gene combinations. Reaction level essentiality analysis in silico revealed 90 essential reactions (see Table 5). Utilizing the GPR associations for these reactions, 57 essential genes were identified (see Supplemental File S4: Table 5) for growth under aerobic minimal essential media (media information in Supplemental File S3). A comparative analysis with existing experimental data, model modifications and suggested gene-deletion experiments have been listed in Table 6 (for full version of Table 6 see Supplemental File S1: Table 3).

Table 5.
Chinese Hamster Ovary (CHO) 1.2 model statistics on ES and SL.
| Parameter | Count | |
|---|---|---|
| Essentiality information | Essential Reactions with GPRs | 82 |
| Essential Reactions without GPRs | 8 | |
| Essential genes | 57 | |
| Reaction level lethality | SL Pairs | 92 |
| SL Triplets | 57 | |
| SL Quadruplets | 3 | |
| Gene level lethality | SL Pairs | 43 |
| SL Triplets | 20 | |
| SL Quadruplets | 3 |

Table 6.
CHO 1.2 model essentiality and lethality comparisons with in vivo data and suggested gene deletion experiments.
| Gene Name | Comments | Modifications | Reference | ||
|---|---|---|---|---|---|
| Single Gene Deletion | in silico matches in vivo | ggypS1 | ΔggypS1 mouse embyonic stem cells are embryonic lethal in vivo. In silico mutant strain cannot synthesize cholesterol, hence inviable. Thus in vivo result matches in silico predictions. | [82] [83] | |
| GPR modifications to reconcile mismatch | gys1 | Δgys1 cannot produce glycogen in silico. However, in vivo studies show gys1- mutant is viable and forms SL2 with gys2. | GPR modified from: (gys1 and gys2) to (gys1 or gys2) gys1 and gys2 reconciled from ESG to GG gys1-gys2 reconciles from ESG to SL2SL2 | [84] | |
| acsL1, acsL3, acsL4 | ΔacsL4 in silico mutant is sphingomyelin auxotroph. However, in vivo data for mouse reveals that acsL4 deletion is viable. | r_0147 and r_0148 GPR was modified from acsL4 to (acsL1 or acsL3 or acsL4) r_0142 GPR was modified from acsL1 to (acsL1 or acsL3 or acsL4) r_0146 GPR was modified from acsL3 to (acsL1 or acsL3 or acsL4) acsL1, acsL3 and acsL4 were fixed from ESG to GG | [85] | ||
| Suggested experiment | qprT | ΔqprT mutant in silico causes auxotrophy of cofactors NAD+, NADH, NADP+ and NADPH. No experimental evidence of knockout data exists in CHO-K1 cell line. This serves as a potential non-intuitive essential gene. | NA | ||
| Double Gene Deletion | GPR modifications to reconcile mismatch | pgm1-pgm2 | Δpgm1Δpgm2 double mutant is lethal in silico causing glycogen auxotrophy. However, single gene mouse deletion shows Δpgm2 strain is inviable and there is more than 80% homology in mouse and CHO pgm2. Thierry-Mieg et al. shows that pgm2 is the major PGM isoform and is catalogued as MGI:97565. | GPR modification from pgm1 or pgm2 to pgm2 or (pgm1 and pgm2). pgm2 is fixed from GES to ESESSL2ES case is fixed to ESES | [86] [87] |
| pcyT1a-pcyT1b | ΔpcyT1aΔpcyT1b double mutant causes phosphatidylcholine and sphingomyelin auxotrophy in silico. However, in vivo studies reveal that pcyT1a deletion alone is seen to be lethal in mouse. | Changing GPR for phoshphate cytidyltransferase reaction (r_1023) from pcyT1a or pcyT1b to pcyT1a or (pcyT1a and pcyT1b) resolves SL2ES to ESES and GES to ESES with respect to pcyT1a. | [88] | ||
| Double Gene Deletion | GPR modifications to reconcile mismatch | chkA-cThkB | ΔchkA mouse strains have been shown to be embryonic lethal. However ΔchkB deletions have been non-lethal. | Changing GPR for choline-kinase reactions r_0359 and r_0360 from chkA or chkB to chkA or (chkA and chkB) resolved SL2ES to ESES and GES to ESES with respect to chkA | [89] |
| Suggested experiment | slc14a1-slc14a2 | Δslc14a1Δslc14a2 prevents spermidine and putrescine synthesis in silico. But there are no experimental evidence so it goes as a suggestion. | NA |
2.3.1. Suggested GPR Modifications to Reconcile Model Inconsistencies
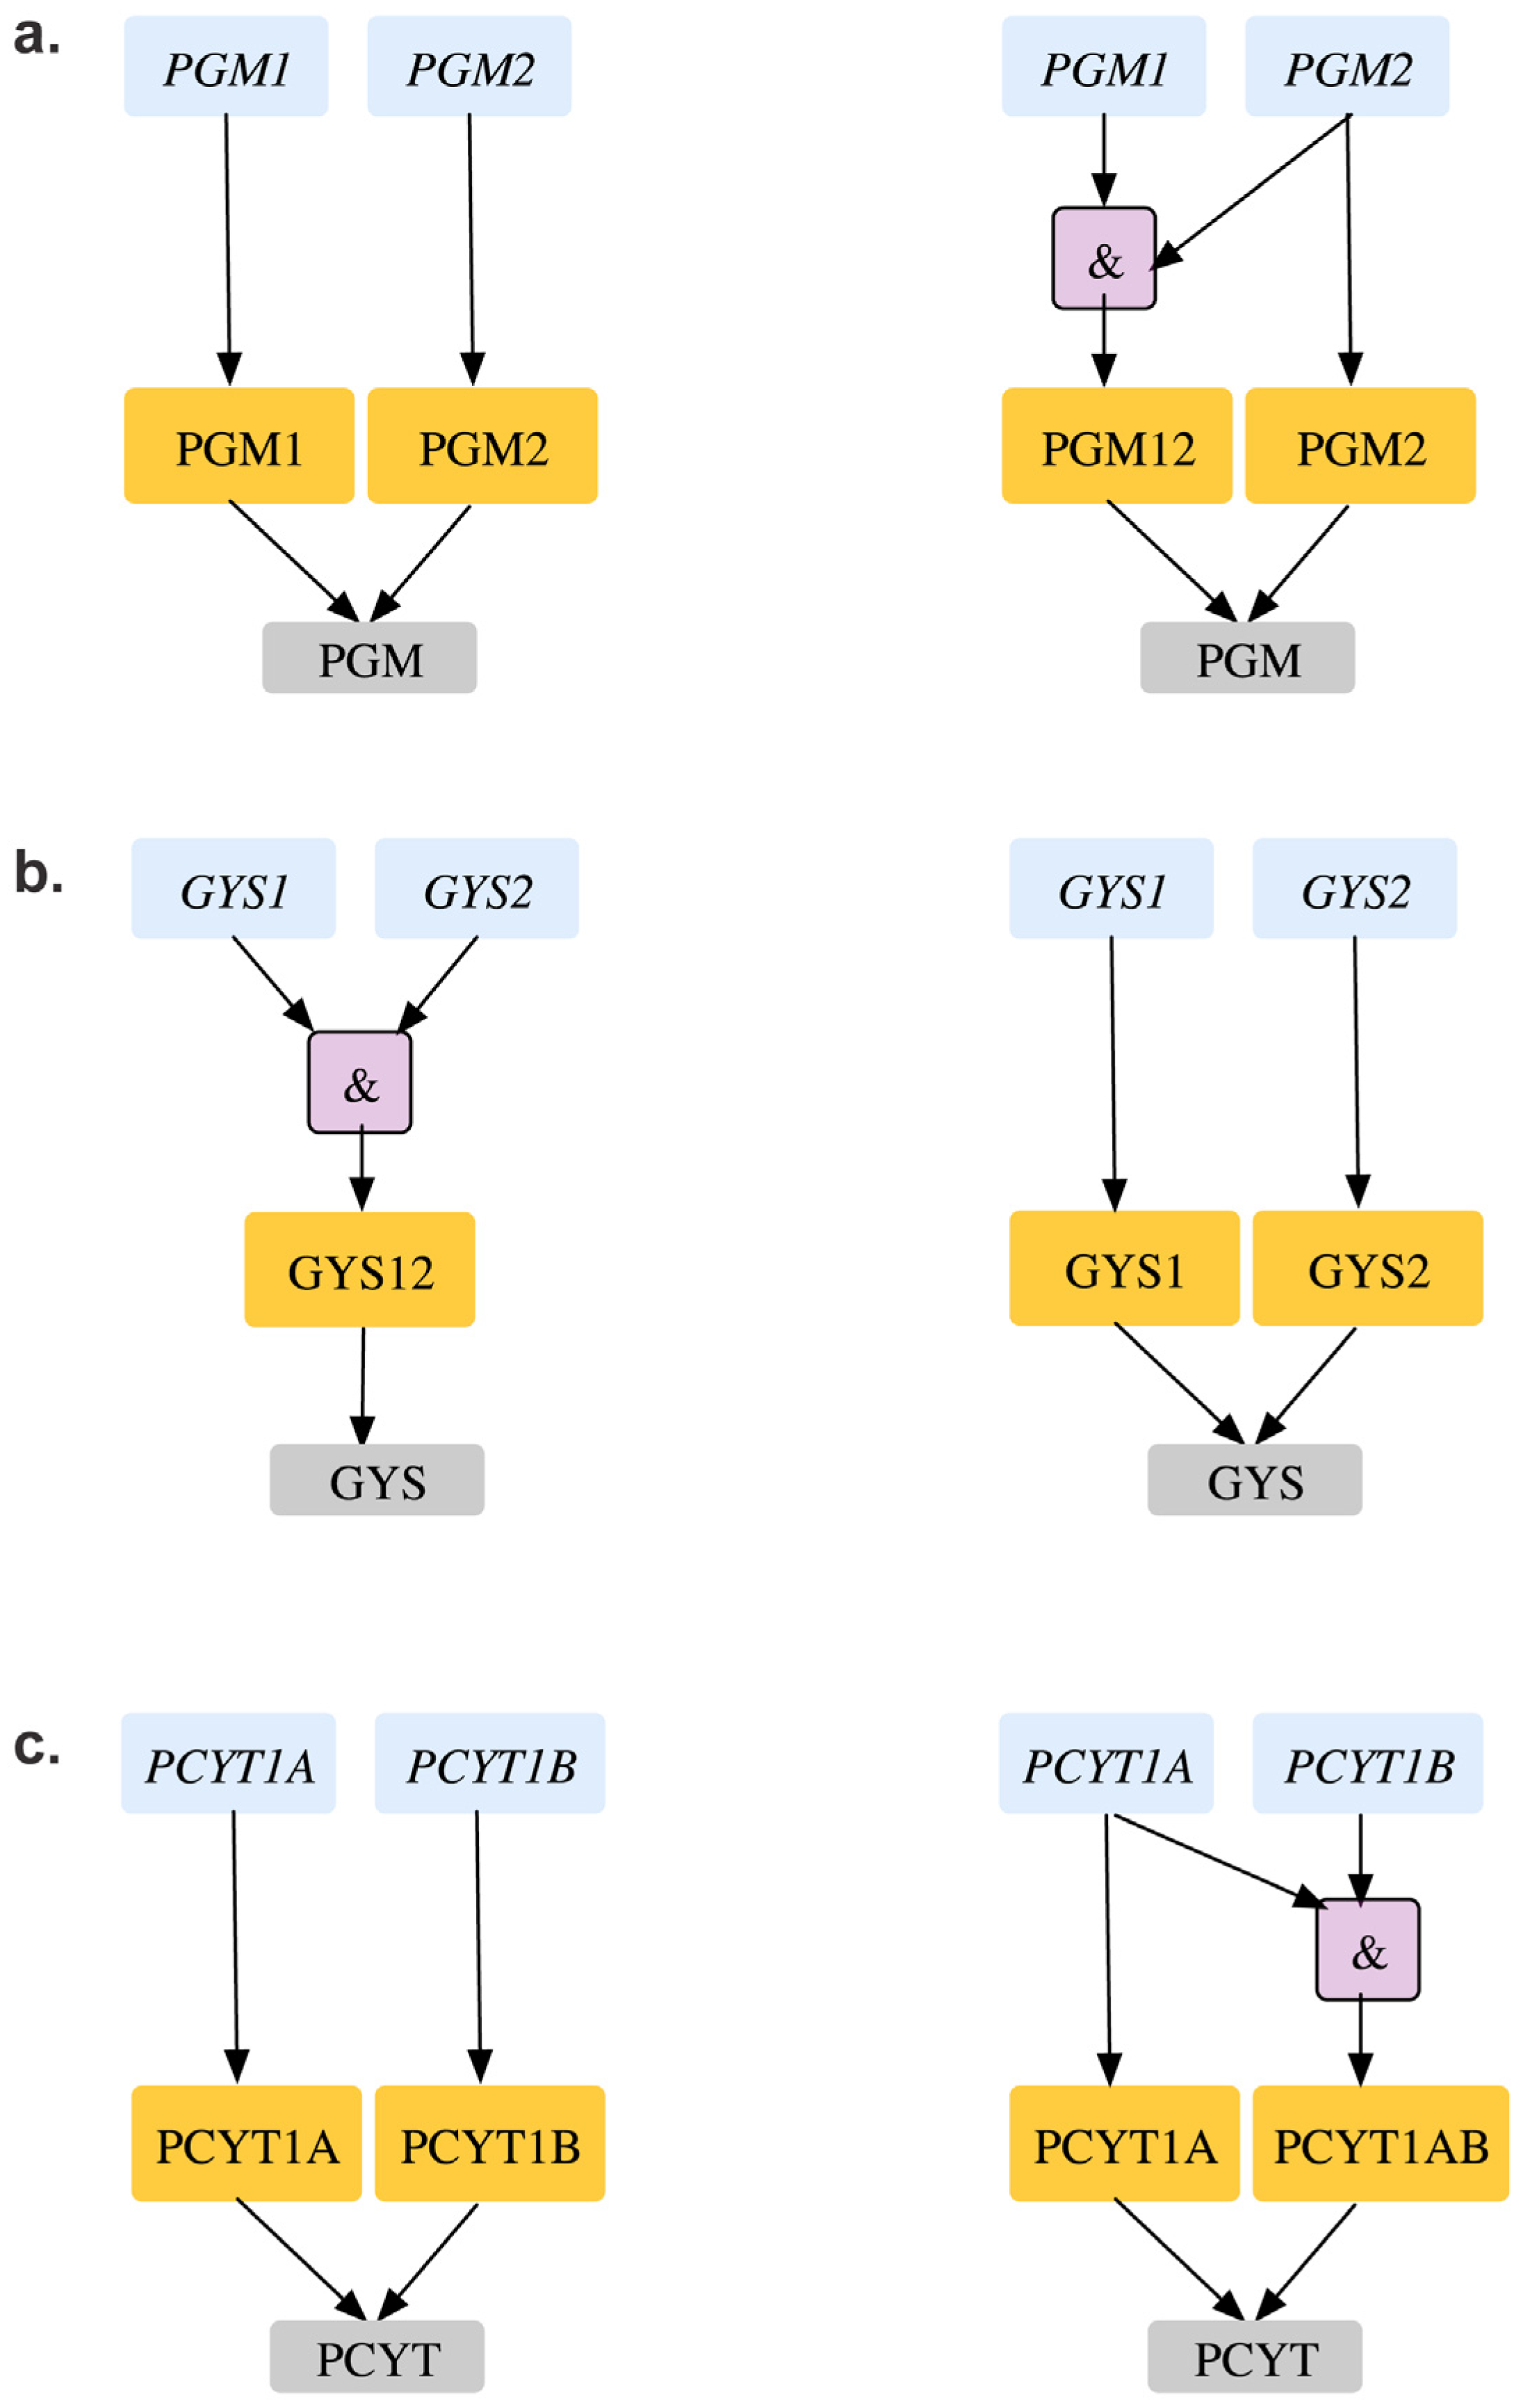
Table 3 of Supplemental File S1 shows all eight GPR modifications in the CHO 1.2 model are based on in vivo gene deletion experiments [90] in CHO-K1 cell lines and embryonic stem cells of mouse [81]. For example, removal of glycogen synthase (GYS) reaction is lethal in silico as it blocks the pathway for synthesizing biomass precursor glycogen. The existing GPR (gys1 and gys2) suggests that deletion of either of the genes encoding the protein would be lethal in silico at the gene level. However, experiments on CHO K1 cell lines show that single deletion of these genes are not lethal in vivo. Furthermore, in vivo deletion experiments in related organisms with a conserved glycogen synthase activity (such as S. cerevisiae [54]) show that Δgys1Δgys2 double deletion is lethal. As a result, the existing GPR was changed from (gys1 and gys2) to (gys1 or gys2) to reconcile two ESG and two ESSL2 inconsistencies to GG and SL2SL2 respectively (see Figure 11(a)). Unlike the previous inconsistency, we find a contrary case for pgm2 mutant. The existing CHO 1.2 model suggests that either of pgm1 or pgm2 can encode for the in silico essential phosphoglucomutase (PGM) reaction required to synthesize biomass precursor glycogen (see Figure 11(b)). However, single gene deletion experiments in mice embryonic stem cells [91] show that deletion of pgm1 is non-lethal as an active pgm2 can compensate for loss of functional activity of pgm1. Deletion of pgm2, on the other hand is lethal, thus indicating that pgm2 is the major isoform primarily responsible for PGM activity. As a result, the current GPR for PGM was accordingly changed from pgm1 or pgm2 to pgm2 or (pgm1 and pgm2) that reconciles not only GES for pgm2 to ESES but also SL2ES for pgm1-pgm2 to ESES.
Similar to the pgm2 case deletion of pcyT1a results in a GES inconsistency. Either of pcyT1a or pcyT1b can encode for the in silico essential choline phosphate cytidylyltransferase (CPCT) reaction. Removal of CPCT blocks the production of phosphatidylcholine and sphingomyelin, which are biomass precursors, thus making the two genes a synthetic lethal pair. However, in vivo single gene deletion studies in embryonic stem cells [88] show that while ΔpcyT1a is lethal, ΔpcyT1b mutant strains are viable. This observation suggests that pcyT1a is sufficient to encode for CPCT activity, while pcyT1b is a minor isoform. The GPR for CPCT was modified accordingly to pcyT1a or (pcyT1a and pcyT1b) to resolve pcyT1a GES to ESES and pcyT1a-pcyT1b SL2ES to ESES (see Figure 11c).
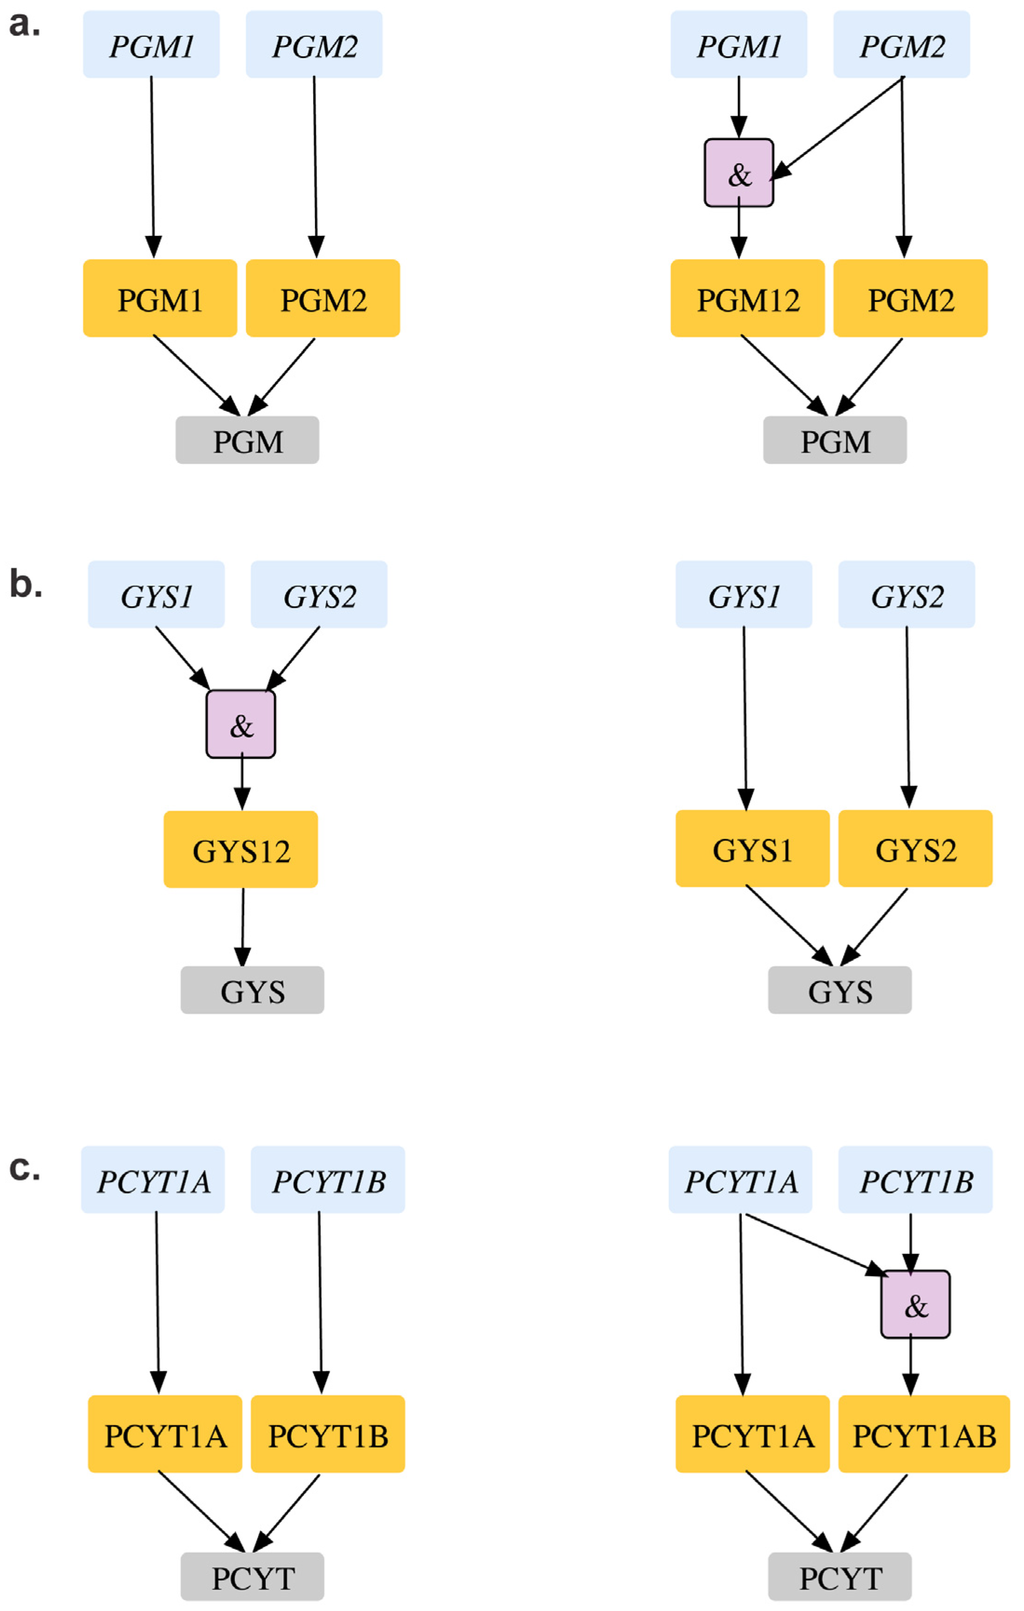
Figure 11.
GPR modifications in CHO 1.2 model. (a). Reconciling gys1 and gys2 from essential genes to an SL2 (b). Shows how pgm2 can be identified as an essential gene (c). Shows how pcyT1a can be identified as an essential gene. Old GPR is shown on the left and new GPR on the right.
Figure 11.
GPR modifications in CHO 1.2 model. (a). Reconciling gys1 and gys2 from essential genes to an SL2 (b). Shows how pgm2 can be identified as an essential gene (c). Shows how pcyT1a can be identified as an essential gene. Old GPR is shown on the left and new GPR on the right.
2.3.2. Suggested Single and Double Gene Deletion Experiments
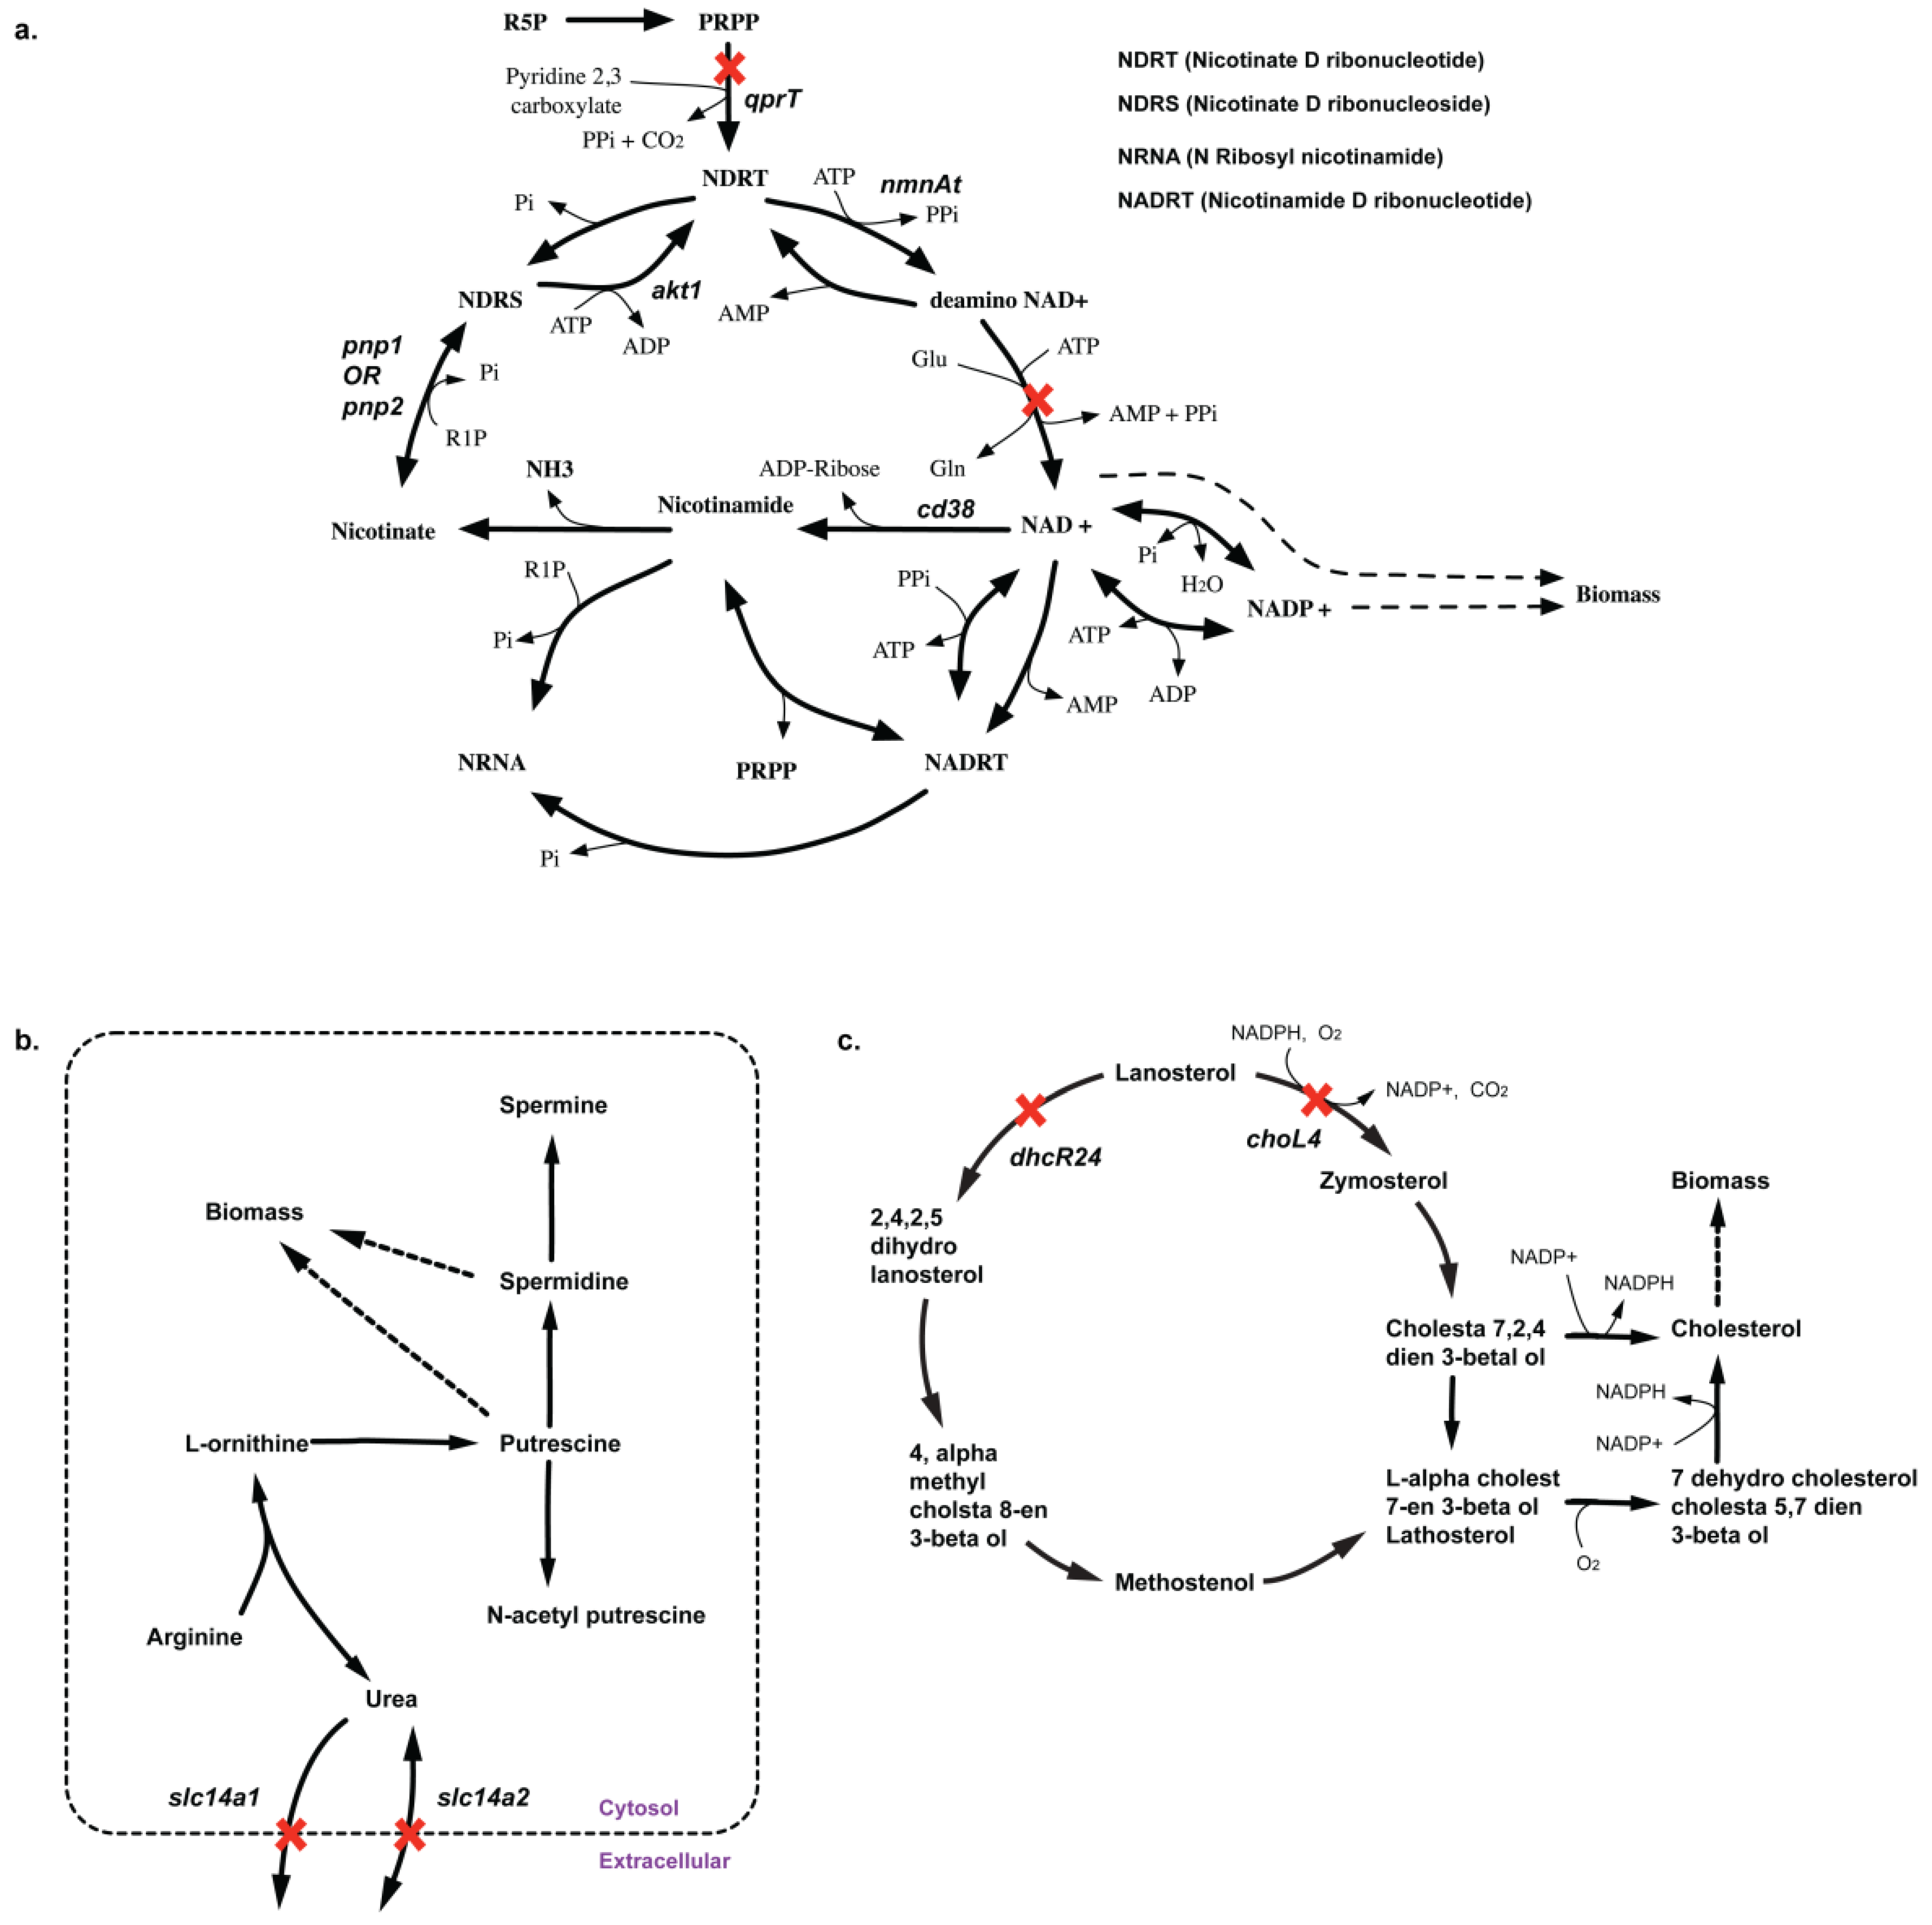
Due to lack of sufficient experimental gene deletion data either in CHO or mouse embryonic stem cells, we have limited resources of confirming most of our in silico essential and synthetic lethal solutions. However, these identified sets could provide a blueprint for prioritizing future deletion experiments both for model curation as well as constructing high yielding phenotypes. In all, we identified 48 lethal reaction pairs and 44 SL gene pairs (see Supplemental File S4: Table 6) for CHO 1.2. Among these, we listed 10 non-intuitive combinations (see Supplemental File S1: Table 3) of gene deletions that can help improve the performance of the future CHO model reconstructions. For example, in silico deletion of qprT, encoding for quinolate phosphoribosyltransferase (QPRT) activity in NAD biosynthesis pathway, blocks the synthesis of biomass precursors NAD+, NADH, NADP+, and NADPH. Removal of QPRT prevents any fresh supply of nicotinate D-ribonucleotide (NDRT) to the nicotinamide regeneration cycle (see Figure 12(a)), thereby preventing any of the intermediate metabolite flux in the cycle (e.g., NAD+) to be diverted towards other pathways such as NADPH and biomass formation. The cycle functions as a futile cycle dissipating ATP. Production of all nicotinatmide-related cofactors (i.e., NAD+, NADH, NADP+ and NADPH) are impaired resulting in zero biomass formation. Note that deletion of any of the genes (or gene pairs) encoding for the reactions in the nicotinamide regeration cycle (i.e., kynU, nmnAt and nadS) are in silico essential (pnp1 and pnp2 form a lethal pair) for directly impairing activity of the cycle.
Another suggestion involves synthetic lethality caused by in silico removal of slc14a1 and slc14a2 genes. These genes encode for transporter proteins for urea whose removal prevents the export of urea from cytosol out of the cell. As there are no other pathways in the current CHO model to consume urea, deletion of urea export reactions prevents the activity of the urea cycle where it is synthesized. As a result, the model cannot synthesize intermediate metabolite ornithine required for the production of biomass precursor putrescine (see Figure 12(b)). The deletion of these genes can confirm if urea production is coupled with biomass or there are additional pathways of urea metabolism (or alternate pathways for ornithine and putrescine production) missing in the current reconstruction.
2.3.3. SL2U Case ΔdhcR24ΔchoL4
Similarly, in silico removal of both dhcR24 and choL4 cause complete loss of sterol delta-reductase (DSR) activity (see Figure 12(c)). Removal of DSR activity shuts off the cholesterol biosynthesis pathways in silico. Cholesterol is a biomass precursor, so DSR deletion in silico is causal to lethality. Deletion of choL4 prevents zymosterol from being converted to dehydrocholesterol-cholesta 5, 7-dien 3-betaol (DC57D3B) (see Figure 12(c)) and ultimately to cholesterol in a cascade of four steps. However, cytosolic zymosterol can still be converted to ebp-encoded (emopamil binding protein- EBP) reaction forming N-cholesta 7, 2, 4-dien 3-betaol (NC724D3B) (see Figure 12(c)), which is subsequently converted to cholesterol. We note that EBP activity is common to both the routes (see Figure 12c), which makes ebp an essential gene for in silico cholesterol biosynthesis and subsequently biomass.
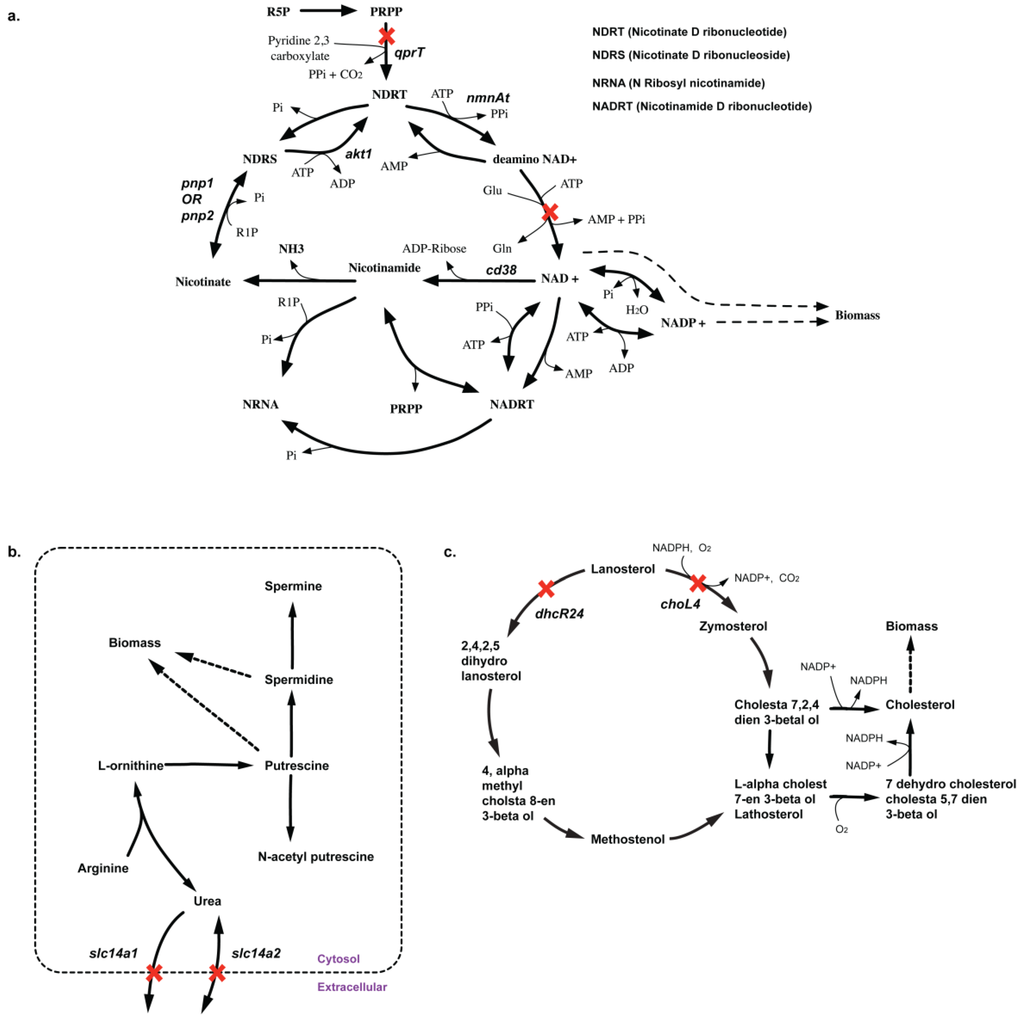
Figure 12.
Pathways showing how biomass precursor(s) formation is blocked upon deletion of lethal gene(s). (a) Shows why qprT gene is essential for NAD-biosynthesis (b) Shows how deletion of slc14a1 and slc14a2 prevents synthesis of spermidine and putrescine (c) Shows how deletion of dhcR24 and choL4 prevents cholesterol biosynthesis.
In addition to manual inspection of in silico synthetic lethal suggestions for non-intuitive examples, we performed a node centrality analysis synthetic lethal landscape for CHO 1.2 (see Figure 13). Node centrality analysis is an important tool of querying complex networks (such as gene-association networks) to identify key nodes that have the maximal influence on the topology of the network [92]. In our case, we constructed the network of synthetic lethal gene pairs (see Figure 13) and ranked the genes based on the number of lethal pairs they were associated with. The graph shows that pc3, encoding for diacylglycerol choline phosphotransferase (DCP) activity in phosphatidyl choline (PTC) pathway, is associated with a maximum number of eight synthetic lethal gene pairs (see Figure 13). For example, pc3 forms a lethal pair with pc4 encoding for methylene-fatty-acyl-phospholipid synthase (MPS) reaction. In silico simultaneous gene deletion of pc3 and pc4 prevents synthesis of biomass precursor PTC synthesis (see Figure 14). Similarly, impA2 is associated with four in silico SL2 (See Figure 13). One such case is lethality due to deletion of impA2 and ugtLa2 genes, which prevents the synthesis of biomass precursor phosphatidyl myoinositol. Note that the results of node centrality analysis (see Supplemental File S4: Table 8) can be utilized to prioritize the construction of mutant strains. For example, while Δpc3 strain can be utilized to verify in silico-in vivo consistency for eight synthetic lethal pairs, ΔpbeF1 strain can be used to verify just a single case (pbeF1-prpS2).
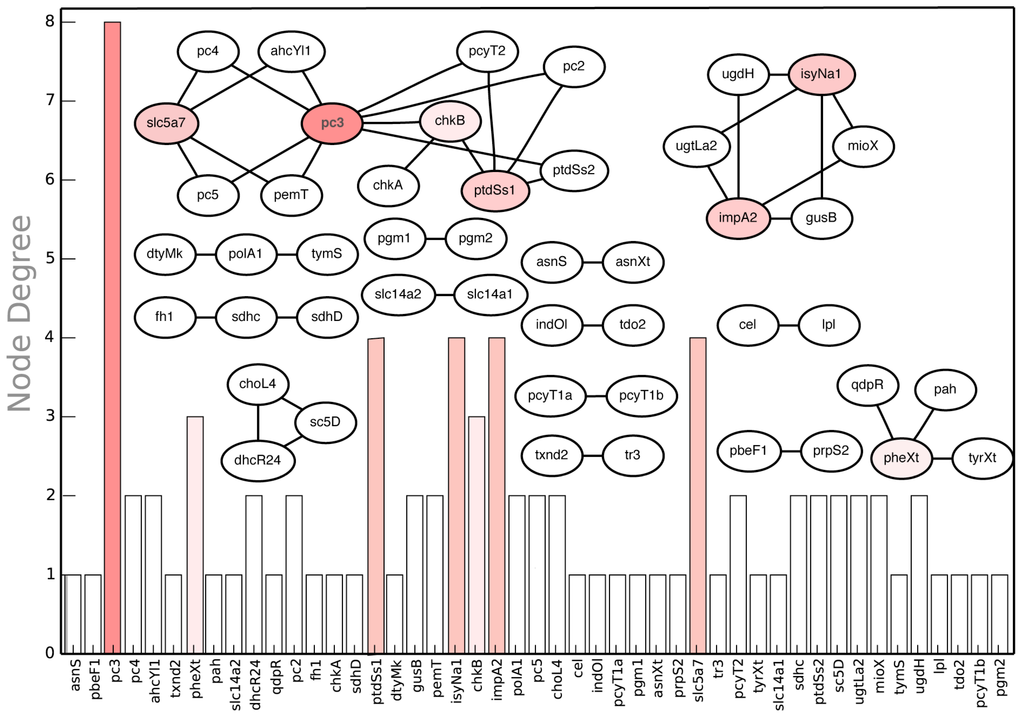
Figure 13.
In silico SL2 landscape. It shows the synthetic lethal gene pair interactions present in the CHO 1.2 model along with the respective node degrees of each gene.
Figure 13.
In silico SL2 landscape. It shows the synthetic lethal gene pair interactions present in the CHO 1.2 model along with the respective node degrees of each gene.
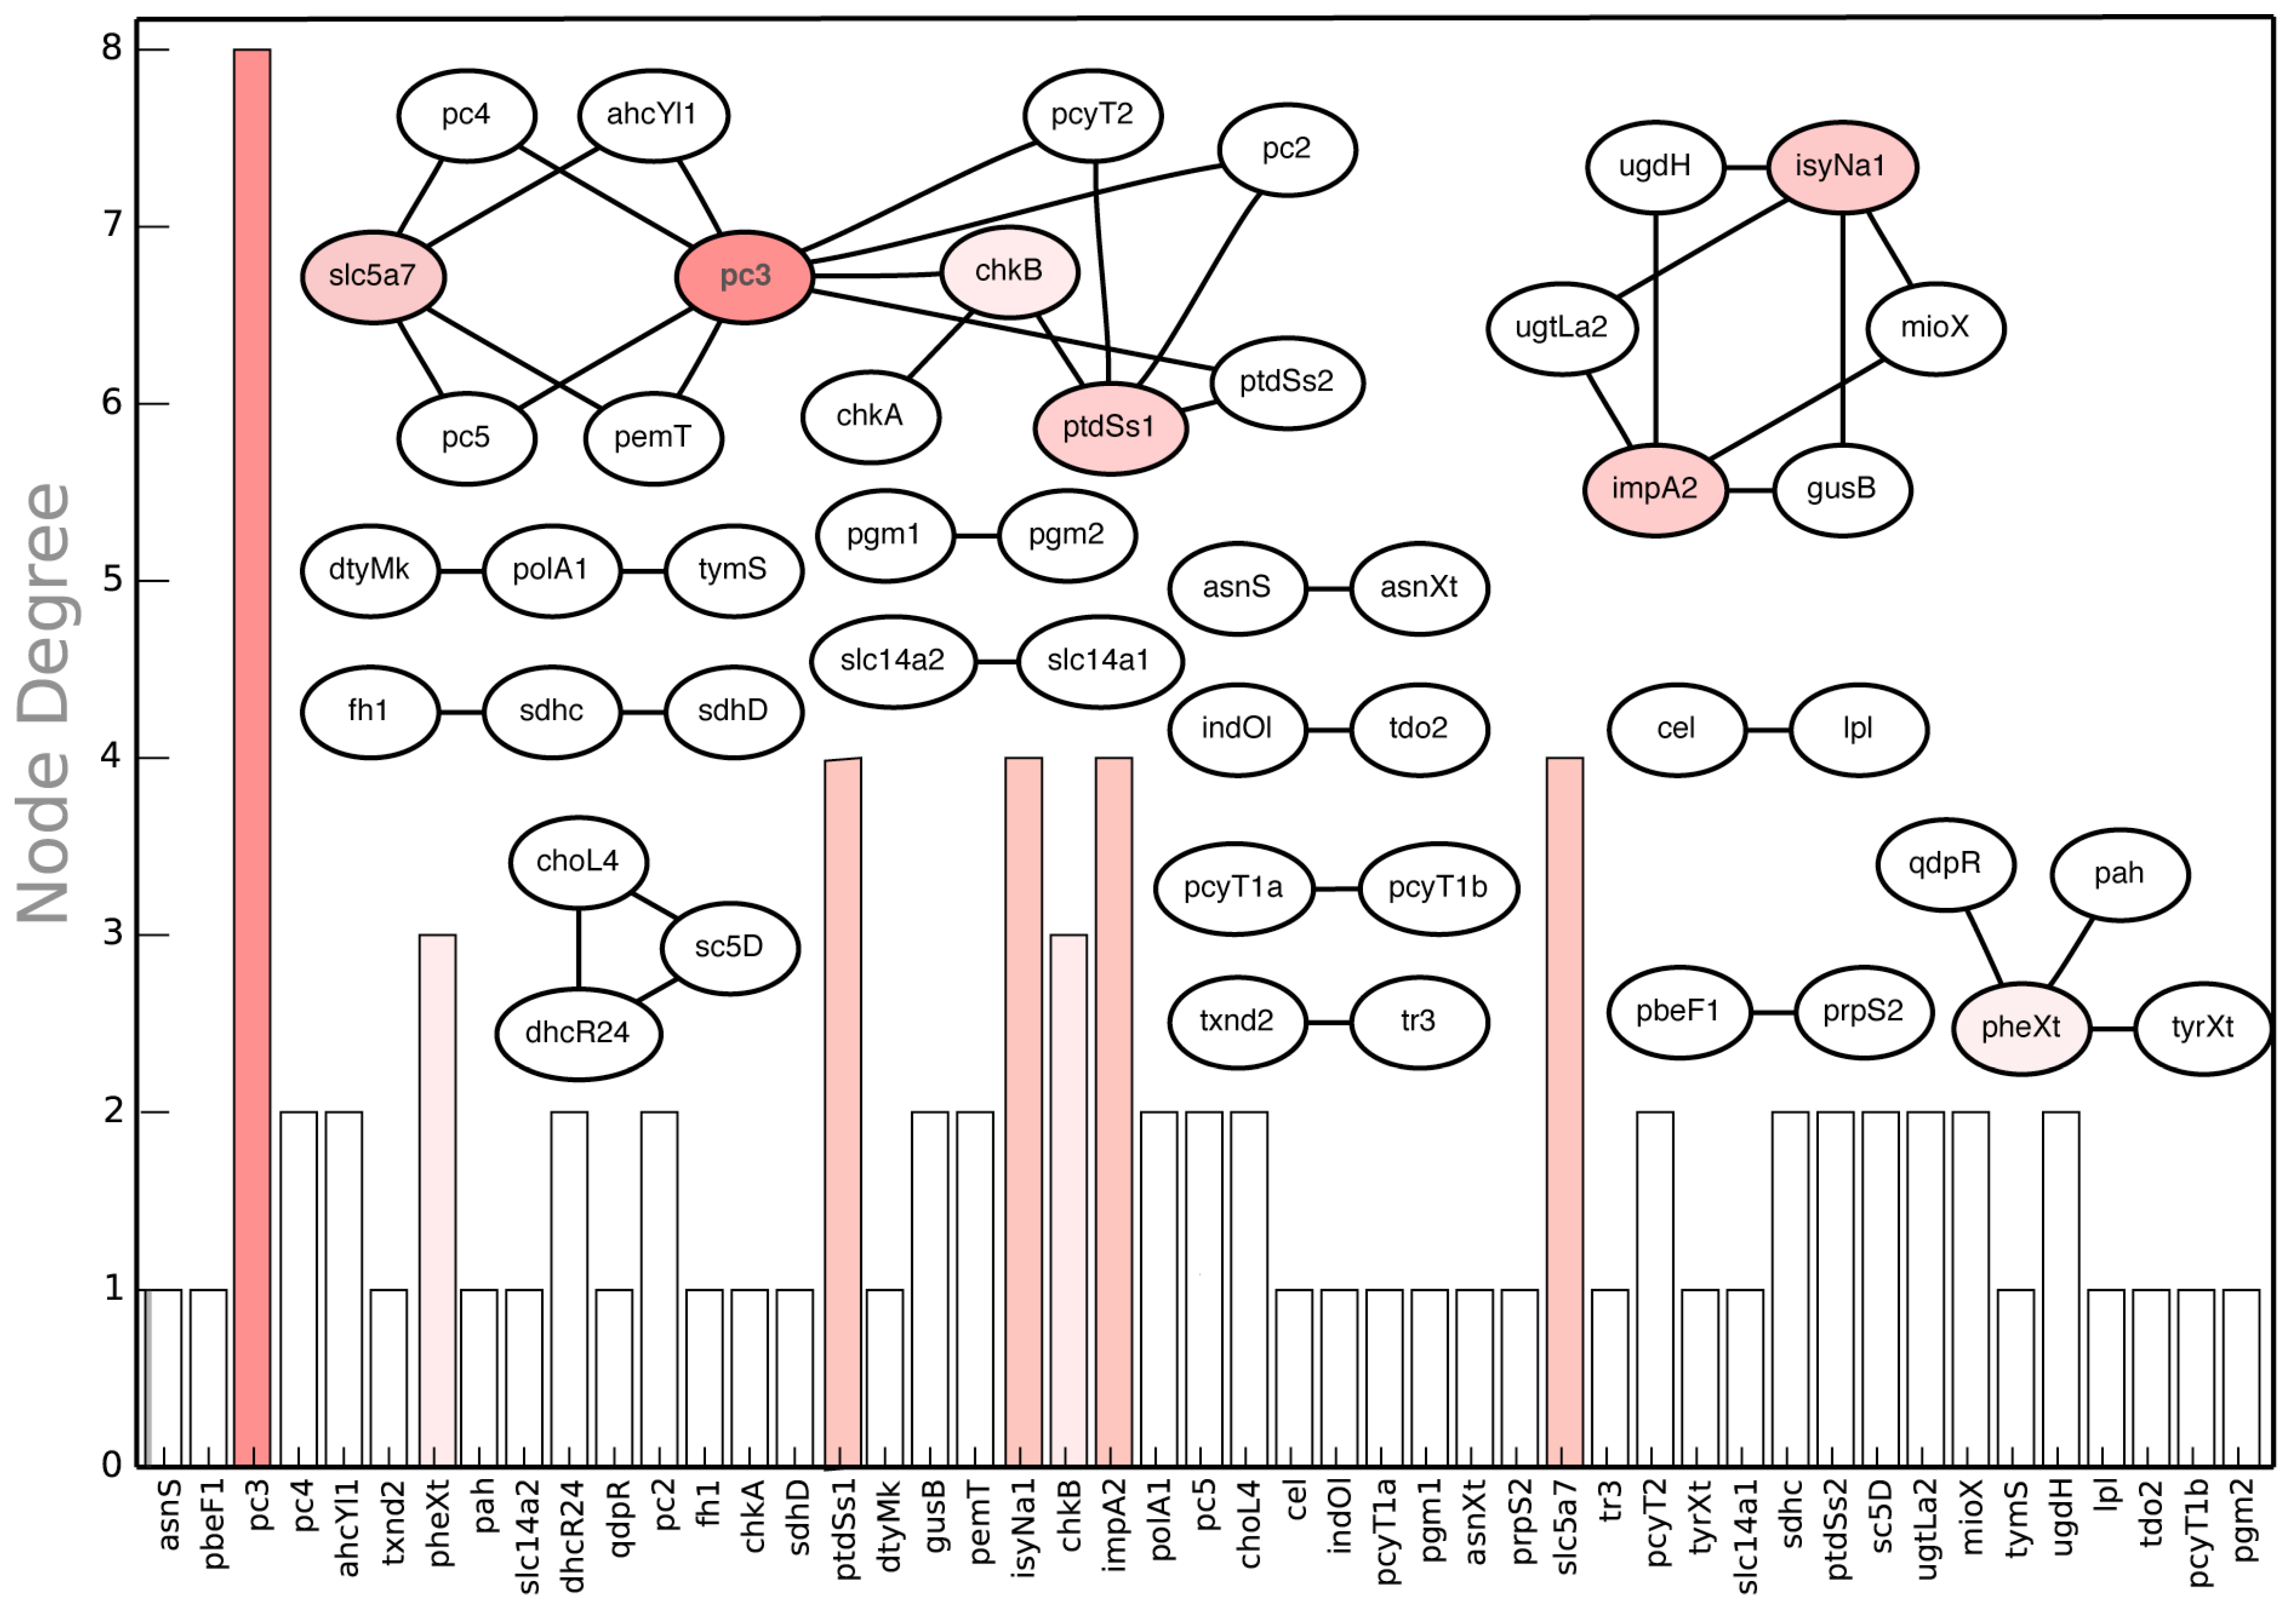
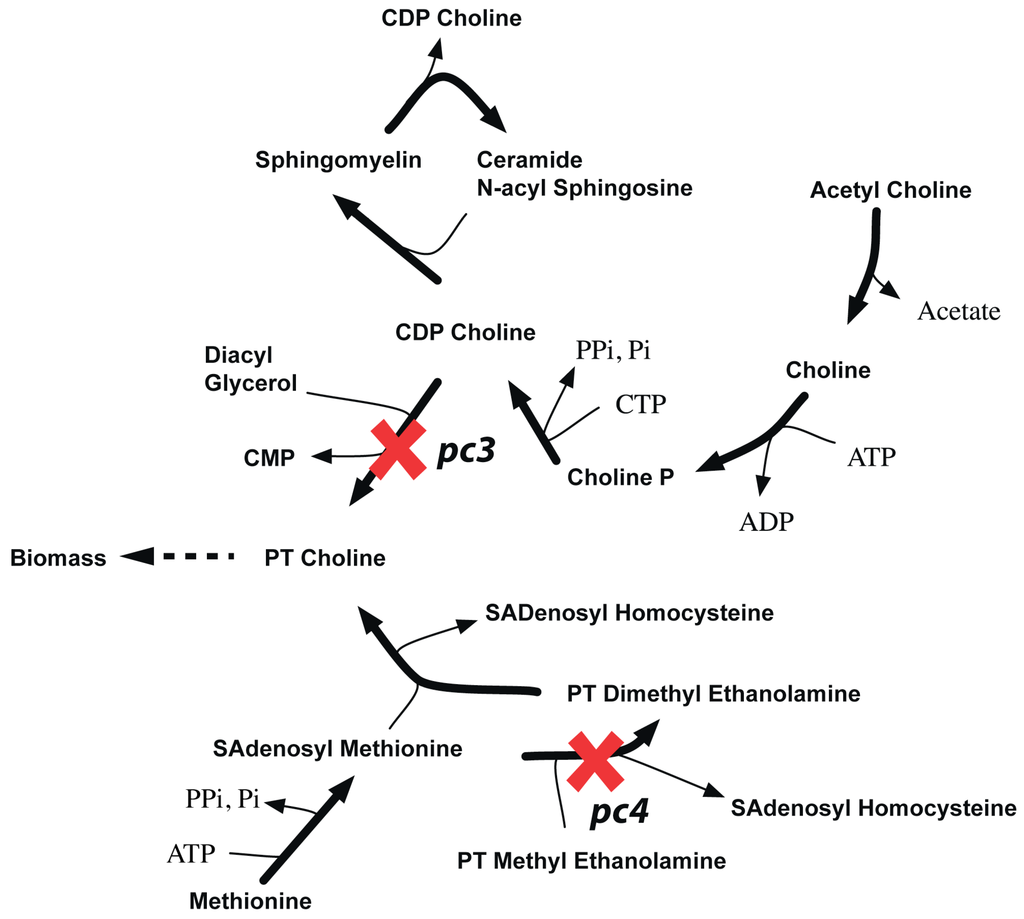
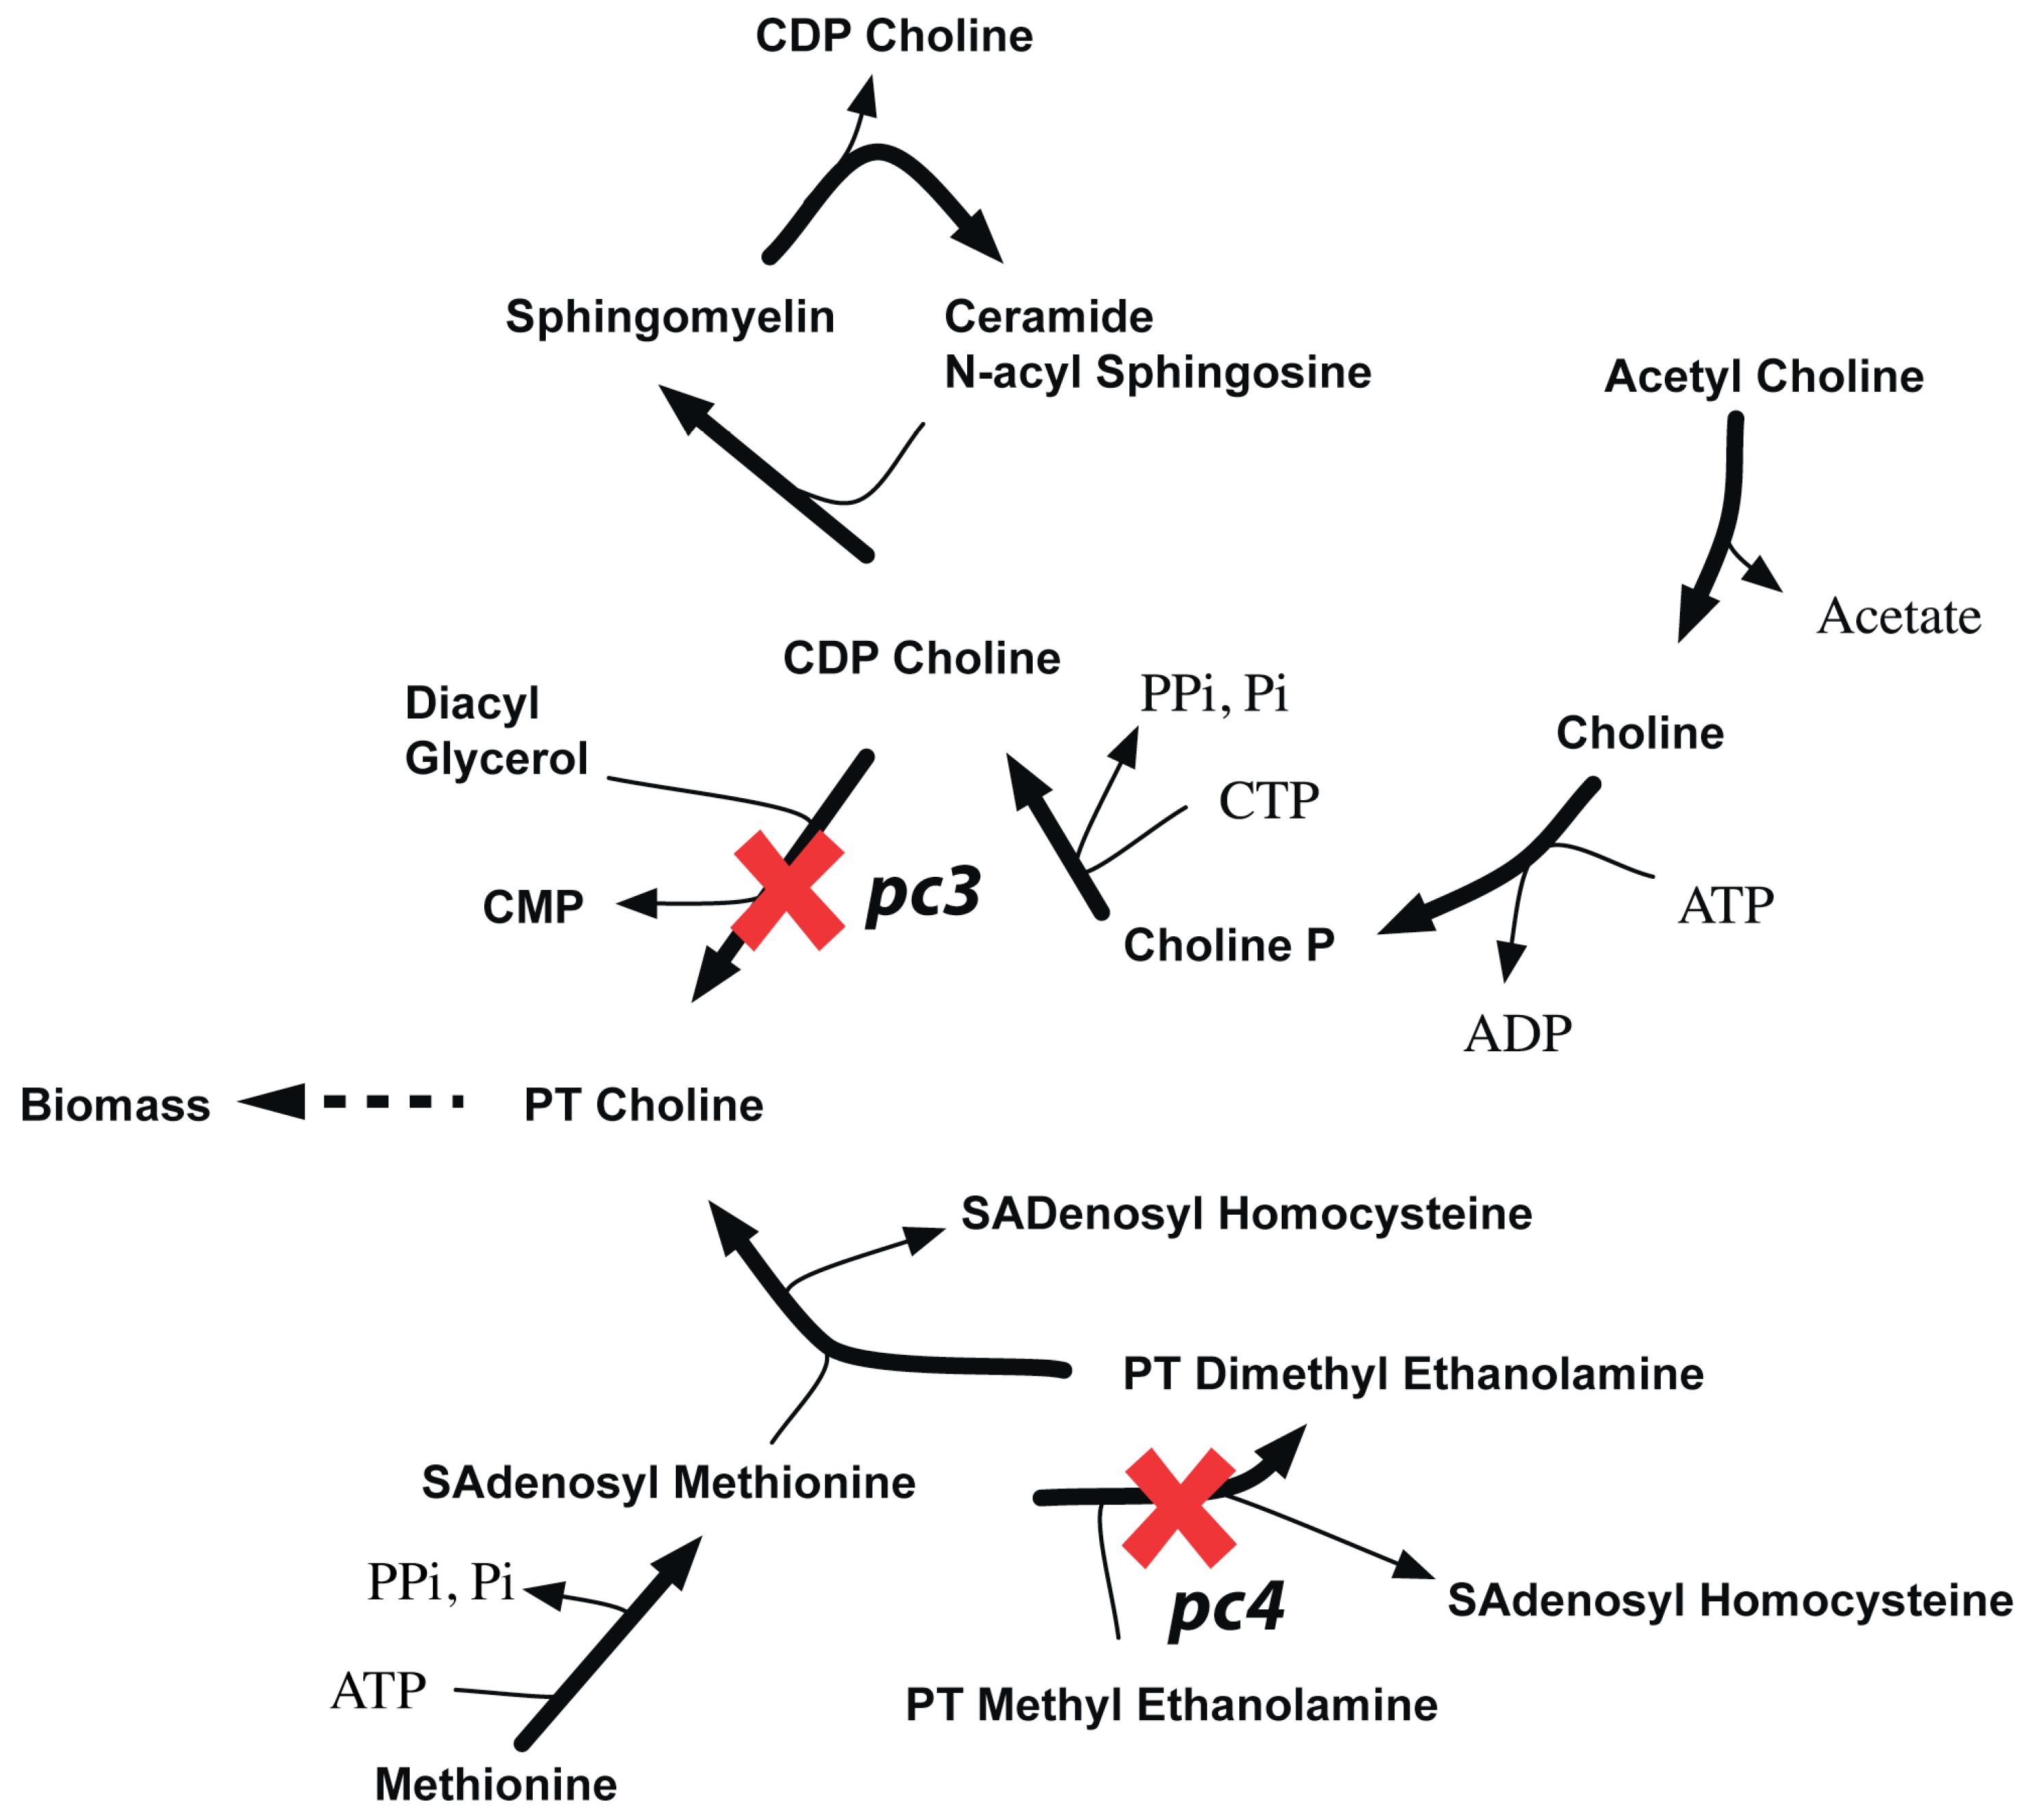
Figure 14.
pc3-pc4 synthetic lethality. It shows how in silico removal of pc3 and pc4 prevents synthesis of phosphatidyl choline.
Figure 14.
pc3-pc4 synthetic lethality. It shows how in silico removal of pc3 and pc4 prevents synthesis of phosphatidyl choline.
2.3.4. Suggested Experiments for Higher Order Gene Deletions
We have further cataloged higher order lethal gene lists that show 20 lethal gene triplets and three lethal gene quadruplets. This is supplemented with information about the biomass precursor(s) each lethal mutant fails to synthesize (see Supplemental File S4: Tables 5–7). We hereby elucidate two higher order gene deletion experiments (see Table 6) to be tested in mouse embryonic stem cells or CHO-K1 cell lines based on the homology of gene functionality between mouse and CHO.
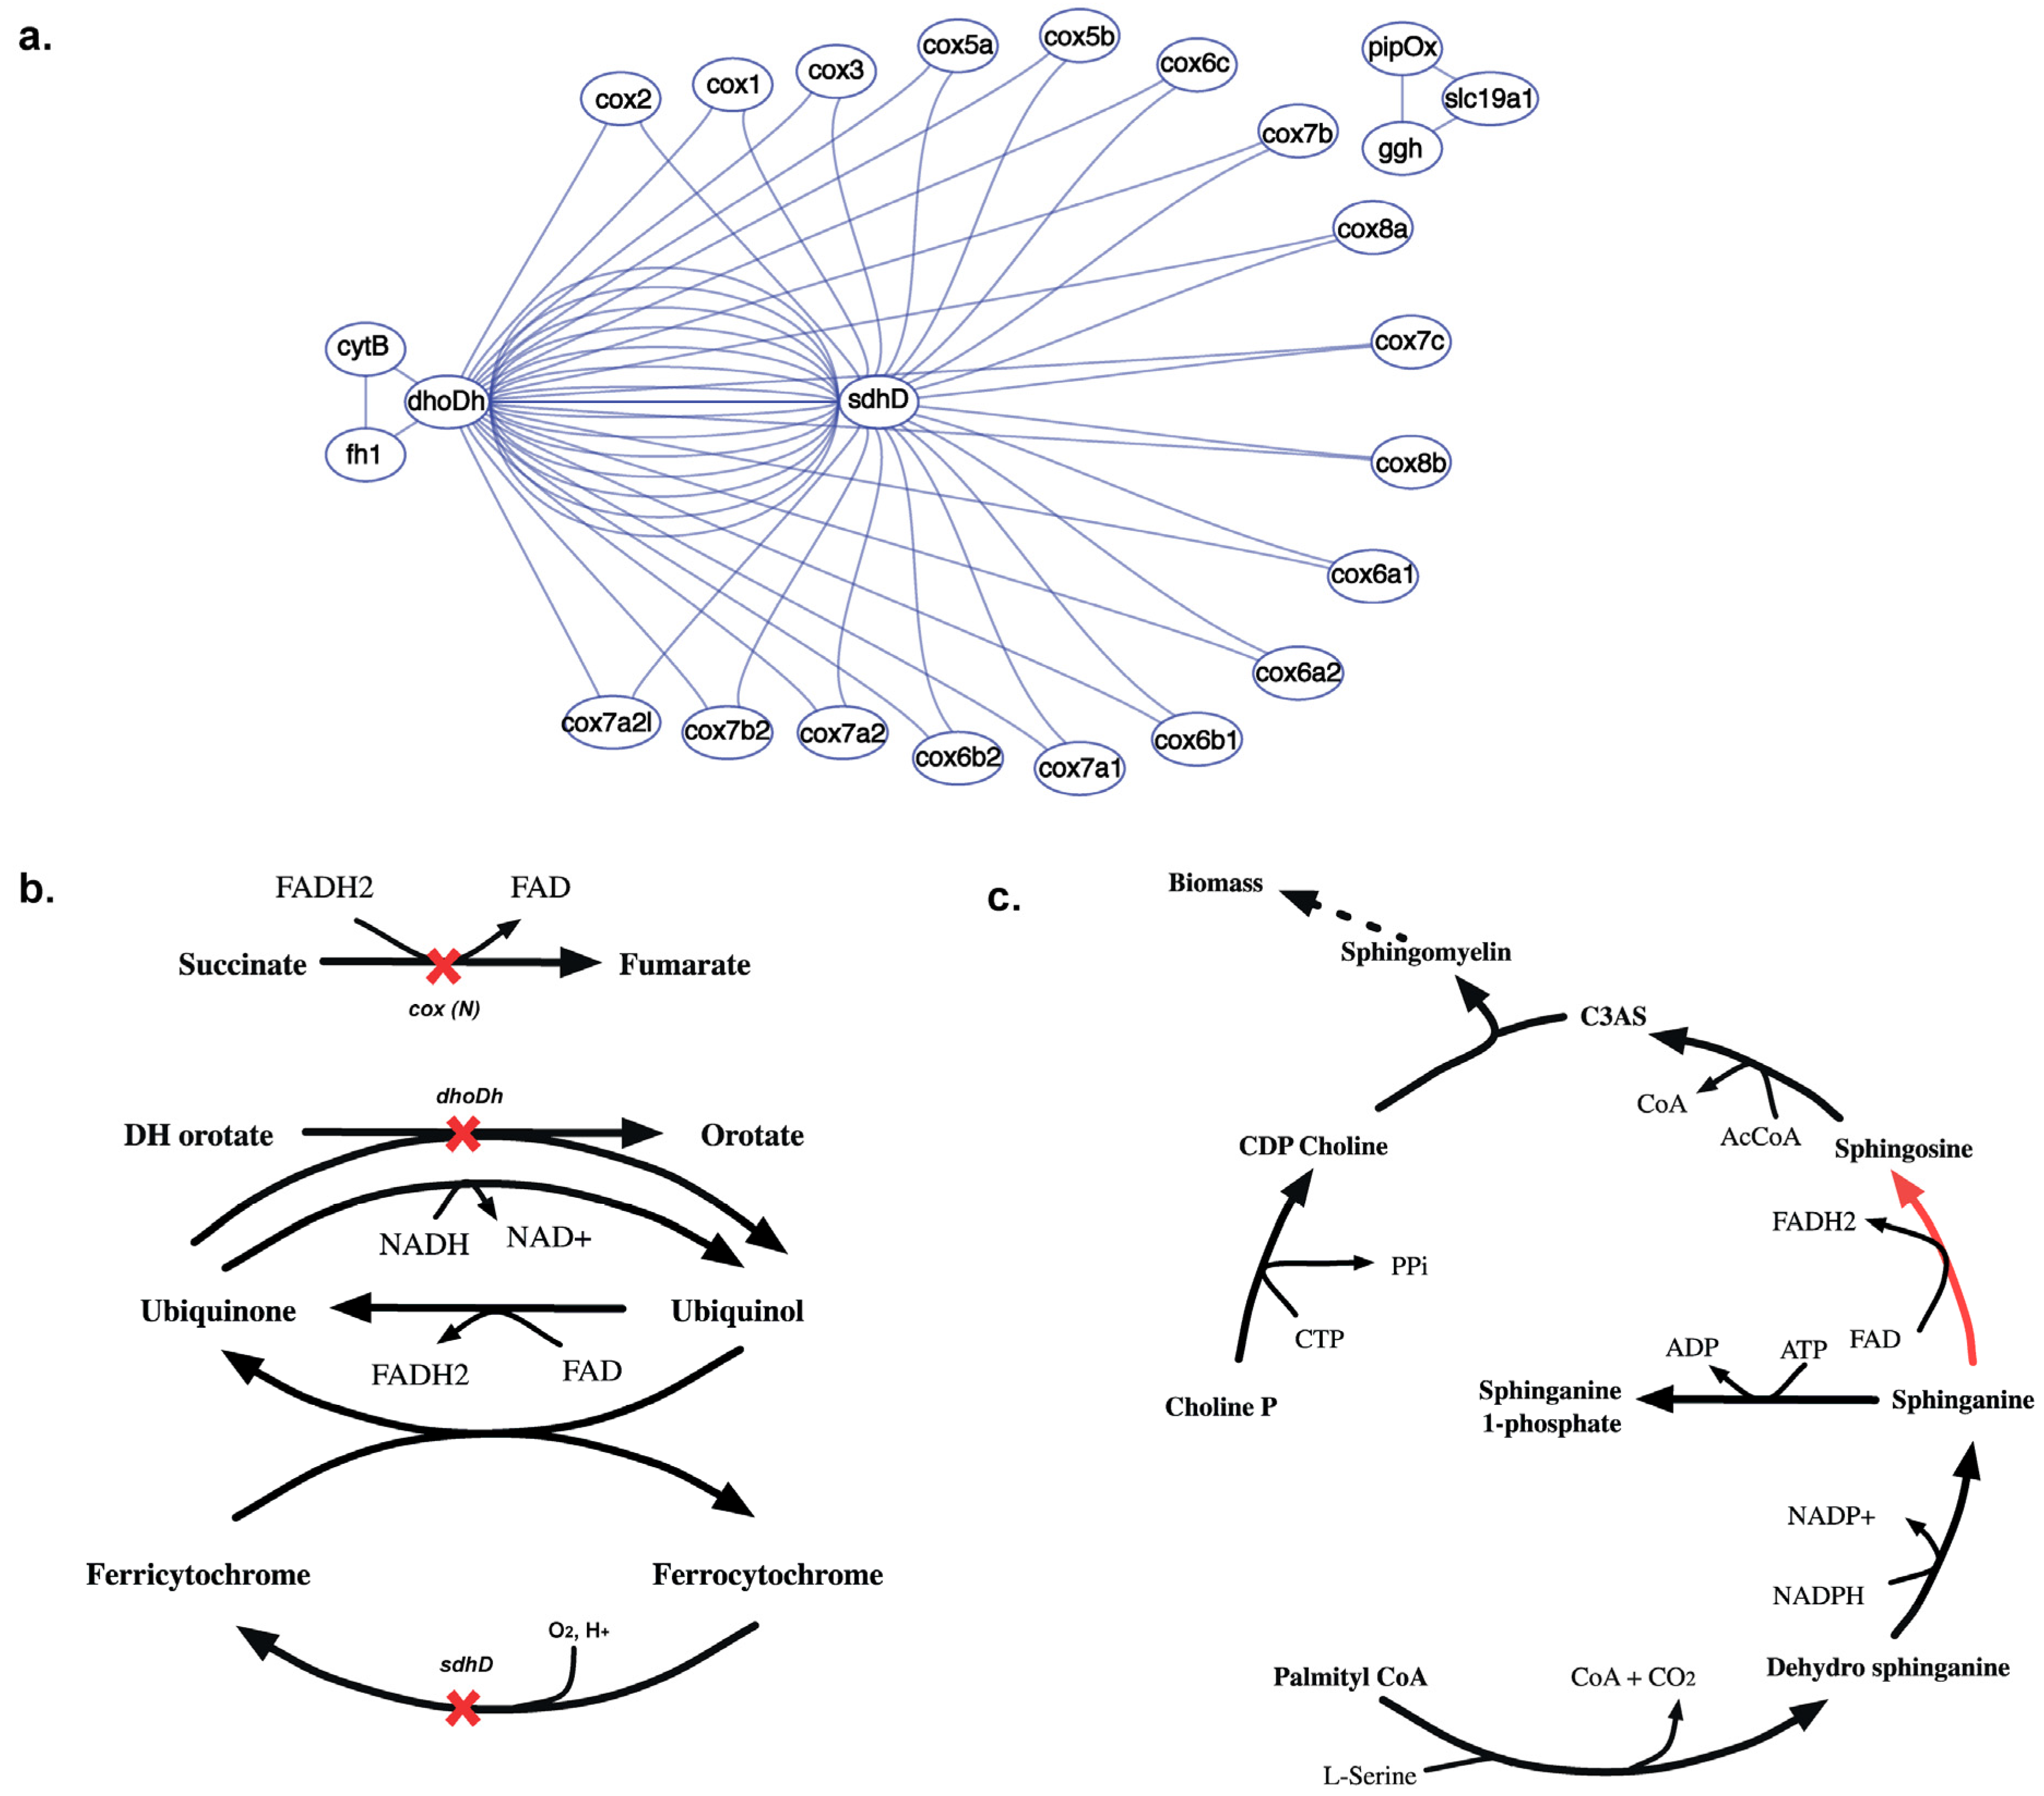
2.3.5. SL3U Case Δcox(N)ΔsdhDΔdhoDh
The complex GPR relationship for the cytochrome-C oxidase (CCO) reaction contributes to 18 in silico SL3 combinations (see Figure 15(a)). Unlike any other reaction in this model, the CCO activity is performed by a holoenzyme that is encoded by 20 different cox genes. 18 of these 20 cox genes constitute lethal gene triplets with a putative succinate dehydrogenase (sdhD) and a dihydroorotate dehydrogenase (dhoDh). In silico removal of cox(N), sdhD and dhoDh genes results in inability to regenerate cytosolic FAD (see Figure 15(b)). Consequently, FAD dependent sphinganine to sphingosine conversion is blocked that inhibits the synthesis of Ceramide 3-acyl sphingosine (C3AS). C3AS is required for the synthesis of biomass precursor sphingomyelin, which is blocked upon deletion of all the three genes thereby causing lethality.
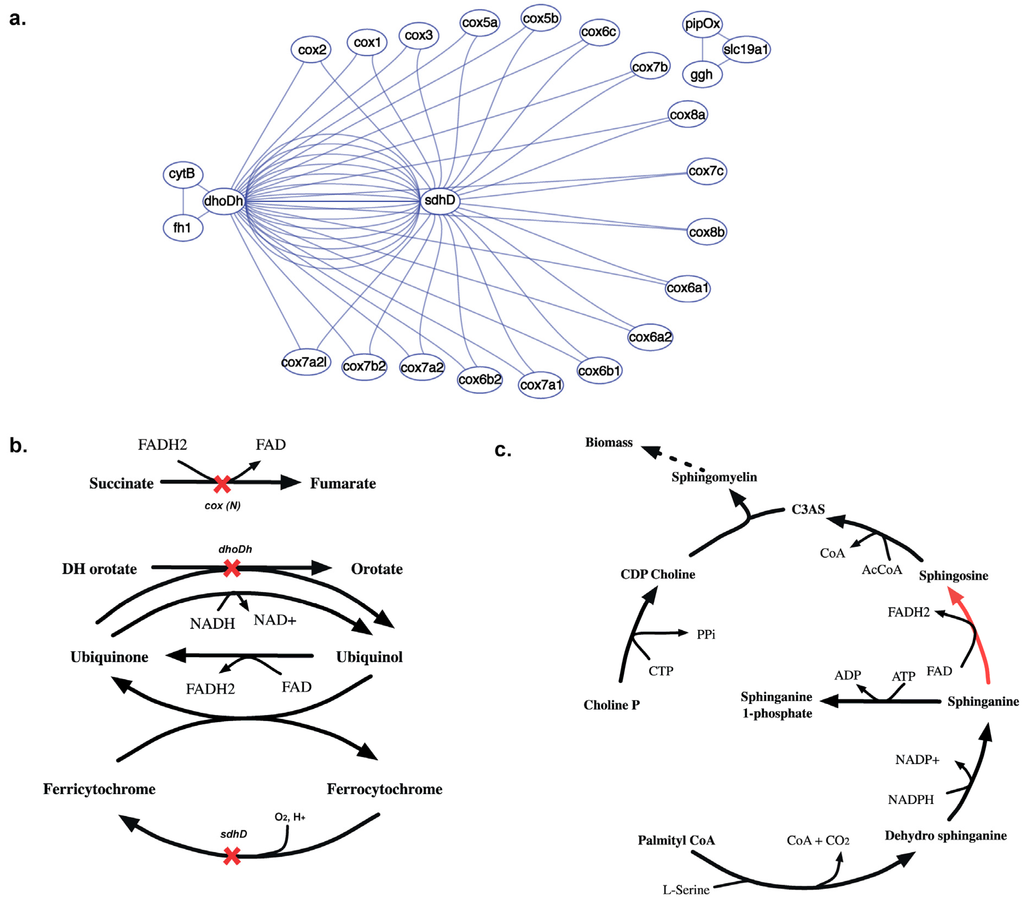
Figure 15.
Synthetic lethal interaction of cytochrome oxidase genes. (a) Shows the SL3 landscape with in silico SL3 interactions between sdhD, dhoDh and 18 different cox genes. (b) Shows the reactions that get knocked out upon in silico removal of dhoDh, sdhD and either of the 18 cox(N) genes, preventing synthesis of cofactors FAD and FADH2. (c) Shows why the absence of FAD prevents the sphinganine to sphingosine conversion (shown in red) making the removal of gene triplet lethal.
2.3.6. SL4U Case ΔnplΔnanSΔst8Sia1Δst8Sia5
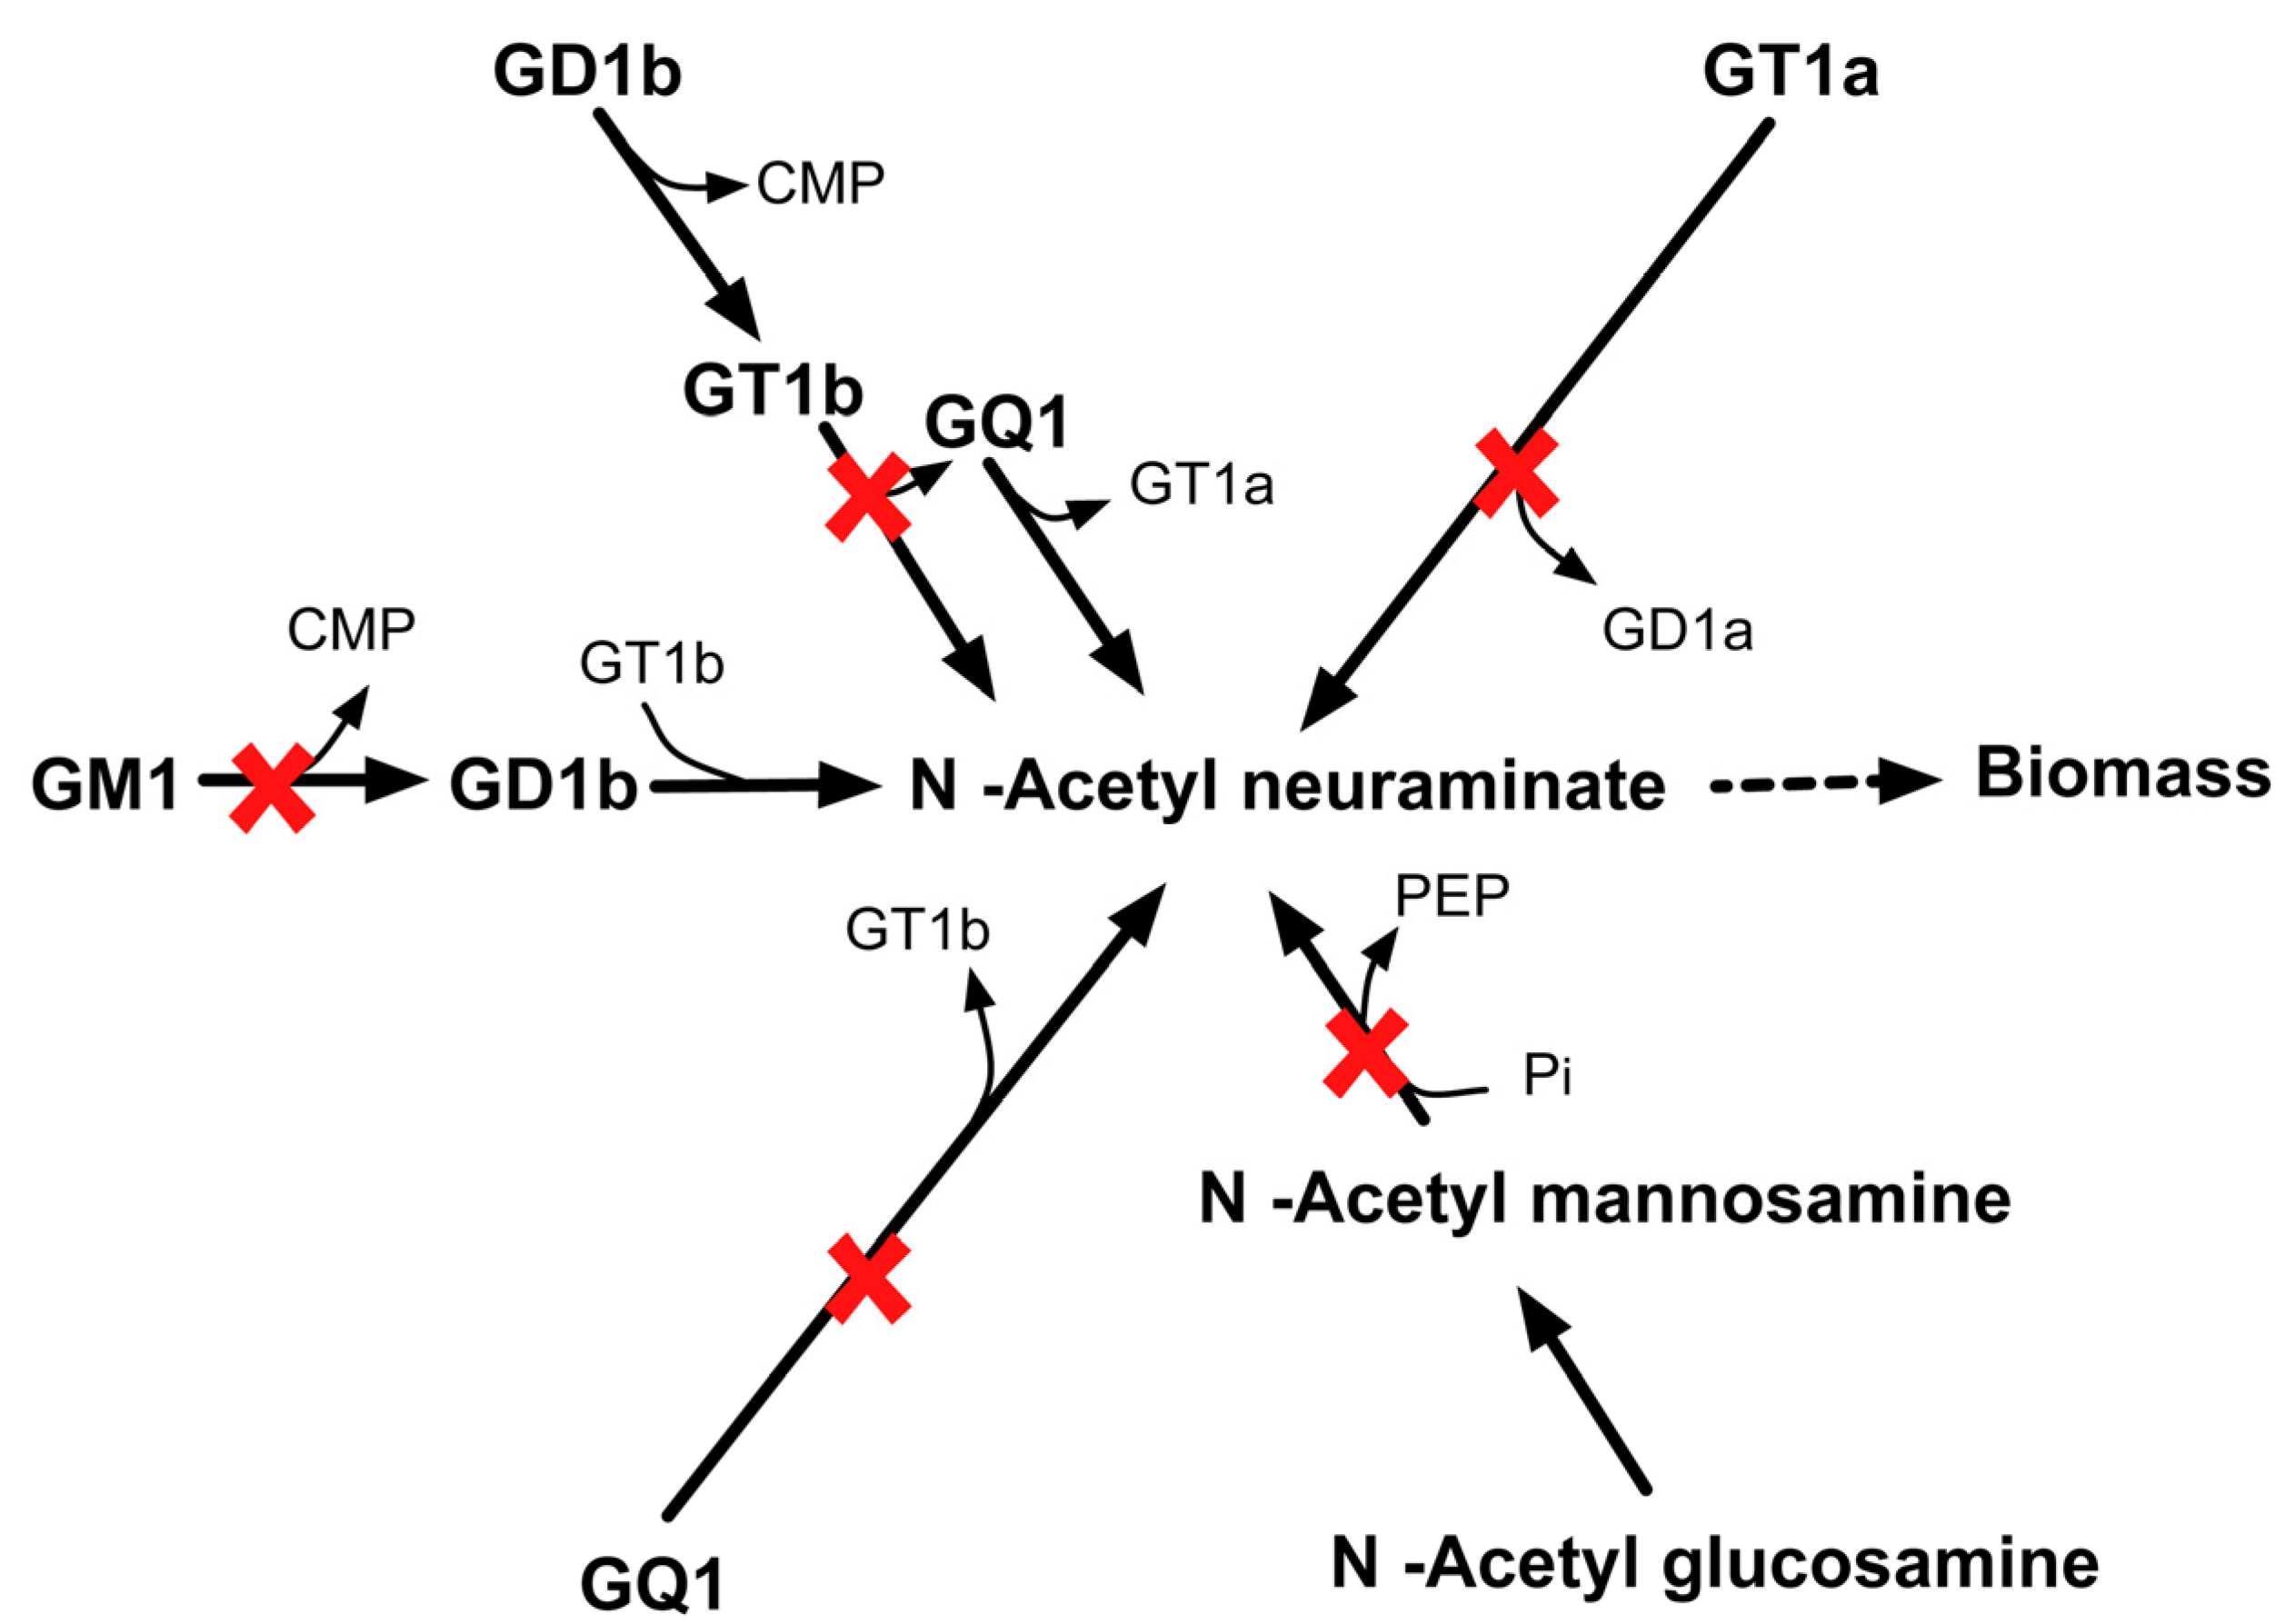
Likewise, in silico quadruple deletion of npl, nanS, st8Sia1 and st8Sia5 genes inhibit anapyruvate lyase (APL) and sialyltransferase (SIL) activities. CHO 1.2 contains four different pathways of synthesizing N–acetyl neuraminate. Loss of all APL and SIL activities shut off all four pathways that form biomass precursor N–acetyl neuraminate (see Figure 16) in silico and thus leads to lethality.
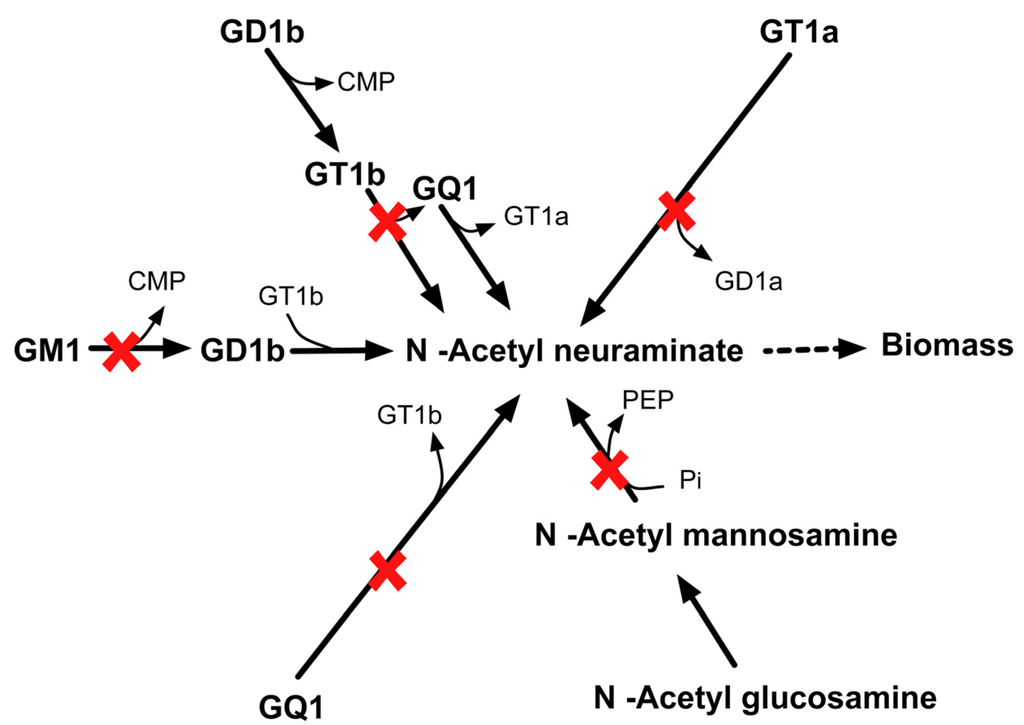
Figure 16.
Lethality upon in silico removal of npl, nanS, st8Sia1, and st8Sia5. The quadruple mutant is unable to synthesize biomass precursor N-acetyl neuraminate.
Figure 16.
Lethality upon in silico removal of npl, nanS, st8Sia1, and st8Sia5. The quadruple mutant is unable to synthesize biomass precursor N-acetyl neuraminate.
3. Methods
The Synthetic Lethality Finder protocol [93] was applied for (i) the Yeast 7.11 [7] genome-scale model of S. cerevisiae under aerobic condition in minimal media and (ii) for the CHO 1.2 [80] model under aerobic conditions and minimal essential media [94] to identify essential reactions (for double, triple and higher order) deletions. The SL finder [93] identifies reaction (or combination thereof) in the metabolic network whose removal would restrict the maximum biomass below a pre-specified cutoff. This is solved using a min-max mixed-integer linear problem (MILP) where the inner problem maximizes biomass subject to network stoichiometry and nutrient uptake constraints. The outer problem, at the same time, identifies reaction whose removal would minimize the cellular biomass below a specified cut-off. By iteratively increasing the number of reaction deletion k, one can identify lethal reaction combinations of higher-order. For example, setting k equal to one identifies all essential reactions. Accordingly, k = 2, 3… refer to synthetic lethal pairs, triplets, etc. Upon identification of lethal reaction combinations, we elucidated the lethal deletion combinations at the gene level by making use of GPR associations. For example, in yeast, the essential holoenzyme acetyl-CoA carboxylase involves two functional subunits encoded by genes ACC1 and BPL1. Deleting either of these genes prevents conversion of acetyl-CoA to malonyl-CoA therefore both genes are essential. In contrast, methylenetetrahydrofolate reductase is an essential reaction encoded by isozymes MET13 and MET12. Both these genes need to be knocked-out to prevent the formation of 5-methyltetrahydrofolate from 5, 10-methylenetetrahydrofolate. Thus, in this case the reaction is essential but the associated genes form a synthetic lethal pair.
The minimal medium for yeast comprised of potassium, sodium, iron (II), nitrogen (as ammonia), sulfur (as sulfate) and phosphorus (as inorganic phosphate). Glucose was used as the sole carbon source. Trace nutrients such as 4-aminobenzoate, biotin, myo-inositol, nicotinate, pantothenic acid and thiamin were included [95]. Glucose and oxygen uptake rates were set at 100 and 20 mmol gDW−1h−1, respectively (in accordance with the experimental study [96] which showed that oxygen uptake is about a fifth of glucose uptake on a molar basis for aerobic growth in yeast). The non-growth associated ATP maintenance was set at 1 mmol gDW−1h−1 as proposed by Mo et al. [95]. Maximum biomass (FBA) calculations for CHO cells were carried out under minimal essential media [80] (used for CHO cell culture as shown in Riordan et al. [97], Stanners et al. [98]) with glucose, amino acids (Val, Lys, Leu, Thr, Met, Arg and His) and all four nucleotides along with nitrogen sources. 10% of the maximum theoretical biomass was chosen for both cases as the cutoff for growth [99]. We used the mixed integer program CPLEX solver in GAMS using an Intel Xeon X5675 Six-Core 3.06 GHz with 48GB of physical memory, for reaction level results and Python v3.4.1 for all calculations.
The effect of gene deletions on biomass component production was also systematically assessed using a Precursor Identifier algorithm (see Supplemental File S2). Once a lethal gene deletion combination is identified, the corresponding biomass component whose production is compromised is identified along with the inactivated production pathway. Python scripts were used to generate topology files for most networks drawn in this paper in DOT graphing language. Graphs were displayed using Omnigraffle 6.0TM operating on the python scripts and post-processed. The updated S. cerevisiae model was generated using COBRA Toolbox v2.0 [100] in Excel and SMBL formats respectively (see Supplemental Files S7 and S8).
4. Conclusions
In this study we propose 50 model modifications for Yeast 7.11 and eight modifications for CHO 1.2 that improve their model consistencies in terms of essential and lethal gene predictions. In addition, we have also suggested non-intuitive gene deletion combinations for both yeast and CHO-K1 cell lines for experimental validation that can aid in future curation of the genome-scale models. Overall, the contribution of multi-gene deletion data to enhance the performance of genome-scale metabolic reconstructions has been demonstrated in this work. In addition, our analysis identifies several cases where the metabolism-only description of the current models fails to reconcile in silico-in vivo inconsistencies (ESG cases in Yeast) arising due to non-metabolic interactions. Incorporation of detailed information for gene transcription and translation in genome-scale models, as described in the ME-model formalisms (for E. coli [101] and T. maratima [102]), offer opportunities for reconciling these inconsistencies. In case of CHO 1.2 model, however, the major obstacle towards model curation remains to be the paucity of gene deletion information for CHO-K1 cell lines, or the related mouse embryonic stem cells. A comprehensive gene deletion databank, similar to that available for E. coli an S. cerevisiae, will greatly contribute towards improving the performance of the current model.
Supplementary Files
Supplementary File 1Acknowledgments
The authors would like to thank Ali R. Zomorrodi for critical reading of the manuscript and insightful suggestions, and Ali Khodayari for useful discussions. The authors gratefully acknowledge funding from Life Technologies and the DOE (http://www.energy.gov/) grant no. DE-SC0008091. The funders had no role in the study, design, data collection and analysis, decision to publish, or preparation of the manuscript.
Author Contributions
CDM conceived and coordinated the study, participated in its design and helped to draft the manuscript. RC performed the simulations and drafted the manuscript. RC and AC performed data analysis. All authors read and approved the final manuscript.
Conflicts of Interest
The authors declare no conflict of interest.
Appendix
Description of the Abbreviations
GPR—Gene Protein Reaction association
ES—Essential genes
G—Genes whose singular deletion does not affect cell viability
SLx—Set of x genes whose simultaneous deletion is lethal. For example, SL3 refers to a set of 3 genes that constitute a lethal triplet
ESES—Genes whose deletion reduces cellular growth below the viability threshold for both in silico and in vivo cases
GG—Genes which when deleted in silico and knocked out in vivo does not decrease cell growth in both cases
GES—This represents the list of genes which when deleted in silico does not affect cell growth. However, in vivo knockout of such genes, leads to cell death.
SL2ES—A non-essential gene whose simultaneous deletion with another non-essential gene is lethal in silico, however, at least one of which is essential in vivo.
ESSL2—This are those gene pairs for which a simultaneous knockout of both genes in vivo causes cell death. However, at least one of the genes of the pair when knocked out in silico causes cell death.
SL2G—This is the list of gene pairs where simultaneous deletion of both genes in silico causes cell death. However, a simultaneous in vivo knockout of both genes is non-lethal for the cell.
GSL2—This is the list of gene pairs where simultaneous deletion of both genes is non-lethal in silico. However, a simultaneous in vivo knockout of both genes is lethal for the cell.
SL2SL2—Simultaneous removal of the genes of this list of gene pairs causes cell death in silico and in vivo both. However, a single gene deletion was not lethal in both in silico and in vivo.
SL2U—Simultaneous deletion of the genes of this list of gene pairs causes in silico lethality. However, there exist no in vivo evidence for the same. This puts them to the in vivo untested (U) category.
Specificity, Sensitivity and False Viable Rate calculations:
The specificity of a model is defined as follows:
Specificity = #ESES/(#ESES + #GES) [8]
Using this metric, the selectivity of Yeast 7.11 is:
In contrast, the specificity of our current model iSce926 is:
, which shows a 20.4% improvement.
Likewise, the sensitivity (or True Viable Rate) of a model is defined as follows:
Sensitivity = #GG/(#GG + #ESG) [8]
Using this metric, the sensitivity of Yeast 7.11 is:
In contrast, the sensitivity of our current model iSce926 is:
, which shows a 2.66% improvement.
Again, the False Viable Rate (FVR) is defined as:
FVR = #GES/(#GES+#ESES) [8]
Using this metric, the FVR of Yeast 7.11 is:
In contrast, the FVR of our current model iSce926 is:
, which shows a reduction by 8.42%.
References
- Botstein, D.; Fink, G.R. Yeast: An experimental organism for 21st century biology. Genetics 2011, 189, 695–704. [Google Scholar] [CrossRef]
- Goffeau, A.; Barrell, B.G.; Bussey, H.; Davis, R.W.; Dujon, B.; Feldmann, H.; Galibert, F.; Hoheisel, J.D.; Jacq, C.; Johnston, M.; et al. Life with 6000 genes. Science 1996, 274, 546–567. [Google Scholar] [CrossRef] [PubMed]
- Cherry, J.M.; Ball, C.; Weng, S.; Juvik, G.; Schmidt, R.; Adler, C.; Dunn, B.; Dwight, S.; Riles, L.; Mortimer, R.K.; et al. Genetic and physical maps of saccharomyces cerevisiae. Nature 1997, 387, 67–73. [Google Scholar] [CrossRef] [PubMed][Green Version]
- Orhan, I.E. Implications of some selected flavonoids towards alzheimer's disease with the emphasis on cholinesterase inhibition and their bioproduction by metabolic engineering. Curr. Pharm. Biotechno. 2014, 15, 352–361. [Google Scholar] [CrossRef]
- Forster, J.; Famili, I.; Fu, P.; Palsson, B.O.; Nielsen, J. Genome-scale reconstruction of the saccharomyces cerevisiae metabolic network. Genome Res. 2003, 13, 244–253. [Google Scholar] [CrossRef] [PubMed]
- Feizi, A.; Osterlund, T.; Petranovic, D.; Bordel, S.; Nielsen, J. Genome-scale modeling of the protein secretory machinery in yeast. PloS one 2013, 8. [Google Scholar] [CrossRef]
- Aung, H.W.; Henry, S.A.; Walker, L.P. Revising the representation of fatty acid, glycerolipid, and glycerophospholipid metabolism in the consensus model of yeast metabolism. Ind. Biotechnol. 2013, 9, 215–228. [Google Scholar] [CrossRef] [PubMed]
- Zomorrodi, A.R.; Maranas, C.D. Improving the imm904 S. Cerevisiae metabolic model using essentiality and synthetic lethality data. BMC Syst. Biol. 2010, 4. [Google Scholar] [CrossRef]
- Sanchez, B.J.; Nielsen, J. Genome scale models of yeast: Towards standardized evaluation and consistent omic integration. Integr. Biol. 2015, 7, 846–858. [Google Scholar] [CrossRef] [PubMed]
- Lucas, B.K.; Giere, L.M.; DeMarco, R.A.; Shen, A.; Chisholm, V.; Crowley, C.W. High-level production of recombinant proteins in cho cells using a dicistronic dhfr intron expression vector. Nucleic Acids Res. 1996, 24, 1774–1779. [Google Scholar] [CrossRef]
- Li, F.; Vijayasankaran, N.; Shen, A.Y.; Kiss, R.; Amanullah, A. Cell culture processes for monoclonal antibody production. MAbs 2010, 2, 466–479. [Google Scholar] [CrossRef]
- Daramola, O.; Stevenson, J.; Dean, G.; Hatton, D.; Pettman, G.; Holmes, W.; Field, R. A high-yielding cho transient system: Coexpression of genes encoding ebna-1 and gs enhances transient protein expression. Biotechnol. Progr. 2014, 30, 132–141. [Google Scholar] [CrossRef] [PubMed]
- Yu, H.; Greenbaum, D.; Xin Lu, H.; Zhu, X.; Gerstein, M. Genomic analysis of essentiality within protein networks. Trends Genet. 2004, 20, 227–231. [Google Scholar] [CrossRef] [PubMed]
- Ooi, S.L.; Pan, X.; Peyser, B.D.; Ye, P.; Meluh, P.B.; Yuan, D.S.; Irizarry, R.A.; Bader, J.S.; Spencer, F.A.; Boeke, J.D. Global synthetic-lethality analysis and yeast functional profiling. Trends Genet. 2006, 22, 56–63. [Google Scholar] [CrossRef] [PubMed]
- Baba, T.; Ara, T.; Hasegawa, M.; Takai, Y.; Okumura, Y.; Baba, M.; Datsenko, K.A.; Tomita, M.; Wanner, B.L.; Mori, H. Construction of escherichia coli k-12 in-frame, single-gene knockout mutants: The keio collection. Mol. Syst. Biol. 2006, 2. [Google Scholar] [CrossRef] [PubMed]
- Joyce, A.R.; Reed, J.L.; White, A.; Edwards, R.; Osterman, A.; Baba, T.; Mori, H.; Lesely, S.A.; Palsson, B.O.; Agarwalla, S. Experimental and computational assessment of conditionally essential genes in escherichia coli. J. Bacteriol. 2006, 188, 8259–8271. [Google Scholar] [CrossRef] [PubMed]
- Martinez, V.S.; Quek, L.E.; Nielsen, L.K. Network thermodynamic curation of human and yeast genome-scale metabolic models. Biophys. J. 2014, 107, 493–503. [Google Scholar] [CrossRef] [PubMed]
- Stanford, N.J.; Lubitz, T.; Smallbone, K.; Klipp, E.; Mendes, P.; Liebermeister, W. Systematic construction of kinetic models from genome-scale metabolic networks. PloS one 2013, 8. [Google Scholar] [CrossRef]
- Soh, K.C.; Miskovic, L.; Hatzimanikatis, V. From network models to network responses: Integration of thermodynamic and kinetic properties of yeast genome-scale metabolic networks. FEMS Yeast Res. 2012, 12, 129–143. [Google Scholar] [CrossRef] [PubMed]
- Selvarasu, S.; Karimi, I.A.; Ghim, G.H.; Lee, D.Y. Genome-scale modeling and in silico analysis of mouse cell metabolic network. Mol. Biosyst. 2010, 6, 152–161. [Google Scholar] [CrossRef] [PubMed]
- Tong, A.H.; Evangelista, M.; Parsons, A.B.; Xu, H.; Bader, G.D.; Page, N.; Robinson, M.; Raghibizadeh, S.; Hogue, C.W.; Bussey, H.; et al. Systematic genetic analysis with ordered arrays of yeast deletion mutants. Science 2001, 294, 2364–2368. [Google Scholar] [CrossRef]
- Cherry, J.M.; Hong, E.L.; Amundsen, C.; Balakrishnan, R.; Binkley, G.; Chan, E.T.; Christie, K.R.; Costanzo, M.C.; Dwight, S.S.; Engel, S.R.; et al. Saccharomyces genome database: The genomics resource of budding yeast. Nucleic Acids Res. 2012, 40. [Google Scholar] [CrossRef]
- Breslow, D.K.; Cameron, D.M.; Collins, S.R.; Schuldiner, M.; Stewart-Ornstein, J.; Newman, H.W.; Braun, S.; Madhani, H.D.; Krogan, N.J.; Weissman, J.S. A comprehensive strategy enabling high-resolution functional analysis of the yeast genome. Nat. Methods 2008, 5, 711–718. [Google Scholar] [CrossRef]
- Giaever, G.; Chu, A.M.; Ni, L.; Connelly, C.; Riles, L.; Veronneau, S.; Dow, S.; Lucau-Danila, A.; Anderson, K.; Andre, B.; et al. Functional profiling of the saccharomyces cerevisiae genome. Nature 2002, 418, 387–391. [Google Scholar] [CrossRef] [PubMed]
- Baudin, A.; Ozier-Kalogeropoulos, O.; Denouel, A.; Lacroute, F.; Cullin, C. A simple and efficient method for direct gene deletion in saccharomyces cerevisiae. Nucleic Acids Res. 1993, 21, 3329–3330. [Google Scholar] [CrossRef] [PubMed]
- Shoemaker, R.C.; Polzin, K.; Labate, J.; Specht, J.; Brummer, E.C.; Olson, T.; Young, N.; Concibido, V.; Wilcox, J.; Tamulonis, J.P.; et al. Genome duplication in soybean (glycine subgenus soja). Genetics 1996, 144, 329–338. [Google Scholar] [PubMed]
- Wach, A.; Brachat, A.; Pohlmann, R.; Philippsen, P. New heterologous modules for classical or pcr-based gene disruptions in saccharomyces cerevisiae. Yeast 1994, 10, 1793–1808. [Google Scholar] [PubMed]
- Engelman, D.M.; Steitz, T.A.; Goldman, A. Identifying nonpolar transbilayer helices in amino acid sequences of membrane proteins. Annu. Rev. Biophys.Bio. 1986, 15, 321–353. [Google Scholar] [CrossRef] [PubMed]
- Mannhaupt, G.; Stucka, R.; Pilz, U.; Schwarzlose, C.; Feldmann, H. Characterization of the prephenate dehydrogenase-encoding gene, tyr1, from saccharomyces cerevisiae. Gene 1989, 85, 303–311. [Google Scholar] [CrossRef]
- Lesage, G.; Shapiro, J.; Specht, C.A.; Sdicu, A.M.; Menard, P.; Hussein, S.; Tong, A.H.; Boone, C.; Bussey, H. An interactional network of genes involved in chitin synthesis in saccharomyces cerevisiae. BMC Genet. 2005, 6. [Google Scholar] [CrossRef] [PubMed]
- Firon, A.; Lesage, G.; Bussey, H. Integrative studies put cell wall synthesis on the yeast functional map. Curr. Opin. Microbiol. 2004, 7, 617–623. [Google Scholar] [CrossRef] [PubMed]
- Dickinson, J.R. Pathways of leucine and valine catabolism in yeast. Methods Enzymol. 2000, 324, 80–92. [Google Scholar] [PubMed]
- Sentheshanmuganathan, S.; Elsden, S.R. The mechanism of the formation of tyrosol by saccharomyces cerevisiae. Biochem. J. 1958, 69, 210–218. [Google Scholar] [CrossRef] [PubMed]
- Avalos, J.L.; Fink, G.R.; Stephanopoulos, G. Compartmentalization of metabolic pathways in yeast mitochondria improves the production of branched-chain alcohols. Nat. Biotechnol. 2013, 31, 335–341. [Google Scholar] [CrossRef] [PubMed]
- Harrison, R.; Papp, B.; Pal, C.; Oliver, S.G.; Delneri, D. Plasticity of genetic interactions in metabolic networks of yeast. P. Natl. Acad. Sci. USA 2007, 104, 2307–2312. [Google Scholar] [CrossRef] [PubMed]
- Gollub, E.G.; Liu, K.P.; Dayan, J.; Adlersberg, M.; Sprinson, D.B. Yeast mutants deficient in heme biosynthesis and a heme mutant additionally blocked in cyclization of 2,3-oxidosqualene. J. Biol. Chem. 1977, 252, 2846–2854. [Google Scholar]
- Oh-hama, T. Evolutionary consideration on 5-aminolevulinate synthase in nature. Origins life Evol. B. 1997, 27, 405–412. [Google Scholar] [CrossRef]
- De Silva-Udawatta, M.N.; Cannon, J.F. Roles of trehalose phosphate synthase in yeast glycogen metabolism and sporulation. Mol. Microbiol. 2001, 40, 1345–1356. [Google Scholar] [CrossRef] [PubMed]
- de Lichtenberg, U.; Jensen, L.J.; Brunak, S.; Bork, P. Dynamic complex formation during the yeast cell cycle. Science 2005, 307, 724–727. [Google Scholar] [CrossRef] [PubMed]
- Bell, W.; Sun, W.; Hohmann, S.; Wera, S.; Reinders, A.; De Virgilio, C.; Wiemken, A.; Thevelein, J.M. Composition and functional analysis of the saccharomyces cerevisiae trehalose synthase complex. J. Biol. Chem. 1998, 273, 33311–33319. [Google Scholar] [CrossRef]
- Barros, M.H.; Nobrega, F.G. Yah1 of saccharomyces cerevisiae: A new essential gene that codes for a protein homologous to human adrenodoxin. Gene 1999, 233, 197–203. [Google Scholar] [PubMed]
- Barros, M.H.; Carlson, C.G.; Glerum, D.M.; Tzagoloff, A. Involvement of mitochondrial ferredoxin and cox15p in hydroxylation of heme o. Febs. Lett. 2001, 492, 133–138. [Google Scholar] [PubMed]
- Lim, A.L.; Powers-Lee, S.G. Requirement for the carboxyl-terminal domain of saccharomyces cerevisiae carbamoyl-phosphate synthetase. J. Biol. Chem. 1996, 271, 11400–11409. [Google Scholar] [PubMed]
- Inglis, D.O.; Arnaud, M.B.; Binkley, J.; Shah, P.; Skrzypek, M.S.; Wymore, F.; Binkley, G.; Miyasato, S.R.; Simison, M.; Sherlock, G. The candida genome database incorporates multiple candida species: Multispecies search and analysis tools with curated gene and protein information for candida albicans and candida glabrata. Nucleic Acids Res. 2012, 40, D667–D674. [Google Scholar] [CrossRef] [PubMed]
- Hall, C.; Dietrich, F.S. The reacquisition of biotin prototrophy in saccharomyces cerevisiae involved horizontal gene transfer, gene duplication and gene clustering. Genetics 2007, 177, 2293–2307. [Google Scholar] [CrossRef] [PubMed]
- Tobias, S.; Rajic, I.; Vanyi, A. Effect of t-2 toxin on egg production and hatchability in laying hens. Acta Vet. Hung. 1992, 40, 47–54. [Google Scholar] [PubMed]
- Bernstein, M.; Hoffmann, W.; Ammerer, G.; Schekman, R. Characterization of a gene product (sec53p) required for protein assembly in the yeast endoplasmic reticulum. J. Cell Biol. 1985, 101, 2374–2382. [Google Scholar] [CrossRef] [PubMed]
- Hirschman, J.E.; Durbin, K.J.; Winston, F. Genetic evidence for promoter competition in saccharomyces cerevisiae. Mol. Cell. Biol. 1988, 8, 4608–4615. [Google Scholar] [PubMed]
- Dowell, R.D.; Ryan, O.; Jansen, A.; Cheung, D.; Agarwala, S.; Danford, T.; Bernstein, D.A.; Rolfe, P.A.; Heisler, L.E.; Chin, B.; et al. Genotype to phenotype: A complex problem. Science 2010, 328, 469. [Google Scholar] [CrossRef] [PubMed]
- Anderson, M.S.; Yarger, J.G.; Burck, C.L.; Poulter, C.D. Farnesyl diphosphate synthetase. Molecular cloning, sequence, and expression of an essential gene from saccharomyces cerevisiae. J. Biol. Chem. 1989, 264, 19176–19184. [Google Scholar]
- Lacroute, F. Regulation of pyrimidine biosynthesis in saccharomyces cerevisiae. J. Bacteriol. 1968, 95, 824–832. [Google Scholar] [PubMed]
- Petti, A.A.; Crutchfield, C.A.; Rabinowitz, J.D.; Botstein, D. Survival of starving yeast is correlated with oxidative stress response and nonrespiratory mitochondrial function. P. Natl. Acad. Sci. USA 2011, 108, E1089–E1098. [Google Scholar] [CrossRef]
- Buescher, J.M.; Antoniewicz, M.R.; Boros, L.G.; Burgess, S.C.; Brunengraber, H.; Clish, C.B.; DeBerardinis, R.J.; Feron, O.; Frezza, C.; Ghesquiere, B.; et al. A roadmap for interpreting c metabolite labeling patterns from cells. Curr. Opin. Biotechn. 2015, 34, 189–201. [Google Scholar] [CrossRef]
- Deutscher, D.; Meilijson, I.; Kupiec, M.; Ruppin, E. Multiple knockout analysis of genetic robustness in the yeast metabolic network. Nat. Genet. 2006, 38, 993–998. [Google Scholar] [CrossRef] [PubMed]
- Prevost, G.; Eriani, G.; Kern, D.; Dirheimer, G.; Gangloff, J. Study of the arrangement of the functional domains along the yeast cytoplasmic aspartyl-trna synthetase. Eur. J. Biochem. 1989, 180, 351–358. [Google Scholar] [CrossRef] [PubMed]
- Rebora, K.; Laloo, B.; Daignan-Fornier, B. Revisiting purine-histidine cross-pathway regulation in saccharomyces cerevisiae: A central role for a small molecule. Genetics 2005, 170, 61–70. [Google Scholar] [CrossRef]
- van Pel, D.M.; Stirling, P.C.; Minaker, S.W.; Sipahimalani, P.; Hieter, P. Saccharomyces cerevisiae genetics predicts candidate therapeutic genetic interactions at the mammalian replication fork. G3 2013, 3, 273–282. [Google Scholar] [CrossRef] [PubMed]
- Berthelet, S.; Usher, J.; Shulist, K.; Hamza, A.; Maltez, N.; Johnston, A.; Fong, Y.; Harris, L.J.; Baetz, K. Functional genomics analysis of the saccharomyces cerevisiae iron responsive transcription factor aft1 reveals iron-independent functions. Genetics 2010, 185, 1111–1128. [Google Scholar] [CrossRef] [PubMed]
- Diaz-Ruiz, R.; Averet, N.; Araiza, D.; Pinson, B.; Uribe-Carvajal, S.; Devin, A.; Rigoulet, M. Mitochondrial oxidative phosphorylation is regulated by fructose 1,6-bisphosphate. A possible role in crabtree effect induction? J. Biol. chem. 2008, 283, 26948–26955. [Google Scholar] [PubMed]
- Guaragnella, N.; Zdralevic, M.; Antonacci, L.; Passarella, S.; Marra, E.; Giannattasio, S. The role of mitochondria in yeast programmed cell death. Front. Oncol. 2012, 2. [Google Scholar] [CrossRef] [PubMed]
- Kus, B.; Gajadhar, A.; Stanger, K.; Cho, R.; Sun, W.; Rouleau, N.; Lee, T.; Chan, D.; Wolting, C.; Edwards, A.; et al. A high throughput screen to identify substrates for the ubiquitin ligase rsp5. J. Biol. Chem. 2005, 280, 29470–29478. [Google Scholar] [CrossRef] [PubMed]
- Davierwala, A.P.; Haynes, J.; Li, Z.; Brost, R.L.; Robinson, M.D.; Yu, L.; Mnaimneh, S.; Ding, H.; Zhu, H.; Chen, Y.; et al. The synthetic genetic interaction spectrum of essential genes. Nat. Genet. 2005, 37, 1147–1152. [Google Scholar] [CrossRef]
- Schneiter, R.; Tatzer, V.; Gogg, G.; Leitner, E.; Kohlwein, S.D. Elo1p-dependent carboxy-terminal elongation of c14:1delta(9) to c16:1delta(11) fatty acids in saccharomyces cerevisiae. J. Bacteriol. 2000, 182, 3655–3660. [Google Scholar] [CrossRef] [PubMed]
- Trotter, P.J.; Hagerman, R.A.; Voelker, D.R. A yeast strain defective in oleic acid utilization has a mutation in the rml2 gene. Biochim. Biophys. Acta 1999, 1438, 223–238. [Google Scholar] [CrossRef]
- Keng, T. Hap1 and rox1 form a regulatory pathway in the repression of hem13 transcription in saccharomyces cerevisiae. Mol. Cell. Biol. 1992, 12, 2616–2623. [Google Scholar]
- Chu, X.; Qin, X.; Xu, H.; Li, L.; Wang, Z.; Li, F.; Xie, X.; Zhou, H.; Shen, Y.; Long, J. Structural insights into paf1 complex assembly and histone binding. Nucleic Acids Res. 2013, 41, 10619–10629. [Google Scholar] [CrossRef]
- Keogh, M.C.; Podolny, V.; Buratowski, S. Bur1 kinase is required for efficient transcription elongation by rna polymerase ii. Mol. Cell. Biol. 2003, 23, 7005–7018. [Google Scholar] [CrossRef] [PubMed]
- Hove-Jensen, B. Heterooligomeric phosphoribosyl diphosphate synthase of saccharomyces cerevisiae: Combinatorial expression of the five prs genes in escherichia coli. J. Biol. Chem. 2004, 279, 40345–40350. [Google Scholar] [CrossRef] [PubMed]
- Girrbach, V.; Strahl, S. Members of the evolutionarily conserved pmt family of protein o-mannosyltransferases form distinct protein complexes among themselves. J. Biol. Chem. 2003, 278, 12554–12562. [Google Scholar] [CrossRef] [PubMed]
- Ernst, J.F.; Prill, S.K. O-glycosylation. Med. Mycol. 2001, 39 (Suppl 1), 67–74. [Google Scholar]
- Nuoffer, C.; Jeno, P.; Conzelmann, A.; Riezman, H. Determinants for glycophospholipid anchoring of the saccharomyces cerevisiae gas1 protein to the plasma membrane. Mol. Cell. Biol. 1991, 11, 27–37. [Google Scholar]
- Hirayama, H.; Fujita, M.; Yoko-o, T.; Jigami, Y. O-mannosylation is required for degradation of the endoplasmic reticulum-associated degradation substrate gas1*p via the ubiquitin/proteasome pathway in saccharomyces cerevisiae. J. Biochem. 2008, 143, 555–567. [Google Scholar] [CrossRef] [PubMed]
- Mullen, J.R.; Kayne, P.S.; Moerschell, R.P.; Tsunasawa, S.; Gribskov, M.; Colavito-Shepanski, M.; Grunstein, M.; Sherman, F.; Sternglanz, R. Identification and characterization of genes and mutants for an n-terminal acetyltransferase from yeast. EMBO J. 1989, 8, 2067–2075. [Google Scholar] [PubMed]
- Levin, D.E. Cell wall integrity signaling in saccharomyces cerevisiae. Microbiol. Mol. Biol. Rev. 2005, 69, 262–291. [Google Scholar] [CrossRef] [PubMed]
- Arias, P.; Diez-Muniz, S.; Garcia, R.; Nombela, C.; Rodriguez-Pena, J.M.; Arroyo, J. Genome-wide survey of yeast mutations leading to activation of the yeast cell integrity mapk pathway: Novel insights into diverse mapk outcomes. BMC Genomics 2011, 12. [Google Scholar] [CrossRef]
- Prohl, C.; Pelzer, W.; Diekert, K.; Kmita, H.; Bedekovics, T.; Kispal, G.; Lill, R. The yeast mitochondrial carrier leu5p and its human homologue graves' disease protein are required for accumulation of coenzyme a in the matrix. Mol. Cell. Biol. 2001, 21, 1089–1097. [Google Scholar] [PubMed]
- Nikawa, J.; Tsukagoshi, Y.; Yamashita, S. Isolation and characterization of two distinct myo-inositol transporter genes of saccharomyces cerevisiae. J. Biol. Chem. 1991, 266, 11184–11191. [Google Scholar] [PubMed]
- Culbertson, M.R.; Henry, S.A. Inositol-requiring mutants of saccharomyces cerevisiae. Genetics 1975, 80, 23–40. [Google Scholar] [PubMed]
- Dean-Johnson, M.; Henry, S.A. Biosynthesis of inositol in yeast. Primary structure of myo-inositol-1-phosphate synthase (ec 5.5.1.4) and functional analysis of its structural gene, the ino1 locus. J. Biol. Chem. 1989, 264, 1274–1283. [Google Scholar]
- Selvarasu, S.; Ho, Y.S.; Chong, W.P.; Wong, N.S.; Yusufi, F.N.; Lee, Y.Y.; Yap, M.G.; Lee, D.Y. Combined in silico modeling and metabolomics analysis to characterize fed-batch cho cell culture. Biotechnol. Bioeng. 2012, 109, 1415–1429. [Google Scholar] [CrossRef] [PubMed]
- Amberger, J.S.; Bocchini, C.A.; Schiettecatte, F.; Scott, A.F.; Hamosh, A. Omim.Org: Online mendelian inheritance in man (omim(r)), an online catalog of human genes and genetic disorders. Nucleic Acids Res. 2015, 43. [Google Scholar] [CrossRef] [PubMed]
- Ruppel, N.J.; Kropp, K.N.; Davis, P.A.; Martin, A.E.; Luesse, D.R.; Hangarter, R.P. Mutations in geranylgeranyl diphosphate synthase 1 affect chloroplast development in arabidopsis thaliana (brassicaceae). Am. J. Bot. 2013, 100, 2074–2084. [Google Scholar] [CrossRef] [PubMed]
- Kainou, T.; Kawamura, K.; Tanaka, K.; Matsuda, H.; Kawamukai, M. Identification of the ggps1 genes encoding geranylgeranyl diphosphate synthases from mouse and human. Biochim. Biophys. Acta 1999, 1437, 333–340. [Google Scholar] [CrossRef]
- Douillard-Guilloux, G.; Raben, N.; Takikita, S.; Ferry, A.; Vignaud, A.; Guillet-Deniau, I.; Favier, M.; Thurberg, B.L.; Roach, P.J.; Caillaud, C.; et al. Restoration of muscle functionality by genetic suppression of glycogen synthesis in a murine model of pompe disease. Hum. Mol. Genet. 2010, 19, 684–696. [Google Scholar] [CrossRef] [PubMed]
- Cho, Y.Y.; Kang, M.J.; Sone, H.; Suzuki, T.; Abe, M.; Igarashi, M.; Tokunaga, T.; Ogawa, S.; Takei, Y.A.; Miyazawa, T.; et al. Abnormal uterus with polycysts, accumulation of uterine prostaglandins, and reduced fertility in mice heterozygous for acyl-coa synthetase 4 deficiency. Biochem. Bioph. Res. Co. 2001, 284, 993–997. [Google Scholar]
- Nadeau, J.H.; Kompf, J.; Siebert, G.; Taylor, B.A. Linkage of pgm-3 in the house mouse and homologies of three phosphoglucomutase loci in mouse and man. Biochem. Genet. 1981, 19, 465–474. [Google Scholar] [PubMed]
- Thierry-Mieg, D.; Thierry-Mieg, J. Aceview: A comprehensive cdna-supported gene and transcripts annotation. Genome Biol. 2006, 7 (Suppl 1), 11–14. [Google Scholar] [CrossRef] [PubMed]
- Wang, L.; Magdaleno, S.; Tabas, I.; Jackowski, S. Early embryonic lethality in mice with targeted deletion of the ctp:Phosphocholine cytidylyltransferase alpha gene (pcyt1a). Mol. Cell. Biol. 2005, 25, 3357–3363. [Google Scholar] [CrossRef] [PubMed]
- Wu, G.; Aoyama, C.; Young, S.G.; Vance, D.E. Early embryonic lethality caused by disruption of the gene for choline kinase alpha, the first enzyme in phosphatidylcholine biosynthesis. J. Biol. Chem. 2008, 283, 1456–1462. [Google Scholar] [CrossRef]
- Fan, L.; Kadura, I.; Krebs, L.E.; Hatfield, C.C.; Shaw, M.M.; Frye, C.C. Improving the efficiency of cho cell line generation using glutamine synthetase gene knockout cells. Biotechn. Bioeng. 2012, 109, 1007–1015. [Google Scholar] [CrossRef] [PubMed]
- Greig, K.T.; Antonchuk, J.; Metcalf, D.; Morgan, P.O.; Krebs, D.L.; Zhang, J.G.; Hacking, D.F.; Bode, L.; Robb, L.; Kranz, C.; et al. Agm1/pgm3-mediated sugar nucleotide synthesis is essential for hematopoiesis and development. Mol. Cell. Biol. 2007, 27, 5849–5859. [Google Scholar] [CrossRef] [PubMed]
- Ma, H.W.; Zeng, A.P. The connectivity structure, giant strong component and centrality of metabolic networks. Bioinformatics 2003, 19, 1423–1430. [Google Scholar] [CrossRef]
- Suthers, P.F.; Zomorrodi, A.; Maranas, C.D. Genome-scale gene/reaction essentiality and synthetic lethality analysis. Mol. Syst. Biol. 2009, 5. [Google Scholar] [CrossRef]
- Hsiang, Y.H.; Liu, L.F. Identification of mammalian DNA topoisomerase i as an intracellular target of the anticancer drug camptothecin. Cancer Res. 1988, 48, 1722–1726. [Google Scholar] [PubMed]
- Mo, M.L.; Palsson, B.O.; Herrgard, M.J. Connecting extracellular metabolomic measurements to intracellular flux states in yeast. BMC Syst. Biol. 2009, 3. [Google Scholar] [CrossRef] [PubMed]
- Otterstedt, K.; Larsson, C.; Bill, R.M.; Stahlberg, A.; Boles, E.; Hohmann, S.; Gustafsson, L. Switching the mode of metabolism in the yeast saccharomyces cerevisiae. EMBO Rep. 2004, 5, 532–537. [Google Scholar] [CrossRef]
- Riordan, J.R.; Ling, V. Purification of p-glycoprotein from plasma membrane vesicles of chinese hamster ovary cell mutants with reduced colchicine permeability. J. Biol. Chem. 1979, 254, 12701–12705. [Google Scholar] [PubMed]
- Stanners, C.P.; Eliceiri, G.L.; Green, H. Two types of ribosome in mouse-hamster hybrid cells. Nature 1971, 230, 52–54. [Google Scholar] [CrossRef]
- Chowdhury, A.; Zomorrodi, A.R.; Maranas, C.D. K-optforce: Integrating kinetics with flux balance analysis for strain design. PLoS Comput. Biol. 2014, 10. [Google Scholar] [CrossRef]
- Schellenberger, J.; Que, R.; Fleming, R.M.; Thiele, I.; Orth, J.D.; Feist, A.M.; Zielinski, D.C.; Bordbar, A.; Lewis, N.E.; Rahmanian, S.; et al. Quantitative prediction of cellular metabolism with constraint-based models: The cobra toolbox v2.0. Nat. Protoc. 2011, 6, 1290–1307. [Google Scholar] [CrossRef]
- O'Brien, E.J.; Lerman, J.A.; Chang, R.L.; Hyduke, D.R.; Palsson, B.O. Genome-scale models of metabolism and gene expression extend and refine growth phenotype prediction. Mol. Syst. Biol. 2013, 9. [Google Scholar] [CrossRef]
- Lerman, J.A.; Hyduke, D.R.; Latif, H.; Portnoy, V.A.; Lewis, N.E.; Orth, J.D.; Schrimpe-Rutledge, A.C.; Smith, R.D.; Adkins, J.N.; Zengler, K.; et al. In silico method for modelling metabolism and gene product expression at genome scale. Nat. Commun. 2012, 3. [Google Scholar] [CrossRef] [PubMed]
© 2015 by the authors; licensee MDPI, Basel, Switzerland. This article is an open access article distributed under the terms and conditions of the Creative Commons Attribution license (http://creativecommons.org/licenses/by/4.0/).
