A Novel Methodology to Estimate Metabolic Flux Distributions in Constraint-Based Models

Abstract
:1. Introduction


2. Methodology
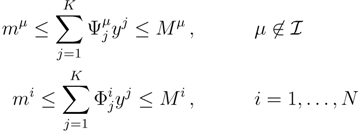
2.1. Mathematical Statement of the Problem
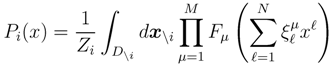
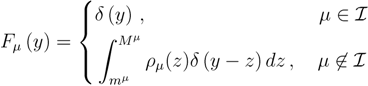
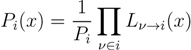
 is the domain of integration (the set-product of the ranges of variability of all fluxes, except flux i) and Zi ≡ ∫dxPi(x) is a normalisation constant, so that each Pi(x) is properly normalised to one. Each indicator function Fµ should distinguish between metabolites involved only in internal reactions (µ ∈
  for brevity) and metabolites that are exchanged with the surrounding. A convenient parameterisation is given by:
2.2. Weighted Belief Propagation

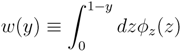
 variables and associated weights, rather than discretizing them as one would normally do when facing a similar problem. Let us illustrate the idea with a fairly simple example. Consider the integral:
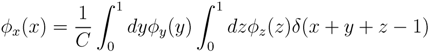
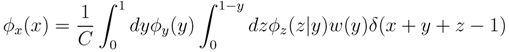
 y, z are known densities normalised in the interval [0, 1], and C is a normalisation constant. To evaluate (12), we could use Monte Carlo integration and draw pairs of random variables
  according to the distributions, y and z. Correspondingly, an estimate for x(x) can be written as:
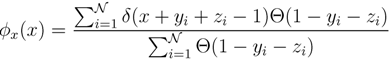
 z(z) is not normalised in the interval [0, 1 − y]. Introducing the corresponding weight:
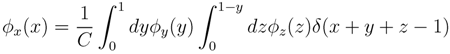
 z(z|y) ≡ (z)/w(y). The distributions appearing above are now properly normalized. Therefore, to evaluate Equation (16), we can simply draw pairs according to y(y) and z(z|y), respectively, and estimate x(x) by:
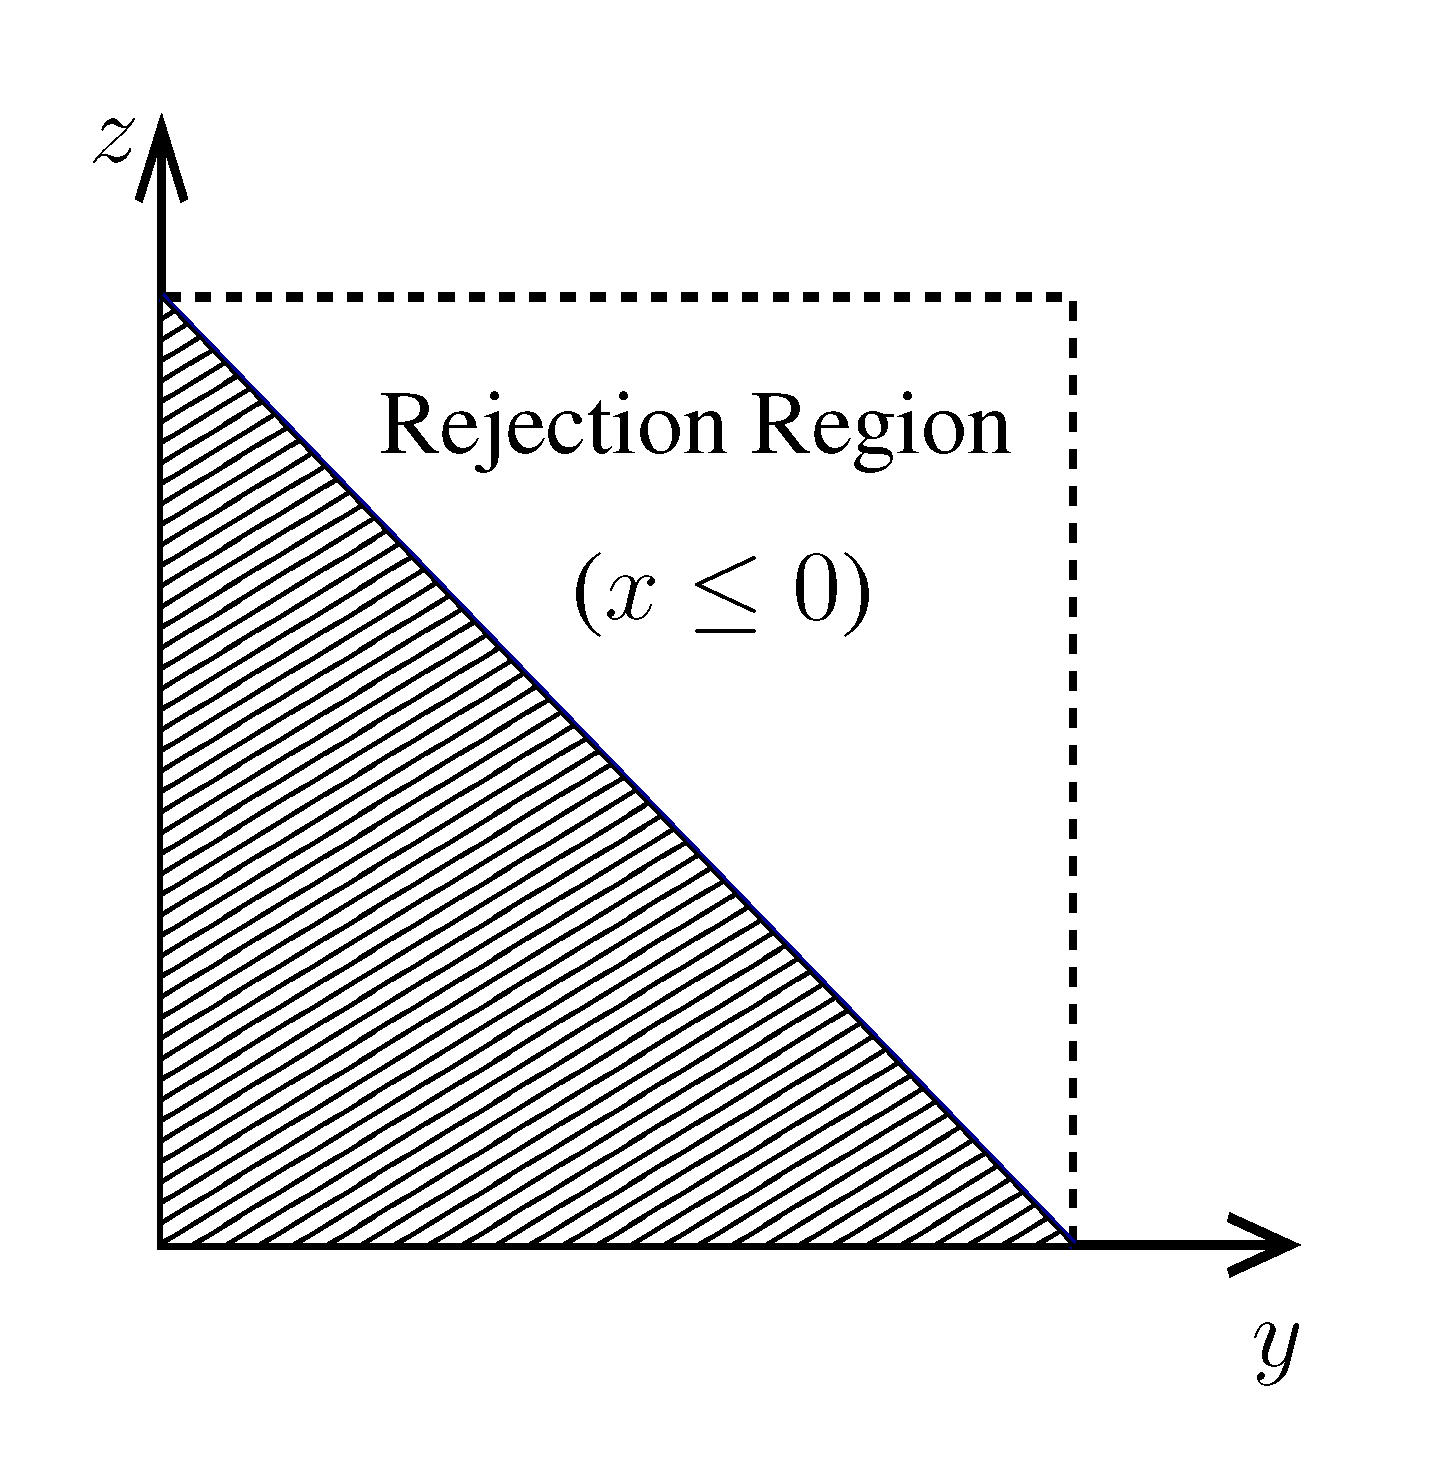
 pairs of variables and weights
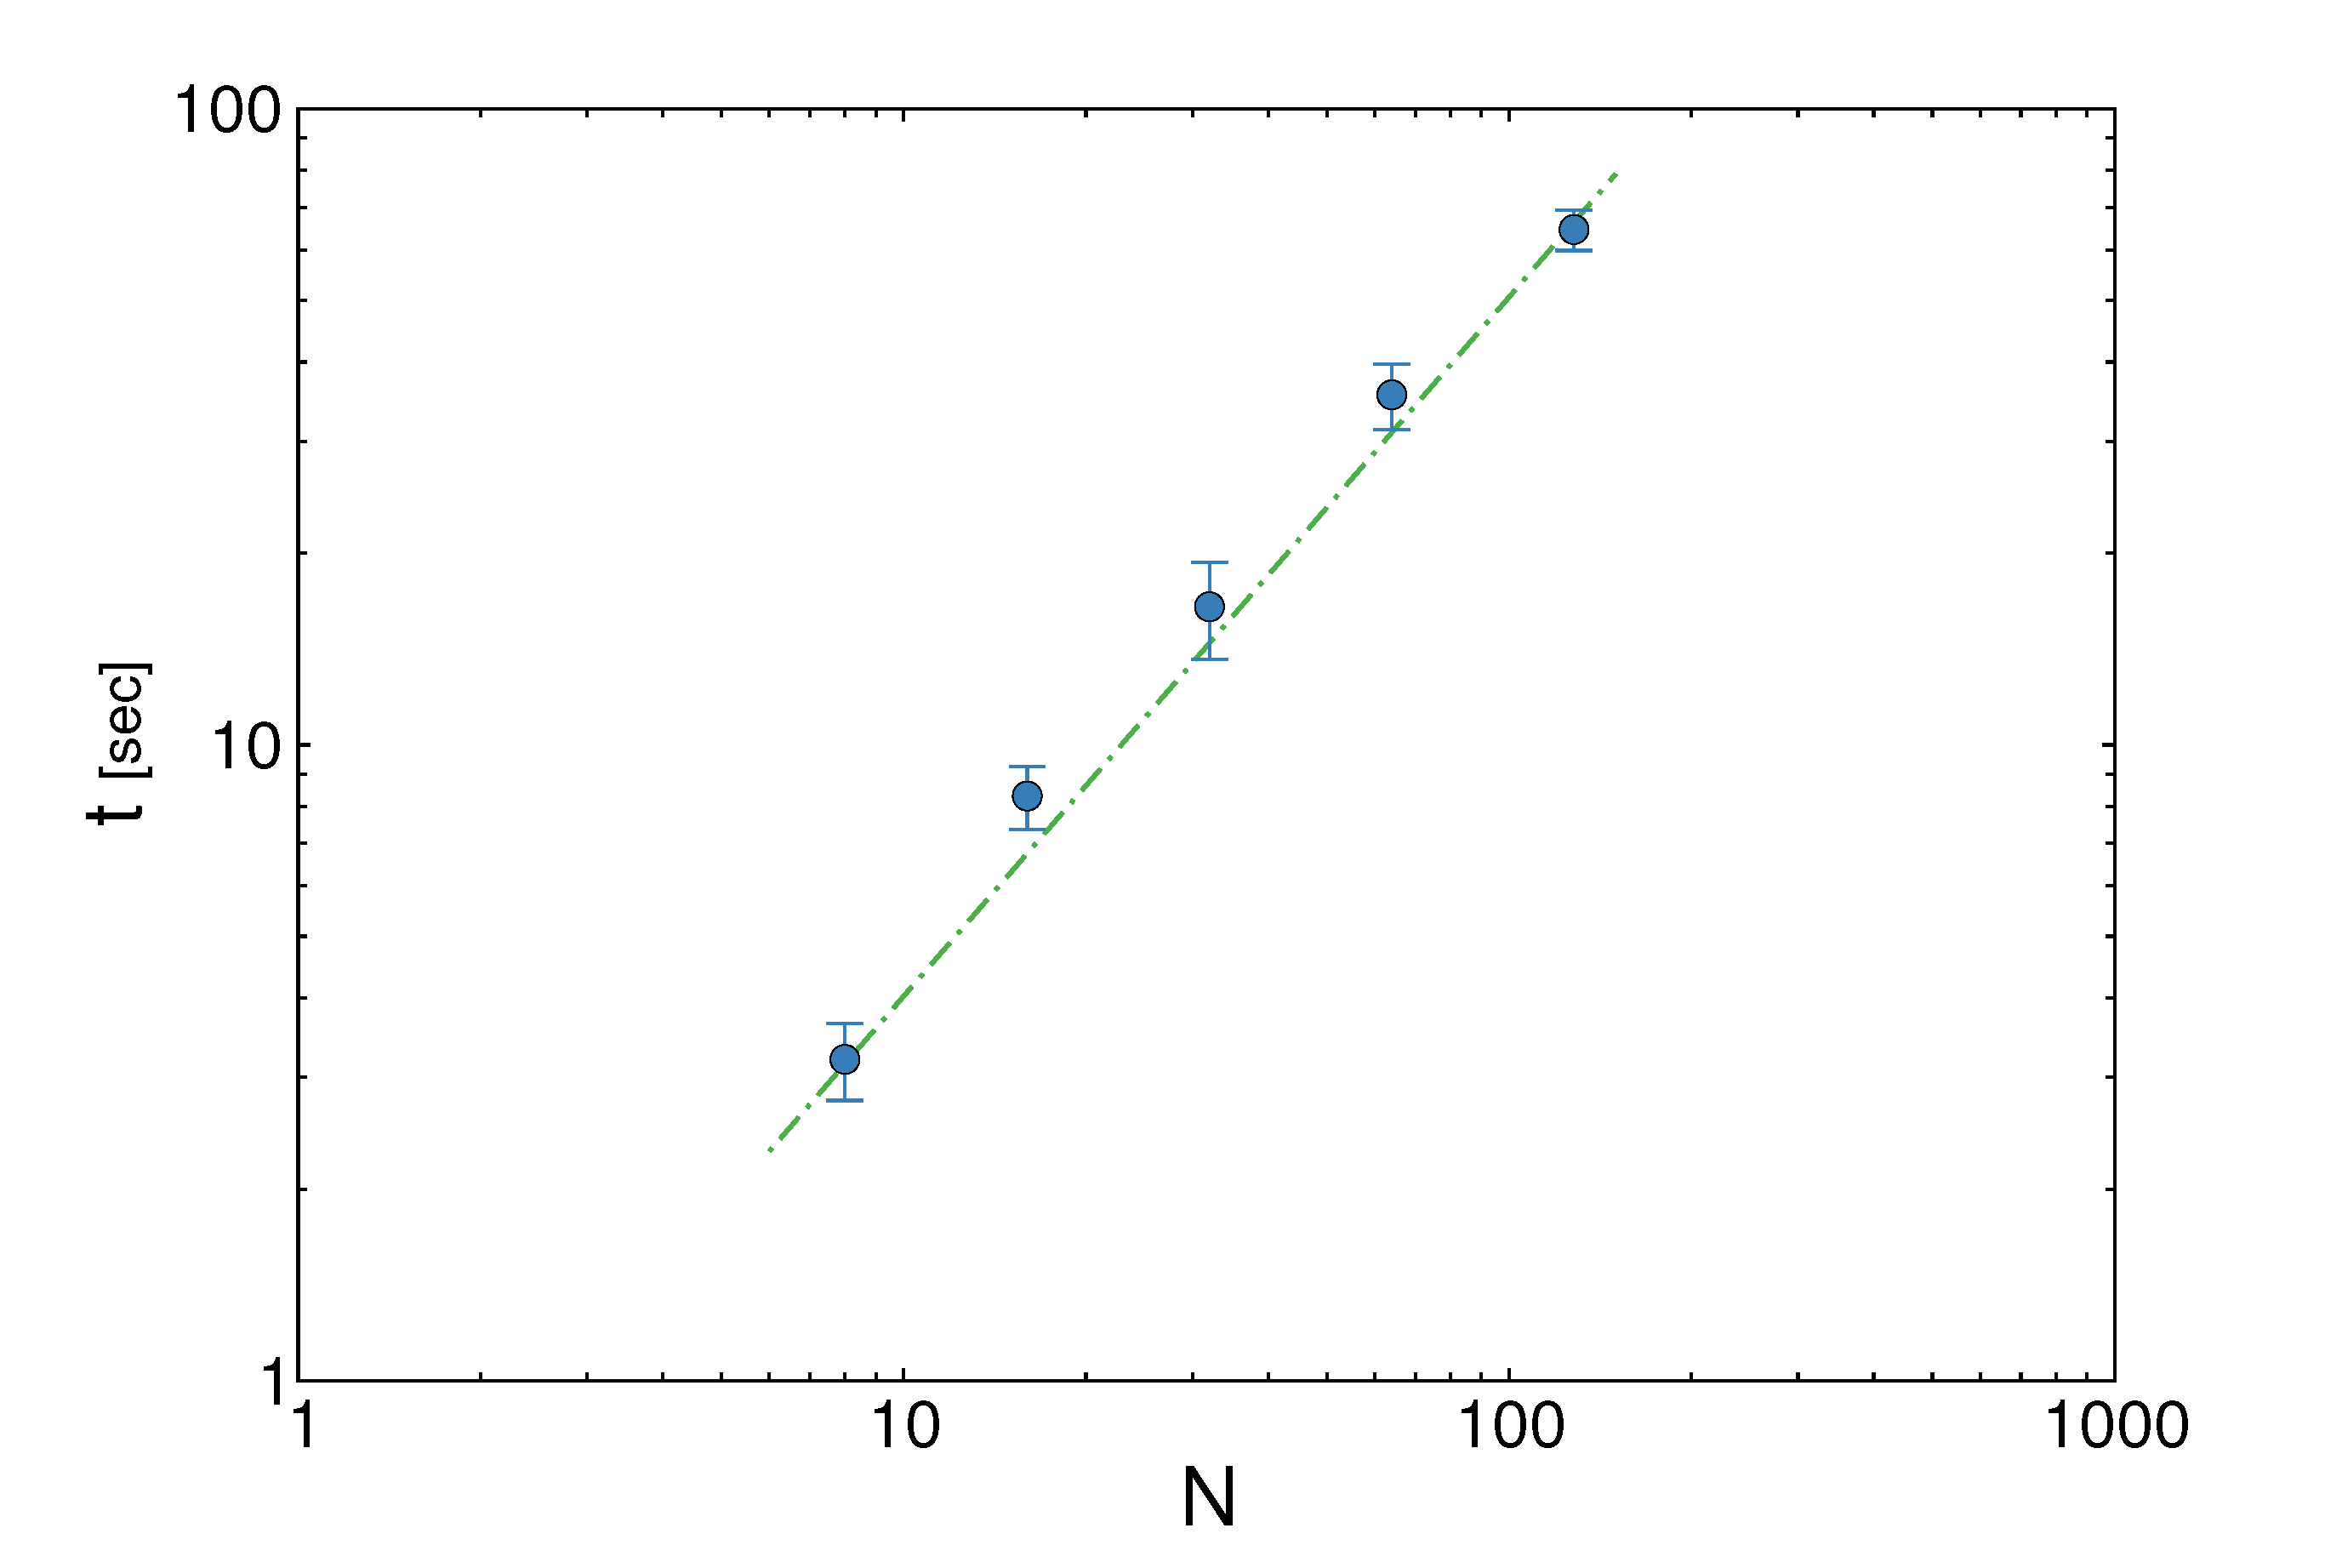
 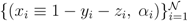 .z(z|y), has a y-dependent support, such that rejection never occurs. Thus, at a price of computing a weight, w(y), we overcome the whole rejection issue, and the method becomes much more efficient. , its running time goes as O(2Nk), where k is the average number of metabolites processed by each reaction. Thus, as opposed to sampling techniques that have normally super-linear mixing times [14], wBP only scales linearly with the number of reactions (see Figure 3), making it an ideal candidate for application to genome-scale metabolic networks. In the present work, we focus, however, on the relatively small case of the hRBC, so that we are able to compare with sampling methods that yield a uniform exploration of the solution space S [8]. Due to the nature of such methods (see next section), this type of comparison is still not feasible for larger systems. This, and the fact that previous results are available [9], make the metabolic network of the hRBC the ideal testing ground for wBP. x(x). However, in this lower triangle, the density, y(y) z(z), is no longer normalised. This is easily dealt with by reweighting the integral.
x(x). However, in this lower triangle, the density, y(y) z(z), is no longer normalised. This is easily dealt with by reweighting the integral.
.z(z|y), has a y-dependent support, such that rejection never occurs. Thus, at a price of computing a weight, w(y), we overcome the whole rejection issue, and the method becomes much more efficient. , its running time goes as O(2Nk), where k is the average number of metabolites processed by each reaction. Thus, as opposed to sampling techniques that have normally super-linear mixing times [14], wBP only scales linearly with the number of reactions (see Figure 3), making it an ideal candidate for application to genome-scale metabolic networks. In the present work, we focus, however, on the relatively small case of the hRBC, so that we are able to compare with sampling methods that yield a uniform exploration of the solution space S [8]. Due to the nature of such methods (see next section), this type of comparison is still not feasible for larger systems. This, and the fact that previous results are available [9], make the metabolic network of the hRBC the ideal testing ground for wBP. x(x). However, in this lower triangle, the density, y(y) z(z), is no longer normalised. This is easily dealt with by reweighting the integral.
x(x). However, in this lower triangle, the density, y(y) z(z), is no longer normalised. This is easily dealt with by reweighting the integral. 

2.3. The Kernel Hit-and-Run (KHR) Algorithm

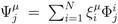
 | equations in (18) defines the null-space of ξ, and geometrically corresponds to a family of hyperplanes passing through the origin x = 0. Let us denote the dimension of the null space of ξ as K. Clearly, K would be at least N − | | (actually K = N − | | when ξ has full row rank, which can always be made to be the case and which we assume from now on). This means, obviously, that, although the number of variables in the system is N, due to the constraints in the model, the actual dimension of the solution space S is only K. As in real metabolic networks most reactions are internal, the dimension K of the null space will be significantly smaller than the original dimension of the problem N. Additionally, it turns out that the way to implement in practice such a dimensional reduction is quite straightforward: suppose that a basis of the null-space has been found, e.g., through Gaussian elimination or singular value decomposition (SVD), and let us denote as y = (y1,...,yK) the system of coordinates with respect to such a basis, so that we can write each flux in this basis as
 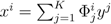 , with Φ an N × K matrix related to the change of basis between the original space and the null subspace. Plugging this into Equations (19) and (20) allows us to write:
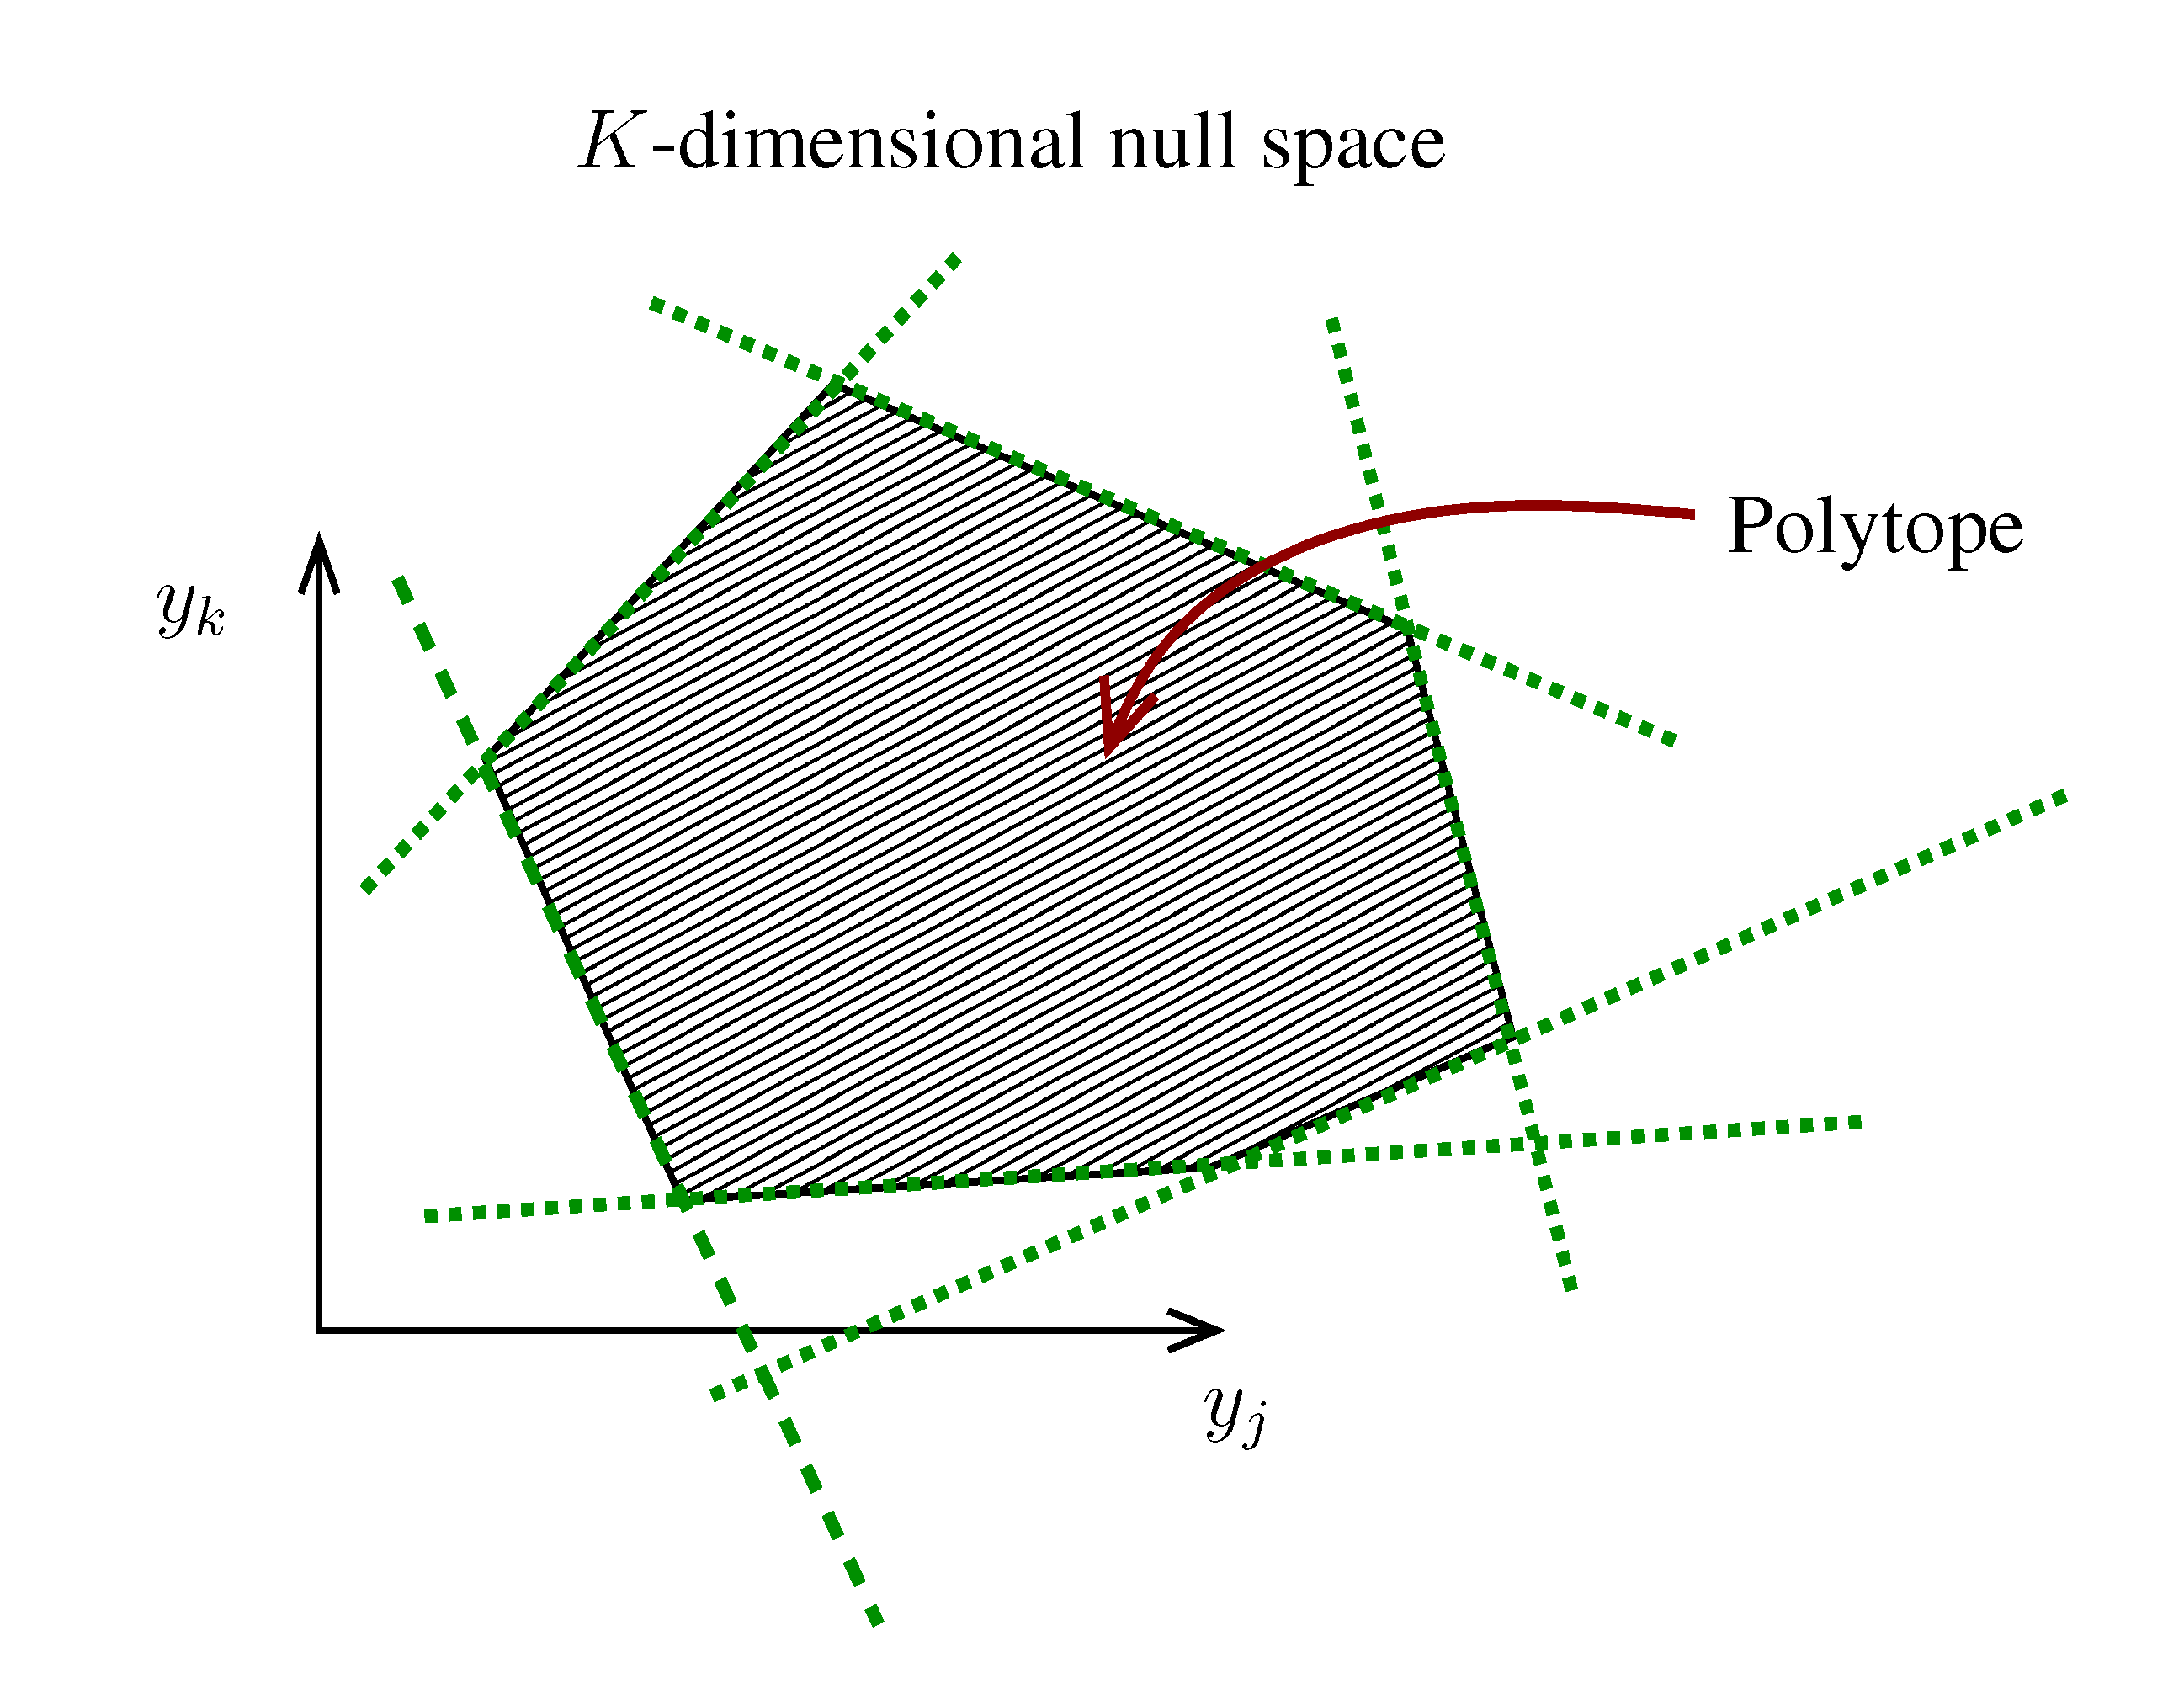
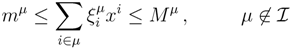
 . The set of Equations (21) defines a K-dimensional polytope in the null space (see Figure 4), which can be sampled uniformly by using the Hit-and-Run algorithm [8,15,16]. Finally, to go back to the original space, that of the reaction rates, we simply use the fact that
 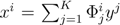 . The sampling properties of the Hit-and-Run algorithm under the uniform measure were indeed mathematically proven [8], and in our case, it is very easy to see that the uniform measure in the K-dimensional null space is preserved under a linear transformation, so that the final sample in the full-dimensional space is also uniform by construction. | metabolites that are exchanged with the environment suffice to bound the polytope in the null space.
3. Results and Discussion
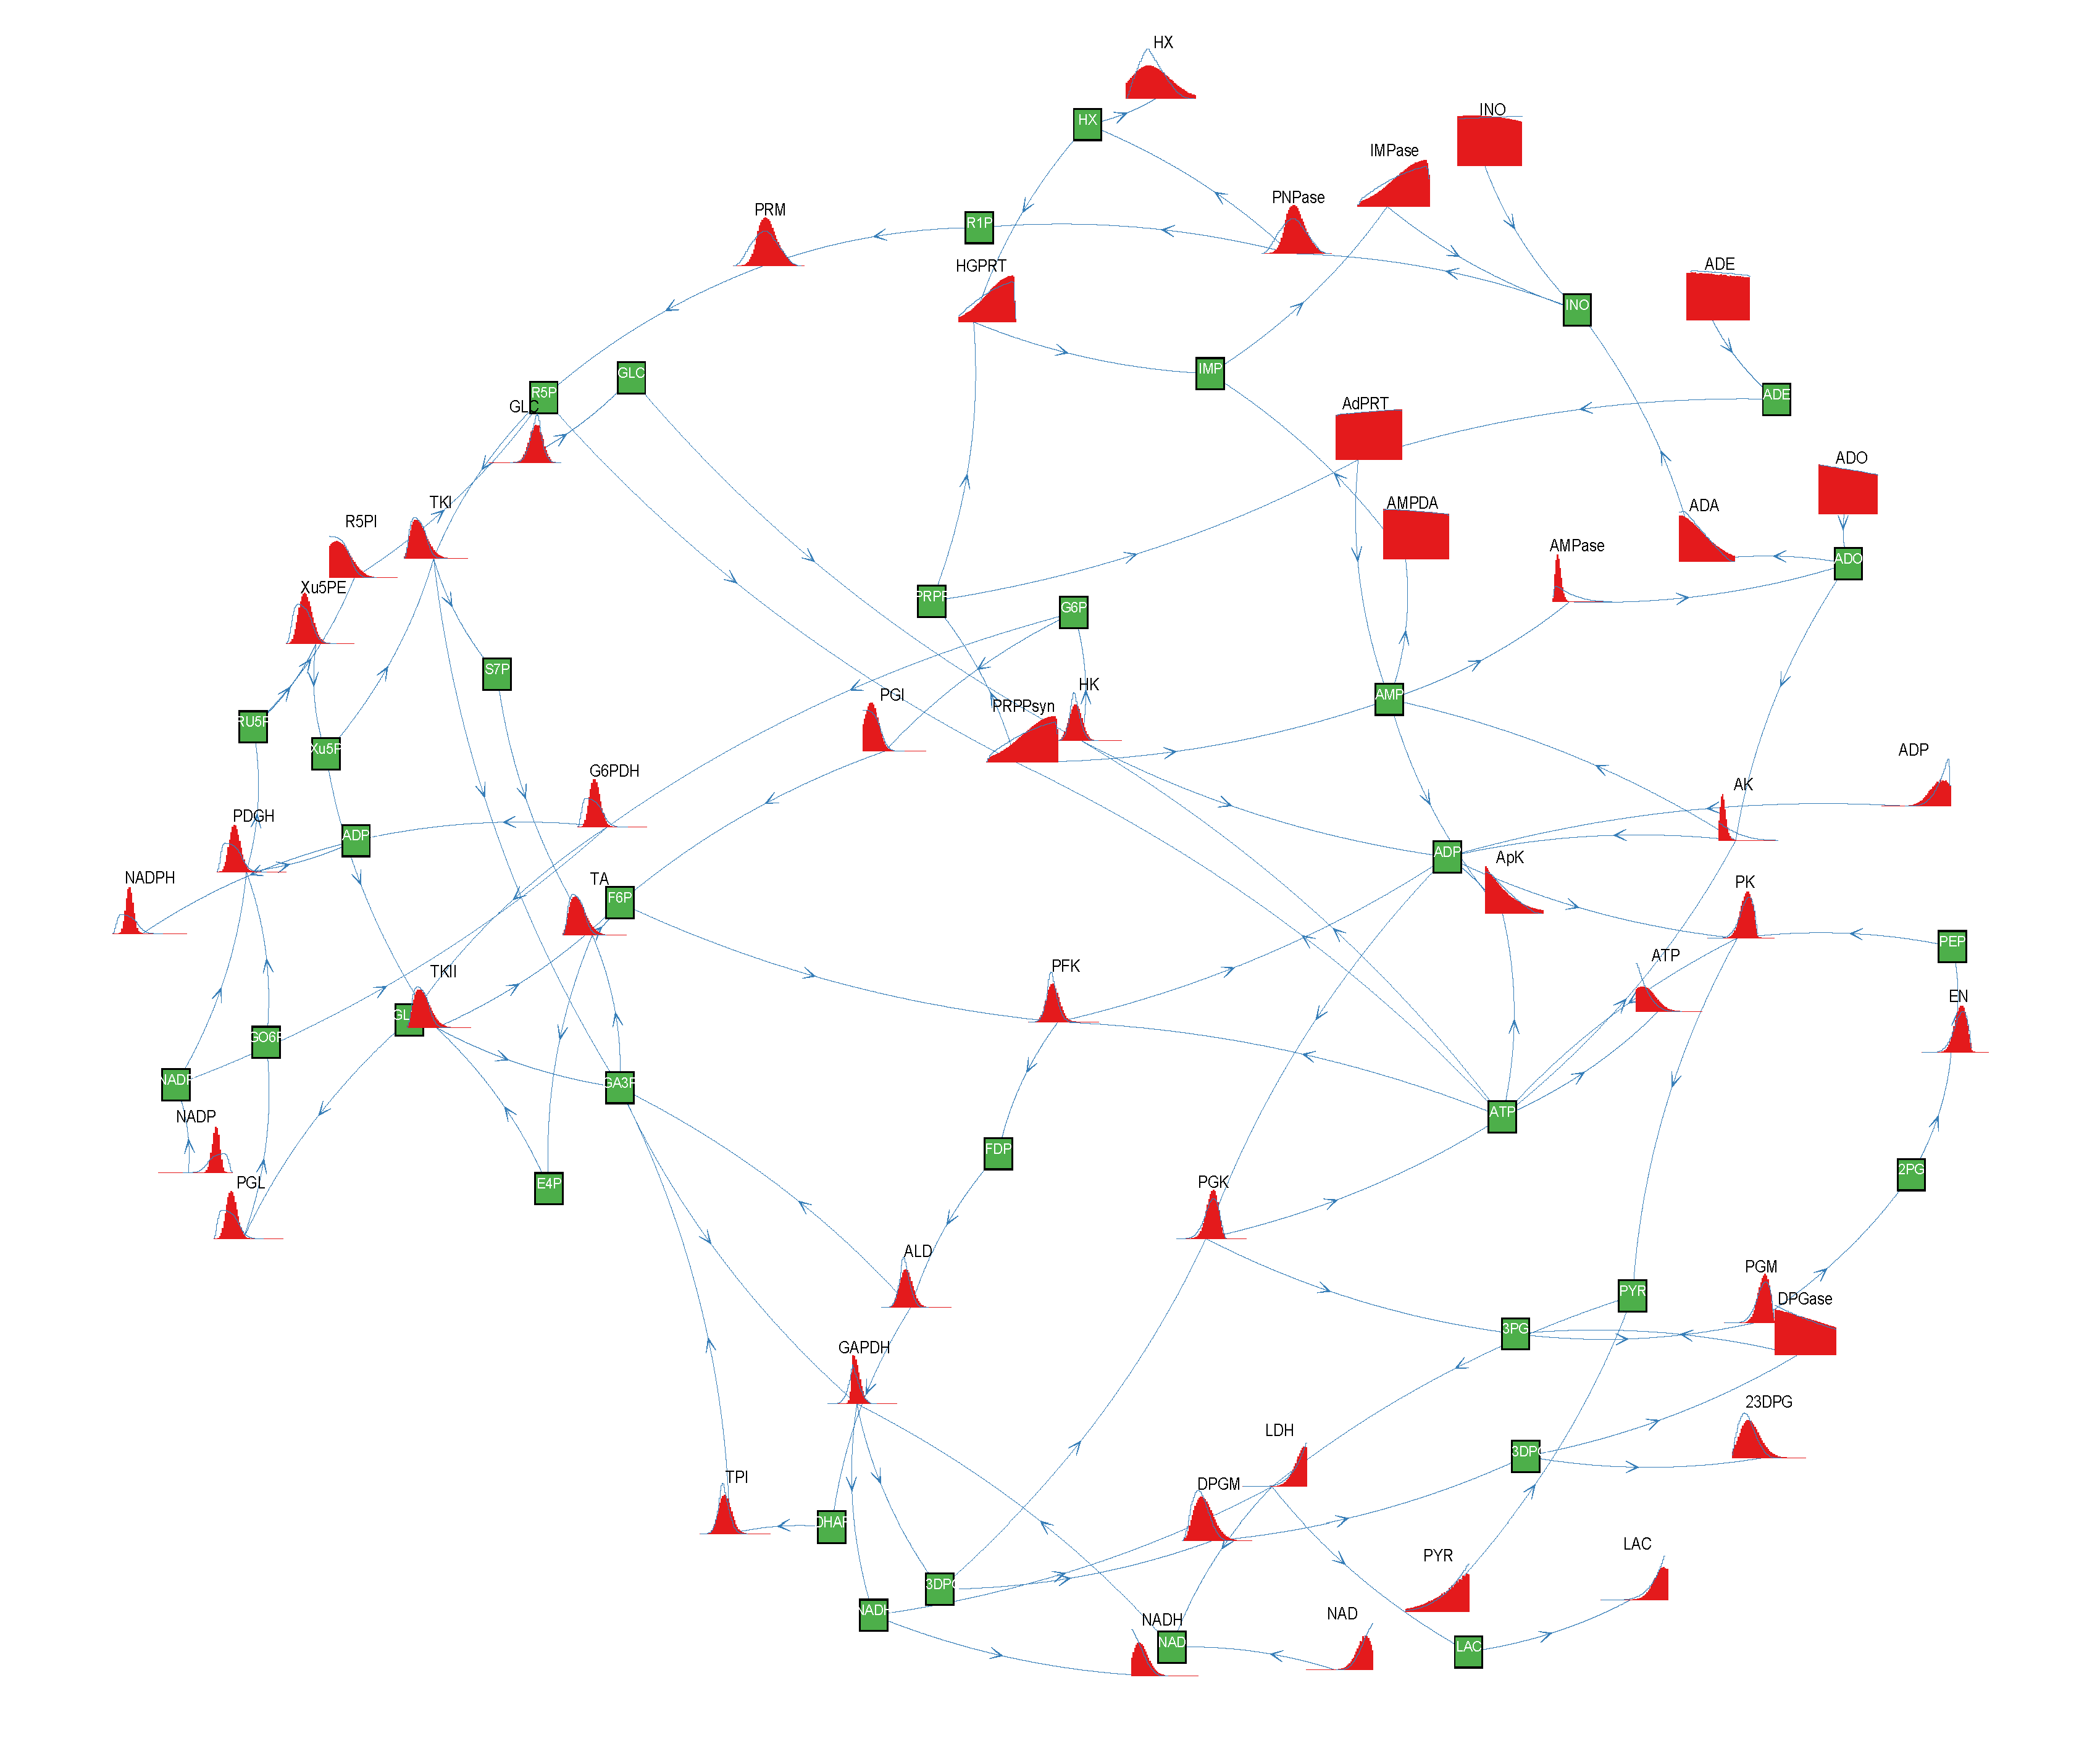
 of size = 500. To solve the fixed point equations (9) and (10), we performed 30 iterations of our method. We started with uniform weights
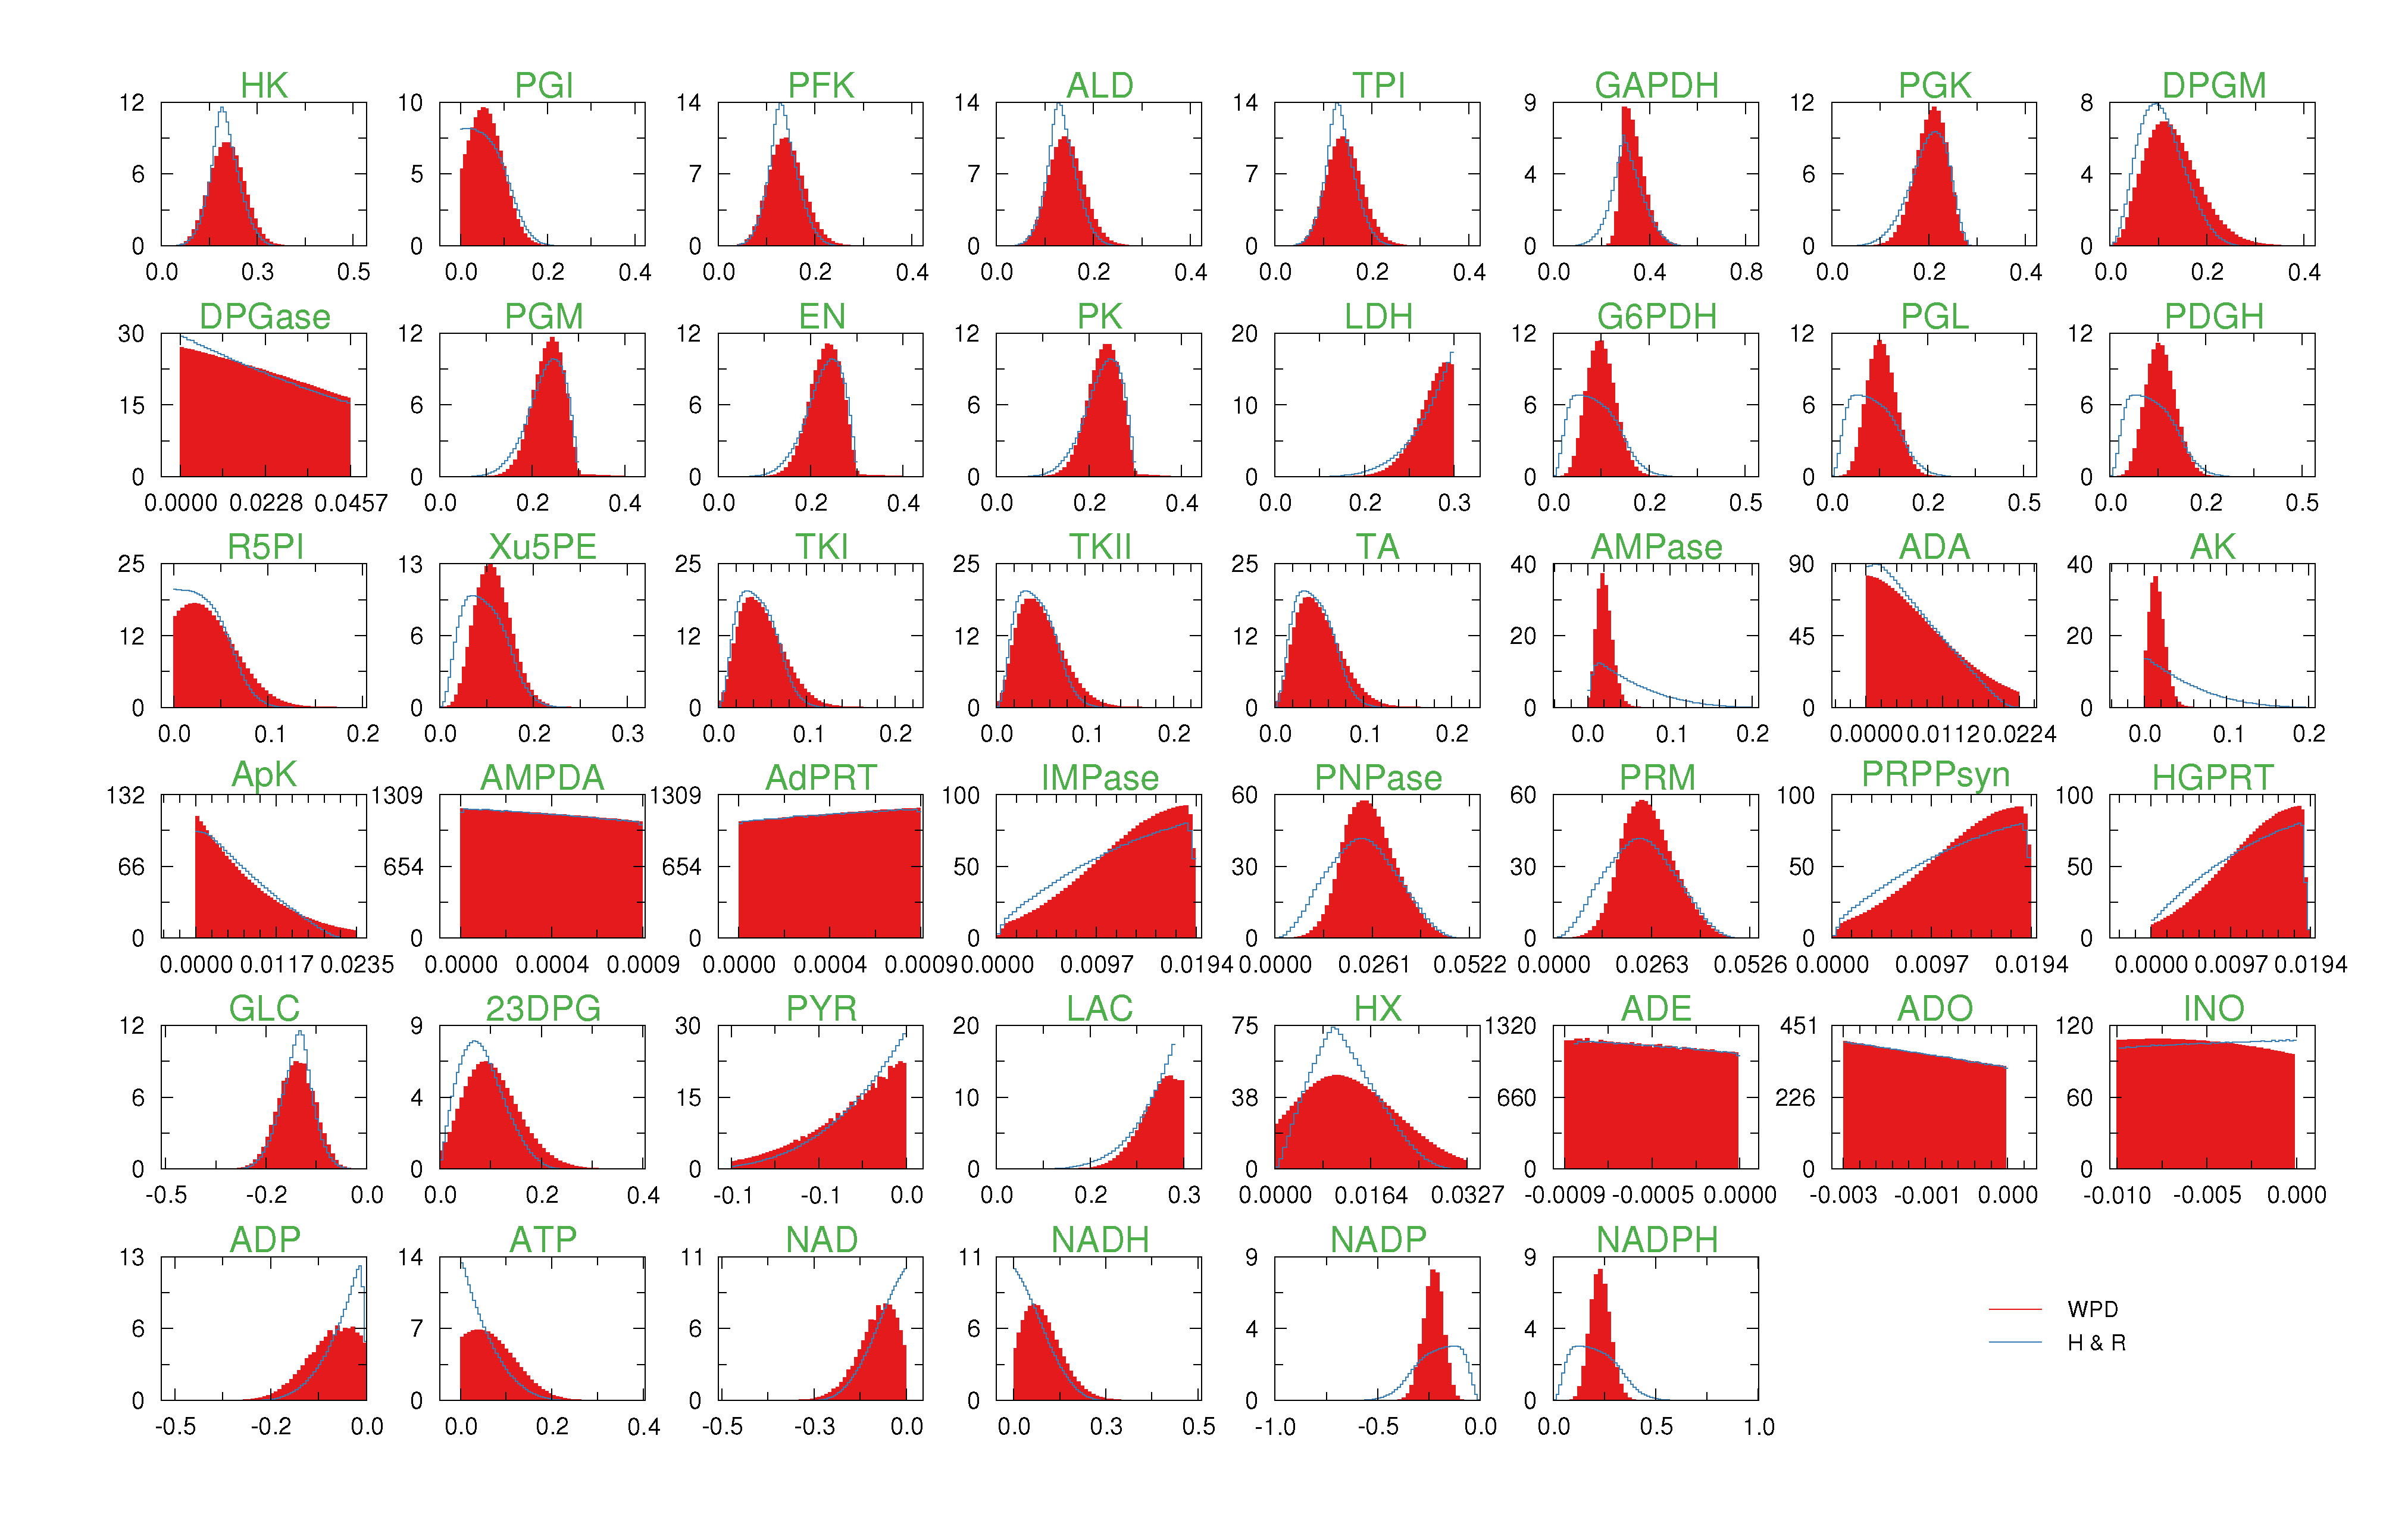
  and, at each iteration t = 1,..., 30, and for each fixed value of the variable xi, we applied wBP 103 × t times to evaluate the average weight αi. Once convergence was reached, we used the variable/weight sets to compute the final 46 PDFs, Pi(x) and Pµ(γ), according to Equation (11). In this last step, we averaged the weight values over 105 wBP extractions to achieve a higher accuracy. We report the results in Figure 5 and Figure 6, where we compare our method with KHR; the agreement is excellent. The reaction PDFs obtained with both methods have indeed a very similar domain and shape in most of the cases. Notably, wBP does not perfectly capture the profile of reactions involving currency metabolites, such as ATP, ADP, NADP and NADPH. An explanation of this may lie in the fact that these compounds are highly connected in metabolic networks and likely to be involved in small loops that are not considered by the wBP method.

4. Conclusions
Acknowledgments
Conflicts of Interest
References
- Bowman, S.; Churcher, C.; Badcock, K.; Brown, D.; Chillingworth, T.; Connor, R.; Dedman, K.; Devlin, K.; Gentles, S.; Hamlin, N. The nucleotide sequence of Saccharomyces cerevisiae chromosome XIII. Nature 1997, 387, 90–92. [Google Scholar] [CrossRef]
- Feist, A.; Henry, C.; Reed, J.; Krummenacker, M.; Joyce, A.; Karp, P.D.; Broadbelt, L.J.; Hatzimanikatis, V.; Palsson, B.Ø. A genome-scale metabolic reconstruction for Escherichia coli K-12 MG1655 that accounts for 1260 ORFs and thermodynamic information. Mol. Syst. Biol. 2007. [Google Scholar] [CrossRef]
- Thiele, I.; Palsson, B.O. A protocol for generating a high-quality genome-scale metabolic reconstruction. Nat. Protoc. 2010, 5, 93–121. [Google Scholar] [CrossRef]
- Thiele, I.; Swainston, N.; Fleming, R.M.T.; Hoppe, A.; Sahoo, S.; Aurich, M.K.; Haraldsdottir, H.; Mo, M.L.; Rolfsson, O.; Stobbe, M.D.; et al. A community-driven global reconstruction of human metabolism. Nat. Biotechnol. 2013, 31, 419–425. [Google Scholar] [CrossRef] [Green Version]
- Kauffman, K.J.; Prakash, P.; Edwards, J.S. Advances in flux balance analysis. Curr. Opin. Biotechnol. 2003, 14, 491–496. [Google Scholar] [CrossRef]
- Orth, J.; Thiele, I.; Palsson, B. What is flux balance analysis? Nat. Biotechnol. 2010, 28, 245–248. [Google Scholar]
- Schellenberger, J.; Palsson, B.Ø. Use of randomized sampling for analysis of metabolic networks. J. Biol. Chem. 2009, 284, 5457–5461. [Google Scholar] [CrossRef]
- Lovász, L. Hit-and-run mixes fast. Math. Progr. 1999, 86, 443–461. [Google Scholar] [CrossRef]
- Braunstein, A.; Mulet, R.; Pagnani, A. Estimating the size of the solution space of metabolic networks. BMC Bioinforma. 2008. [Google Scholar] [CrossRef]
- Mezard, M.; Montanari, A. Information, Physics, and Computation; Oxford University Press: Oxford, UK, 2009. [Google Scholar]
- Font-Clos, F.; Massucci, F.A.; Pérez Castillo, I. A weighted belief-propagation algorithm for estimating volume-related properties of random polytopes. J. Stat. Mech. Theory Exp. 2012. [Google Scholar] [CrossRef]
- Price, N.D.; Schellenberger, J.; Palsson, B.O. Uniform sampling of steady-state flux spaces: Means to design experiments and to interpret enzymopathies. Biophys. J. 2004, 87, 2172–2186. [Google Scholar] [CrossRef]
- Almaas, K.; Kovacs, B.; Vicsek, T.; Oltvai, Z.M.; Barabasi, A.L. Global organization of metabolic fluxes in the bacterium Escherichia coli. Nature 2004, 427, 839–843. [Google Scholar] [CrossRef]
- Simonovits, M. How to compute the volume in high dimension? Math. Progr. 2003, 97, 337–374. [Google Scholar]
- Smith, R.L. Efficient Monte Carlo procedures for generating points uniformly distributed over bounded regions. Oper. Res. 1984, 32, 1296–1308. [Google Scholar] [CrossRef]
- Berbee, H.; Boender, C.; Ran, A.R.; Scheffer, C.; Smith, R.; Telgen, J. Hit-and-run algorithms for the identification of nonredundant linear inequalities. Math. Progr. 1987, 37, 184–207. [Google Scholar] [CrossRef]
- Wiback, S.J.; Famili, I.; Greenberg, H.J.; Palsson, B.Ø. Monte Carlo sampling can be used to determine the size and shape of the steady-state flux space. J. Theor. Biol. 2004, 228, 437–447. [Google Scholar] [CrossRef]
- Wiback, S.J.; Mahadevan, R.; Palsson, B.Ø. Reconstructing metabolic flux vectors from extreme pathways: Defining the -spectrum. J. Theor. Biol. 2003, 224, 313–324. [Google Scholar] [CrossRef]
- Wiback, S.J.; Palsson, B.O. Extreme pathway analysis of human red blood cell metabolism. Biophys. J. 2002, 83, 808–818. [Google Scholar] [CrossRef]
- Krauth, W.; Mezard, M. Learning algorithms with optimal stability in neural networks. J. Phys. A 1987. [Google Scholar] [CrossRef]
- Wodke, J.A.H.; Puchalka, J.; Lluch-Senar, M.; Marcos, J.; Yus, E.; Godinho, M.; Gutierrez-Gallego, R.; dos Santos, V.A.P.M.; Serrano, L.; Klipp, E.; Maier, T. Dissecting the energy metabolism in Mycoplasma pneumoniae through genome-scale metabolic modeling. Mol. Syst. Biol. 2013, 9. [Google Scholar] [CrossRef]
© 2013 by the authors; licensee MDPI, Basel, Switzerland. This article is an open access article distributed under the terms and conditions of the Creative Commons Attribution license (http://creativecommons.org/licenses/by/3.0/).
Share and Cite
Massucci, F.A.; Font-Clos, F.; De Martino, A.; Castillo, I.P. A Novel Methodology to Estimate Metabolic Flux Distributions in Constraint-Based Models. Metabolites 2013, 3, 838-852. https://doi.org/10.3390/metabo3030838
Massucci FA, Font-Clos F, De Martino A, Castillo IP. A Novel Methodology to Estimate Metabolic Flux Distributions in Constraint-Based Models. Metabolites. 2013; 3(3):838-852. https://doi.org/10.3390/metabo3030838
Chicago/Turabian StyleMassucci, Francesco Alessandro, Francesc Font-Clos, Andrea De Martino, and Isaac Pérez Castillo. 2013. "A Novel Methodology to Estimate Metabolic Flux Distributions in Constraint-Based Models" Metabolites 3, no. 3: 838-852. https://doi.org/10.3390/metabo3030838