Article

Angiotensin-Converting Enzyme Inhibitory Activity of Selected Phenolic Acids, Flavonoids, Their O-Glucosides, and Low-Molecular-Weight Phenolic Metabolites in Relation to Their Oxidation Potentials

by
Danuta Zielińska
1,
Małgorzata Starowicz
2,
Małgorzata Wronkowska
2 and
Henryk Zieliński
2,*
1
Department of Chemistry, University of Warmia and Mazury in Olsztyn, Plac Łódzki 4, 10-721 Olsztyn, Poland
2
Team of Chemistry and Biodynamics of Food, Institute of Animal Reproduction and Food Research, Polish Academy of Sciences, Trylińskiego 18, 10-683 Olsztyn, Poland
*
Author to whom correspondence should be addressed.
Metabolites 2025, 15(7), 443; https://doi.org/10.3390/metabo15070443
Submission received: 15 May 2025 / Revised: 12 June 2025 / Accepted: 28 June 2025 / Published: 1 July 2025
(This article belongs to the Special Issue Flavonoids: Novel Therapeutic Potential for Chronic Diseases)

Abstract

Background/Objectives: In this study, the angiotensin-converting enzyme (ACE) inhibitory activity of selected phenolic acids, flavonoids, their O-glucosides, and low-molecular-weight phenolic metabolites was addressed to show their importance against blood hypertension. Methods: A fluorescence assay was used for the determination of the ACE inhibitory activity, whereas the first anodic peak oxidation potential ( E p a ) was provided by the differential pulse voltammetry (DPV) method. The relationship between the ACE inhibitory activity and E p a was evaluated. Results: Phenolic acids showed a very low ACE inhibitory activity, and their rank was chlorogenic acid > p-coumaric acid > sinapic acid > gentisic acid > ferulic acid > syringic acid > vanillic acid > protocatechuic acid > caffeic acid. The low-molecular-weight phenolic metabolites of flavonoids showed a moderate ACE inhibitory activity. In contrast, flavonoid aglicones had the highest ACE inhibitory activity, and the order was luteolin > quercetin > kaempferol > cyanidin > delphinidin > pelargonin > naringenin. A lower inhibition activity was noted for quercetin-3-O-glucoside, luteolin-4′-O-glucosides, cyanidin-3-O-glucoside, and pelargonidin-3-O-glucosides, whereas a higher ACE inhibition activity was observed for 7-O-glucosides of luteolin, apigenin, and kaempferol. A lack of correlation was found between the IC50 of phenolic acids, low-molecular-weight phenolic metabolites, and their E p a values. In contrast, weak positive correlations were found between the IC50 of aglicons, 3-O-glucosides, 7-O-glucosides, and their E p a values provided by the DPV (r = 0.61, r = 0.66 and r = 0.88, respectively). Conclusions: This study expands our knowledge of the ACE inhibitory activity of phenolic compounds.

1. Introduction

Cardiovascular disease (CVD) is closely related to high blood pressure [1]. The regulation of blood pressure involves pharmacological therapies and non-pharmacological management or lifestyle changes following a healthy diet [2]. Angiotensin-I converting enzyme (ACE) plays a key physiological role in the control of blood pressure in the rennin–angiotensin system [3]. ACE converts the inactive decapeptide, angiotensin I, to the potent vasopressor octapeptide, angiotensin II, and inactivates bradykinin [4]. Elevated blood pressure is often treated with synthetic drugs that inhibit ACE [5], but synthetic ACE inhibitors might be accompanied with unwanted side effects [6,7]. Alternative inhibitors from natural sources are still being sought, because they may have a better profile as drugs and cause fewer side effects [8]. Recently, a lot of bioactive compounds with potent ACE inhibitory activity have been characterized from enzymatic hydrolysates of casein [9], tuna bone protein [10], soybean [11], wheat germ [12], lentil [13], apricot almond meal hydrolysate [14], and many other foods [15,16].
The ACE inhibitory activity in foods of plant origin could be caused by a synergistic effect of flavonoids or from other unidentified components in the extracts, since the ACE inhibitory activity of flavonoids isolated from other plants has been reported previously [17,18]. Both phenolic acids and flavonoids have been reported as dietary modulators of cardiovascular function by the regulation of blood pressure [19], oxidative stress [20], and inflammation [21] in the cardiovascular system; however, their antihypertension activity has been scarcely investigated in relation to their antioxidant potential. Although it is known that the intestinal microflora participates in the metabolism of flavonoids [22,23,24,25], there is a lack of information about the specific properties of these metabolites. Several studies have shown that the metabolic activity of the gut microflora transforms polyphenols into phenolic acid metabolites such as phenylvaleric, phenylpropionic, phenylacetic, benzoic, and hippuric acids [24,26], which is related to the phenolic compound being metabolized [27,28]. Some of these compounds might be biologically active, be absorbed, and contribute to the biological activity of dietary flavonoids. Quercetin, as well as rutin (quercetin rutinoside), could be metabolized to 3-(3,4-dihydroxyphenyl)propionic acid via ring fission of the C ring in various ways, and this could be subsequently degraded into 3,4-dihydroxyphenylacetic acid [29,30]. The latest one may also be dehydroxylated to m- or p-hydroxyphenylacetic acid, phenylacetic acid, and 3-methoxy-4-hydroxyphenylacetic acid (homovanillic acid), which has been previously reported in the literature as a biomarker for microbial and/or hepatic metabolism of quercetin [31,32].
The chemical structure and the number and position of hydroxyl groups determine the antioxidant potential, which may be the reason for the observed inhibitory effect on ACE activity. This relationship has been previously described for the major green and black tea catechins [33,34] and hydroxybenzoic acids, differing only in the number of hydroxyl groups on the benzene ring. Studies have shown that phenolic compounds inhibit ACE via interaction with the zinc ion, which is stabilized by other interactions with amino acids in the active site [35]. The antioxidant properties of phenolic acids, flavonoids, their O-glucosides, and low-molecular-weight phenolic metabolites may be evaluated by electrochemical methods such as cyclic voltammetry (CV), differential pulse voltammetry (DPV), and square wave voltammetry (SWV), which are based on electron transfer [36,37]. CV is a versatile electrochemical technique in which the potential of a working electrode is cyclically swept between defined limits while recording the resulting current [38,39,40]. Usually, voltametric data provide qualitative information (peak of anodic oxidation potential (Epa) indicating antioxidant strength) and quantitative information (peak currents or charges proportional to antioxidant concentration). A low value of Epa corresponds to high antioxidant power [41]. The DPV is an excellent technique to determine the Epa, as a scan takes seconds and can provide valuable information on the electroactivity of sample or compounds in one run if the peaks are distinguishable [42,43]. DPV requires minimal sample preparation—an aqueous or hydroalcoholic extract/standard solutions mixed with a supporting electrolyte.
The aim of this study was (1) to investigate the ACE inhibitory activity of phenolic acids, flavonoids, their main glucosides, and the low-molecular-weight phenolic metabolites of quercetin and rutin; and (2) to determine the relationship to their antioxidant power characterized by the anodic peak potentials (Epa) provided by the DPV technique.

2. Materials and Methods

2.1. Chemicals

Captopril was obtained from Sigma-Aldrich (No C4042, St. Louis, MO, USA). Angiotensin-converting enzymes (ACE) from porcine kidneys (EC 3.4.15.1) were purchased from Sigma-Aldrich (St. Louis, MO, USA). A three-tris-base buffer was as follows: buffer A: 300 mM Tris-base buffer (pH 8.3) with 2 mM ZnCl2; buffer B: 150 mM Tris-base buffer (pH 8,3); and buffer C: 150 mM Tris-base buffer (pH 8.3) with 1125 M NaCl. The substrate o-aminobenzoylglycyl-p-nitorphenylalanylproline (Abz-Gly-Phe(NO2)-Pro) was obtained from BACHEM (Bubendorf, Switzerland). Standards of phenolic acids, flavonoids, glucosides, and low-molecular-weight phenolic metabolites were obtained from Sigma-Aldrich (St. Louis, MO, USA) and Extrasynthese (Genay, France). Water was purified using the Mili-Q system (Milipore, Bedford, MA, USA).

2.2. Stock Solutions of Standards of Phenolic Acids, Flavonoids, Their O-Glucosides, and Low-Molecular-Weight Phenolic Metabolites for ACE Inhibitory Activity Determination

Stock solutions at 1 mM of selected phenolic acids, flavonoids, their O-glucosides, and low-molecular-weight phenolic metabolites were prepared in 80% methanol. The concentration was confirmed by a UV measurement according to Franke et al. [44]. A wide range of concentrations of each compound was prepared by serial dilutions in deionized water to determine the IC50 value. The control compounds used were captopril solution (0.1 μM solution) and reduced glutathione (GSH; 1 mM solution), prepared in deionized water. The ACE inhibitory activity was obtained from three repetitions (n = 3) for each concentration.

2.3. Angiotensin-I-Converting Enzyme Inhibitory Assay

Angiotensin-converting enzyme (ACE) activity inhibitory assay was performed according to the method of Sentandreu and Toldra [45]. The procedure was based on the hydrolysis of the internally quenched substrate o-aminobenzoylglycyl-p-nitorphenylalanylproline (Abz-Gly-Phe(NO2)-Pro) by the reaction of ACE. The fluorescence generated by the liberation of the product (the o-aminobenzoylglycine group) was read in a microplate multiscan fluorometer. The production of fluorescence was inhibited by the presence of functional compounds with an ACE inhibitory effect. The fluorescence was measured immediately after mixing (0 min) and then after 30 min of reaction at an excitation of 365 nm and an emission of 405 nm. To calculate the % of inhibition of ACE, the following equation was used:
Relative ACE activity% = 100 − (ΔRFUsample × 100/ΔRFUnegative control),
where ΔRFU = RFU at time 30 – RFU at time 0.
The wide range of concentrations of each compound prepared by serial dilutions in deionized water was used for the determination of the IC50 value, indicating the sample concentration at 50% inhibition of ACE activity calculated by the linear regression analysis of logarithmic plots.

2.4. Measurement of the Anodic Oxidation Potentials of Phenolic Acids, Flavonoids, Their O-Glucosides, and Low-Molecular-Weight Phenolic Metabolites with Differential Pulse Voltammetry

A potentiostat/galvanostat G 750 (Gamry Instruments, Warminster, USA) was used for voltametric experiments. A conventional three-electrode system: a 3 mm diameter glassy carbon working electrode (BAS MF-2012), an Ag/AgCl electrode as a reference electrode, and a platinum as counter electrode, was used in the study. Differential pulse voltametric experiments were performed with phenolic acids and flavonoids prepared in a 1:1 (v/v) mixture of 500 µM standard solution and 0.2 M Britton-Robinson (B-R) buffer (pH 6.0 in 80% methanol), which also served as a supporting electrolyte [46]. The voltametric experiments were performed at room temperature using an electrochemical cell (volume 200 µL), to which the analyzed standard solution, mixed previously with the buffer solution, was introduced. The differential pulse voltammograms were acquired in the range of −100 to 1300 mV at a scanning rate of 100 mV/s. Before use, the surface of the glassy carbon electrode was carefully polished with 0.05 µm alumina paste, ultrasonically rinsed in deionized water, and then washed with methanol. This procedure was repeated after each cycle. For test purposes, the first anodic oxidation potential was recorded (mV).

2.5. Statistical Analysis

Results are given as the average ± standard deviation (SD). One-way analysis of variance (ANOVA) was used for the analysis of significant differences in the multifaceted biological activities of quercetin and its glucosides (p < 0.05) (GraphPad Prism version 9 for Windows, GraphPad Software, San Diego, CA, USA). The correlation analysis was performed, and the Pearson correlation coefficient was calculated.

3. Results

3.1. ACE Inhibitory Activity and the First Oxidation Potential of Phenolic Acids

The results obtained for the ACE inhibitory activity of selected phenolic acids are shown in Table 1, whereas the differential pulse voltammograms are provided in Figure 1.
Phenolic acids showed a very low ACE inhibitory activity. The IC50 values obtained for phenolic acids ranged between 134 (chlorogenic acid) and 9105 µM (caffeic acid). The IC50 value represents the concentration of each compound that inhibits ACE activity by 50%. A lower IC50 value indicates higher ACE inhibitory activity. The IC50 values of phenolic acids were significantly different (p < 0.05 (Table 1). The first oxidation peak potentials of the benzoic acid derivatives ranged from 417 mV (protocatechuic acid) to 748 mV (vanillic acid), whereas cinnamic acid derivatives showed values from 397 mV (caffeic acid) to 672 mV (p-coumaric acid) (Table 1). A lower value of oxidation potential indicates higher antioxidant activity of the compound.

3.2. ACE Inhibitory Activity and the First Oxidation Potential of Flavonoids and Their O-Glucosides

The ACE inhibitory activity of selected flavonoids and their O-glucosides, as well as the antioxidant potential of these compounds described by the value of the first oxidation potential provided by the DPV technique, are shown in Table 2, whereas the recorded differential pulse voltammograms of standards solution of rutin, quercetin, luteolin, apigenin, kaempferol, naringenin, cyanidin, delphinidin, and pelargonin and their the main O-glucosides in 0.1 M Britton-Robinson (B-R) buffer, pH 6.0 in 80% methanol, are presented on Figure 2.
In this study, the IC50 values for the angiotensin-I-converting enzyme inhibition of selected flavonoids and their glucosides ranged from 59.3 µM for quercetin-3-O-rutinoside to 390.8 µM for naringenin in comparison to glutathione (IC50 = 41.7 µM) and captopril (IC50 = 0.0059 µM). The IC50 values of selected flavonoids and their glucosides were significantly different (p < 0.05) based on the one-way analysis of variance (ANOVA) (Table 2). The order of the ACE enzyme inhibitory activity of non-glucosides selected flavonoids was luteolin > quercetin > kaempferol > cyanidin > delphinidin > pelargonin > naringenin, thus indicating the importance structure–activity relationship. The IC50 of luteolin was fivefold lower than that value for naringenin, thus simply indicating that the ACE enzyme inhibitory activity of luteolin was five times higher. In this study, higher values of the IC50 of hyperoside (quercetin-3-O-glucoside), luteolin-4′-O-glucosides, cyanidin-3-O-glucoside, and pelargonidin-3-O-glucoside by 30, 15, 5, and 29% were noted as compared to the IC50 of the respective aglycon. In this study, the ACE inhibitory activity of selected flavonoids and their O-glucosides was between two and tenfold lower than that determined for small tripeptide reduced glutathione (GSH). Moreover, the range of ACE inhibitory activity of phenolic acids (134–9105 µM) and flavonoids and their glucosides (59.3–390.8 µM) indicates that flavonoids and their glucosides exhibit higher ACE inhibitory activity from 2 to 23 times, respectively. It should be pointed out that the ACE inhibitory activity of chlorogenic, p-coumaric, and sinapic acid was within the range shown for flavonoids and their glucosides.
The order of the antioxidant potential of flavonoids and their glucoside based on the value of the first oxidation potential indicates that pelargonin, cyanidin, and pelargonidin can be considered as compounds withhigh antioxidant power (Ep < 0.3 V), whereas the remaining compounds can be classified as moderate antioxidants (0.3 V < Ep < 0.8 V). This order was drawn according to the work by Blasco et al. [47], in which differentiation of the antioxidant power of phenolic compounds was based on values of their oxidation potentials, thus supporting current knowledge on the structural features and the nature of substitutions on rings B and C determining the antioxidant activity of flavonoids [48].

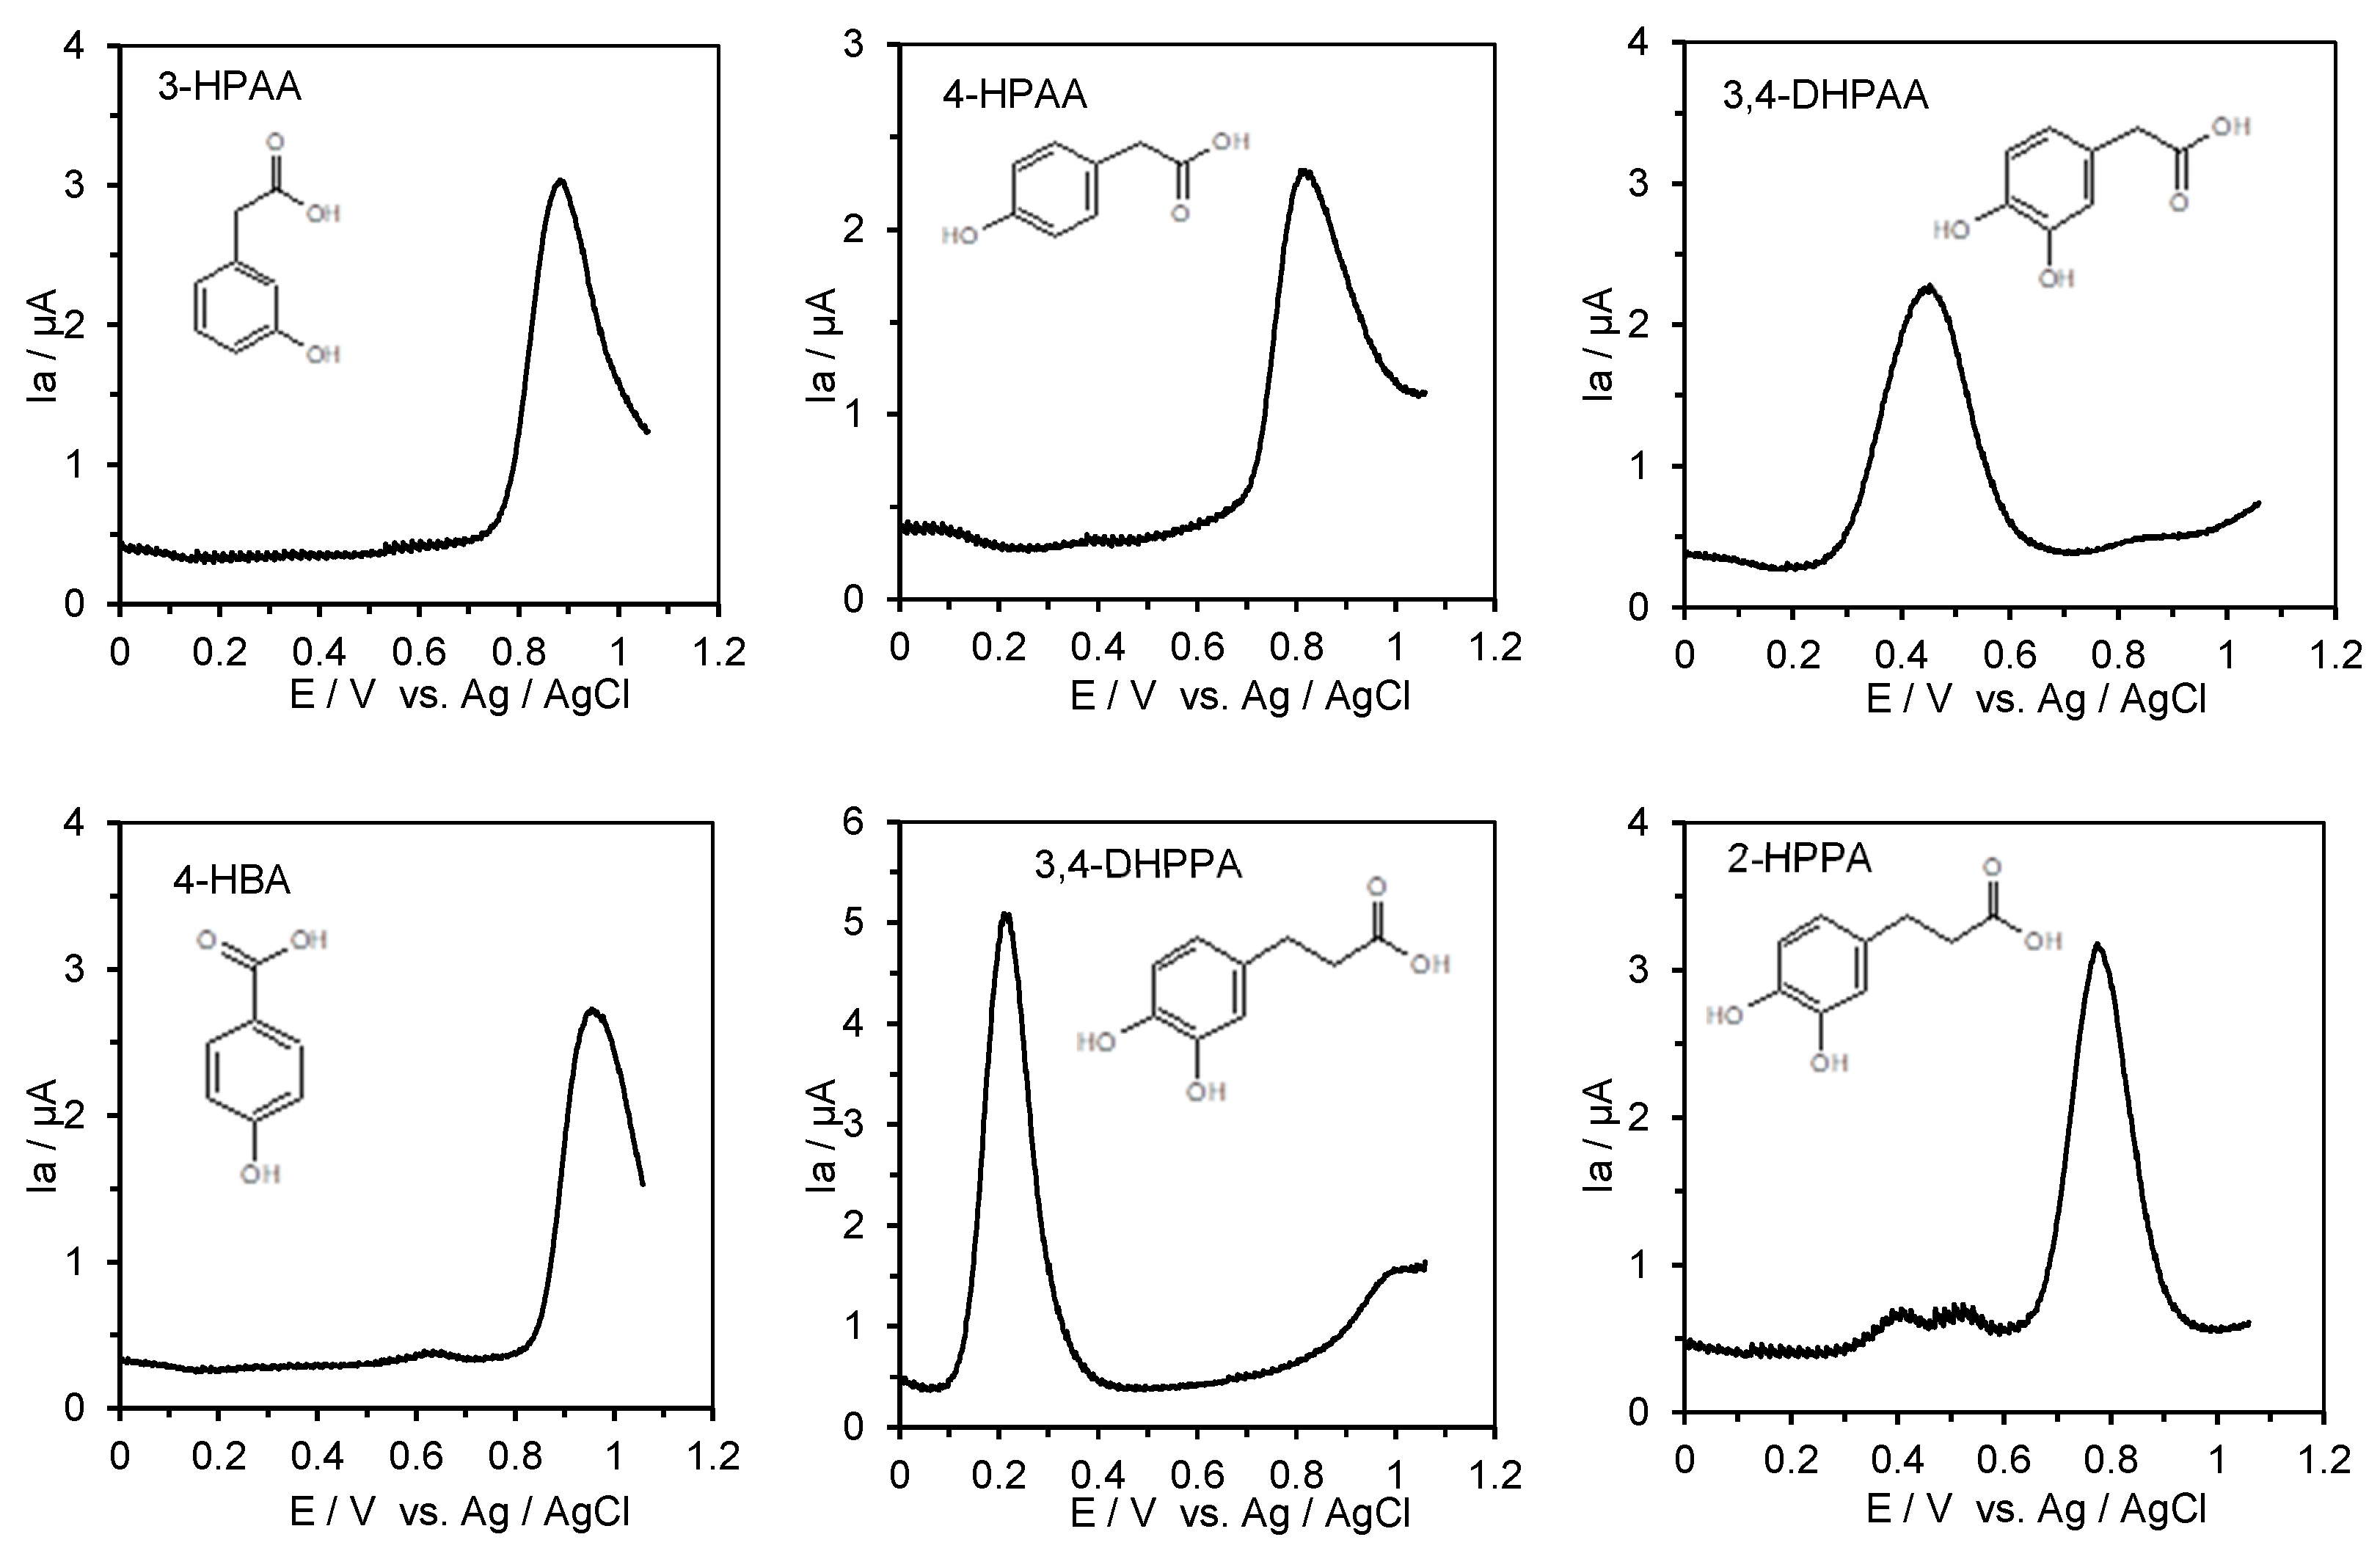
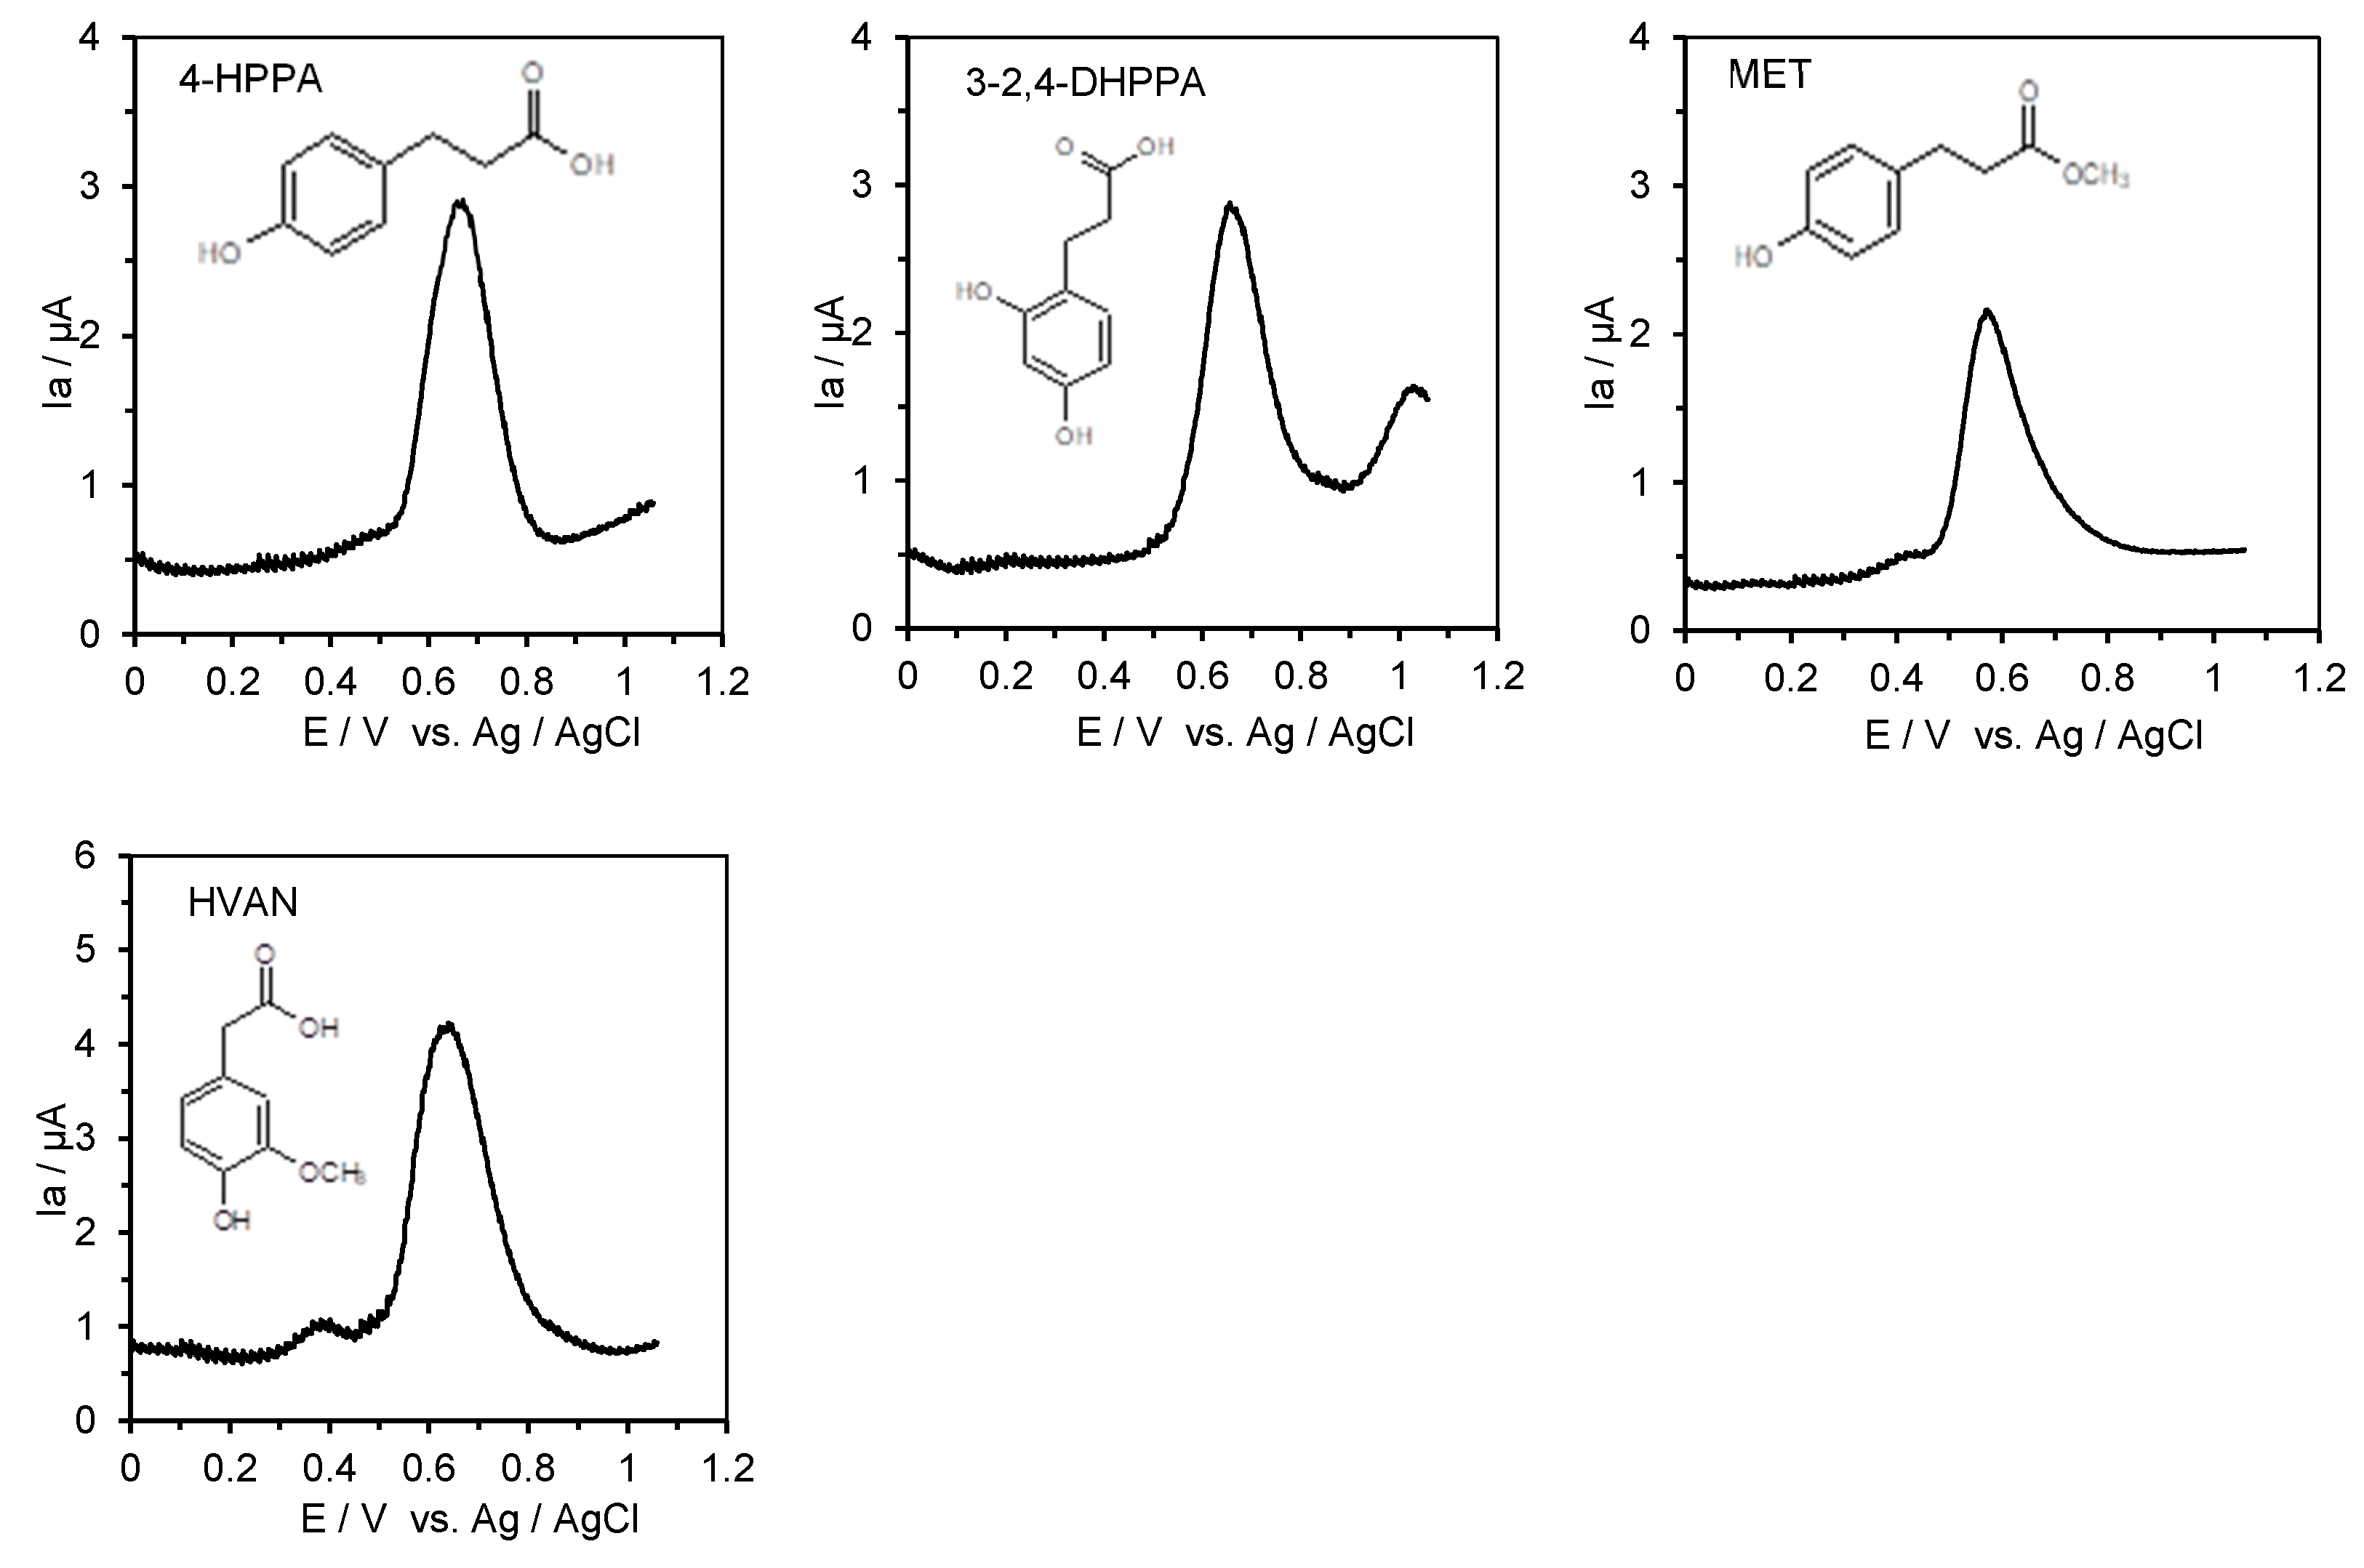
3.3. ACE Inhibitory Activity and the First Oxidation Potential of Low-Molecular-Weight Phenolic Metabolites of Quercetin and Rutin

The ACE inhibitory activity of the low-molecular-weight phenolic metabolites of quercetin and rutin, together with the antioxidant potential of these compounds, described by the value of the first oxidation potential provided by the DPV technique, are shown in Table 3, whereas the recorded differential pulse voltammograms of the standard solutions of these compounds in 0.1 M Britton-Robinson (B-R) buffer, pH 6.0 in 80% methanol, are provided on Figure 3.
The low-molecular-weight phenolic metabolites of flavonoids showed moderate ACE inhibitory activity. The obtained IC50 values ranged between 490 (µM) (4-HPPA) and 1461 (µM) (HVA). The IC50 values of phenolic metabolites were significantly different (p < 0.05) (Table 3). A lower IC50 value indicates higher ACE inhibitory activity. In our study, the ranking of ACE inhibitory activity found was as follows: captopril >>> GSH > 4-HPPA > 3,4-DHPPA > 3,4-DHPAA > 3-HPAA > MET > 3-2,4-DHPPA > 4-HPAA > HVA. The ACE inhibitory activity of 4-HPPA was almost 12-fold lower than the IC50 of small tripeptide reduced glutathione (GSH), whereas the ACE inhibitory activity of HVA was about 35-fold lower in relation to GSH. The first oxidation peak potentials of the low-molecular-weight phenolic metabolites ranged from 218 mV (3,4-DHPPA) to 883 mV (3-HPAA). A lower value of oxidation potential indicates higher antioxidant activity of the phenolic metabolite. Therefore, taking into account the values of the first oxidation potential of the studied metabolites, only the 3-(3,4-dihydroxyphenyl)propionic acid (3,4-DHPPA) could be considered as compounds with high antioxidant power (0.3 V < Epa), whereas MET, HVA, 3-2,4-DHPPA, 4-HPPA, and 2-HPPA had moderate antioxidant power (0.3 V < Epa < 0.8 V). In contrast, 3-hydroxyphenylacetic acid (3-HPAA) and 4-hydroxyphenylacetic acid (4-HPAA) showed weak antioxidant power (Epa ˃ 0.8 V). This conclusion was drawn according to the work by Blasco et al. [47], in which differentiation of the antioxidant power of phenolic compounds was based on the values of their oxidation potentials.

4. Discussion

The results provided in this study of the ACE inhibitory activity of phenolic acids followed the data provided by Shukor et al. [35], who showed ACE inhibition with IC50 values ranging from 2 to 9.3 mM. In contrast, captopril, which is a synthetic drug, showed extremely high activity. Benzoic acid derivatives’ inhibition with IC50 values ranged from 0.834 (gentisic acid) to 6.235 mM (protocatechuic acid), whereas higher ACE inhibitory activity was found for cinnamic acid derivatives with IC50 values ranging from 0.134 (chlorogenic acid) to 0.980 mM (ferulic acid) with exception of the very low ACE inhibitory activity of caffeic acid. Previously, Zielinska et al. [49] showed a low ACE inhibitory activity of caffeic acid (IC50 = 8.97 ± 0.08 mM), and this value corresponded to that provided in this study (IC50 = 9.11 ± 0.06 mM). The ACE inhibitory activity of caffeic acid was about 120-fold lower than that determined for the small tripeptide reduced glutathione (GSH). The ranking of ACE inhibitory activity found in this study was as follows: captopril > GSH > chlorogenic acid > p-coumaric acid > sinapic acid > gentisic acid > ferulic acid > syringic acid > vanillic acid > protocatechuic acid > caffeic acid. The ACE inhibitory activity of chlorogenic acid was threefold lower than the IC50 of small tripeptide reduced glutathione (GSH), whereas the ACE inhibitory activity of caffeic acid was about 120-fold lower in relation to GSH. These results indicate that the food source of cinnamic acid derivatives may play some role in ACE inhibition as compared to the benzoic acid derivatives. Taking into account the values of the first oxidation potential of the studied compounds, both groups of phenolic acids can be ranked as compounds with moderate antioxidant strength (0.3 V < Epa < 0.8 V). This conclusion was drawn according to the work by Blasco et al. [48], in which differentiation of the antioxidant power of phenolic compounds was based on values of their oxidation potentials. Having this finding, the question regarding the impact of the antioxidant potential of phenolic acids on their ACE inhibitory activity was addressed. In this study, a lack of correlation was found between the IC50 of phenolic acids and their anodic oxidation potentials provided by differential pulse voltammetry. The correlation coefficient had a value r = −0.47, thus clearly indicating that factors other than antioxidant activity may affect the ACE inhibitory activity of the phenolic acids. Docking studies indicated that phenolic acids inhibit ACE via interaction with the zinc ion, and this interaction is stabilized by other interactions with amino acids in the active site [35]. For the hydroxybenzoic acids and hydroxycinnamic acids, with a different number of hydroxyl groups on the benzene ring, an increase in ACE inhibitory activity with increasing numbers of hydroxyl groups was observed. The ACE-inhibiting activity of phenolic acids is also correlated with another functional group—the methoxy group. In this study, it was noted that the IC50 of ferulic acid was 10 times lower than the IC50 of caffeic acid.
The order of the ACE enzyme inhibitory activity of selected flavonoids (luteolin > quercetin > kaempferol > cyanidin > delphinidin > pelargonin > naringenin) indicates the importance of the structure–activity relationship. It was found that the substitution of glucose at position −3 at the ring C or 4′ at the ring B slightly decreased the ACE inhibitory activity of these compounds. Zielińska et al. [50] determined the ACE inhibitory activity of the marker polyphenols in apples, e.g., phloretin and phloridzin (phloretin 2′-O-glucose), belonging to the chemical class of dihydrochalcones. Phloridzin consists of a C6–C3–C6 skeleton structure (two aromatic rings connected by a C3 chain) with a β-D-glucopyranose moiety attached at position 2′. The phloretin showed IC50 = 286.83 ± 2.54 µM, being 25% higher than the IC50 of phloretin 2′-O-glucose [45]. This finding suggests that the β-D-glucopyranose moiety attached at position 2′ may also decrease the ACE inhibitory activity. However, in this study, exceptions were found in relation to rutin (quercetin-3-O rutinoside), kaempferol-3-O-glucoside, and delphinidin-3-O glucoside, where lower IC50 by 50, 16, and 16% were noted in relation to aglicones. Moreover, IC50 values of 7-O-glucosides of luteolin, apigenin, kaempferol, and naringein were also decreased by 20, 35, 26, and 9% in comparison to respective aglycons, thus clearly indicating that the substitution of glucose at position −7 at ring C, as well as those shown as exceptions, enhance the ACE inhibitory activity of these compounds. Moreover, structure–activity relationship studies have shown that the combination of sub-structures on the flavonoid skeleton that increase ACE inhibitory activity is made up of the following elements: (a) the catechol group in the B-ring, (b) the double bond between C2 and C3 at the C-ring, and (c) the ketone group in C4 at the C-ring [35]. These findings follow our observation that the substitution position in the flavonoid basic structure may affect the ACE inhibitory activity, which, in some cases, may decrease or increase, as we showed for 7-O-glucosides, likely reported for the first time in this study. Guerrero et al. [51] evaluated the in vitro ability of 17 flavonoids belonging to five structural subtypes to inhibit ACE in order to establish the structural basis of their bioactivity. The high ACE inhibitory activity provided by the same fluorometric method as in our study showed luteolin, quercetin, rutin, kaempferol, rhoifolin, and apigenin with IC50 values of 23, 43, 64, 178, 183, and 196 µM, respectively. These IC50 values are comparable with those provided in this study. Using data on oxidation potentials, the question regarding the impact of the antioxidant activity of flavonoids and their glucosides on their ACE inhibitory activity was addressed. In this study, weak positive correlations were found between the IC50 of aglicons, 3-O-glucosides, 7-O-glucosides, and their anodic oxidation potentials provided by differential pulse voltammetry. The correlation coefficients had r = 0.61, r = 0.66, and r = 0.88, respectively, thus indicating that the antioxidant activity related to the position of glucose substitution on rings B and C may affect the ACE inhibitory activity of flavonoid glucosides. This finding is in contrast to the relationship between the ACE inhibitory activity of the phenolic acids and the values of their oxidation potentials.
The ACE inhibitory activity of low-molecular-weight phenolic metabolites of flavonoids is presented for the first time. Previously, Giménez-Bastida [52] showed strong inhibitory activity of 3,4-DHPAA against the formation of advanced glycation end products, thus suggesting the multifaceted activity of low-molecular-weight phenolic metabolites. The following various phenolic acids have been reported as degradation products of quercetin by colonic microbiota: 2-(3,4-dihydroxyphenyl) acetic acid, 2-(3-hydroxyphenyl)acetic acid, and 3,4-dihydroxybenzoic acid (protocatechuic acid), together with 2-(3-methoxy-4-hydroxyphenyl)acetic acid (homovanillic acid), 3-methoxy-4-hydroxybenzoic acid (vanillic acid), 3-(3,4-dihydroxyphenyl)propionic acid, and 3-(3-hydroxyphenyl) propionic acid [48,53,54]. The same or similar metabolites have also been reported for other flavonoids [53,54]. Recent studies have suggested the potential role of some phenolic antioxidants in inhibiting ACE activity [51,55,56]; however, no information exists on the ACE inhibitory activity of low-molecular-weight phenolic metabolites. The range of ACE inhibitory activity of low-molecular-weight phenolic metabolites (490–1461 µM) and flavonoids and their glucosides (59.3–390.8 µM) indicates that flavonoids and their glucosides exhibit higher ACE inhibitory activity by eight and four times, respectively. However, when a comparison was done for the range of ACE inhibitory activity of phenolic acids (134–9105 µM), the ACE inhibitory activity of phenolic metabolites was about four times higher in relation to the benzoic acid derivatives and on a comparable level in relation to the cinnamic acid derivatives. These results indicate that low-molecular-weight phenolic metabolites of flavonoids may have some beneficial effects in ACE inhibition. However, the question regarding the impact of the antioxidant potential of phenolic metabolites on their ACE inhibitory activity was addressed. A lack of correlation was found between the IC50 of phenolic metabolites and their anodic oxidation potentials provided by the differential pulse voltammetry. The correlation coefficient had a value r = 0.28, thus clearly indicating that factors other than the antioxidant power of the phenolic metabolites may affect the ACE inhibitory activity of the phenolic acids. These findings are in agreement with the same conclusion drawn for phenolic acids.
The graphical presentation of the IC50 of ACE inhibitory activity of phenolic compounds is provided in Figure S1 (please see Supplementary Materials). In summary, quercetin, quercetin rutinoside, luteolin and its glucosides, kaempferol and its glucosides, followed by low-molecular-weight phenolic metabolites showed the highest ACE inhibitory activity. This study expands our knowledge of the ACE inhibitory activity of phenolic compounds and their metabolites.

5. Conclusions

Phenolic acids showed very low ACE inhibitory activity, and their rank was chlorogenic acid > p-coumaric acid > sinapic acid > gentisic acid > ferulic acid > > syringic acid > vanillic acid > protocatechuic acid > caffeic acid. The low-molecular-weight phenolic metabolites of flavonoids showed moderate ACE inhibitory activity. In contrast, higher ACE inhibitory activity was noted for flavonoids and their glucosides. The order of the ACE enzyme inhibitory activity of flavonoid aglicones was luteolin > quercetin > kaempferol > cyanidin > delphinidin > pelargonin > naringenin, whereas lower inhibition activity was noted for quercetin-3-O-glucoside, luteolin-4′-O-glucosides, cyanidin-3-O-glucoside, and pelargonidin-3-O-glucosides. In contrast, higher ACE inhibition activity was observed for 7-O-glucosides of luteolin, apigenin, kaempferol, and in comparison to respective aglycons, thus indicating the importance structure–activity relationship. A lack of correlation was found between the IC50 of phenolic acids, low-molecular-weight phenolic metabolites, and their Epa values. In contrast, weak positive correlations were found between the IC50 of aglicons, 3-O-glucosides, 7-O-glucosides, and their Epa values provided by the DPV (r = 0.61, r = 0.66 and r = 0.88, respectively). The flavonoids and their glucosides are the most promising ACE inhibitors.

Supplementary Materials

The following supporting information can be downloaded at: https://www.mdpi.com/article/10.3390/metabo15070443/s1, Figure S1: The IC50 of ACE inhibitory activity of selected phenolic acids, flavonoids, their O-glucosides, and low-molecular-weight phenolic metabolites.

Author Contributions

Conceptualization, methodology, data curation, formal analysis, and writing—original draft, D.Z.; Methodology, data curation, and formal analysis, M.S.; Software, formal analysis, M.W.; Data curation, and writing—original draft, H.Z. All authors have read and agreed to the published version of the manuscript.

Funding

This research received no external funding.

Institutional Review Board Statement

Not applicable.

Informed Consent Statement

Not applicable.

Data Availability Statement

The original contributions presented in this study are included in the article/Supplementary Materials. Further inquiries can be directed to the corresponding author.

Acknowledgments

The authors thank Joanna Honke for her laboratory support regarding the determination of the ACE inhibitory activity of polyphenols.

Conflicts of Interest

The authors declare no conflicts of interest.

References

  1. Guang, C.; Philips, R.D. Plant Food-Derived Angiotensin I Converting Enzyme Inhibitory Peptides. J. Agric. Food Chem. 2009, 57, 5113–5120. [Google Scholar] [CrossRef] [PubMed]
  2. Gupta, R.; Guptha, S. Strategies for initial management of hypertension. Indian J. Med. Res. 2010, 132, 531–542. [Google Scholar] [CrossRef] [PubMed]
  3. López-Sendón, J.; Swedberg, K.; McMurray, J.; Tamargo, J.; Maggioni, A.P.; Dargie, H.; Tendera, M.; Waagstein, F.; Kjekshus, J.; Lechat, P.; et al. Expert consensus document on angiotensin converting enzyme inhibitors in cardiovascular disease. The Task Force on ACE-inhibitors of the European Society of Cardiology. Eur. Heart J. 2004, 25, 1454–1470. [Google Scholar] [PubMed]
  4. Ondetti, M.A.; Rubin, B.; Cushman, D.W. Enzyme of the rennin angiotensin system and their inhibitors. Annu. Rev. Biochem. 1982, 51, 283–308. [Google Scholar] [CrossRef]
  5. Kim, S.K.; Byun, H.G.; Park, P.J.; Shahidi, F. Angiotensin I converting enzyme inhibitory peptides purified from bovine skin gelatin hydrolysate. J. Agric. Food Chem. 2001, 49, 2992–2997. [Google Scholar] [CrossRef]
  6. Parish, R.C.; Miller, L.J. Adverse effects of angiotensin converting enzyme (ACE) inhibitors. An update. Drug Saf. 1992, 7, 14–31. [Google Scholar] [CrossRef]
  7. Kumar, R.; Kumar, A.; Sharma, R.; Baruwa, A. Pharmacological review on natural ACE inhibitors. Pharm. Lett. 2005, 2, 273–293. [Google Scholar]
  8. Duarte, J.; Perez-Palencia, R.; Vargas, F.; Ocete, M.A.; Perez-Vizcaino, F.; Zarzuelo, A.; Tamargo, J. Antihypertensive effects of the flavonoid quercetin in spontaneously hypertensive rats. Brit. J. Pharmacol. 2001, 133, 117–124. [Google Scholar] [CrossRef]
  9. Miguel, M.; Contreras, M.M.; Recio, I.; Aleixandre, A. ACE inhibitory and antihypertensive properties of a bovine casein hydrolysate. Food Chem. 2009, 12, 211–214. [Google Scholar] [CrossRef]
  10. Je, J.Y.; Qian, Z.J.; Byun, H.G.; Kim, S.K. Purification and characterization of an antioxidant peptide obtained from tuna backbone protein by enzymatic hydrolysis. Process Biochem. 2007, 42, 840–846. [Google Scholar] [CrossRef]
  11. Kuba, M.; Tana, C.; Tawata, S.; Yasuda, M. Production of angiotensin I-converting enzyme inhibitory peptides from soybean protein with Monascus purpureus acid proteinase. Process Biochem. 2005, 40, 2191–2196. [Google Scholar] [CrossRef]
  12. Matsui, T.; Li, C.H.; Osajima, Y. Preparation and characterization novel bioactive peptides responsible for angiotensin I converting enzyme inhibition from wheat germ. J. Pept. Sci. 1999, 5, 289–297. [Google Scholar] [CrossRef]
  13. Torino, M.I.; Limón, R.I.; Martínez-Villaluenga, C.; Mäkinen, S.; Pihlanto, A.; Vidal-Valverde, C.; Frias, J. Antioxidant and antihypertensive properties of liquid and solid state fermented lentils. Food Chem. 2013, 136, 1030–1037. [Google Scholar] [CrossRef] [PubMed]
  14. Wang, C.; Tian, J.; Wang, Q. ACE inhibitory and antihypertensive properties of apricot almond meal hydrolysate. Eur. Food Res. Technol. 2011, 232, 549–556. [Google Scholar] [CrossRef]
  15. Ren, X.; Ma, H.; Mao, S.; Zhou, H. Effects of sweeping frequency ultrasound treatment on enzymatic preparations of ACE-inhibitory peptides from zein. Eur. Food Res. Technol. 2014, 238, 435–442. [Google Scholar] [CrossRef]
  16. Iwaniak, A.; Minkiewicz, P.; Darewicz, M. Food-originating ACE inhibitors, including antihypertensive peptides, as preventive food components in blood pressure reduction. Compr. Rev. Food Sci. Food Saf. 2014, 13, 114–134. [Google Scholar] [CrossRef]
  17. Lacaille-Dubois, M.A.; Franck, U.; Wagner, H. Search for potential Angiotensin Converting Enzyme (ACE)-inhibitors from plants. Phytomedicine 2001, 8, 47–52. [Google Scholar] [CrossRef]
  18. Zieliński, H.; Honke, J.; Topolska, J.; Bączek, N.; Piskuła, M.K.; Wiczkowski, W.; Wronkowska, M. ACE inhibitory properties and phenolics profile of fermented flours and of baked and digested biscuits from buckwheat. Foods 2020, 9, 847. [Google Scholar] [CrossRef]
  19. Galleano, M.; Pechanova, O.; Fraga, C.G. Hypertension, nitric oxide, oxidants, and dietary polyphenols. Curr. Pharm. Biotechnol. 2010, 11, 837–848. [Google Scholar] [CrossRef]
  20. Cordova, A.C.; Sumpio, B.J.; Sumpio, B.E. Perfecting the plate: Adding cardioprotective compounds to the diet. Am. Col. Surg. 2012, 214, 97–114. [Google Scholar] [CrossRef]
  21. Pan, M.-H.; Lai, C.-S.; Dushenkov, S.; Ho, C.-T. Modulation of inflammatory genes by natural dietary bioactive compounds. J. Agric. Food Chem. 2009, 57, 4467–4477. [Google Scholar] [CrossRef] [PubMed]
  22. Kroon, P.A.; Clifford, M.N.; Crozier, A.; Day, A.J.; Donovan, J.L.; Manach, C.; Williamson, G. How should we assess the effects of exposure to dietary polyphenols in vitro? Am. J. Clin. Nutr. 2004, 80, 15–21. [Google Scholar] [CrossRef]
  23. Simons, A.L.; Renouf, M.; Hendrich, S.; Murphy, P.A. Human gut microbial degradation of flavonoids: Structure–function relationships. J. Agric. Food Chem. 2005, 3, 4258–4263. [Google Scholar] [CrossRef] [PubMed]
  24. Serra, A.; Macia, A.; Romero, M.-P.; Reguant, J.; Ortega, N.; Motilva, M.-J. Metabolic pathway of the colon metabolism of flavonoids (flavonols, flavones and flavanones) and phenolic acids. Food Chem. 2011, 130, 383–393. [Google Scholar] [CrossRef]
  25. Terao, J. Potential role of quercetin glycosides as anti-atherosclerotic food-derived factors for human health. Antioxidants 2023, 12, 258. [Google Scholar] [CrossRef]
  26. Setchell, K.D.R.; Brown, N.M.; Lydeking-Olsen, E. The clinical importance of the metabolite equol—A clue to the effectiveness of soy and its isoflavones. J. Nutr. 2002, 132, 3577–3584. [Google Scholar] [CrossRef]
  27. Gonthier, M.; Cheynier, V.; Donovan, J.L.; Manach, C.; Morand, C.; Mila, I. Microbial aromatic acid metabolites formed in the gut account for a major fraction of the polyphenols excreted in urine of rats fed red wine polyphenols. J. Nutr. 2003, 133, 461–467. [Google Scholar] [CrossRef]
  28. Gonthier, M.; Donovan, J.L.; Texier, O.; Felgines, C.; Remesy, C.; Scalbert, A. Metabolism of dietary procyanidins in rats. Free Radic. Biol. Med. 2003, 35, 837–844. [Google Scholar] [CrossRef]
  29. Duenas, M.; Surco-Laos, F.; Gonzalez-Manzano, S.; Gonzalez-Paramas, A.M.; Santos-Buelga, C. Antioxidant properties of major metabolites of quercetin. Eur. Food Res. Technol. 2011, 232, 103–111. [Google Scholar] [CrossRef]
  30. Pashikanti, S.; de Alba, D.R.; Boissonneault, G.A.; Cervantes-Laurean, D. Rutin metabolites: Novel inhibitors of nonoxidative advanced glycation end products. Free Radic. Biol. Med. 2010, 48, 656–663. [Google Scholar] [CrossRef]
  31. Gross, M.; Pfeiffer, M.; Martini, M.; Campbell, D.; Slavin, J.; Potter, J. The quantitation of metabolites of quercetin flavonols in human urine. Cancer Epidemiol. Biomarkers Prev. 1996, 5, 711–720. [Google Scholar] [PubMed]
  32. Jaganath, I.B.; Mullen, W.; Lean, M.E.J.; Edwards, C.A.; Crozier, A. In vitro catabolism of rutin by human fecal bacteria and the antioxidant capacity of its catabolites. Free Radic. Biol. Med. 2009, 47, 1180–1189. [Google Scholar] [CrossRef] [PubMed]
  33. Persson, I.-A.-L.; Josefsson, M.; Persson, K.; Andersson, R.G.G. Tea flavanols inhibit angiotensin-converting enzyme activity and increase nitric oxide production in human endothelial cells. J. Pharm. Pharmacol. 2006, 58, 1139–1144. [Google Scholar] [CrossRef] [PubMed]
  34. Paiva, L.; Lima, E.; Marcone, M.; Baptista, J. Angiotensin I-converting enzyme (ACE) inhibition and biological activities of green and black tea samples from Azorean Camellia sinensis. J. Funct. Foods 2023, 107, 105701. [Google Scholar] [CrossRef]
  35. Shukor, N.A.; Camp, J.V.; Gonzales, G.B.; Staljanssens, D.; Struijs, K.; Zotti, M.J.; Raes, K.; Smagghe, G. Angiotensin-Converting Enzyme Inhibitory Effects by Plant Phenolic Compounds: A Study of Structure Activity Relationships. J. Agric. Food Chem. 2013, 61, 11832–11839. [Google Scholar] [CrossRef]
  36. Chevion, S.; Roberts, M.A.; Chevion, M. The use of cyclic voltammetry for the evaluation of antioxidant capacity. Free Radic. Biol. Med. 2000, 28, 860–870. [Google Scholar] [CrossRef]
  37. Magalhaes, L.M.; Segundo, M.A.; Reis, S.; Lima, J.L.F.C. Methodological aspects about in vitro evaluation of antioxidant properties. Anal. Chim. Acta 2008, 613, 1–19. [Google Scholar] [CrossRef]
  38. Zielińska, D.; Zieliński, H. Antioxidant activity of flavone C-glucosides determined by updated analytical strategies. Food Chem. 2011, 124, 672–678. [Google Scholar] [CrossRef]
  39. Chiorcea-Paquim, A.M.; Enache, T.A.; Gil, E.S.; Oliveira-Brett, A.M. Natural phenolic antioxidants electrochemistry: Towards a new food science methodology. Compr. Rev. Food Sci. Food Saf. 2020, 19, 1680–1726. [Google Scholar] [CrossRef]
  40. Zielińska, D.; Zieliński, H.; Piskuła, M.K. An Electrochemical Determination of the Total Reducing Capacity of Wheat, Spelt, and Rye Breads. Antioxidants 2022, 11, 1438. [Google Scholar] [CrossRef]
  41. Sochor, J.; Dobes, J.; Krystofova, O.; Ruttkay-Nedecky, B.; Babula, P.; Pohanka, M.; Jurikova, T.; Zitka, O.; Adam, V.; Klejdus, B.; et al. Electrochemistry as a Tool for Studying Antioxidant Properties. Inter.J. Electroch. Sci. 2013, 8, 8464–8489. [Google Scholar] [CrossRef]
  42. Alam, M.W.; Najeeb, J.; Naeem, S.; Usman, S.M.; Nahvi, I.; Alismail, F.; Abuzir, A.; Farhan, M.; Allah Nawaz, A. Electrochemical methodologies for investigating the antioxidant potential of plant and fruit extracts: A review. Antioxidants 2022, 11, 1205. [Google Scholar] [CrossRef] [PubMed]
  43. Zlatić, G.; Arapović, A.; Martinović, I.; Martinović Bevanda, A.; Bošković, P.; Prkić, A.; Paut, A.; Vukušić, T. Antioxidant Capacity of Herzegovinian Wildflowers Evaluated by UV—VIS and Cyclic Voltammetry Analysis. Molecules 2022, 27, 5466. [Google Scholar] [CrossRef] [PubMed]
  44. Franke, A.A.; Custer, L.J.; Arakaki, C.; Murphy, S.P. Vitamin C and flavonoids levels of fruits and vegetables consumed in Hawai. J. Food Compos. Anal. 2004, 17, 1–35. [Google Scholar] [CrossRef]
  45. Sentandreu, M.Á.; Toldrá, F. A rapid, simple and sensitive fluorescence method for the assay of angiotensin I converting enzyme. Food Chem. 2006, 97, 546–554. [Google Scholar] [CrossRef]
  46. Cosio, M.S.; Buratti, S.; Mannino, S.; Benedetti, S. Use of an electrochemical method to evaluate the antioxidant activity of herb extracts from the Labiatae family. Food Chem. 2006, 97, 725–731. [Google Scholar] [CrossRef]
  47. Blasco, A.J.; Rogerio, M.C.; Gonzalez, M.C.; Escarpa, A. “Electrochemical Index” as a screening method to determine “total polyphenolics” in foods: A proposal. Anal. Chim. Acta 2005, 539, 237–244. [Google Scholar] [CrossRef]
  48. Rechner, A.R.; Kuhnle, G.; Bremner, P.; Hubbard, G.P.; Moore, K.P.; Rice-Evans, C.A. The metabolic fate of dietary polyphenols in humans. Free Radic. Biol. Med. 2002, 33, 220–235. [Google Scholar] [CrossRef]
  49. Zielińska, D.; Zieliński, H.; Laparra-Llopis, J.M.; Honke, J.; Giménez-Bastida, J.A. Caffeic acid modulates processes associated with intestinal inflammation. Nutrients 2021, 13, 554. [Google Scholar] [CrossRef]
  50. Zielińska, D.; Laparra-Llopis, J.M.; Zieliński, H.; Szawara-Nowak, D.; Gimenez Bastida, J.A. Role of Apple Phytochemicals, Phloretin and Phloridzin, in Modulating Processes Related to Intestinal Inflammation. Nutrients 2019, 11, 1173. [Google Scholar] [CrossRef]
  51. Guerrero, L.; Castillo, J.; Quiñones, M.; Garcia-Vallvé, S.; Arola, L.; Pujadas, G.; Muguerza, B.; Lu, J.R. Inhibition of angiotensin-converting enzyme activity by flavonoids: Structure-activity relationship studies. PLoS ONE 2012, 7, e49493. [Google Scholar] [CrossRef] [PubMed]
  52. Giménez-Bastida, J.A.; Zieliński, H.; Piskuła, M.K.; Zielińska, D.; Szawara-Nowak, D. Buckwheat bioactive compounds, their derived phenolic metabolites and their health benefits. Mol. Nutr. Food Res. 2017, 61, 1600475. [Google Scholar] [CrossRef] [PubMed]
  53. Aura, A. Microbial metabolism of dietary phenolic compounds in the colon. Phytochem. Rev. 2008, 7, 407–429. [Google Scholar] [CrossRef]
  54. Selma, M.V.; Espin, J.C.; Tomas-Barberan, F.A. Interaction between phenolics and gut microbiota: Role in human health. J. Agric. Food Chem. 2009, 57, 6485–6501. [Google Scholar] [CrossRef]
  55. Ojeda, D.; Jimenez-Ferrer, E.; Zamilpa, A.; Herrera-Arellano, A.; Tortoriello, J.; Alvarez, L. Inhibition of angiotensin convertin enzyme (ACE) activity by the anthocyanins delphinidin- and cyanidin-3-O-sambubiosides from Hibiscus sabdariffa. J. Ethnopharmacol. 2010, 127, 7–10. [Google Scholar] [CrossRef]
  56. Dong, J.; Xu, X.; Liang, Y.; Head, R.; Bennett, L. Inhibition of angiotensin converting enzyme (ACE) activity by polyphenols from tea (Camellia sinensis) and links to processing method. Food Funct. 2011, 2, 310–319. [Google Scholar] [CrossRef]
Figure 1. Differential pulse voltammograms of 0.25 mM of standard solutions of benzoic acid derivatives (gentisic, syringic, vanillic, homovanillic, and protocatechuic acid) and cinnamic acid derivatives (chlorogenic, p-coumaric, sinapic, ferulic, and caffeic acid) in 0.1 M Britton-Robinson (B-R) buffer, pH 6.0 in 80% methanol, recorded from −0.1 to +1.2 V; scan rate 100 mV s−1.
Metabolites 15 00443 g001
Figure 2. Differential pulse voltammograms of 0.25 mM of standards solution of rutin, quercetin, luteolin, apigenin, kaempferol, naringenin, cyanidin, delphinidin, and pelargonin and their main O-glucosides in 0.1 M Britton-Robinson (B-R) buffer, pH 6.0 in 80% methanol, recorded from −0.1 to +1.2 V; scan rate 100 mV s−1.
Metabolites 15 00443 g002aMetabolites 15 00443 g002bMetabolites 15 00443 g002c
Figure 3. Differential pulse voltammograms of 0.25 mM of standard solution (final concentration) of the low-molecular-weight phenolic metabolites in Britton-Robinson (B-R) buffer; pH 6.0 in 80% methanol recorded from −0.1 to +1.2 V; scan rate 100 mV s−1.
Metabolites 15 00443 g003aMetabolites 15 00443 g003b
Table 1. The ACE inhibitory activity and anodic peak potential of selected phenolic acids (both benzoic and cinnamic acid derivatives) *.
Phenolic AcidIC50 Value
(µM)
Equation of the Linear Regression Anodic   Peak   Potential   E p a   (mV)
Benzoic acid derivatives
Gentisic acid834.49 ± 9.26 gy = 0.038x + 18.373622 ± 8 c
Syringic acid2756.62 ± 36.34 dy = 0.007x + 30.428731 ± 9 a
Vanillic acid4108.26 ± 48.28 cy = 0.010x + 7.68549748 ± 10 a
Protocatechuic acid6234.53 ± 42.02 by = 0.007x + 6.358417 ± 12 e
Cinnamic acid derivatives
Chlorogenic acid134.2 ± 2.96 jy = 0.098x + 36.822443 ± 9 d
p-Coumaric acid314.89 ± 9.80 iy = 0.022x + 43.041672 ± 10 b
Sinapic acid493.11 ± 6.14 hy = 0.038x + 31.262618 ± 7 c
Ferulic acid979.58 ± 13.55 fy = 0.019x + 31.290611 ± 6 c
Caffeic acid9105.1 ± 58.2 ay = 0.004x + 15.401397 ± 8 e
Data are expressed as means ± standard deviation, n = 6. Means in a column labelled by the different letters are significantly different (p < 0.05) based on the one-way analysis of variance (ANOVA). * The IC50 of the control compounds, such as reduced glutathione (GSH) and captopril, was 41.68 ± 3.45 and 0.00586 ± 0.00004 µM.
Table 2. The ACE inhibitory activity and anodic peak potential of selected flavonoids and their glucosides *.
CompoundIC50 Value
(µM)
Equation of the Linear Regression Anodic   Peak   Potential   E p a   (mV)
Quercetin120.54 ± 1.56 my = 0.322x + 11.355330 ± 4 g
Rutin (quercetin-O-3-rutinoside)59.29 ± 0.48 ty = 0.383x + 27.285389 ± 4 g
Hyperoside (quercetin -3-O-D-galactoside157.24 ± 1.45 ny = 0.185x + 20.990307 ± 3 h
Luteolin77.10 ± 2.55 sy = 0.242x + 31.364407 ± 5 f
Luteolin-4′-O-glucoside88.93 ± 1.68 ry = 0.236x + 29.039828 ± 5 b
Luteolin-7-O-glucoside61.50 ± 1.62 ty = 0.207x + 37.282445 ± 3 e
Apigenin336.81 ± 3.72 dy = 0.080x + 22.954810 ± 6 c
Apigenin-7-O-glucoside218.44 ± 2.53 gy = 0.080x + 22.954841 ± 6 ab
Kaempferol131.95 ± 2.47 ky = 0.121x + 34.008394 ± 4 g
Kaempferol-3-O-glucoside110.27 ± 3.56 oy = 0.113x + 37.540359 ± 3 fg
Kaempferol-7-O-glucoside97.70 ± 2.08 py = 0.122x + 38.101419 ± 6 f
Naringenin390.75 ± 3.96 ay = 0.079x + 19.287819 ± 7 bc
Naringenin-7-O-glucoside357.17 ± 1.99 cy = 0.109x + 11.033830 ± 8 ab
Cyanidin176.22 ± 2.38 jy = 0.142x + 25.065295 ± 3 h
Cyanidin-3-O-glucoside 185.38 ± 2.58 iy = 0.137x + 24.696373 ± 4 g
Delphinidin247.72 ± 1.85 fy = 0.135x + 16.657259 ± 3 i
Delphinidin-3-O-glucoside208.78 ± 1.33 hy = 0.139x + 21.001453 ± 4 e
Pelargonidin292.68 ± 3.40 ey = 0.123x + 13.883228 ± 5 j
Pelargonidin-3-O-glucoside376.88 ± 2.61 by = 0.116x + 6.433473 ± 5 d
Data are expressed as means ± standard deviation, n = 6. Means in a column labelled by the different letters are significantly different (p < 0.05) based on the one-way analysis of variance (ANOVA). * The IC50 of the control compounds, such as reduced glutathione (GSH) and captopril, was 41.68 ± 3.45 and 0.00586 ± 0.00004 µM.
Table 3. The ACE inhibitory activity and anodic peak potential of low-molecular-weight phenolic acid metabolites *.
Phenolic AcidIC50 Value
(µM)
Equation of the Linear Regression Anodic   Peak   Potential   E p a (mV)
3-hydroxyphenylacetic acid (3-HPAA)678.86 ± 7.70 fy = 0.052x + 14.971883 ± 11 b
4-hydroxyphenylacetic acid (4-HPAA)1390.67 ± 10.18 by = 0.027x + 12.730815 ± 12 c
3,4-dihydroxyphenylacetic acid (3,4-DHPAA)672.82 ± 4.93 fy = 0.048x + 18.041432 ± 6 g
4-hydroxybenzoic acid (4-HBA)788.32 ± 11.08 dy = 0.039x + 18.546961 ± 11 a
3-(3,4-dihydroxyphenyl)propionic acid (3,4-DHPPA)612.04 ± 6.51 gy = 0.054x +16.705218 ± 3 h
3-(2-hydroxyphenyl)propionic acid(2-HPPA)932.92 ± 6.42 cy = 0.044x + 8.952781 ± 9 d
3-(4-hydroxyphenyl)propionic acid (4-HPPA)490.65 ± 4.45 hy = 0.053x + 24.143664 ± 8 e
3-(2,4-dihydroxyphenyl)propionic acid(3-2,4-DHPPA)744.66 ± 8.33 ey = 0.048x + 14.033659 ± 8 e
3-(4-hydroxyphenyl)propionic methyl ester (MET)726.02 ± 5.71 ey = 0.045x + 17.692574 ± 5 f
2-(3-methoxy-4-hydroxyphenyl)acetic acid (homovanillic acid) (HVA)1460.54 ± 10.80 ay = 0.019x + 10.253643 ± 5 e
Data are expressed as means ± standard deviation, n = 6. Means in a column labelled by the different letters are significantly different (p < 0.05) based on the one-way analysis of variance (ANOVA). * The IC50 of the control compounds, such as reduced glutathione (GSH) and captopril, was 41.68 ± 3.45 and 0.00586 ± 0.00004 µM.
Disclaimer/Publisher’s Note: The statements, opinions and data contained in all publications are solely those of the individual author(s) and contributor(s) and not of MDPI and/or the editor(s). MDPI and/or the editor(s) disclaim responsibility for any injury to people or property resulting from any ideas, methods, instructions or products referred to in the content.

