

An Integrated Analysis of Transcriptomic and Metabolomic Effects Reveals Insights into Stress Responses in Largemouth Bass (Micropterus salmoides) Under MS-222 (Tricaine Methanesulfonate) Exposure
 ,
,
Abstract
1. Introduction
2. Materials and Methods
2.1. Fish Husbandry
2.2. Experimental Design and Sampling
2.3. Transcriptomic Analysis
2.3.1. RNA Extraction
2.3.2. Library Preparation for Transcriptomic Sequencing
2.3.3. Clustering and Sequencing
2.3.4. Data Processing
2.4. Metabolomic Analysis
2.4.1. Sample Preparation and Extraction
2.4.2. HPLC Conditions
2.4.3. MS Conditions (AB)
2.4.4. Data Processing
3. Results
3.1. Transcriptomic Analysis
3.1.1. Transcriptomic Sequence Assembly
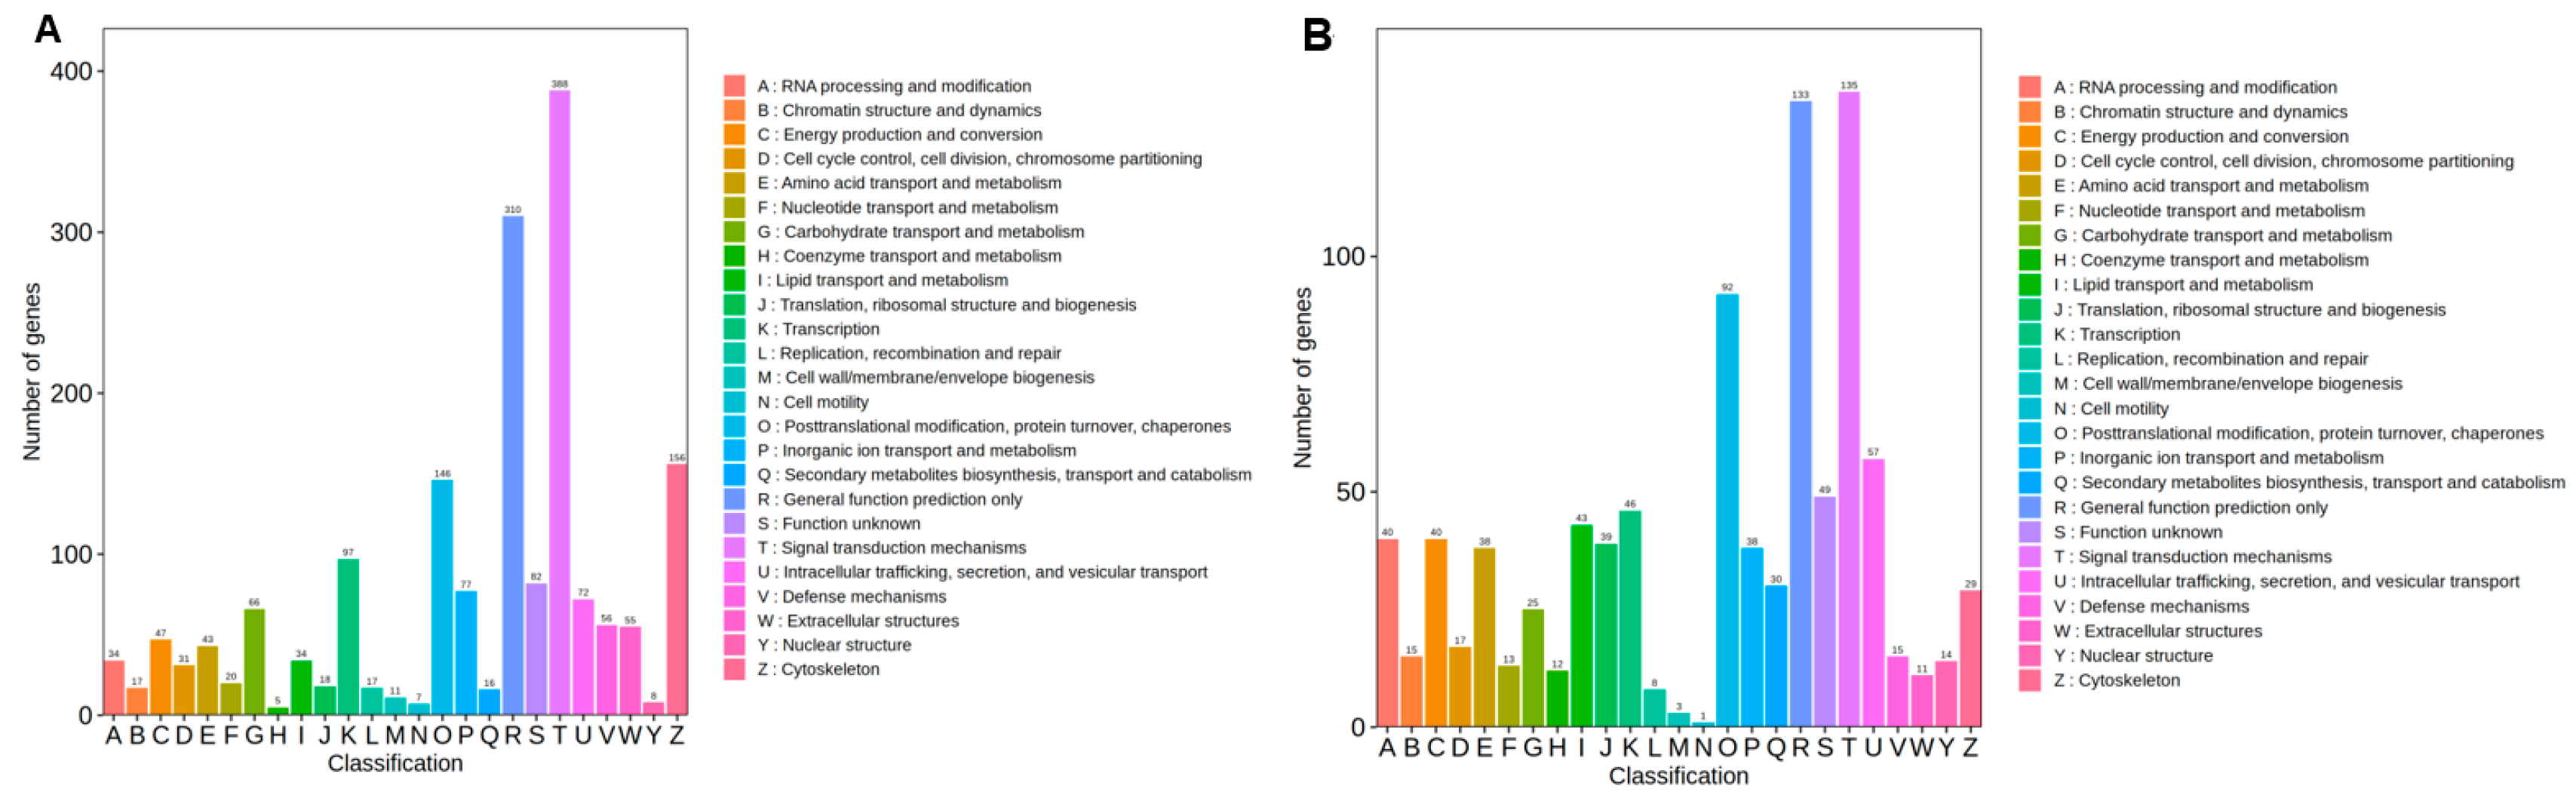
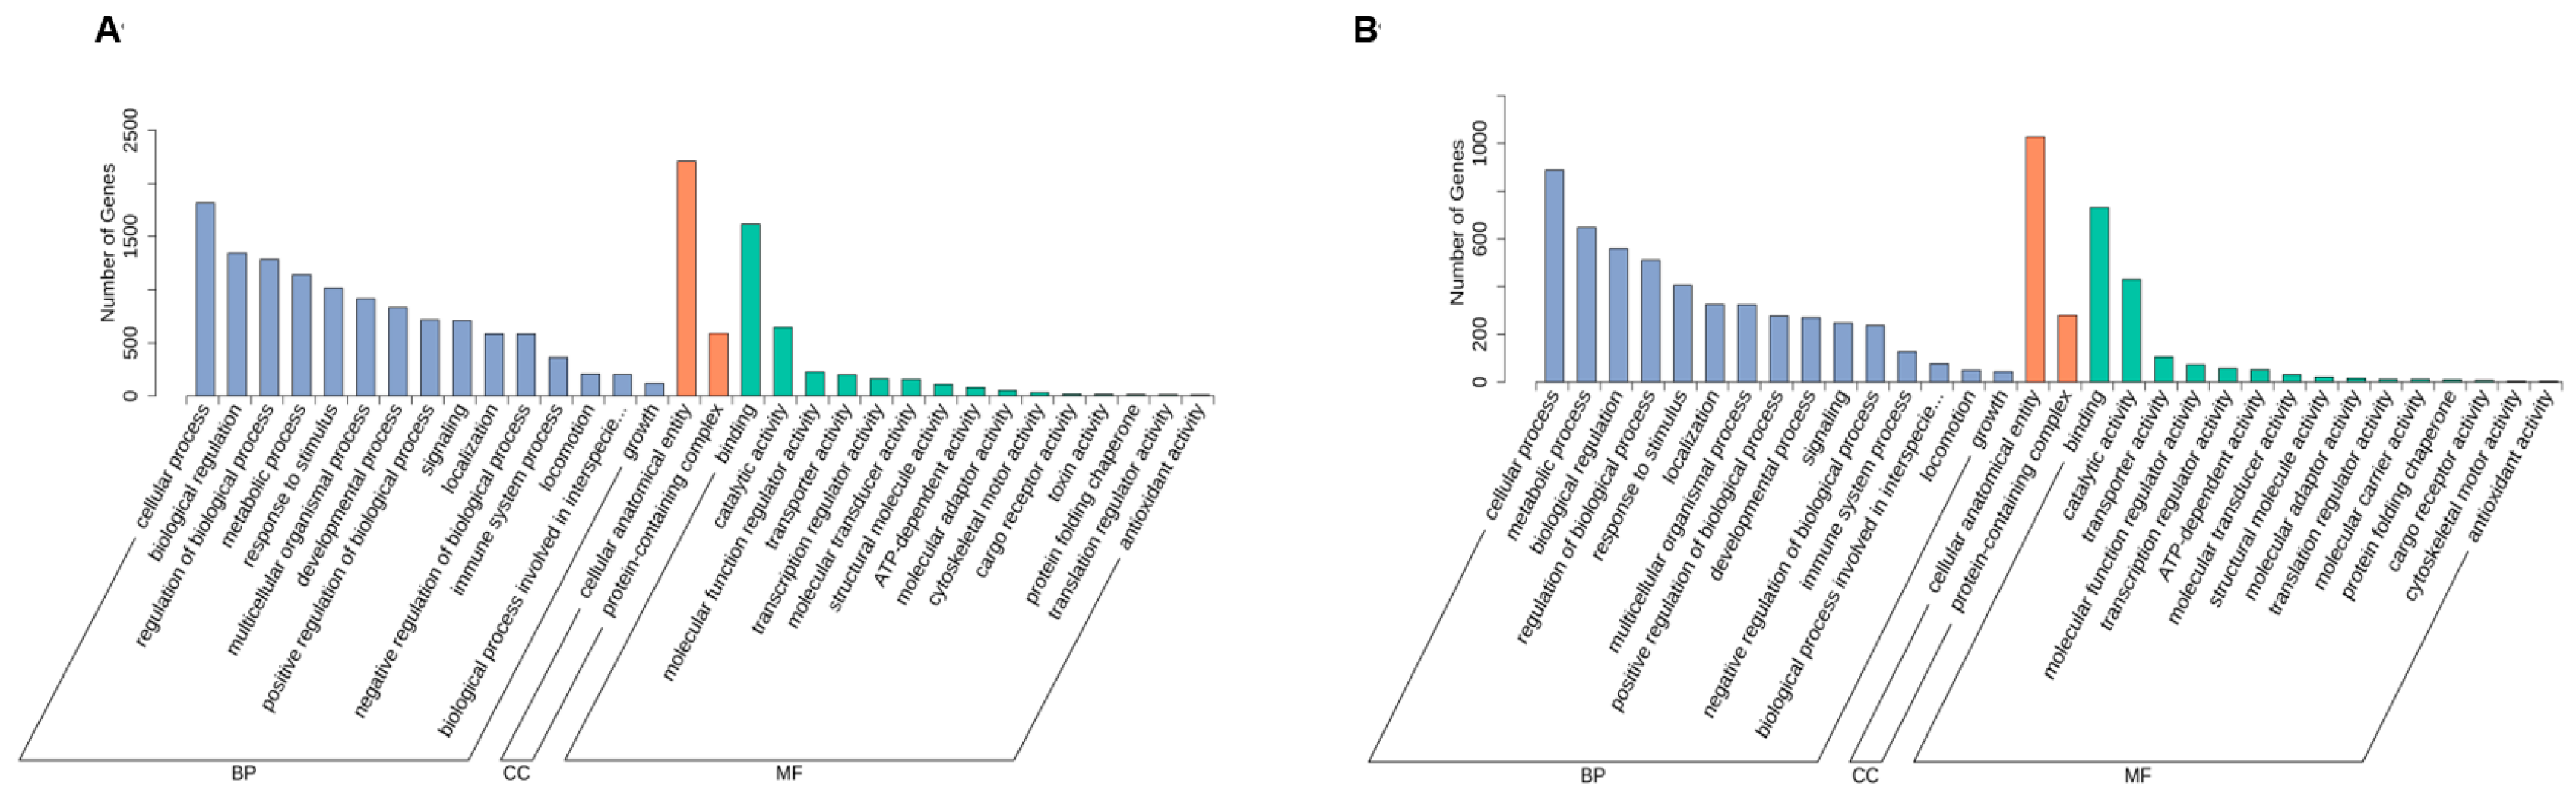
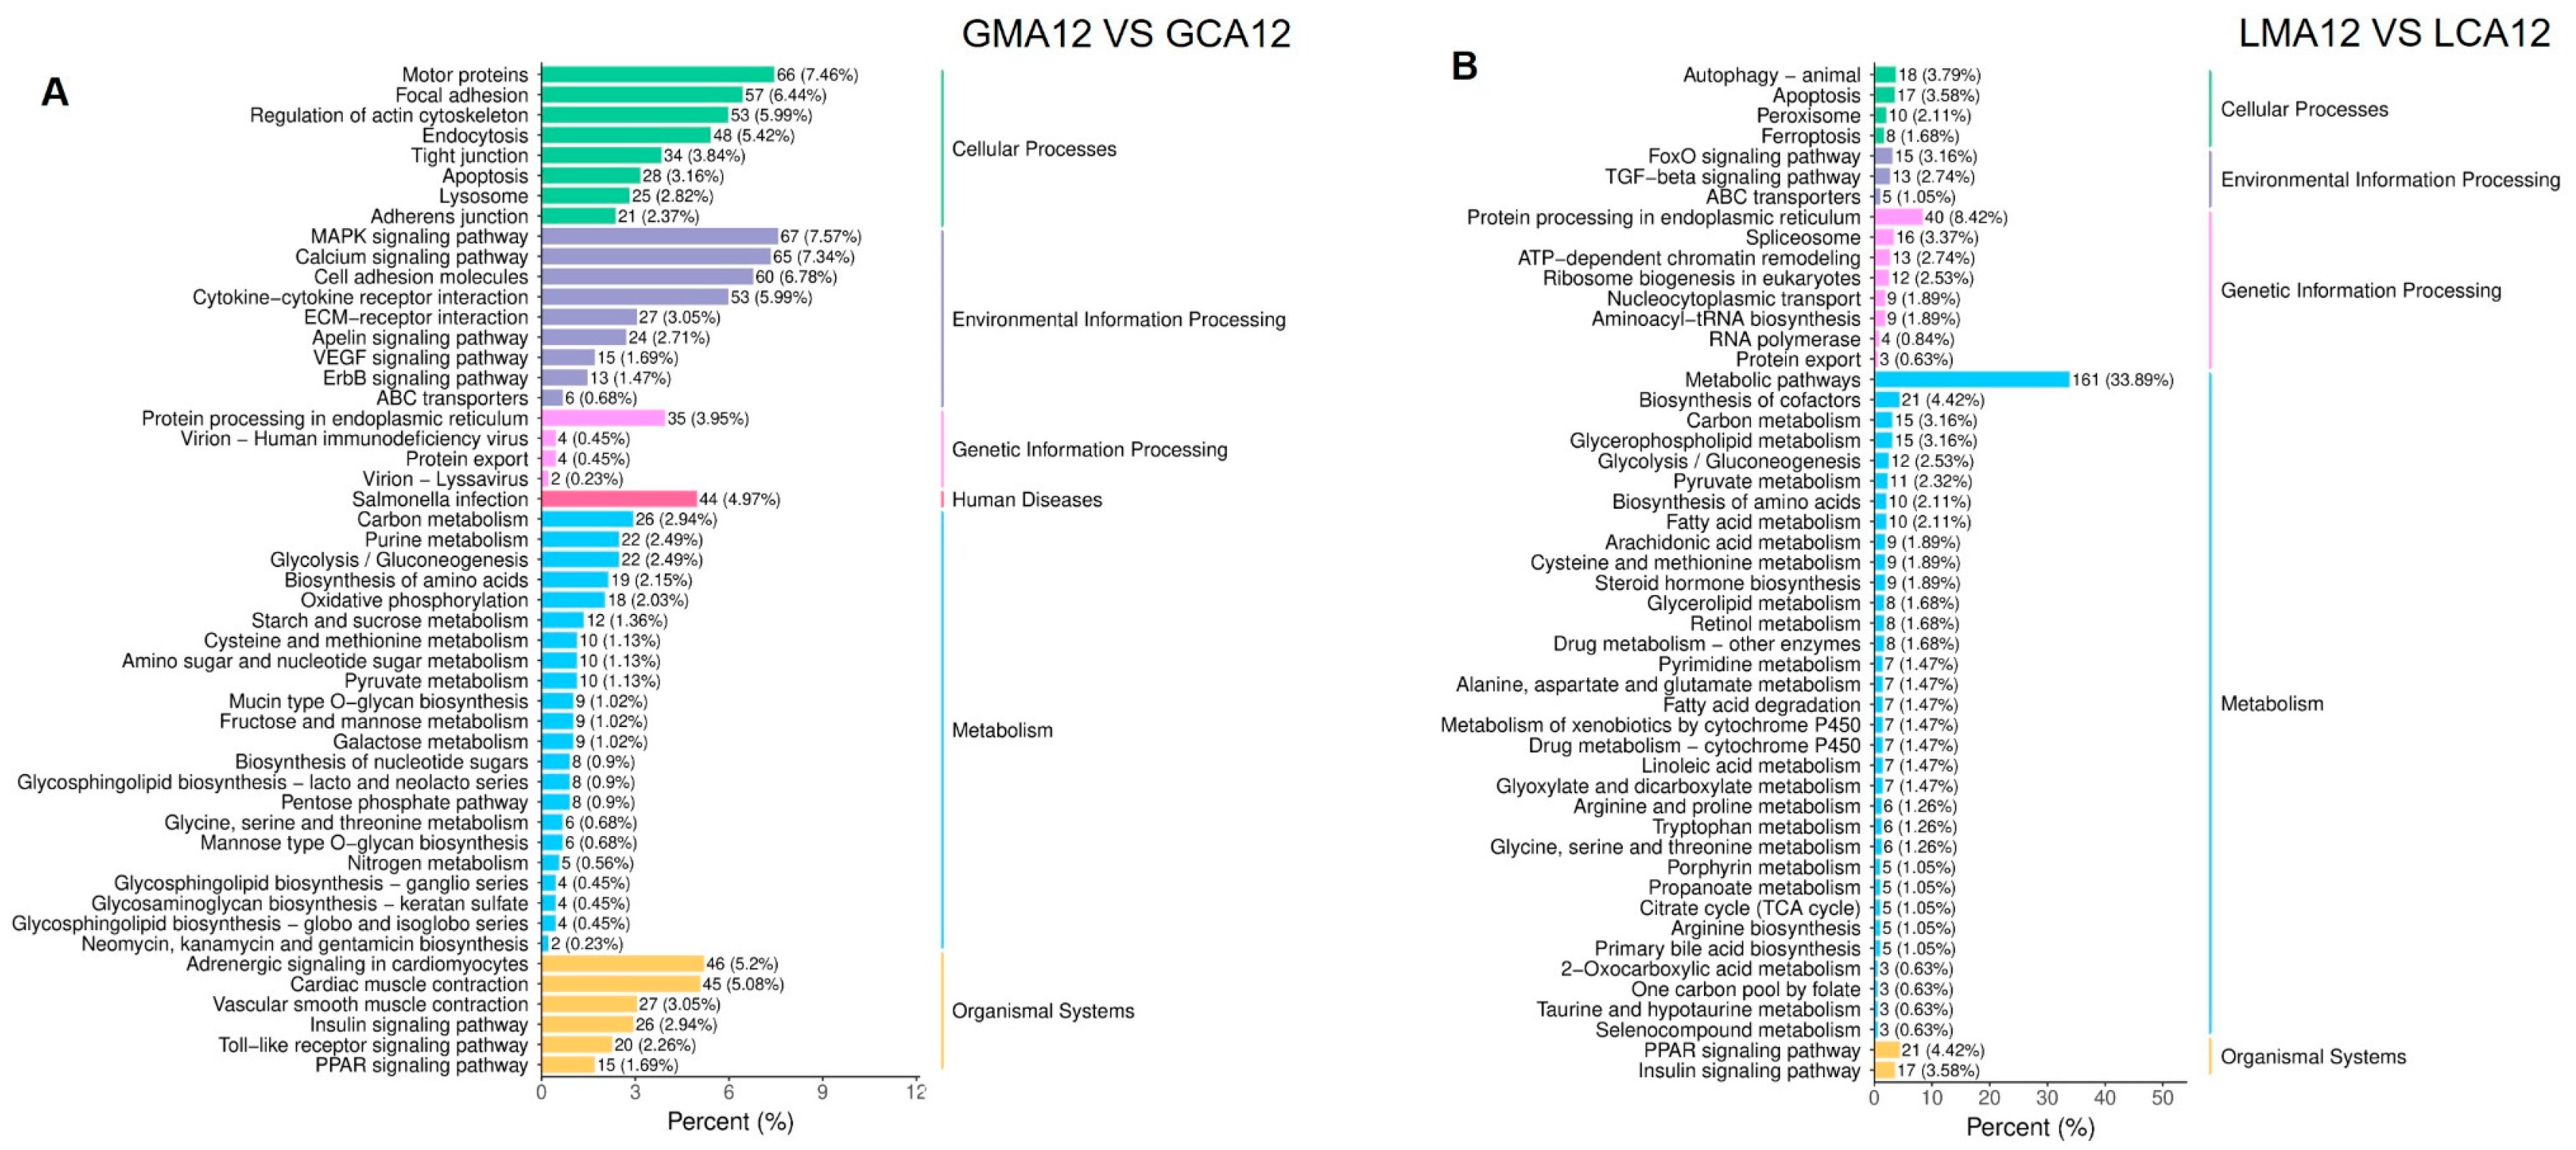
3.1.2. Annotation and Functional Analyses
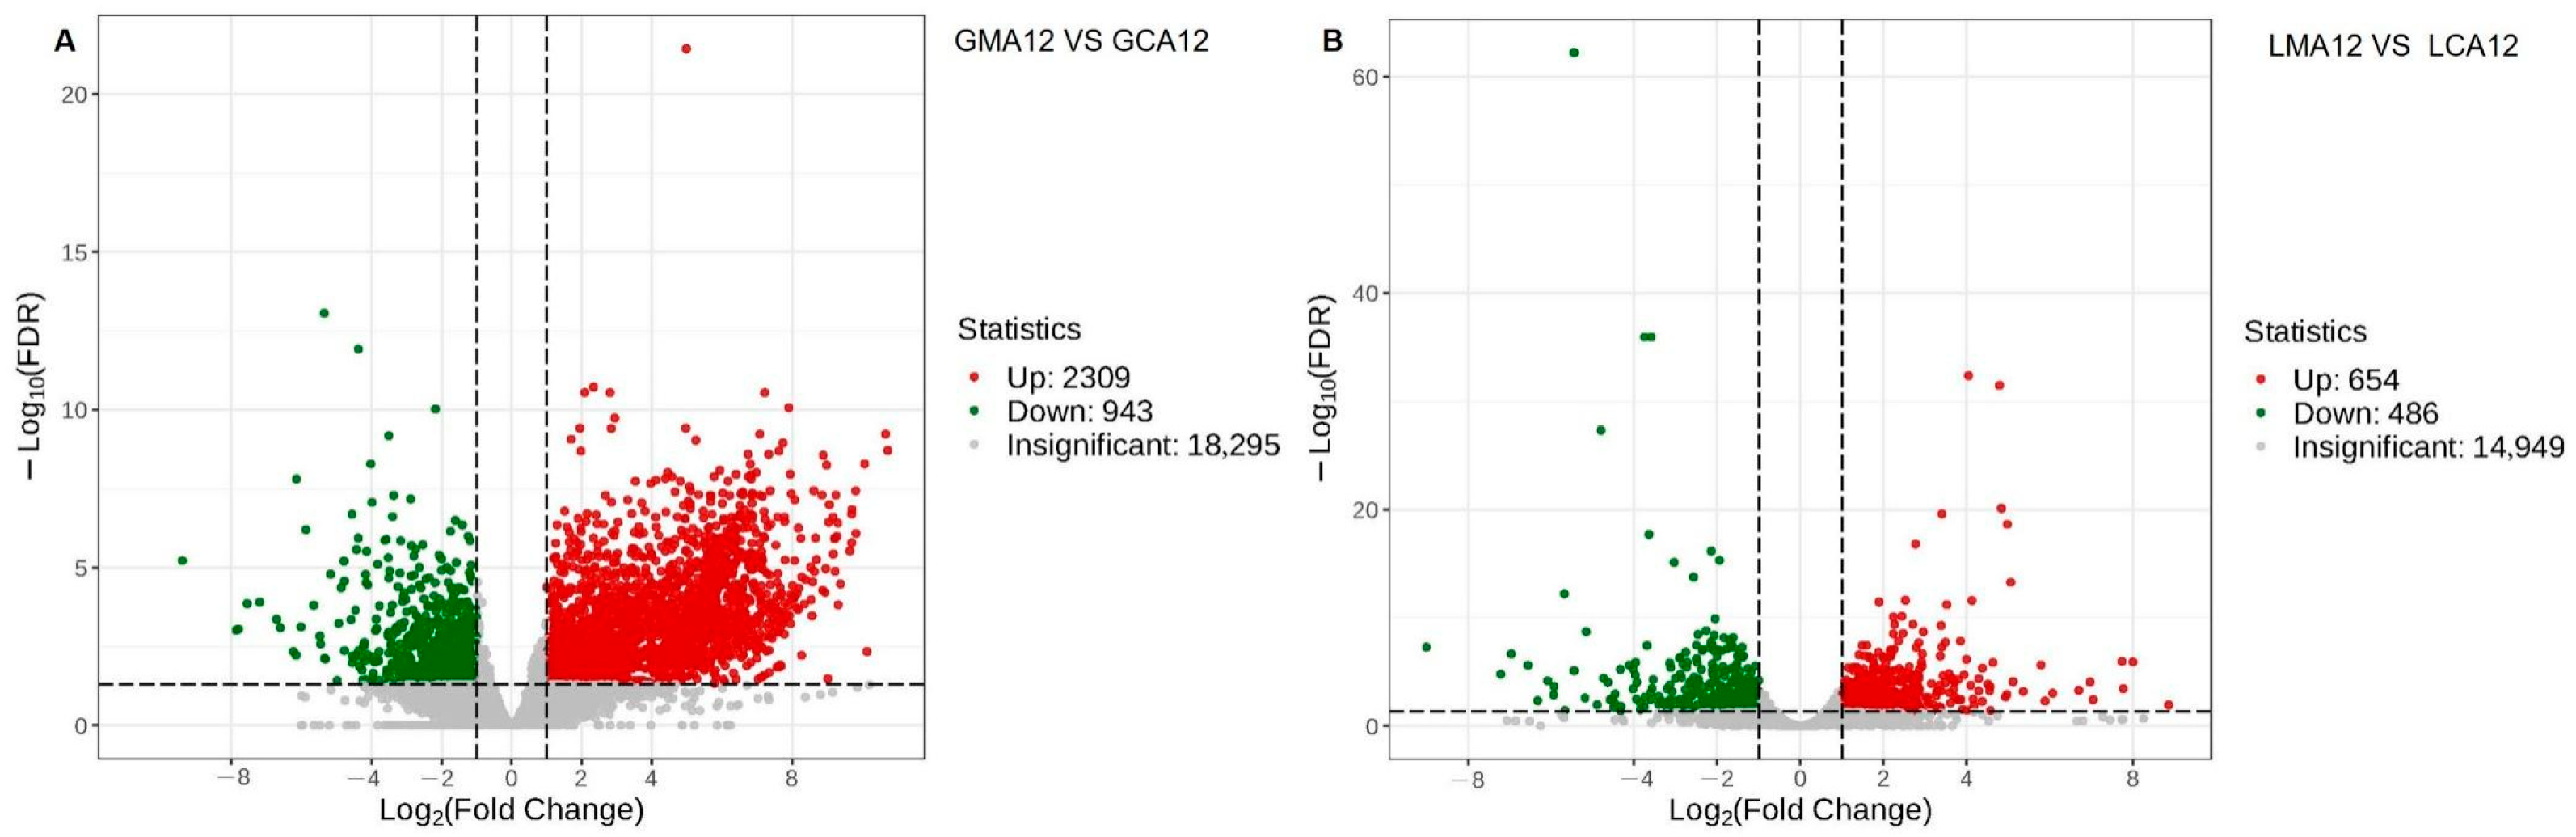
3.1.3. Differentially Expressed Genes
3.2. Metabolomic Analysis
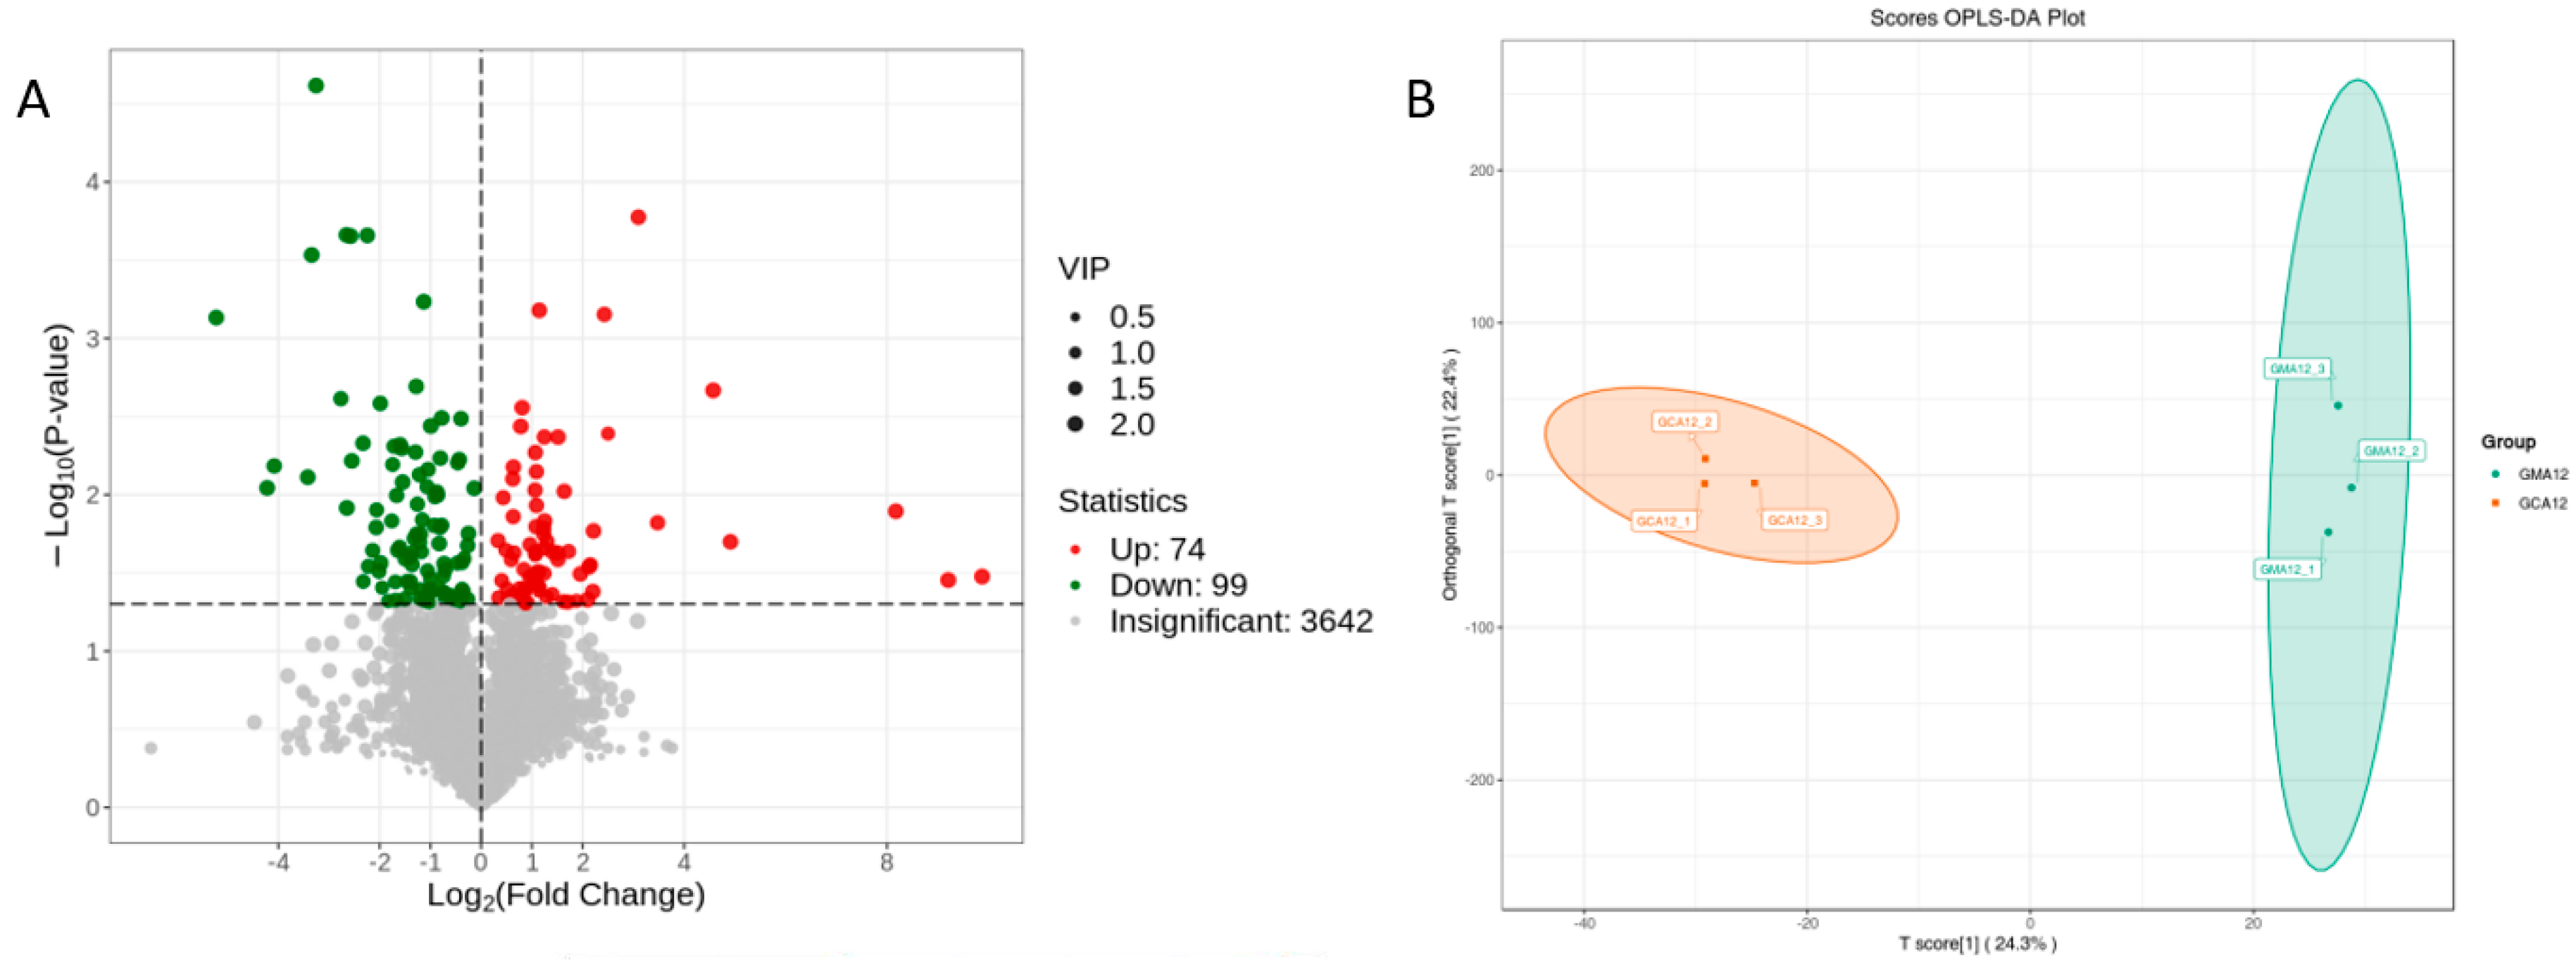
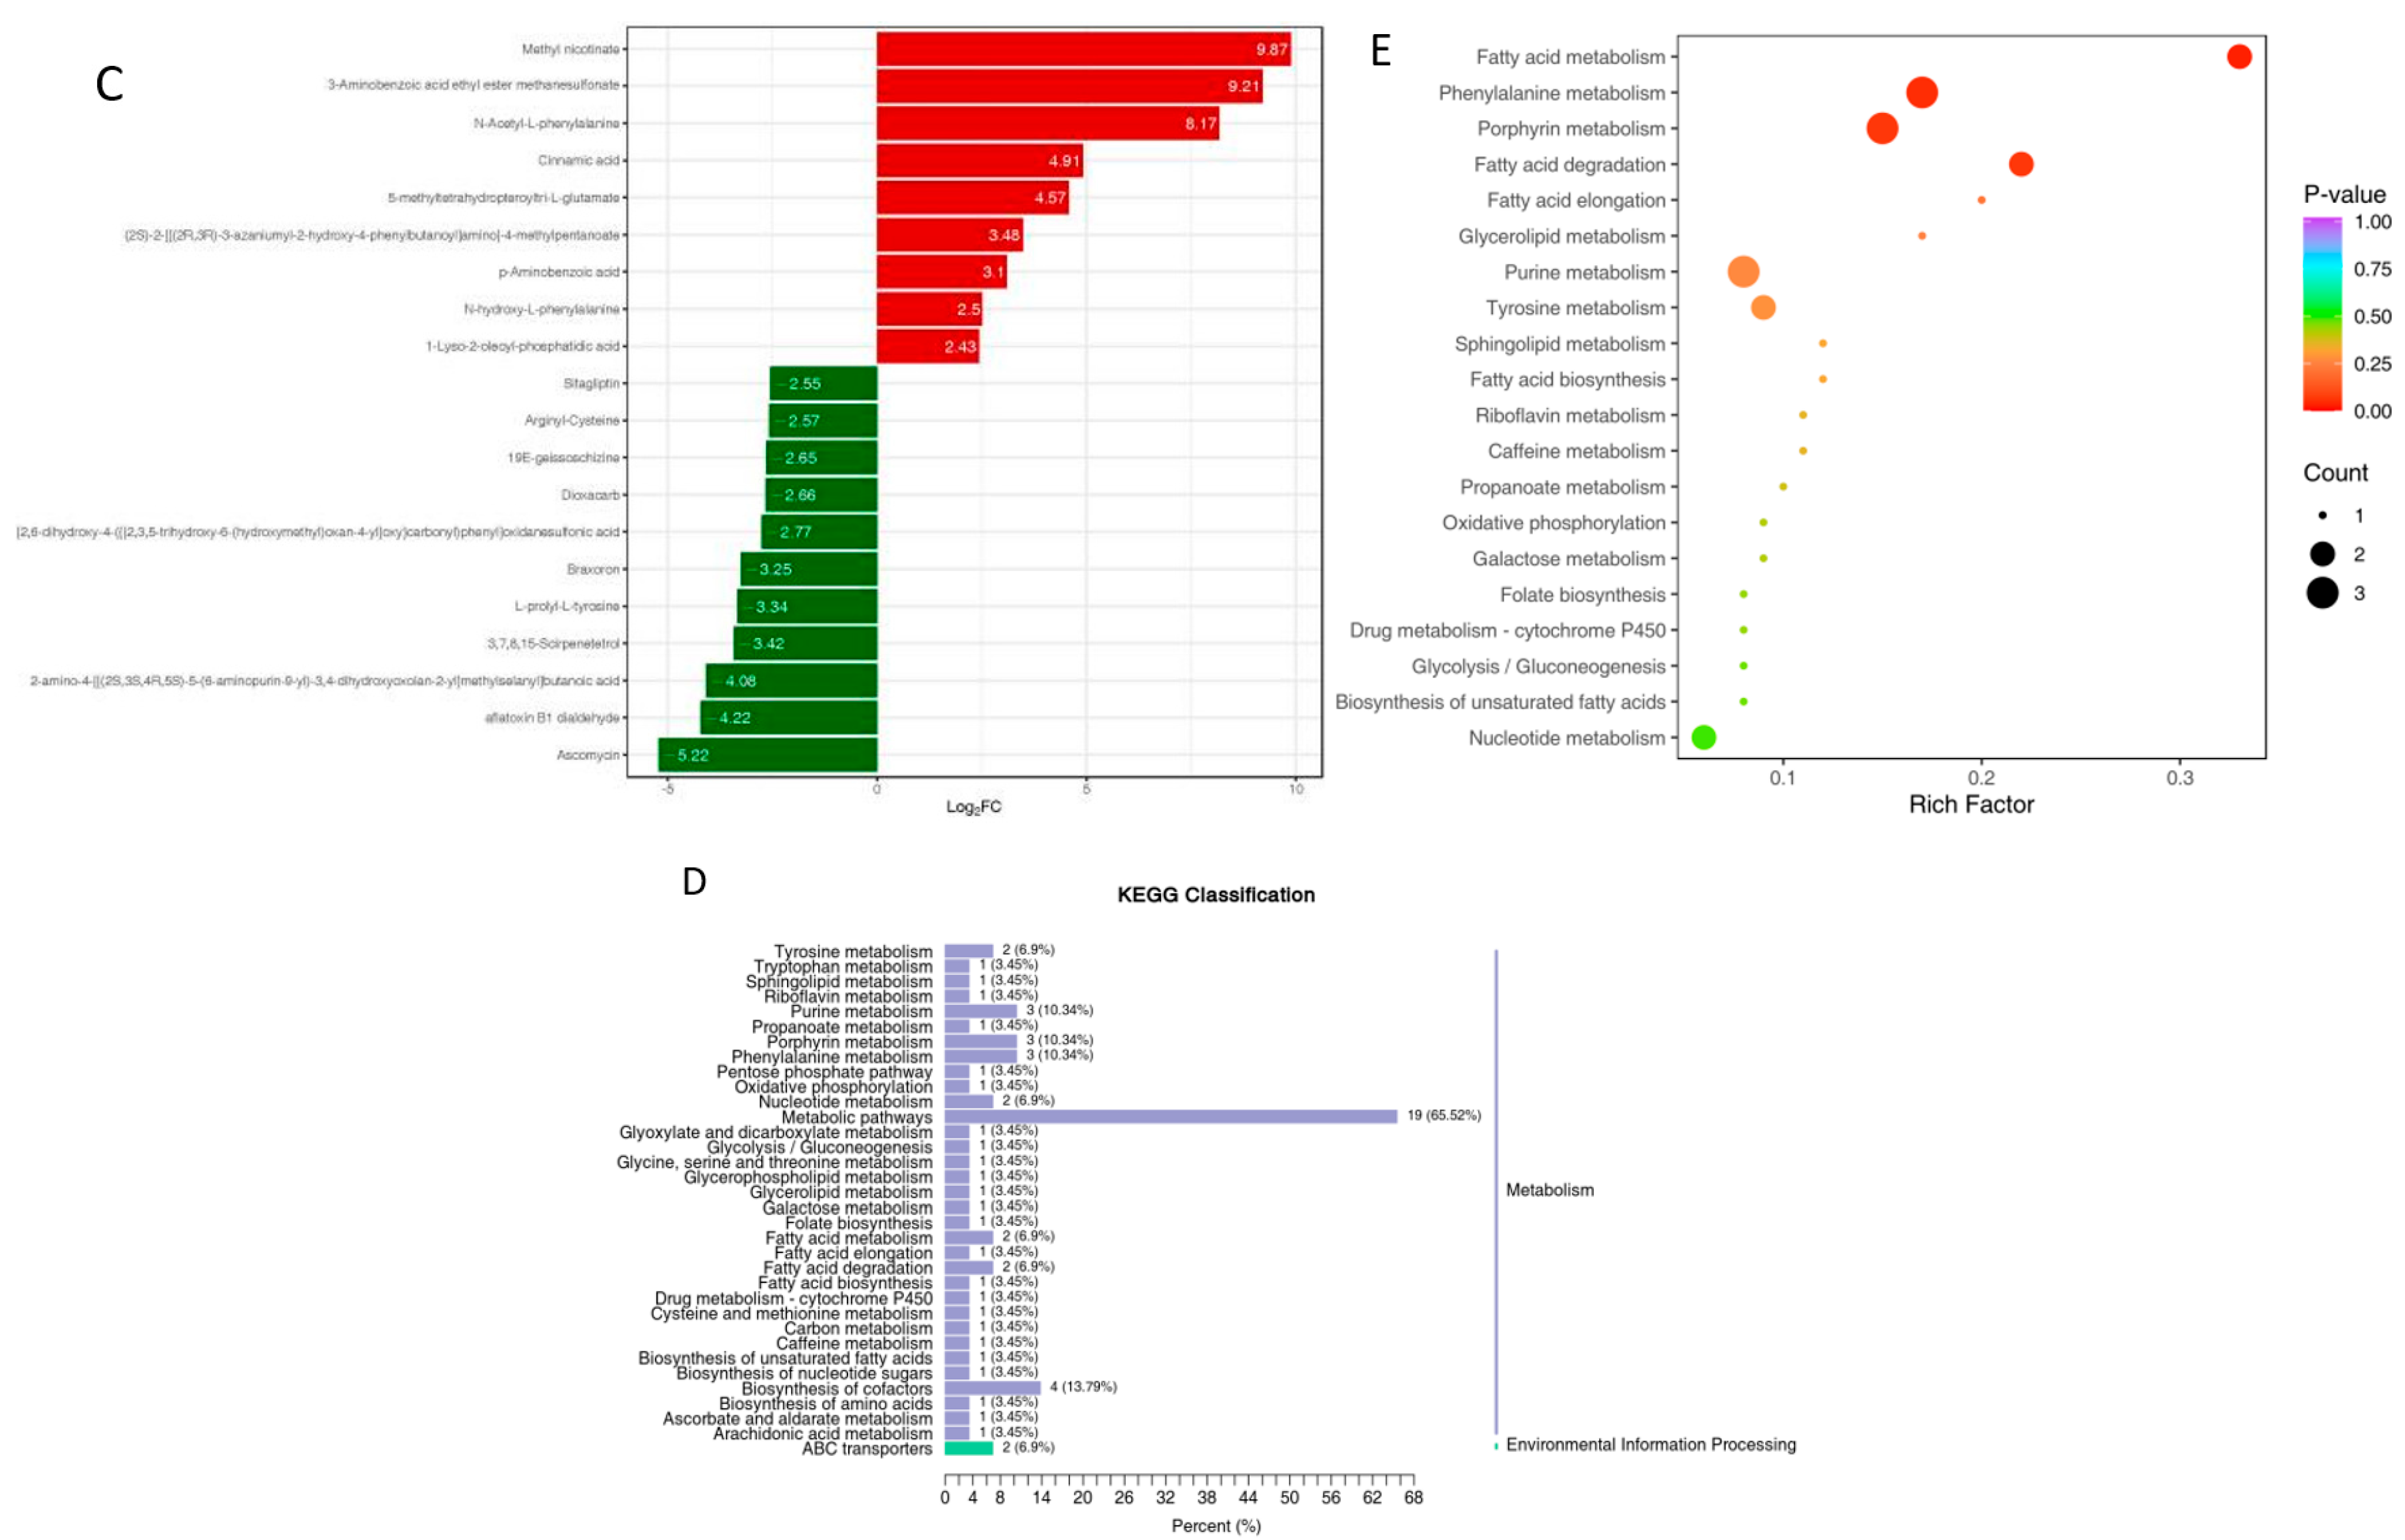
3.2.1. Gill
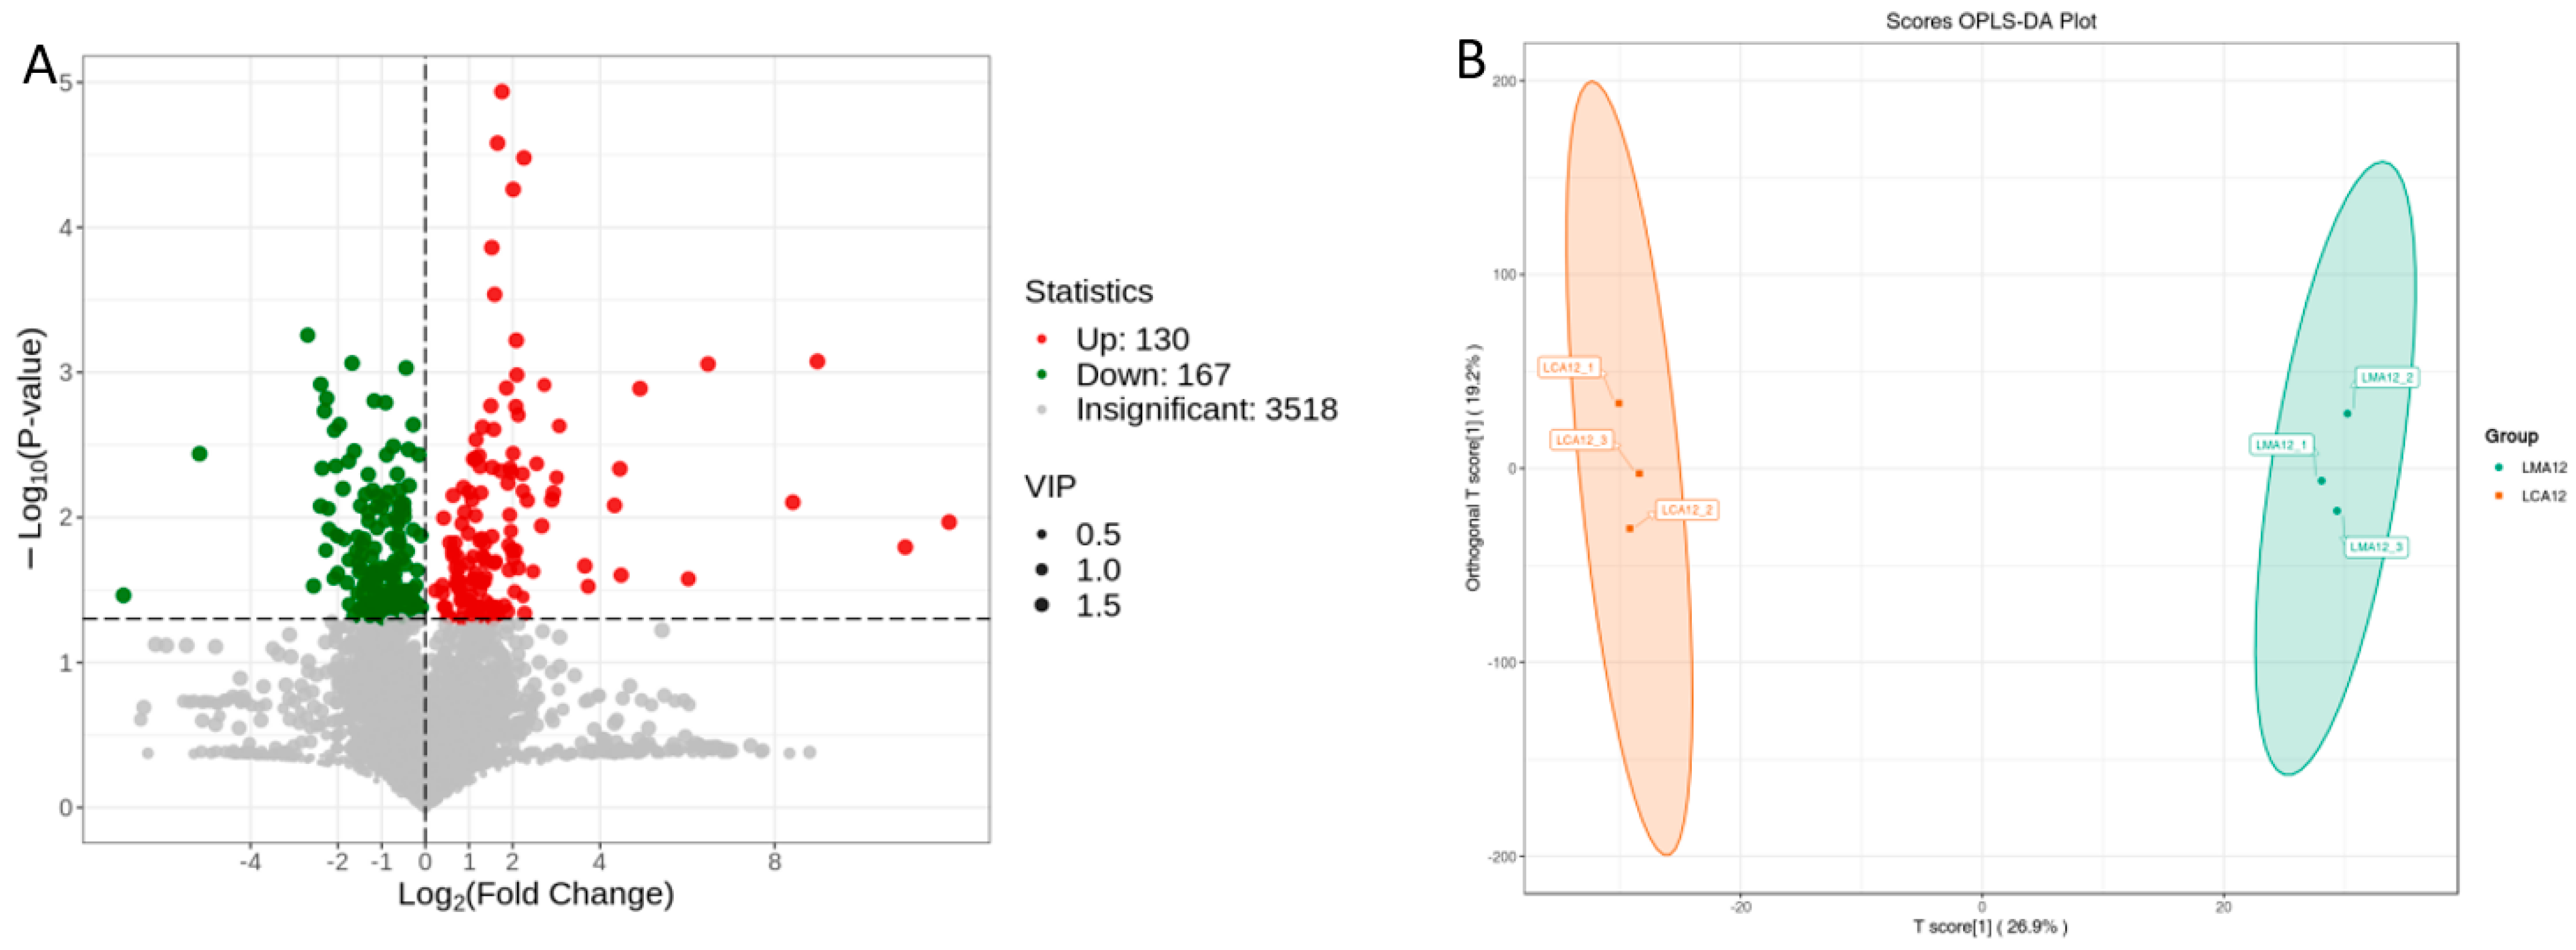
3.2.2. Liver
4. Discussion
4.1. Transcriptomic Response Profiles
4.1.1. Global Gene Expression Patterns
4.1.2. Gill-Specific Responses
4.1.3. Liver-Specific Responses
4.2. Metabolomic Remodeling Characteristics
4.2.1. Overall Metabolite Alterations
4.2.2. Amino Acid-Centric Adaptations
4.2.3. Tissue-Specific Energy Strategies
5. Conclusions
Supplementary Materials
Author Contributions
Funding
Institutional Review Board Statement
Informed Consent Statement
Data Availability Statement
Acknowledgments
Conflicts of Interest
References
- China Fishery Statistical Yearbook; China Agriculture Press: Beijing, China, 2024.
- Harmon, T.S. Methods for reducing stressors and maintaining water quality associated with live fish transport in tanks: A review of the basics. Rev. Aquacult. 2009, 1, 58–66. [Google Scholar] [CrossRef]
- Schreck, C.B.; Tort, L. The concept of stress in fish. Fish Physiol. 2016, 35, 1–34. [Google Scholar]
- Pan, H.M.; Jiang, L.X.; Zhang, C.F.; Huang, B.S. Research progress and safety evaluation of fishery anesthetics. Preserv. Process. 2021, 21, 136–143. [Google Scholar]
- FDA, U.S. Food and Drug Administration. Database of Approved Animal Drug Products. U.S. Department of Health and Human Services, Food and Drug Administration, Center for Veterinary Medicine; VMRCVM Drug Information Laboratory: Silver Spring, MD, USA, 2006. [Google Scholar]
- EFSA, European Food Safety Authority. Scientific report of EFSA prepared by Working Group on seabass/seabream welfare on Animal Welfare Aspects of Husbandry Systems for Farmed European seabass and gilthead seabream. Annex. I EFSA J. 2008, 844, 1–89. [Google Scholar]
- AFS (American Fisheries Society). Guide to Using Drugs, Biologics, and Other Chemicals in Aquaculture; FCS Working Group on Aquaculture Drugs, Chemicals, and Biologics: Bethesda, MD, USA, 2011; p. 65. [Google Scholar]
- Popovic, N.T.; Strunjak-Perovic, I.; Coz-Rakovac, R.; Barisic, J.; Jadan, M.; Berakovic, A.P.; Klobucar, R.S. Tricaine methane-sulfonate (MS-222) application in fish anaesthesia. J. Appl. Ichthyol. 2012, 28, 553–564. [Google Scholar] [CrossRef]
- Thomas, P.; Robertson, L. Plasma cortisol and glucose stress responses of red drum (Sciaenops ocellatus) to handling and shallow water stressors and anesthesia with MS-222, quinaldine sulfate and metomidate. Aquaculture 1991, 96, 69–86. [Google Scholar] [CrossRef]
- Chance, R.J.; Cameron, G.A.; Fordyce, M.; Noguera, P.; Wang, T.; Collins, C.; Secombes, C.J.; Collet, B. Effects of repeated anaesthesia on gill and general health of Atlantic salmon. Salmo salar. J. Fish Biol. 2018, 93, 1069–1081. [Google Scholar]
- Rożyński, M.; Hopko, M.; Stawecki, K.; Zakęś, Z. Impact of fish size, water temperature, and MS-222 concentration on inducing general anesthesia in pikeperch (Sander lucioperca). Aquacult. Res. 2018, 49, 2774–2781. [Google Scholar] [CrossRef]
- Rożyński, M.; Ziomek, E.; Demska-Zakęś, K.; Zakęś, Z. Impact of inducing general anaesthesia with MS-222 on haematological and biochemical parameters of pikeperch (Sander lucioperca). Aquacult. Res. 2019, 50, 2125–2132. [Google Scholar] [CrossRef]
- Soltanian, S.; Hoseinifar, S.H.; Gholamhosseini, A. Modulation of rainbow trout (Oncorhynchus mykiss) cutaneous mucosal immune responses following anesthesia: A comparative study on different anesthetic agents. Fish Shellfish Immunol. 2018, 80, 319–324. [Google Scholar] [CrossRef]
- Trushenski, J.T.; Bowker, J.D.; Mulligan, B.L.; Gause, B.R. Induction, recovery, and hematological responses of largemouth bass to chemo-and electrosedation. N. Am. J. Aquacult. 2012, 74, 214–223. [Google Scholar] [CrossRef]
- Jia, Y.D.; Xie, T.; Gao, Y.T.; Qin, H.Y.; Guan, C.T. Anesthetics efficacy and physiological response of MS-222 and clove oil in spotted knifejaw Oplegnathus punctatus. Aquacult. Rep. 2022, 25, 101201. [Google Scholar] [CrossRef]
- Wang, W.H.; Dong, H.B.; Sun, Y.X.; Cao, M.; Duan, Y.F.; Li, H.; Liu, Q.S.; Gu, Q.H.; Zhang, J.S. The efficacy of eugenol and tricaine methanesulphonate as anaesthetics for juvenile Chinese sea bass (Lateolabrax maculatus) during simulated transport. J. Appl. Ichthyol. 2018, 35, 551–557. [Google Scholar] [CrossRef]
- Zhang, H.Z.; Wang, Q.; Dong, Y.X.; Mei, J.; Xie, J. Effects of tricaine methanesulphonate (MS-222) on physiological stress and fresh quality of sea bass (Lateolabrax maculatus) under simulated high-density and long-distance transport stress. Biology 2023, 12, 223. [Google Scholar] [CrossRef]
- Liu, Y.; Zhou, X.W.; Ding, H.T.; Dong, X.J.; Zhang, J.J.; Zheng, Y.C.; Chen, X.N.; Cheng, H.L.; Ding, Z.J.; Xu, J.H. Effects of tricaine methanesulfonate (MS-222) on sedation and responses of yellow catfish (Pelteobagrus fulvidraco) subjected to simulated transportation stress. Aquaculture 2022, 549, 737789. [Google Scholar] [CrossRef]
- Cao, X.H.; Wang, Y.J.; Yu, N.; Le, Q.J.; Hu, J.B.; Yang, Y.; Kuang, S.W.; Zhang, M.; Sun, Y.B.; Gu, W.W.; et al. Transcriptome analysis reveals the influence of anaesthetic stress on the immune system of crucian carp (Carassius auratus) under the process of treatment and low concentration transport by MS-222 and Eugenol. Aquacult. Res. 2019, 50, 3138–3153. [Google Scholar] [CrossRef]
- Le, Q.J.; Hu, J.B.; Cao, X.H.; Kuang, S.W.; Zhang, M.; Yu, N.; Zheng, H.K.; Wang, Y.J.; Liu, H.W.; Yan, X.J. Transcriptomic and cortisol analysis reveals differences in stress alleviation by different methods of anesthesia in Crucian carp (Carassius auratus). Fish Shellfish Immunol. 2019, 84, 1170–1179. [Google Scholar] [CrossRef]
- Dong, H.B.; Wang, W.H.; Duan, Y.F.; Li, H.; Liu, Q.S.; Sun, Y.X.; Zhang, J.S. Transcriptomic analysis of juvenile Chinese sea bass (Lateolabrax maculatus) anesthetized by MS-222 (tricaine methanesulfonate) and eugenol. Fish Physiol. Biochem. 2020, 46, 909–920. [Google Scholar] [CrossRef]
- Pounder, K.C.; Mitchell, J.L.; Thomson, J.S.; Pottinger, T.G.; Sneddon, L.U. Physiological and behavioural evaluation of common anaesthesia practices in the rainbow trout. Appl. Animal Behav. Sci. 2018, 199, 94–102. [Google Scholar] [CrossRef]
- Gabriel, N.N.; Erasmus, V.N.; Namwoonde, A. Effects of different fish sizes, temperatures and concentration levels of sodium bicarbonate on anaesthesia in Mozambique tilapia (Oreochromis mossambicus). Aquaculture 2020, 529, 735716. [Google Scholar] [CrossRef]
- Segner, H.; Sundh, H.; Buchmann, K.; Douxfils, J.; Sundell, K.S.; Mathieu, C.; Ruane, N.; Jutfelt, F.; Tofent, H.; Vaughan, L. Health of farmed fish: Its relation to fish welfare and its utility as welfare indicator. Fish Physiol. Biochem. 2012, 38, 85–105. [Google Scholar] [CrossRef]
- Priborsky, J.; Velisek, J. A review of three commonly used fish anesthetics. Rev. Fish. Sci. Aquac. 2018, 26, 417–422. [Google Scholar] [CrossRef]
- Soldatov, A.A. Functional effects of the use of anesthetics on teleostean fishes. Inland Water Biol. 2021, 14, 67–77. [Google Scholar] [CrossRef]
- Nordgreen, J.; Tahamtani, F.M.; Janczak, A.M.; Horsberg, T.E. Behavioural effects of the commonly used fish anaesthetic tricaine methanesulfonate (MS-222) on zebrafish (Danio rerio) and its relevance for the acetic acid pain test. PLoS ONE 2014, 9, e92116. [Google Scholar] [CrossRef]
- Prystay, T.S.; Elvidge, C.K.; Twardek, W.M.; Logan, J.M.; Reid, C.H.; Clarke, S.H.; Foster, J.G.; Cooke, E.L.L.; Cooke, S.J. Comparison of the behavioral consequences and recovery patterns of Largemouth Bass exposed to MS-222 or electrosedation. T. Am. Fish. Soc. 2017, 146, 556–566. [Google Scholar] [CrossRef]
- Ayala-Soldado, N.; Mora-Medina, R.; Molina-López, A.M.; Lora-Benítez, A.J.; Moyano-Salvago, R. Evaluation of the Effectiveness of Eugenol and MS-222 as Anesthetics in Zebrafish in Repeated Exposures and Post-Anesthesia Behaviour. Animals 2024, 14, 2418. [Google Scholar] [CrossRef]
- Lü, A.J.; Hu, X.C.; Wang, Y.; Shen, X.J.; Li, X.; Zhu, A.H.; Tian, J.; Ming, Q.L.; Feng, Z.J. iTRAQ analysis of gill proteins from the zebrafish (Danio rerio) infected with Aeromonas hydrophila. Fish Shellfish Immunol. 2014, 36, 229–239. [Google Scholar] [CrossRef]
- Wang, W.H.; Dong, H.B.; Sun, Y.X.; Sun, C.Y.; Duan, Y.F.; Gu, Q.H.; Li, Y.; Xie, M.J.; Zhang, J.S. Immune and physiological responses of juvenile Chinese sea bass (Lateolabrax maculatus) to eugenol and tricaine methanesulfonate (MS-222) in gills. Aquacult. Rep. 2020, 18, 100554. [Google Scholar] [CrossRef]
- Muntean, B.S.; Horvat, C.M.; Behler, J.H.; AbouAlaiwi, W.A.; Nauli, A.M.; Williams, F.E.; Nauli, S.M. A comparative study of embedded and anesthetized zebrafish in vivo on myocardiac calcium oscillation and heart muscle contraction. Front. Pharmacol. 2010, 1, 139. [Google Scholar] [CrossRef]
- Schinner, C.; Vielmuth, F.; Rötzer, V.; Hiermaier, M.; Radeva, M.Y.; Co, T.K.; Hartlieb, E.; Schmidt, A.; Imhof, A.; Messoudi, A.; et al. Adrenergic signaling strengthens cardiac myocyte cohesion. Circul. Res. 2017, 120, 1305–1317. [Google Scholar] [CrossRef]
- Wang, W.; Yang, S.P.; Wang, C.G.; Shi, L.L.; Guo, H.; Chan, S.M. Gill transcriptomes reveal involvement of cytoskeleton remodeling and immune defense in ammonia stress response in the banana shrimp Fenneropenaeus merguiensis. Fish Shellfish Immunol. 2017, 71, 319–328. [Google Scholar] [CrossRef]
- Roberts, A.J.; Kon, T.; Knight, P.J.; Sutoh, K.; Burgess, S.A. Functions and mechanics of dynein motor proteins. Nat. Rev. Mol. Cell Biol. 2013, 14, 713–726. [Google Scholar] [CrossRef]
- Cuadrado, A.; Nebreda, A.R. Mechanisms and functions of p38 MAPK signalling. Biochem. J. 2010, 429, 403–417. [Google Scholar] [CrossRef]
- Duan, T.; Du, Y.; Xing, C.; Wang, H.Y.; Wang, R.F. Toll-like receptor signaling and its role in cell-mediated immunity. Front. Immunol. 2022, 13, 812774. [Google Scholar] [CrossRef]
- Gehart, H.; Kumpf, S.; Ittner, A.; Ricci, R. MAPK signalling in cellular metabolism: Stress or wellness? EMBO Rep. 2010, 11, 834–840. [Google Scholar] [CrossRef]
- Hong, D.Y.; Kwon, K.; Lee, K.R.; Choi, Y.J.; Goo, T.W.; Yu, K.; Kim, S.W.; Kwon, O.Y. Lidocaine induces endoplasmic reticulum stress-associated apoptosis in vitro and in vivo. Int. J. Mol. Sci. 2011, 12, 7652–7661. [Google Scholar] [CrossRef]
- Shen, F.Y.; Song, Y.C.; Guo, F.; Xu, Z.D.; Li, Q.; Zhang, B.; Ma, Y.Q.; Zhang, Y.Q.; Lin, R.; Li, Y.; et al. Cognitive impairment and endoplasmic reticulum stress induced by repeated short-term sevoflurane exposure in early life of rats. Front. Psychiatry 2018, 9, 332. [Google Scholar] [CrossRef]
- Ma, X.; Parson, C.; Ding, W.X. Regulation of the homeostasis of hepatic endoplasmic reticulum and cytochrome P450 enzymes by autophagy. Liver Res. 2018, 2, 138–145. [Google Scholar] [CrossRef]
- Wu, N.Y.; Wen, H.B.; Xu, P.; Chen, J.; Xue, M.M.; Li, J.L.; Wang, M.Y.; Song, C.Y.; Li, H.X. PPAR signaling maintains metabolic homeostasis under hypothermia in freshwater drum (Aplodinotus grunniens). Metabolites 2023, 13, 102. [Google Scholar] [CrossRef]
- Elawa, S.; Mirdell, R.; Farnebo, S.; Tesselaar, E. Skin blood flow response to topically applied methyl nicotinate: Possible mechanisms. Skin Res. Technol. 2020, 6, 343–348. [Google Scholar] [CrossRef]
- Bhandari, S.; Bisht, K.S.; Merkler, D.J. The biosynthesis and metabolism of the N-acylated aromatic amino acids: N-acylphenylalanine, N-acyltyrosine, N-acyltryptophan, and N-acylhistidine. Front. Mol. Biosci. 2022, 8, 801749. [Google Scholar] [CrossRef] [PubMed]
- Nelson, D.L.; Cox, M.M. Lehninger Principles of Biochemistry, 8th ed.; W.H. Freeman: New York, NY, USA, 2021. [Google Scholar]
- Lushchak, V.I. Environmentally induced oxidative stress in aquatic animals. Aquat. Toxicol. 2011, 101, 13–30. [Google Scholar] [CrossRef] [PubMed]
- Neis, E.P.; Dejong, C.H.; Rensen, S.S. The role of microbial amino acid metabolism in host metabolism. Nutrients 2015, 7, 2930–2946. [Google Scholar] [CrossRef] [PubMed]
- Yang, M.J.; Cheng, Z.X.; Jiang, M.; Zeng, Z.H.; Peng, B.; Peng, X.X.; Li, H. Boosted TCA cycle enhances survival of zebrafish to Vibrio alginolyticus infection. Virulence 2018, 9, 634–644. [Google Scholar] [CrossRef]
- Li, P.; Gatlin III, D.M. Nucleotide nutrition in fish: Current knowledge and future applications. Aquaculture 2006, 251, 141–152. [Google Scholar] [CrossRef]


| Sample | Raw Reads | Clean Reads | Clean Base (G) | Error Rate (%) | Q20 (%) | Q30 (%) | GC Content (%) |
|---|---|---|---|---|---|---|---|
| GCA12_1 | 47,779,856 | 45,645,160 | 6.85 | 0.03 | 97.6 | 93.24 | 47.33 |
| GCA12_2 | 48,091,768 | 46,731,910 | 7.01 | 0.03 | 97.32 | 92.62 | 46.16 |
| GCA12_3 | 46,402,036 | 45,195,964 | 6.78 | 0.03 | 97.34 | 92.6 | 46.76 |
| GMA12_1 | 46,078,140 | 43,466,010 | 6.52 | 0.03 | 96.39 | 91.37 | 46.54 |
| GMA12_2 | 46,143,790 | 44,027,190 | 6.60 | 0.03 | 96.94 | 92.37 | 45.40 |
| GMA12_3 | 47,919,228 | 46,176,644 | 6.93 | 0.03 | 97.3 | 92.8 | 47.41 |
| LCA12_1 | 54,554,562 | 53,317,498 | 8.00 | 0.03 | 97.45 | 92.82 | 47.88 |
| LCA12_2 | 54,862,588 | 53,770,872 | 8.07 | 0.03 | 97.29 | 92.45 | 47.59 |
| LCA12_3 | 50,456,582 | 49,470,860 | 7.42 | 0.03 | 97.58 | 93.05 | 47.43 |
| LMA12_1 | 51,634,666 | 50,452,610 | 7.57 | 0.03 | 97.52 | 92.89 | 48.88 |
| LMA12_2 | 50,587,374 | 49,199,952 | 7.38 | 0.03 | 97.85 | 93.65 | 48.64 |
| LMA12_3 | 52,125,768 | 50,729,502 | 7.61 | 0.03 | 97.2 | 92.4 | 46.22 |
| Sample | Total Reads | Reads Mapped | Unique Mapped | Multi Mapped |
|---|---|---|---|---|
| GCA12_1 | 45,645,160 | 43,950,315 (96.29%) | 40,734,042 (89.24%) | 3,216,273 (7.05%) |
| GCA12_2 | 46,731,910 | 44,782,783 (95.83%) | 41,196,719 (88.16%) | 3,586,064 (7.67%) |
| GCA12_3 | 45,195,964 | 43,526,886 (96.31%) | 40,055,401 (88.63%) | 3,471,485 (7.68%) |
| GMA12_1 | 43,466,010 | 40,121,249 (92.30%) | 36,667,547 (84.36%) | 3,453,702 (7.95%) |
| GMA12_2 | 44,027,190 | 41,029,375 (93.19%) | 38,306,518 (87.01%) | 2,722,857 (6.18%) |
| GMA12_3 | 46,176,644 | 44,052,857 (95.40%) | 39,506,689 (85.56%) | 4,546,168 (9.85%) |
| LCA12_1 | 53,317,498 | 51,649,052 (96.87%) | 46,284,750 (86.81%) | 5,364,302 (10.06%) |
| LCA12_2 | 53,770,872 | 51,762,201 (96.26%) | 45,014,672 (83.72%) | 6,747,529 (12.55%) |
| LCA12_3 | 49,470,860 | 47,830,869 (96.68%) | 41,344,771 (83.57%) | 6,486,098 (13.11%) |
| LMA12_1 | 50,452,610 | 48,712,746 (96.55%) | 42,378,751 (84.00%) | 6,333,995 (12.55%) |
| LMA12_2 | 49,199,952 | 47,719,632 (96.99%) | 43,063,660 (87.53%) | 4,655,972 (9.46%) |
| LMA12_3 | 50,729,502 | 48,694,832 (95.99%) | 44,096,718 (86.93%) | 4,598,114 (9.06%) |
Disclaimer/Publisher’s Note: The statements, opinions and data contained in all publications are solely those of the individual author(s) and contributor(s) and not of MDPI and/or the editor(s). MDPI and/or the editor(s) disclaim responsibility for any injury to people or property resulting from any ideas, methods, instructions or products referred to in the content. |
© 2025 by the authors. Licensee MDPI, Basel, Switzerland. This article is an open access article distributed under the terms and conditions of the Creative Commons Attribution (CC BY) license (https://creativecommons.org/licenses/by/4.0/).
Share and Cite
Gao, P.; Chen, R.; Ma, D.; Lin, S.; Yu, H.; Zhang, X. An Integrated Analysis of Transcriptomic and Metabolomic Effects Reveals Insights into Stress Responses in Largemouth Bass (Micropterus salmoides) Under MS-222 (Tricaine Methanesulfonate) Exposure. Metabolites 2025, 15, 349. https://doi.org/10.3390/metabo15060349
Gao P, Chen R, Ma D, Lin S, Yu H, Zhang X. An Integrated Analysis of Transcriptomic and Metabolomic Effects Reveals Insights into Stress Responses in Largemouth Bass (Micropterus salmoides) Under MS-222 (Tricaine Methanesulfonate) Exposure. Metabolites. 2025; 15(6):349. https://doi.org/10.3390/metabo15060349
Chicago/Turabian StyleGao, Ping, Rimeng Chen, Deyun Ma, Shanshan Lin, Haodong Yu, and Xuezhen Zhang. 2025. "An Integrated Analysis of Transcriptomic and Metabolomic Effects Reveals Insights into Stress Responses in Largemouth Bass (Micropterus salmoides) Under MS-222 (Tricaine Methanesulfonate) Exposure" Metabolites 15, no. 6: 349. https://doi.org/10.3390/metabo15060349
APA StyleGao, P., Chen, R., Ma, D., Lin, S., Yu, H., & Zhang, X. (2025). An Integrated Analysis of Transcriptomic and Metabolomic Effects Reveals Insights into Stress Responses in Largemouth Bass (Micropterus salmoides) Under MS-222 (Tricaine Methanesulfonate) Exposure. Metabolites, 15(6), 349. https://doi.org/10.3390/metabo15060349