Article

Urinary Hippuric Acid as a Sex-Dependent Biomarker for Fruit and Nut Intake Raised from the EAT-Lancet Index and Nuclear Magnetic Resonance Analysis

by
Edwin Fernández-Cruz
1,2,*,†,
Víctor de la O
1,2,†,
Cristina M. Fernández-Diaz
1,
Pilar Matía-Martín
3,4,5,
M. Ángel Rubio-Herrera
3,5,
Nuria Amigó
6,
Alfonso L. Calle-Pascual
4,5,7 and
J. Alfredo Martínez
1,7,8,*
1
IMDEA Food, CEI UAM + CSIC, Carretera de Cantoblanco 8, 28049 Madrid, Spain
2
Faculty of Health Sciences, International University of La Rioja (UNIR), 26006 Logroño, Spain
3
Endocrinology and Nutrition Department, San Carlos Clinical Hospital and Instituto de Investigación Sanitaria San Carlos (IdISSC), 28040 Madrid, Spain
4
Centro de Investigación Biomédica en Red de Diabetes y Enfermedades Metabólicas Asociadas (CIBERDEM), 28029 Madrid, Spain
5
Department of Medicine II, Faculty of Medicine, Complutense University of Madrid, 28040 Madrid, Spain
6
Departament de Ciències Mèdiques Bàsiques, Universitat Rovira i Virgili, 43201 Tarragona, Spain
7
Centro de Investigación Biomédica en Red Fisiopatología de La Obesidad y La Nutrición (CIBEROBN), Institute of Health Carlos III, 28029 Madrid, Spain
8
Department of Medicine and Endocrinology, Campus of Soria, University of Valladolid, 42004 Soria, Spain
*
Authors to whom correspondence should be addressed.
These authors contributed equally to this work.
Metabolites 2025, 15(6), 348; https://doi.org/10.3390/metabo15060348
Submission received: 28 March 2025 / Revised: 14 May 2025 / Accepted: 21 May 2025 / Published: 23 May 2025

Abstract

Background/Objectives: Assessing nutrient intake is essential for understanding body homeostasis and diet–health interactions. Traditional methods, such as dietary questionnaires and quality indices, are limited by subjectivity and variability in food composition tables. Metabolomic markers, like urinary hippuric acid, provide an objective means to estimate food and nutrient intake, helping to link dietary patterns with metabolic outputs and health outcomes. This study uniquely evaluates urinary hippuric acid as a putative biomarker of nut intake, expanding the previously known role as a fruit intake marker, and investigates sex-related differences in the excretion. Methods: Using Nuclear Magnetic Resonance (NMR) spectroscopy, 34 urinary metabolites from 138 participants (69.7% women) in the Dietary Deal project were analyzed. Metabolite concentrations were categorized by median adherence to the EAT-Lancet score (≤p50 or >p50). A validated Food Frequency Questionnaire (FFQ) assessed dietary and energy intake. Correlation analyses linked metabolites to the 14 EAT-Lancet food groups, and a linear regression adjusted model examined associations between urinary hippuric acid and fruit/nut consumption, with sensitivity analysis for sex. Results: The EAT-Lancet index, stratified by median adherence, effectively distinguished between high and low dietary intake of fruits (p = 0.012) and nuts (p < 0.001). Urinary hippuric acid concentrations were found to be influenced by sex (p = 0.020), with females showing a 44.7% higher mean concentration. Overall, urinary hippuric acid levels were positively associated with FFQ-estimated nut consumption (p = 0.049), providing the first evidence of potential suitability as a nut intake biomarker. Conclusions: Hippuric acid emerges as a promising dietary biomarker for assessing nut intake in healthy populations. This study provides novel insights that extend the application of hippuric acid to dietary nut assessment and emphasizes the importance of a sex-specific interpretation for precision nutrition purposes using NMR technology.

Graphical Abstract

1. Introduction

Nutrition plays a critical role in maintaining health, preventing chronic diseases, and contributing to effective diet-based therapeutic strategies [1]. However, unhealthy dietary habits are major contributors to the global burden of chronic diseases, including obesity, cardiovascular events, type 2 diabetes, and certain cancers [2]. In this context, improving our understanding of the influence of nutrition on health is essential for developing targeted and evidence-based dietary interventions and public health policies.
Accurately assessing food and nutrient intake remains a key aspect of personalized nutritional advice and public health strategies [3]. However, traditional dietary assessment methods such as 24 h recalls, food frequency questionnaires (FFQ), and dietary records, are based on self-reported information, which is susceptible to various sources of bias, including underreporting, recall errors, and portion size estimation difficulties, in addition to food composition inaccuracies in existing databases [4,5]. To address these limitations, diet quality indices like the Alternate Healthy Eating Index (AHEI), the Dietary Approaches to Stop Hypertension (DASH) score, and the 14-item Mediterranean Diet Adherence Screener (14-MEDAS) have been used to summarize overall diet quality [6,7]. Recently, the EAT-Lancet score has emerged as a widely accepted index for evaluating adherence to dietary patterns with implications for both human and global health [8,9].
Despite dietary quality indices utility, these methods still lack objectivity and validation, since they rely on indirect indicators of food intake [5]. Consequently, researchers and nutritionists have shown a growing interest in dietary biomarkers—measurable biological compounds found in biofluids such as urine or blood—that can reflect actual food or nutrient intake more accurately than traditional self-reported methods [10,11]. Metabolomics, especially using Nuclear Magnetic Resonance (NMR) spectroscopy, offers an untargeted approach to identify metabolic fingerprints associated with dietary patterns and specific food intake [12,13]. For instance, proline betaine is associated with citrus fruits [14], trimethylamine-N-oxide with fish consumption [15], 3-methylhistidine with meat intake [16], and alkylresorcinol metabolites with grain consumption [17], among others, where advanced methodologies can facilitate the metabolomic approach. Also, NMR methodology has enabled the detection of a wide variety of metabolites derived from specific dietary components, particularly those abundant in plant-based foods, with an affordable methodology. Among them, polyphenols—naturally occurring compounds with antioxidant properties—have drawn significant attention due to their wide distribution in the diet and their impact on human health [18]. Dietary polyphenols are abundant in a wide range of foods, mainly fruits, vegetables, and beverages such as fruit juices, tea, coffee, and wine, and are extensively metabolized by the gut microbiota into smaller phenolic acids [19]. However, spices, herbs, nuts, seeds, and olive oil are also notable dietary sources of these compounds [20].
One of the most studied final products of microbial metabolism is hippuric acid, a conjugate of benzoic acid and glycine that is ultimately excreted in urine [21]. As such, urinary hippuric acid has consistently emerged as a potential biomarker of polyphenol-rich food intake, especially fruits and vegetables [22]. Nevertheless, the potential of this compound as a biomarker of other foods, such as nuts, has been scarcely explored and remains unvalidated in adult populations. Although some metabolomic studies have suggested that nuts may contribute to hippuric acid production due to their ellagitannin and proanthocyanidin content, consistent evidence is still lacking [23,24]. In this context, NMR offers a unique value for assessing dietary intake through urinary metabolites in comparison to High-Performance Liquid Chromatography (HPLC) and Gas Chromatography (GC) technologies [25].
Furthermore, biological sex influences nutrient metabolism, gut microbiota composition, and metabolic responses to dietary intake [26,27]. Sex-specific differences have been reported in polyphenol absorption, biotransformation, and excretion, which may affect the interpretation of dietary biomarkers such as hippuric acid [28]. Despite growing interest in personalized nutrition, few studies have simultaneously assessed dietary intake, urinary metabolomic profiles, and sex-specific differences in free-living populations [29]. This issue represents a relevant gap in the field, particularly in the context of precision nutrition, which aims to tailor dietary recommendations based on individual biological characteristics.
The aim of the present study is to evaluate the association between adherence to dietary pattern (as measured by the EAT-Lancet score) and urinary hippuric acid concentrations, while exploring sex-specific differences in this association. We hypothesized that urinary hippuric acid may serve as a biomarker of nut intake and that this relationship may be influenced by sex. By investigating hippuric acid as a sex-dependent biomarker of nut consumption, this study may contribute novel insights into the future validation of dietary biomarkers and support the integration of metabolomics into personalized nutrition strategies.

2. Materials and Methods

2.1. Study Design and Population

An ancillary observational pilot study was conducted as part of the Dietary Deal project (ref. AC21/00038). Approval for the clinical trial was granted by the Ethics Committee of the Hospital Clínico San Carlos on 7 June 2022 (Code 22/363-E). A total of 138 adult participants of both sexes were recruited from the Endocrinology Department at Hospital Clínico San Carlos (Madrid, Spain) between November 2022 and June 2023. The inclusion criteria required male and female volunteers aged between 18 and 75 years, with a medical record number at the hospital, an adequate educational level and understanding of the nutritional study, and a willingness to voluntarily participate by providing written informed consent. Exclusion criteria included dementia, mental illness, cognitive impairment, participation in other parallel clinical trials, or the use of pharmacological treatments that could alter metabolite levels. Participation required compliance with all the inclusion criteria. This study included a single initial visit, where data on dietary intake, body composition, anthropometric measurements, quality of life, physical activity, and biochemical variables were collected for analysis and deposition.
Recruitment was carried out through medical specialists and staff from the Endocrinology Department at Hospital Clínico San Carlos. Patients attending outpatient consultations were informed about the study and provided with an information sheet and informed consent form, after which a date was scheduled for the study visit. Once enrolled, each participant was required to attend a single hospital visit, arriving after at least 12 h of fasting and bringing a 3-day dietary recall covering the days prior to the visit. Urine samples were collected from the first morning void and stored in sterile 150 mL containers, from which four 2 mL aliquots were extracted for subsequent analysis, following validated criteria. All aliquots were stored at −80 °C in an auto-monitored freezer until sample analysis. Subsequently, anthropometric measurements were taken, including body weight and height using a Seca 220 stadiometer, and body composition using a Seca mBCA 515® device, which was also used to calculate Body Mass Index (BMI), calculated as [weight (kg)/height2 (m2)] as previously described [30].
Later, a registered dietitian/nutritionist collected the signed informed consent forms, reviewed the 72 h dietary recalls, and administered a validated 136-item FFQ [31]. Then, the International Physical Activity Questionnaire Short Form (IPAQ-SF) was used to evaluate physical activity through the frequency and duration of moderate and vigorous activities, walking, and sedentary time over the past week, as detailed elsewhere [32]. The EAT-Lancet diet score was calculated following the methodology described by the EPIC-Oxford study [8]. The score is based on 14 dietary components aligned with the EAT-Lancet Commission’s reference diet. One point was assigned for each component if the intake met the predefined recommendation, resulting in a total score ranging from 0 to 14. Individual dietary intakes were estimated using the validated 136-item FFQ, and the EAT-Lancet score was subsequently derived from the FFQ responses.

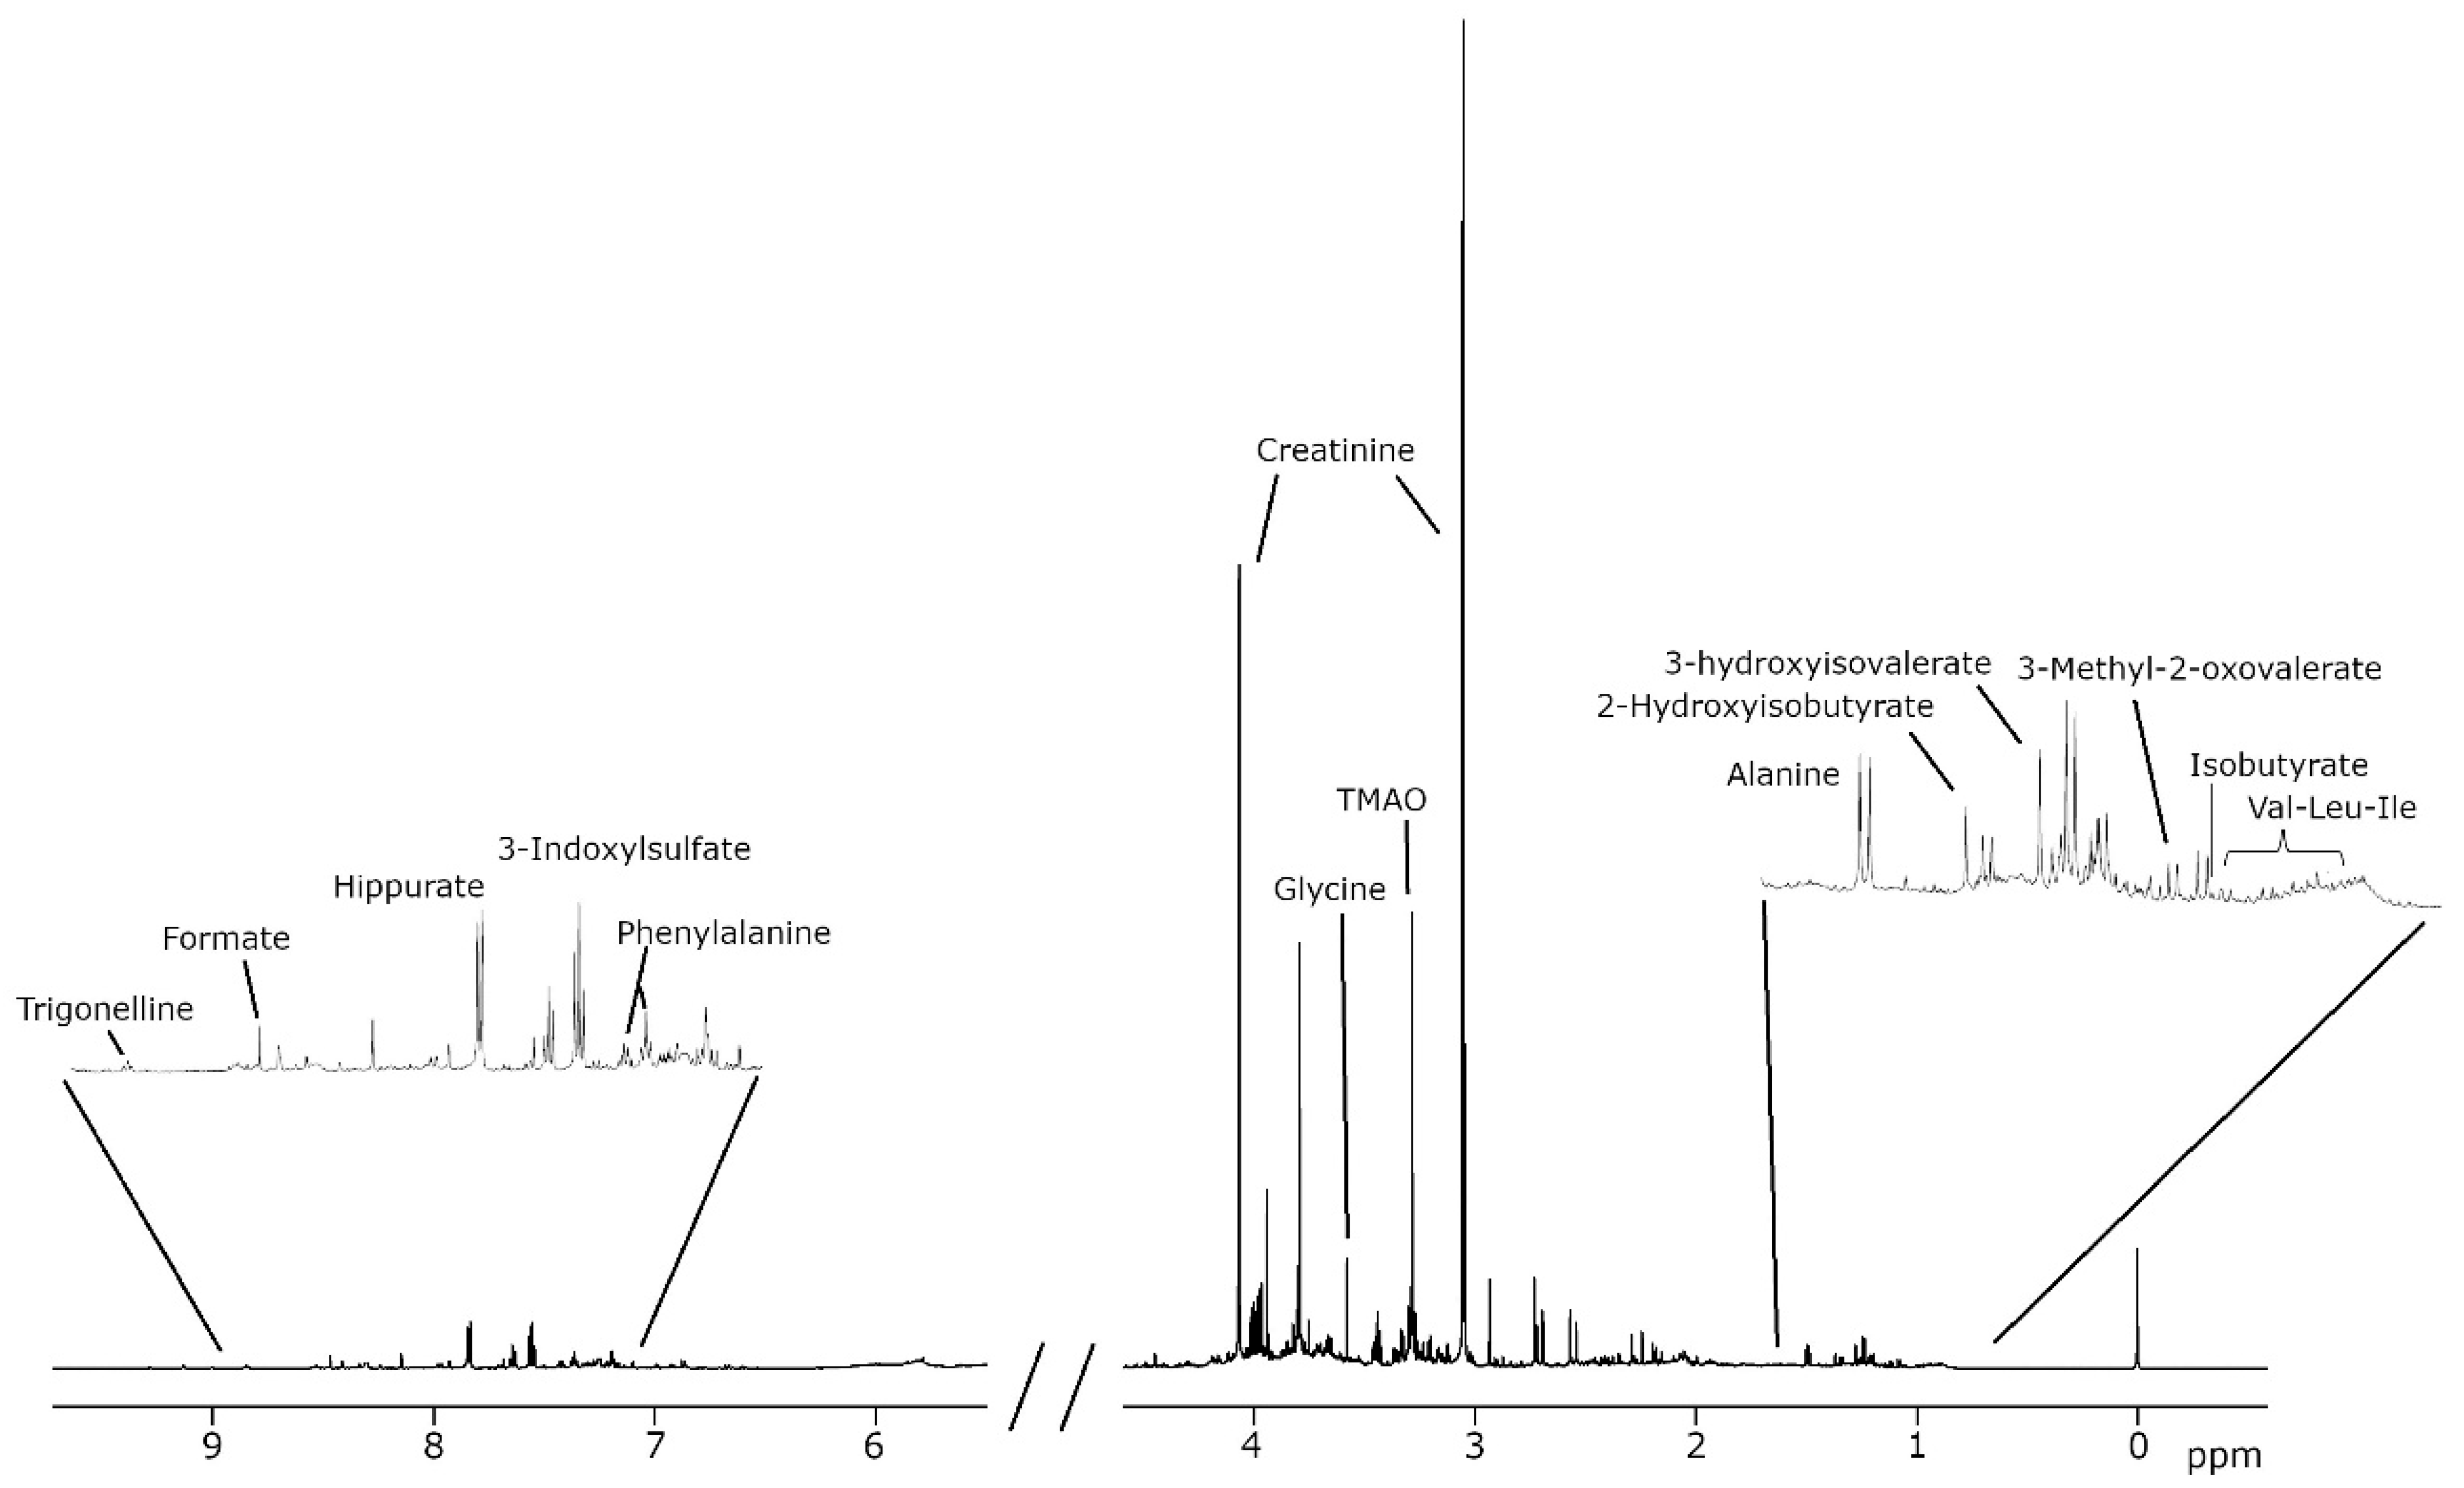
2.2. 1H-NMR Urine Metabolomics

Urine samples were prepared and analyzed using standardized and optimized protocols as previously described [33]. Briefly, urine samples were thawed at room temperature (minimum 1 h) and homogenized by gently inverting the tubes twice before 540 μL of urine was mixed with 60 μL of buffer (KH2PO4, 1.5 M, pH 7.4 made up in 2H2O) containing 5.8 mM TSP and 2 mM NaN3. Following centrifugation (1800× g, 4 °C, 5 min) to remove solids, 550 μL of the sample was transferred into 5 mm SampleJet NMR tubes and immediately loaded onto a refrigerated SampleJet robot (Bruker Biospin, Rheinstetten, Germany) and maintained at 4 °C until NMR analysis. Before acquisition, the samples were allowed to equilibrate inside the spectrometer for at least 5 min to ensure thermal stability. Acquisition routines, including temperature equilibration, tuning, matching, pulse calibration, fixed receiver gain, and number of scans, were fully automated.
Spectral preprocessing was carried out in TopSpin. Manual phase correction was performed using the .ph command, followed by Fourier transformation (efp) and baseline correction (abs) to address baseline drift and ensure accurate peak quantification. 1H-NMR spectra were acquired at 300 K operating at a proton frequency of 600.20 MHz using an Avance III−600 Bruker spectrometer. One-dimensional 1H pulse experiments were carried out with a total of 32 scans using the nuclear Overhauser effect spectroscopy (NOESY)-presaturation sequence to suppress the residual water peak at around 4.7 ppm. This 1D NOESY-based sequence includes presaturation during the relaxation delay (D1 = 5 s) for efficient water suppression. The acquisition time (AQ) was 3.42 s, and the total experiment duration was 4 min and 42 s per sample, providing an adequate signal-to-noise ratio and resolution for metabolomic profiling.
For spectral referencing, all spectra were aligned to the sodium 3-(trimethylsilyl)propionate (TSP) signal at 0.00 ppm. After this initial global alignment, spectra were divided into specific regions to allow for localized, fine-tuned alignment. This second alignment step corrects small peak shifts, typically resulting from pH variations. Once aligned, spectral deconvolution algorithms were used to reconstruct the raw signal using predefined analytical peak shapes (e.g., singlets, doublets, triplets) based on known metabolite patterns. These functions were iteratively fitted to the spectra to minimize residual error, enabling precise peak boundary definition and accurate metabolite quantification. The NMR area, chemical shift (ppm), and signal assignment associated with the concentration of 34 metabolites (Table 1) were obtained after the spectral analysis (Figure 1) using an in-house lineshape fitting algorithm developed to deconvolute the pre-processed NMR spectra, based on Lorentzian and Gaussian functions to minimize the fitting error, as previously described [34]. The NMR areas were transformed into concentration units by using specific conversion factors depending on the proton numbers of the molecular structure generating the signal. Finally, the metabolite concentrations were normalized by using Probabilistic Quotient Normalization (PQN) to avoid urine dilution effects [35].

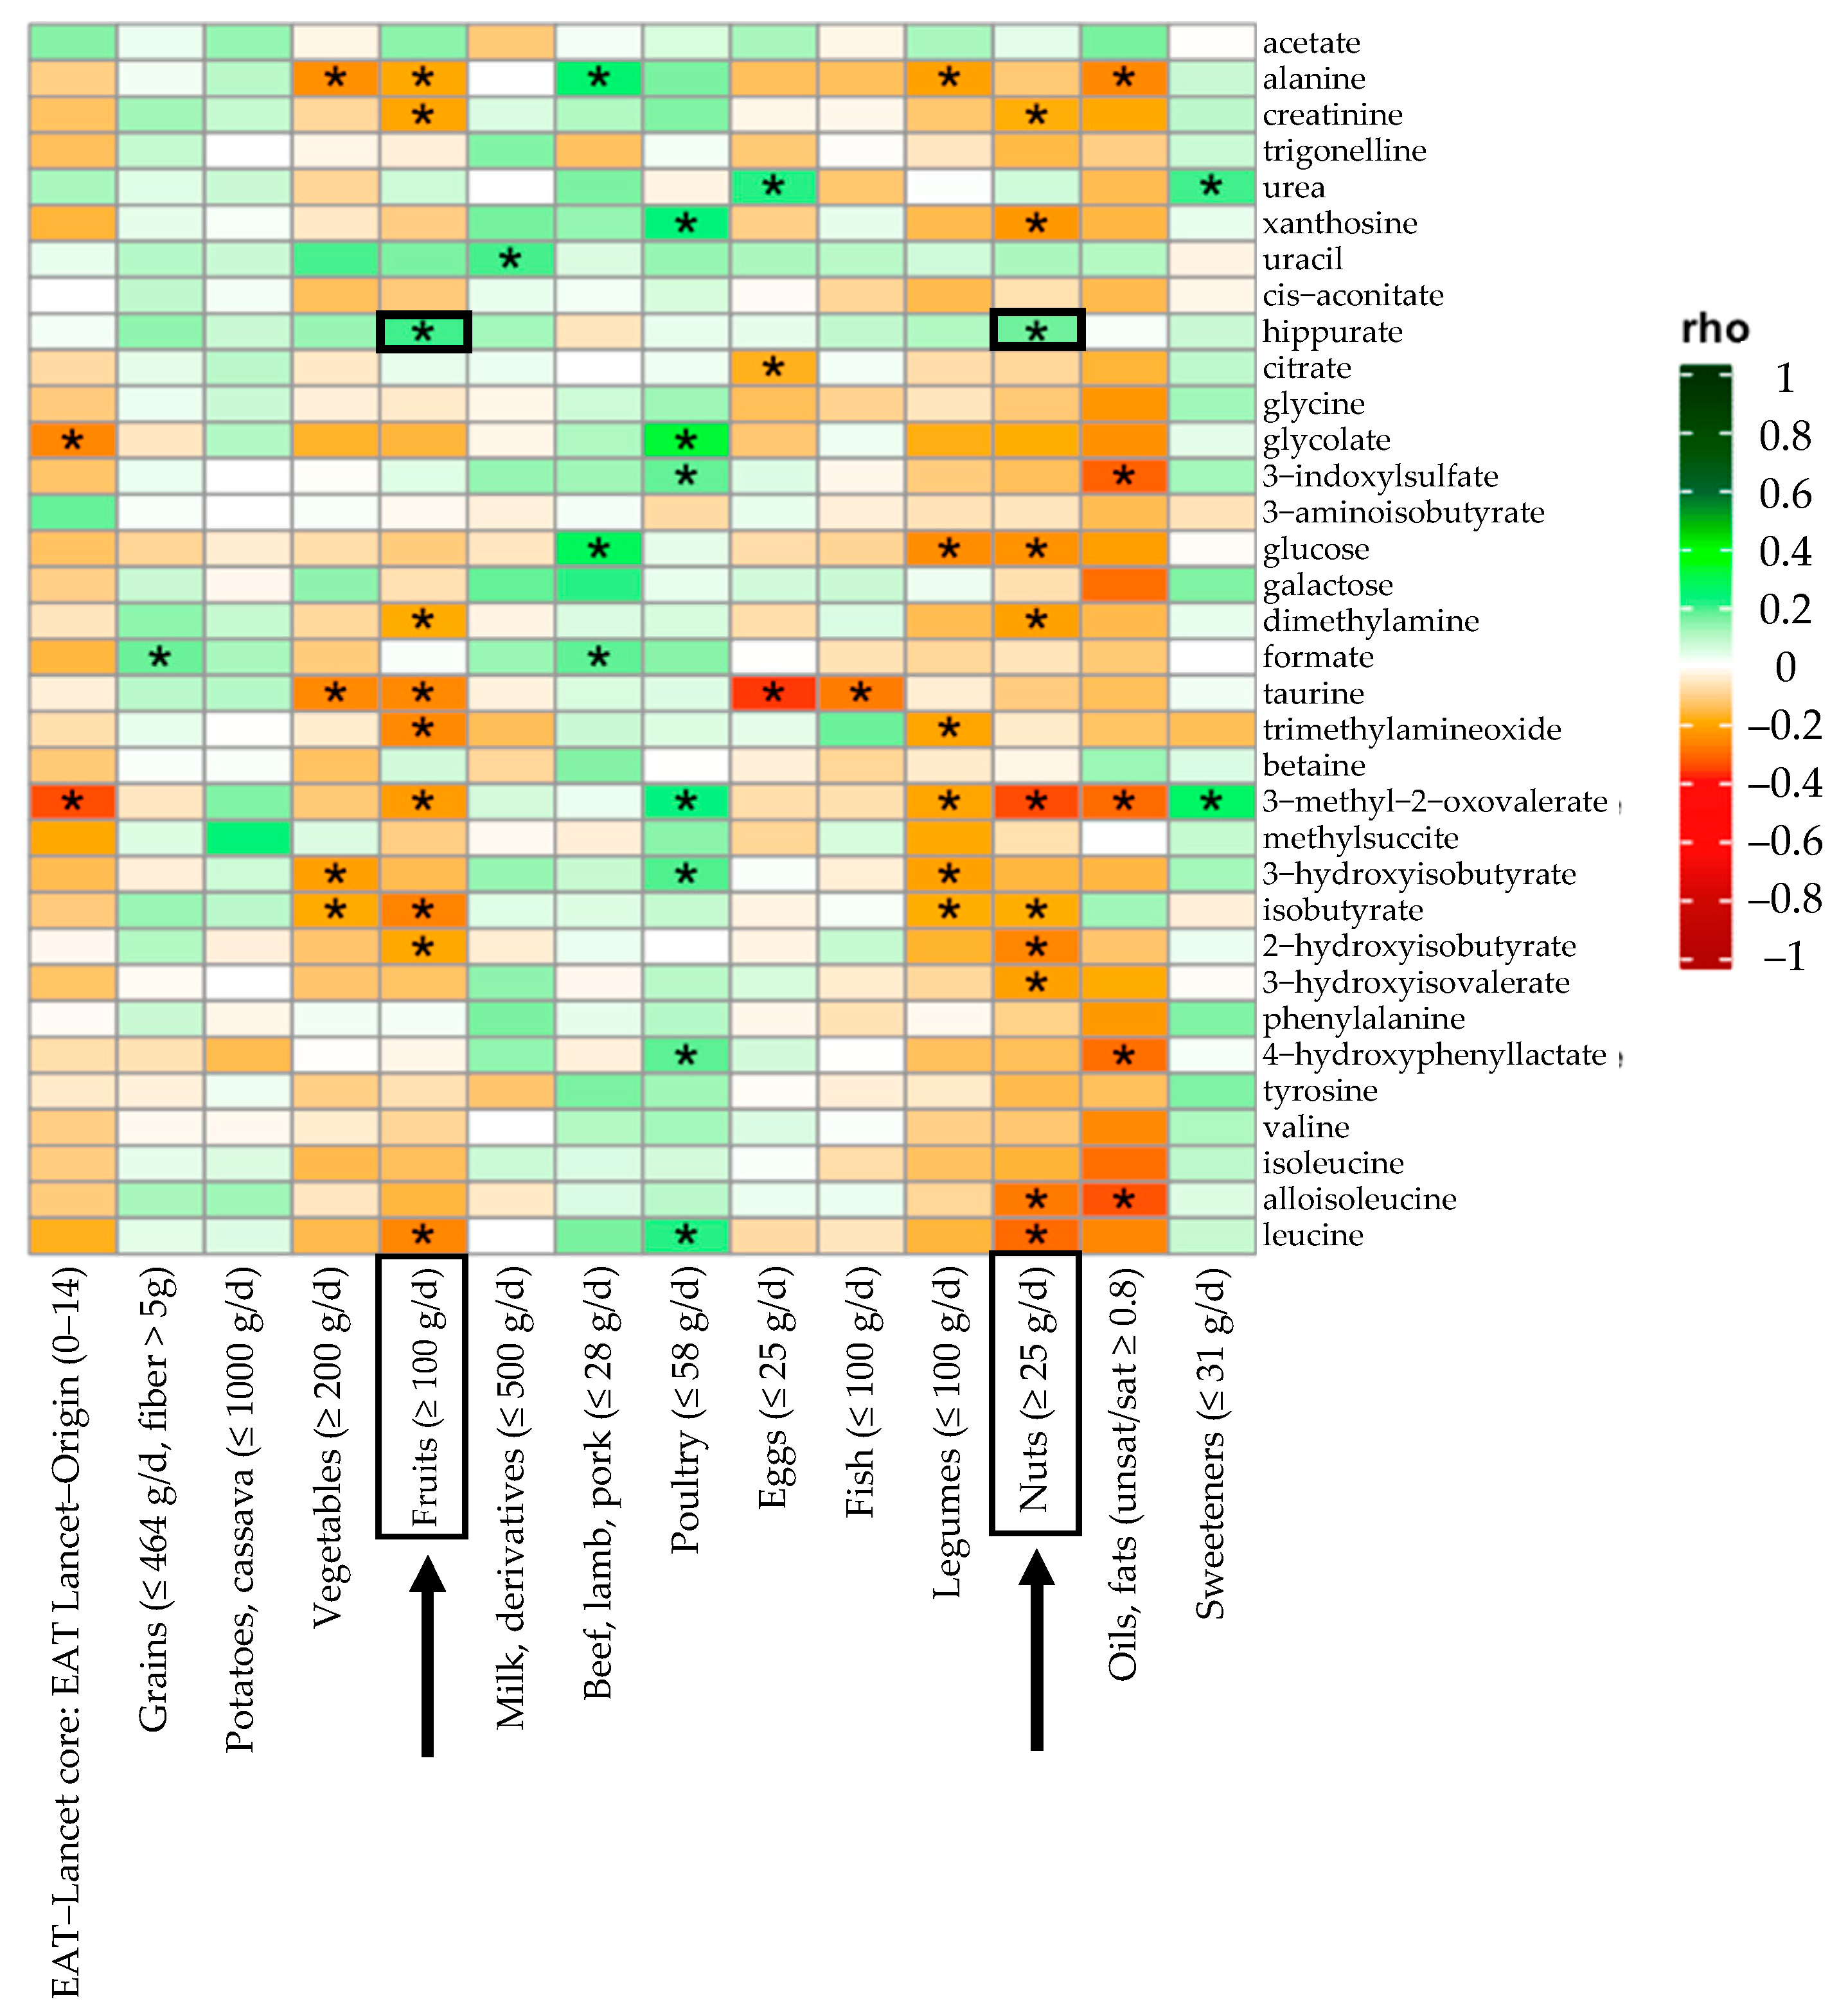
2.3. Statistical Analysis
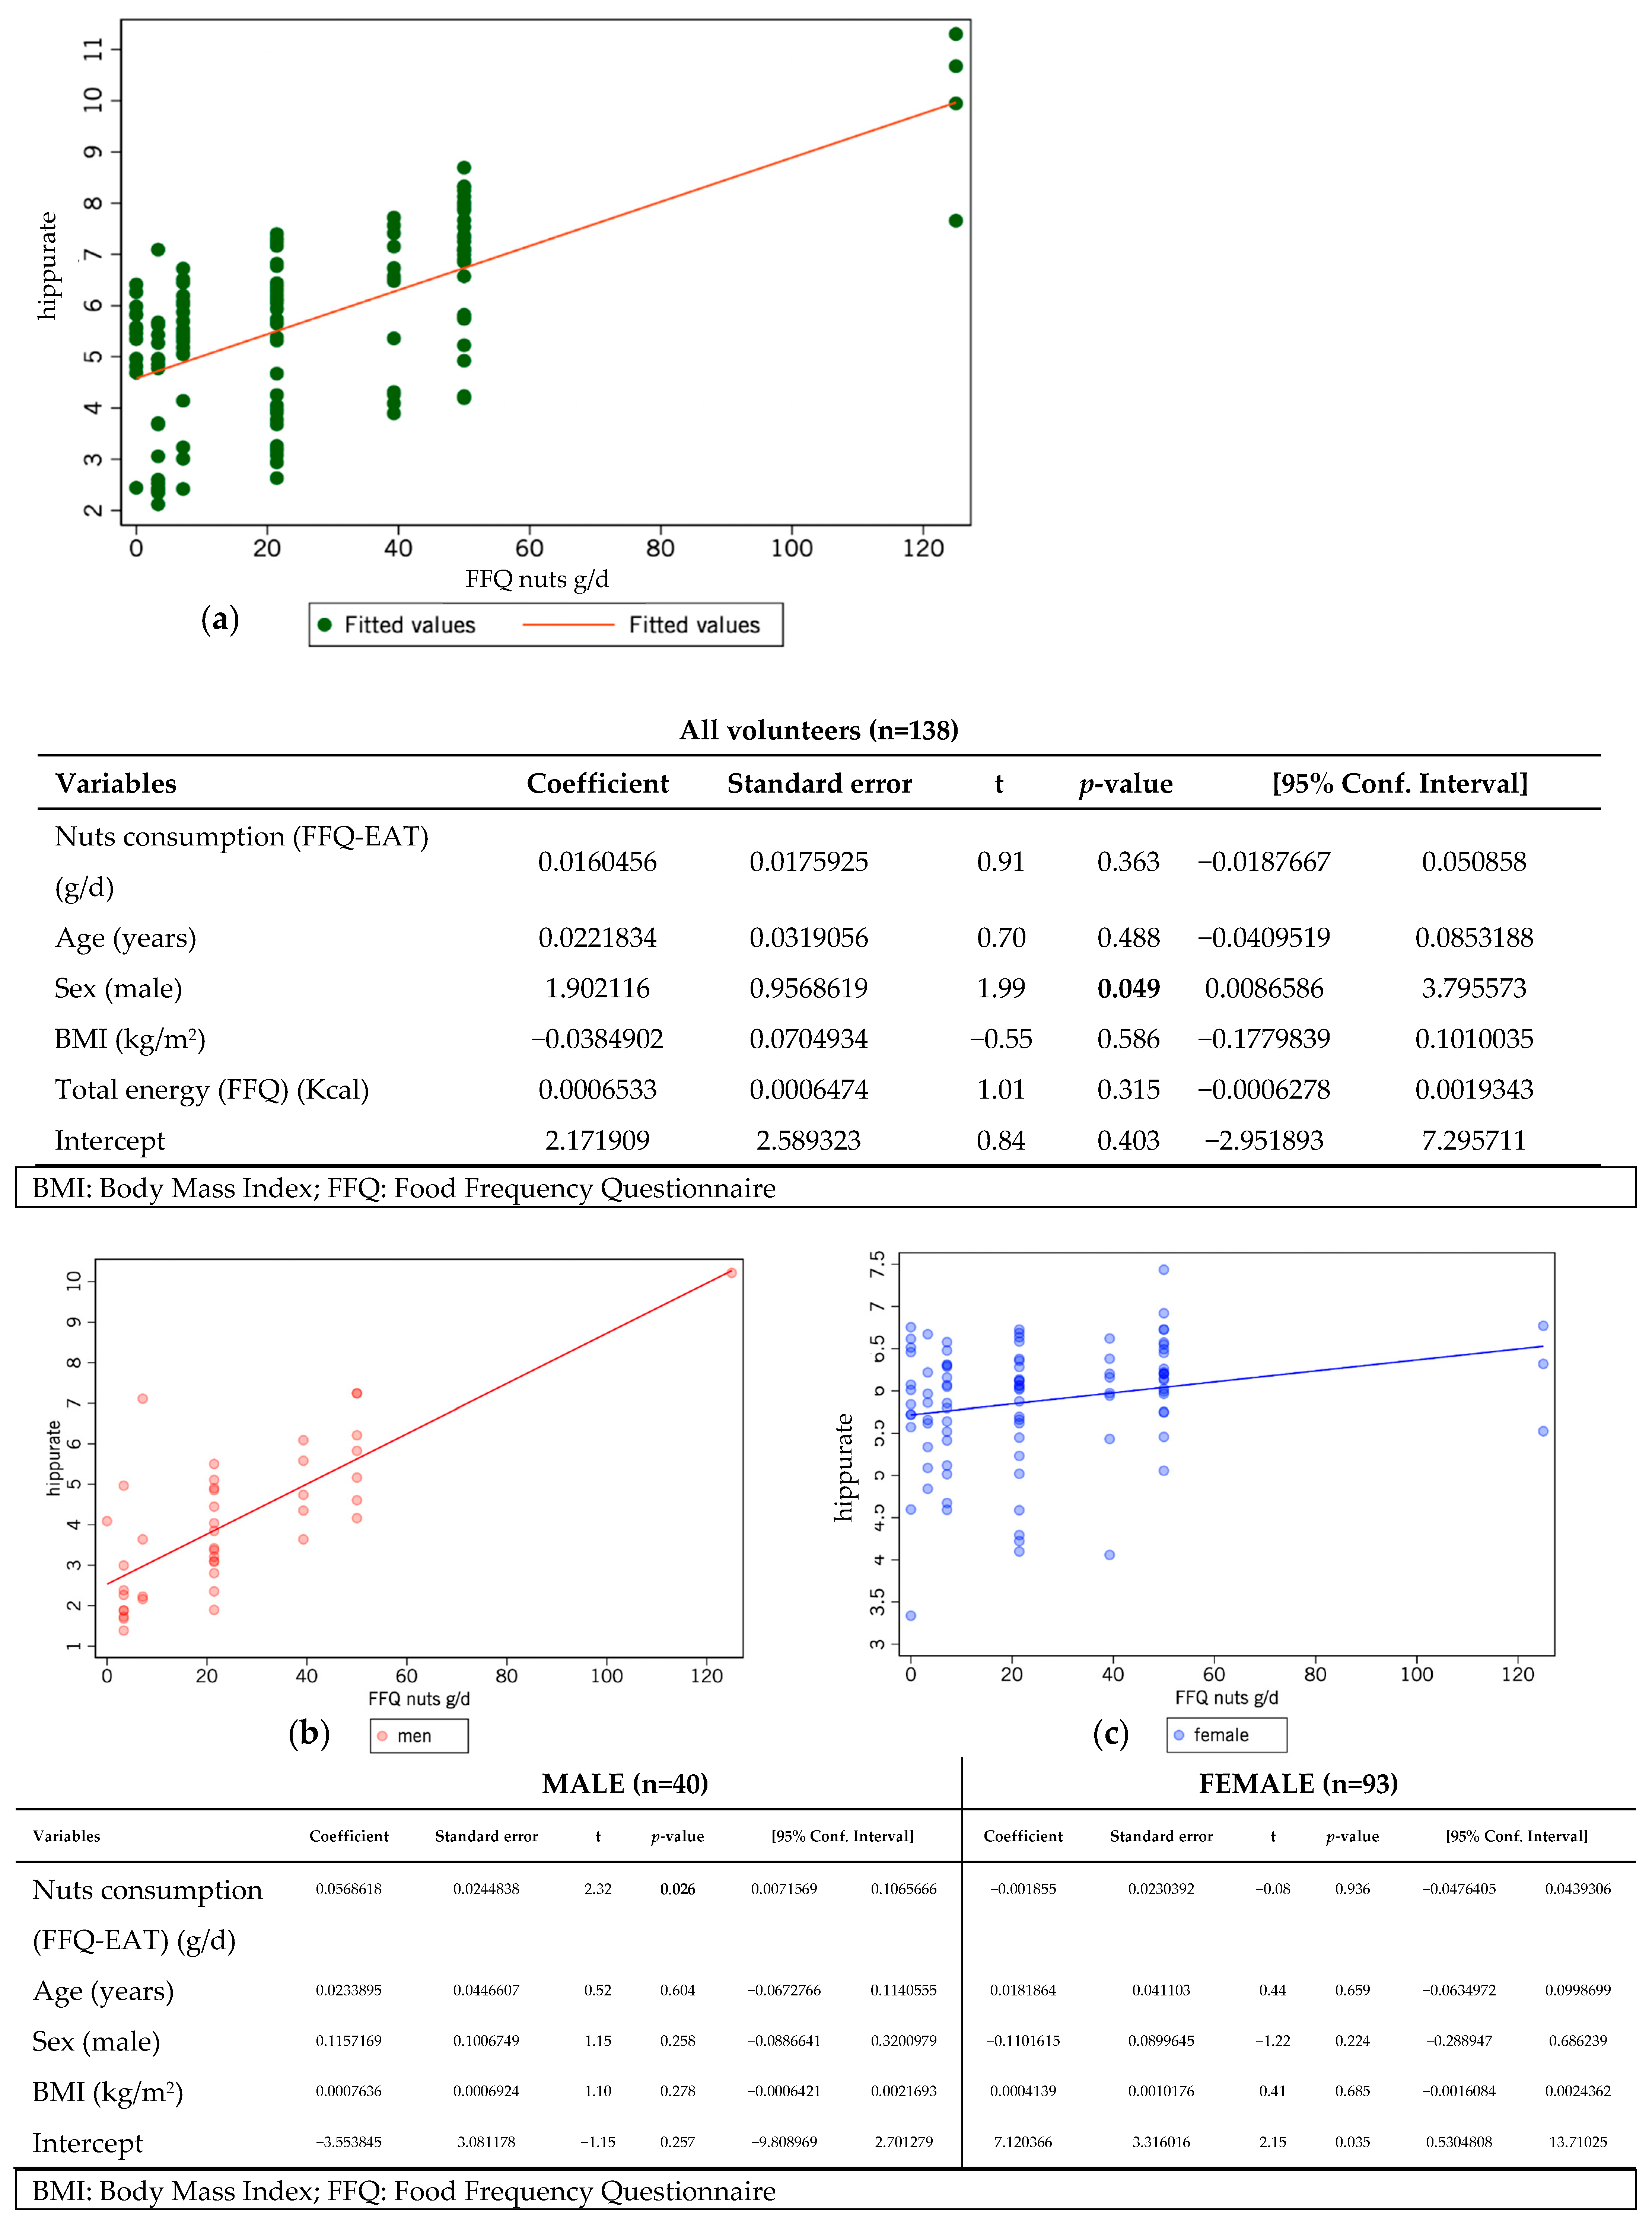
For the descriptive analysis, biochemical variables were summarized using the median and interquartile range (IQR) to account for data distribution. Normality of the variables was assessed using the Shapiro–Wilk test [36]. Given that several variables did not follow a normal distribution, the Wilcoxon–Mann–Whitney rank-sum test was used for unadjusted comparisons of urinary metabolite concentrations and dietary intake between groups defined by sex and EAT-Lancet adherence [37]. Additionally, to further explore the relationship between sex, dietary adherence, and biomarker levels while adjusting for confounding variables (age, BMI, and total energy intake), analysis of covariance (ANCOVA) models was applied [38]. Interaction terms were included to test for effect modification by sex. To explore associations between dietary categories and metabolite concentrations, pairwise Spearman correlation analyses were performed [39].
For the inferential analysis, linear regression models were employed to evaluate the relationship between metabolite levels and food group dietary intake, adjusting for potential confounders such as age (years), BMI (kg/m2), and total energy intake (kcal/d) [40]. The association between metabolite levels and food group dietary intake from the FFQ was analyzed separately for men and women. Scatter plots were generated to illustrate the predicted versus observed values for each sex, with fitted regression lines providing a representation of the trends. Mean concentrations of metabolites were also compared across sex and different levels of food group dietary intake to assess potential dietary influences on metabolite levels. These strategies are widely recognized and produce plausible outcomes.
Given the exploratory nature of the study, the analyses aimed to identify potential associations to confirm predefined hypotheses. As such, corrections for multiple testing (e.g., Bonferroni or Sidak) were not applied in the correlation or regression models. This approach is consistent with methodological recommendations for hypothesis-generating studies in metabolomics, which caution against overcorrection due to the increased risk of type II errors and the loss of potentially relevant findings [41].
All analyses were performed using Stata version 16.0 (StataCorp, College Station, TX, USA). All p-values are two-sided, with statistical significance set at p < 0.05.

3. Results

Table 2 summarizes the EAT-Lancet score components for the 138 study participants, stratified into high (>P50) and low (<P50) adherence groups. Women represented the majority in both groups, especially among high adherents (79.4%). Men with low adherence consumed fewer grains (120.6 vs. 162 g/day; p = 0.027) and more red meat (115.2 vs. 161.9 g/day; p = 0.001) than women. Conversely, women with low adherence had lower fruit intake than men (210.7 vs. 345.4 g/day; p = 0.003) and consumed less fish (p = 0.037). Overall, the EAT-Lancet score effectively distinguished fruit, dairy, poultry, and nut intake between adherence groups, with nut consumption notably higher—83% in women and 108% in men—in the high adherence group.
Metabolomic analysis revealed sex-specific differences in gut microbiota-related metabolites according to adherence level (Table 3). In women, urinary hippuric acid levels were similar across groups (3.934 vs. 3.846 mmol/L), whereas in men, they differed significantly (3.367 vs. 2.871 mmol/L), suggesting hippuric acid may serve as a dietary biomarker linked to the EAT-Lancet index in men. Full NMR metabolite data are available in Table S1.
Figure 2 shows a Spearman correlation heatmap illustrating associations between identified urinary metabolites and the 14 food groups of the EAT-Lancet score across all study participants. Heatmaps stratified by adherence level are available in Supplementary Figure S1. Positive correlations (in green) indicate higher metabolite levels with greater intake of specific food groups, while negative correlations (in orange-red) reflect inverse associations. Among all food categories, poultry showed the highest number of positive correlations (n = 7), mainly with amino acid-related metabolites. Red meat (beef, lamb, and pork) was positively linked to glucose, alanine, and formate. Other animal-based foods were associated with urea (eggs) and uracil (milk and dairy).
Hippuric acid showed positive correlations with fruit and nut intake, standing out as the plant-based metabolite most associated with EAT-Lancet adherence, and for the first time, specifically linked to nut consumption. Conversely, the most negative correlations were found in plant-based categories, with ten and nine metabolites negatively associated with nut and fruit intake, respectively, reflecting distinct metabolic responses to these food groups. Taurine was the only metabolite inversely correlated with animal-derived foods (eggs, fish). Higher overall adherence to the EAT-Lancet score was also associated with lower levels of 3-methyl-2-oxovalerate and glycolate. Figure 3 presents results from a linear regression model examining the relationship between hippuric acid and nut intake, estimated via FFQ and stratified by sex. The model excluded extreme values as outliers (<P5–>P95) and was adjusted for age, sex, BMI, and total energy intake.
A positive slope was observed across all participants (Figure 3a), indicating a more consistent trend between nut consumption and hippuric acid levels, particularly for intake ranges between 0 and 40 g/day. Although data dispersion was greater at low consumption levels, hippuric acid still tended to increase with intake. When sex was considered (Figure 3b,c), both men and women showed a positive association, with most data points again in the lower to moderate intake range. However, the slope for women appeared steeper, suggesting a more detectable association. Although overall hippuric acid concentrations were higher in women, stratified analyses showed a more pronounced effect of nut intake on hippuric acid levels in men (p = 0.026), while no association was observed in women (p = 0.936).
The bar graphs in Figure 4 show the average concentration (P50) of nut consumption between men and women with high adherence to the EAT-Lancet index. Nut intake is similar between sexes (Figure 4a) with no significant differences (p = 0.938). However, the hippuric acid concentrations are significantly lower in men compared to women (p = 0.020) (Figure 4b).

4. Discussion

This study explores the potential of urinary hippuric acid as a sex-dependent biomarker for fruit and nut intake, assessed in a plant-based diet adherence through the EAT-Lancet score. Although hippuric acid has been widely associated with the intake of fruits and vegetables due to the microbial metabolism of dietary polyphenols [21,42,43], the present analysis provides one of the first observations of a specific association with nut consumption. Our analysis expands on this knowledge by identifying, for the first time, a specific association with nut intake. Nuts such as walnuts and hazelnuts contain significant levels of ellagitannins and proanthocyanidins [44], which gut microbiota can convert into urolithins and benzoic acid derivatives—including hippuric acid—through colonic fermentation [45]. This metabolic pathway may explain the observed positive relationship between nut intake and hippuric acid concentration in urine samples.
In addition to this novel association, the study addresses sex-specific differences in hippuric acid excretion. Although women generally showed higher hippuric acid levels, a statistically significant association between nut consumption and hippuric acid was only detected in men (p = 0.026), not in women (p = 0.936). This suggests a more linear or detectable metabolic response to nut-derived polyphenols in men, rather than a stronger physiological effect. Differences in microbiota composition [46,47], colonic transit time and polyphenol absorption efficiency [48], and hepatic conjugation [21] could contribute to this disparity associated with sex. Hormonal influences may also play a role; for instance, estrogen modulates gut microbiota composition and intestinal permeability [43], while sex-specific differences in glycine availability and mitochondrial function may affect benzoic acid conjugation [47,49]. In fact, available research suggests that sex may influence urinary hippuric acid concentrations [50].
On the other hand, the exploratory nature of this study warrants cautious interpretation. The goal was to identify emerging associations that could inform future hypothesis-driven research. As supported by Menyhart et al. [42], multiple testing corrections are not always required in exploratory metabolomics, as they may increase type II errors and obscure meaningful associations.
However, our findings reinforce the relevance of hippuric acid as a marker not only for fruit and vegetable intake, but also for nut consumption. The integration of metabolomics with dietary indices, such as the EAT-Lancet score, revealed distinct correlations between metabolite concentrations and food categories. Plant-based groups like “Fruits”, “Vegetables”, and “Legumes” showed different associative patterns than animal-based categories such as “Meat”, “Dairy”, and “Fish”. For instance, alanine and glucose were positively associated with red meat intake, and urea was linked to egg consumption, reflecting dietary behaviors through metabolomic profiling. In contrast, taurine showed negative associations with plant-based foods, further emphasizing metabolic distinctions between dietary patterns [51,52].
Sex differences in metabolite levels were evident. While women exhibited higher absolute concentrations of hippuric acid, the association between nut intake and hippuric acid levels was only statistically detectable in men. Prior studies suggest that women may exhibit different metabolic responses due to differences in hormone profiles, body composition, and enzymatic activity [43,53,54]. These results underscore the need for sex-specific validation of dietary biomarkers, which may enhance the precision of personalized nutrition strategies.
A key strength of this study is the use of NMR-based metabolomics, which offers robust and reproducible analysis of urinary metabolites. Compared to mass spectrometry (MS), NMR requires minimal sample preparation, avoids issues such as ion suppression, and provides absolute quantification [34,55]. It is particularly well-suited for detecting structurally complex compounds like hippuric acid. Furthermore, NMR enables a holistic assessment of metabolic networks, allowing us to capture sex-related differences in polyphenol metabolism [47]. While MS remains the preferred method for highly sensitive detection, NMR is advantageous for large-scale applications requiring consistency and throughput [56].
Despite these strengths, the study has limitations. The observational design and reliance on FFQs may introduce self-report bias. Additionally, the relatively small sample size, appropriate for a pilot study, limits generalizability. Given the exploratory nature of this analysis and the sample size, multiple testing corrections (e.g., Bonferroni or Sidak) were not applied, as these could increase the risk of false negatives (type II errors) and hinder the detection of biologically relevant associations. Future studies should include larger, more diverse populations and consider integrating microbiota profiling to confirm the proposed mechanisms [57].
Finally, these results support the integration of metabolomics into personalized nutrition. As tools from genetics, microbiomics, and metabolomics advance, the ability to tailor dietary recommendations to individual profiles improves. This study contributes to this field by identifying hippuric acid as a promising candidate biomarker of nut intake, particularly in men, highlighting the importance of accounting for sex in dietary biomarker research and nutritional intervention design.

Supplementary Materials

The following supporting information can be downloaded at: https://www.mdpi.com/article/10.3390/metabo15060348/s1. Figure S1: Spearman correlations between high (A) and low (B) adherence to EAT-Lancet score according to median (P50) of the Dietary Deal project (n = 138); Table S1: Concentration of metabolites (mmol/L) different from gut microbiota in urine samples from volunteers in the Dietary Deal study (n = 138) analyzed by Nuclear Magnetic Resonance (1H-NMR) based on low or high adherence according to the median (P50) using the EAT-Lancet Score.

Author Contributions

Conceptualization, C.M.F.-D., A.L.C.-P. and J.A.M.; data curation, V.d.l.O. and N.A.; formal analysis, V.d.l.O.; funding acquisition, A.L.C.-P. and J.A.M.; investigation, E.F.-C. and V.d.l.O.; methodology, P.M.-M., M.Á.R.-H., N.A., A.L.C.-P. and J.A.M.; project administration, A.L.C.-P. and J.A.M.; resources, C.M.F.-D., A.L.C.-P. and J.A.M.; software, V.d.l.O.; supervision, P.M.-M., M.Á.R.-H., A.L.C.-P. and J.A.M.; validation, P.M.-M., M.Á.R.-H., A.L.C.-P. and J.A.M.; visualization, E.F.-C. and V.d.l.O.; writing—original draft, E.F.-C., V.d.l.O. and J.A.M.; writing—review and editing, E.F.-C., V.d.l.O. and J.A.M. All authors have read and agreed to the published version of the manuscript.

Funding

The project “Dietary Assessment and Further Development of Biomarkers for All” (DIETARY DEAL, ref. AC21/00038) received funding from the European Union Next Generation (EU) through the Instituto de Salud Carlos III, within the framework of the Recovery and Resilience Mechanism (RRM).

Institutional Review Board Statement

The study was conducted in accordance with the Declaration of Helsinki and approved by the Ethics Committee of the Hospital Clínico San Carlos on 7 June 2022 (Code 22/363-E).

Informed Consent Statement

Informed consent was obtained from all subjects involved in the study.

Data Availability Statement

The raw data supporting the conclusions of this article will be made available by the authors on request.

Acknowledgments

The authors would like to express their appreciation to Angélica Larrad and Jose Luis Espadas for their support and collaboration during the volunteer recruitment process at Hospital Clínico San Carlos. The authors also wish to sincerely thank all the volunteers who participated in the project for their valuable contribution.

Conflicts of Interest

The authors declare no conflicts of interest. The funders had no role in the design of the study; in the collection, analyses, or interpretation of data; in the writing of the manuscript; or in the decision to publish the results.

References

  1. Cena, H.; Calder, P.C. Defining a Healthy Diet: Evidence for the Role of Contemporary Dietary Patterns in Health and Disease. Nutrients 2020, 12, 334. [Google Scholar] [CrossRef] [PubMed]
  2. Jayedi, A.; Soltani, S.; Abdolshahi, A.; Shab-Bidar, S. Healthy and Unhealthy Dietary Patterns and the Risk of Chronic Disease: An Umbrella Review of Meta-Analyses of Prospective Cohort Studies. Br. J. Nutr. 2020, 124, 1133–1144. [Google Scholar] [CrossRef] [PubMed]
  3. Naska, A.; Lagiou, A.; Lagiou, P. Dietary Assessment Methods in Epidemiological Research: Current State of the Art and Future Prospects. F1000Research 2017, 6, 926. [Google Scholar] [CrossRef]
  4. Bailey, R.L. Overview of Dietary Assessment Methods for Measuring Intakes of Foods, Beverages, and Dietary Supplements in Research Studies. Curr. Opin. Biotechnol. 2021, 70, 91–96. [Google Scholar] [CrossRef]
  5. Gavrieli, A.; Trichopoulou, A.; Valsta, L.M.; Ioannidou, S.; Berry, R.; Roe, M.; Harvey, L.; Finglas, P.; Glibetic, M.; Gurinovic, M.; et al. Identifying Sources of Measurement Error in Assessing Dietary Intakes—Results of a Multi-Country Ring-Trial. Nutr. Metab. Cardiovasc. Dis. 2019, 29, 127–134. [Google Scholar] [CrossRef]
  6. Morze, J.; Danielewicz, A.; Hoffmann, G.; Schwingshackl, L. Diet Quality as Assessed by the Healthy Eating Index, Alternate Healthy Eating Index, Dietary Approaches to Stop Hypertension Score, and Health Outcomes: A Second Update of a Systematic Review and Meta-Analysis of Cohort Studies. J. Acad. Nutr. Diet. 2020, 120, 1998–2031. [Google Scholar] [CrossRef]
  7. García-Conesa, M.T.; Philippou, E.; Pafilas, C.; Massaro, M.; Quarta, S.; Andrade, V.; Jorge, R.; Chervenkov, M.; Ivanova, T.; Dimitrova, D.; et al. Exploring the Validity of the 14-Item Mediterranean Diet Adherence Screener (Medas): A Cross-National Study in Seven European Countries around the Mediterranean Region. Nutrients 2020, 12, 2960. [Google Scholar] [CrossRef]
  8. Knuppel, A.; Papier, K.; Key, T.J.; Travis, R.C. EAT-Lancet Score and Major Health Outcomes: The EPIC-Oxford Study. Lancet 2019, 394, 213–214. [Google Scholar] [CrossRef] [PubMed]
  9. Willett, W.; Rockström, J.; Loken, B.; Springmann, M.; Lang, T.; Vermeulen, S.; Garnett, T.; Tilman, D.; DeClerck, F.; Wood, A.; et al. Food in the Anthropocene: The EAT–Lancet Commission on Healthy Diets from Sustainable Food Systems. Lancet 2019, 393, 447–492. [Google Scholar] [CrossRef]
  10. Kuhnle, G.G.C. Nutritional Biomarkers for Objective Dietary Assessment. J. Sci. Food Agric. 2012, 92, 1145–1149. [Google Scholar] [CrossRef]
  11. Pande, S.; Kratasyuk, V.A.; Medvedeva, N.N.; Kolenchukova, O.A.; Salmina, A.B. Nutritional Biomarkers: Current View and Future Perspectives. Crit. Rev. Food Sci. Nutr. 2018, 58, 3055–3069. [Google Scholar] [CrossRef] [PubMed]
  12. de la O, V.; Fernández-Cruz, E.; Valdés, A.; Cifuentes, A.; Walton, J.; Martínez, J.A. Exhaustive Search of Dietary Intake Biomarkers as Objective Tools for Personalized Nutrimetabolomics and Precision Nutrition Implementation. Nutr. Rev. 2025, 83, 925–942. [Google Scholar] [CrossRef] [PubMed]
  13. Rafiq, T.; Azab, S.M.; Teo, K.K.; Thabane, L.; Anand, S.S.; Morrison, K.M.; De Souza, R.J.; Britz-Mckibbin, P. Nutritional Metabolomics and the Classification of Dietary Biomarker Candidates: A Critical Review. Adv. Nutr. 2021, 12, 2333–2357. [Google Scholar] [CrossRef]
  14. Lang, R.; Lang, T.; Bader, M.; Beusch, A.; Schlagbauer, V.; Hofmann, T. High-Throughput Quantitation of Proline Betaine in Foods and Suitability as a Valid Biomarker for Citrus Consumption. J. Agric. Food Chem. 2017, 65, 1613–1619. [Google Scholar] [CrossRef] [PubMed]
  15. Yin, X.; Gibbons, H.; Rundle, M.; Frost, G.; McNulty, B.A.; Nugent, A.P.; Walton, J.; Flynn, A.; Brennan, L. The Relationship between Fish Intake and Urinary Trimethylamine-N-Oxide. Mol. Nutr. Food Res. 2020, 64, e1900799. [Google Scholar] [CrossRef]
  16. Kochlik, B.; Gerbracht, C.; Grune, T.; Weber, D. The Influence of Dietary Habits and Meat Consumption on Plasma 3-Methylhistidine—A Potential Marker for Muscle Protein Turnover. Mol. Nutr. Food Res. 2018, 62, e1701062. [Google Scholar] [CrossRef]
  17. Zhu, Y.; Shurlknight, K.L.; Chen, X.; Sang, S. Identification and Pharmacokinetics of Novel Alkylresorcinol Metabolites in Human Urine, New Candidate Biomarkers for Whole-Grain Wheat and Rye Intake. J. Nutr. 2014, 144, 114–122. [Google Scholar] [CrossRef]
  18. Li, Y.; Xu, Y.; Le Sayec, M.; Yan, X.; Spector, T.D.; Steves, C.J.; Bell, J.T.; Small, K.S.; Menni, C.; Gibson, R.; et al. Development of a (Poly)phenol Metabolic Signature for Assessing (Poly)phenol-Rich Dietary Patterns. J. Agric. Food Chem. 2024, 72, 13439–13450. [Google Scholar] [CrossRef]
  19. Rudrapal, M.; Khairnar, S.J.; Khan, J.; Dukhyil, A.B.; Ansari, M.A.; Alomary, M.N.; Alshabrmi, F.M.; Palai, S.; Deb, P.K.; Devi, R. Dietary Polyphenols and Their Role in Oxidative Stress-Induced Human Diseases: Insights Into Protective Effects, Antioxidant Potentials and Mechanism(s) of Action. Front. Pharmacol. 2022, 13, 806470. [Google Scholar] [CrossRef]
  20. Pérez-Jiménez, J.; Neveu, V.; Vos, F.; Scalbert, A. Identification of the 100 richest dietary sources of polyphenols: An application of the Phenol-Explorer database. Eur. J. Clin. Nutr. 2010, 64, S112–S120. [Google Scholar] [CrossRef]
  21. Ticinesi, A.; Guerra, A.; Nouvenne, A.; Meschi, T.; Maggi, S. Disentangling the Complexity of Nutrition, Frailty and Gut Microbial Pathways during Aging: A Focus on Hippuric Acid. Nutrients 2023, 15, 1138. [Google Scholar] [CrossRef] [PubMed]
  22. Yuan, L.; Muli, S.; Huybrechts, I.; Nöthlings, U.; Ahrens, W.; Scalbert, A.; Floegel, A. Assessment of Fruit and Vegetables Intake with Biomarkers in Children and Adolescents and Their Level of Validation: A Systematic Review. Metabolites 2022, 12, 126. [Google Scholar] [CrossRef] [PubMed]
  23. Rabassa, M.; Zamora-Ros, R.; Palau-Rodriguez, M.; Tulipani, S.; Miñarro, A.; Bandinelli, S.; Ferrucci, L.; Cherubini, A.; Andres-Lacueva, C. Habitual Nut Exposure, Assessed by Dietary and Multiple Urinary Metabolomic Markers, and Cognitive Decline in Older Adults: The InCHIANTI Study. Mol. Nutr. Food Res. 2020, 64, e1900532. [Google Scholar] [CrossRef]
  24. Mora-Cubillos, X.; Tulipani, S.; Garcia-Aloy, M.; Bulló, M.; Tinahones, F.J.; Andres-Lacueva, C. Plasma metabolomic biomarkers of mixed nuts exposure inversely correlate with severity of metabolic syndrome. Mol. Nutr. Food Res. 2015, 59, 2480–2490. [Google Scholar] [CrossRef] [PubMed]
  25. Roy Chowdhury, C.; Kavitake, D.; Jaiswal, K.K.; Jaiswal, K.S.; Reddy, G.B.; Agarwal, V.; Shetty, P.H. NMR-Based Metabolomics as a Significant Tool for Human Nutritional Research and Health Applications. Food Biosci. 2023, 53, 102538. [Google Scholar] [CrossRef]
  26. Marino, M.; Masella, R.; Bulzomi, P.; Campesi, I.; Malorni, W.; Franconi, F. Nutrition and Human Health from a Sex-Gender Perspective. Mol. Aspects. Med. 2011, 32, 1–70. [Google Scholar] [CrossRef]
  27. Chen, Y.; Kim, M.; Paye, S.; Benayoun, B.A. Sex as a Biological Variable in Nutrition Research: From Human Studies to Animal Models. Annu. Rev. Nutr. 2022, 42, 227–250. [Google Scholar] [CrossRef]
  28. Iizuka, K.; Yanagi, K.; Deguchi, K.; Ushiroda, C.; Yamamoto-Wada, R.; Kobae, K.; Yamada, Y.; Naruse, H. Sex and Age Differences in the Effects of Food Frequency on Metabolic Parameters in Japanese Adults. Nutrients 2024, 16, 2931. [Google Scholar] [CrossRef]
  29. Rist, M.J.; Roth, A.; Frommherz, L.; Weinert, C.H.; Krüger, R.; Merz, B.; Bunzel, D.; Mack, C.; Egert, B.; Bub, A.; et al. Metabolite patterns predicting sex and age in participants of the Karlsruhe Metabolomics and Nutrition (KarMeN) study. PLoS ONE 2017, 12, e0183228. [Google Scholar] [CrossRef]
  30. Weisell, R.C. Body mass index as an indicator of obesity. Asia Pac. J. Clin. Nutr. 2002, 11, S681–S684. [Google Scholar] [CrossRef]
  31. Fernández-Ballart, J.D.; Piñol, J.L.; Zazpe, I.; Corella, D.; Carrasco, P.; Toledo, E.; Perez-Bauer, M.; Martínez-González, M.Á.; Salas-Salvadó, J.; Martn-Moreno, J.M. Relative Validity of a Semi-Quantitative Food-Frequency Questionnaire in an Elderly Mediterranean Population of Spain. Br. J. Nutr. 2010, 103, 1808–1816. [Google Scholar] [CrossRef] [PubMed]
  32. Lee, P.H.; Macfarlane, D.J.; Lam, T.H.; Stewart, S.M. Validity of the International Physical Activity Questionnaire Short Form (IPAQ-SF): A Systematic Review. Int. J. Behav. Nutr. Phys. Act. 2011, 8, 115. [Google Scholar] [CrossRef] [PubMed]
  33. Dona, A.C.; Jiménez, B.; Schafer, H.; Humpfer, E.; Spraul, M.; Lewis, M.R.; Pearce, J.T.M.; Holmes, E.; Lindon, J.C.; Nicholson, J.K. Precision High-Throughput Proton NMR Spectroscopy of Human Urine, Serum, and Plasma for Large-Scale Metabolic Phenotyping. Anal. Chem. 2014, 86, 9887–9894. [Google Scholar] [CrossRef] [PubMed]
  34. Fernández-Millán, E.; Ramos, S.; Álvarez-Cilleros, D.; Samino, S.; Amigó, N.; Correig, X.; Chagoyen, M.; Álvarez, C.; Martín, M.Á. Urinary Metabolomics Study on the Protective Role of Cocoa in Zucker Diabetic Rats via 1H-NMR-Based Approach. Nutrients 2022, 14, 4127. [Google Scholar] [CrossRef]
  35. Dieterle, F.; Ross, A.; Schlotterbeck, G.; Senn, H. Probabilistic Quotient Normalization as Robust Method to Account for Dilution of Complex Biological Mixtures. Application In 1H NMR Metabonomics. Anal. Chem. 2006, 78, 4281–4290. [Google Scholar] [CrossRef]
  36. Ghasemi, A.; Zahediasl, S. Normality tests for statistical analysis: A guide for non-statisticians. Int. J. Endocrinol. Metab. 2012, 10, 486–489. [Google Scholar] [CrossRef]
  37. Fay, M.P.; Proschan, M.A. Wilcoxon–Mann–Whitney or t-test? On assumptions for hypothesis tests and multiple interpretations of decision rules. Stat. Surv. 2010, 4, 1–39. [Google Scholar] [CrossRef]
  38. Peter, C. Analysis of Covariance. In The International Encyclopedia of Communication Research Methods; Matthes, J., Davis, C.S., Potter, R.F., Eds.; John Wiley & Sons: Hoboken, NJ, USA, 2017. [Google Scholar] [CrossRef]
  39. Tassi, P. Sample Size. In International Encyclopedia of Statistical Science; Lovric, M., Ed.; Springer: Berlin/Heidelberg, Germany, 2011; pp. 466–470. [Google Scholar] [CrossRef]
  40. de la O, V.; Fernández-Cruz, E.; Matía Matin, P.; Larrad-Sainz, A.; Espadas Gil, J.L.; Barabash, A.; Fernández-Díaz, C.M.; Calle-Pascual, A.L.; Rubio-Herrera, M.A.; Martínez, J.A. Translational Algorithms for Technological Dietary Quality Assessment Integrating Nutrimetabolic Data with Machine Learning Methods. Nutrients 2024, 16, 3817. [Google Scholar] [CrossRef]
  41. Menyhart, O.; Weltz, B.; Győrffy, B. MultipleTesting.com: A Tool for Life Science Researchers for Multiple Hypothesis Testing Correction. PLoS ONE 2021, 16, e0245824. [Google Scholar] [CrossRef]
  42. Toromanović, J.; Kovač-Bešović, E.; Šapčanin, A.; Tahirović, I.; Rimpapa, Z.; Kroyer, G.; Sofić, E. Urinary Hippuric Acid after Ingestion of Edible Fruits. Bosn. J. Basic Med. Sci. 2008, 8, 38–43. [Google Scholar] [CrossRef]
  43. Penczynski, K.J.; Krupp, D.; Bring, A.; Bolzenius, K.; Remer, T.; Buyken, A.E. Relative Validation of 24-h Urinary Hippuric Acid Excretion as a Biomarker for Dietary Flavonoid Intake from Fruit and Vegetables in Healthy Adolescents. Eur. J. Nutr. 2017, 56, 757–766. [Google Scholar] [CrossRef] [PubMed]
  44. Espín, J.C.; Larrosa, M.; García-Conesa, M.T.; Tomás-Barberán, F.A. Biological Significance of Urolithins, the Gut Microbial Ellagic Acid-Derived Metabolites: The Evidence So Far. Evid.-Based Complement. Altern. Med. 2013, 2013, 270418. [Google Scholar] [CrossRef] [PubMed]
  45. González-Barrio, R.; Edwards, C.A.; Crozier, A. Colonic Catabolism of Ellagitannins, Ellagic Acid, and Raspberry Anthocyanins: In Vivo and In Vitro Studies. Drug Metab. Dispos. 2011, 39, 1680–1688. [Google Scholar] [CrossRef] [PubMed]
  46. Zhang, X.; Zhong, H.; Li, Y.; Shi, Z.; Ren, H.; Zhang, Z.; Zhou, X.; Tang, S.; Han, X.; Lin, Y.; et al. Sex- and Age-Related Trajectories of the Adult Human Gut Microbiota Shared across Populations of Different Ethnicities. Nat. Aging 2021, 1, 87–100. [Google Scholar] [CrossRef]
  47. Jardon, K.M.; Goossens, G.H.; Most, J.; Galazzo, G.; Venema, K.; Penders, J.; Blaak, E.E. Examination of Sex-Specific Interactions between Gut Microbiota and Host Metabolism after 12-Week Combined Polyphenol Supplementation in Individuals with Overweight or Obesity. Gut Microbes 2024, 16, 2392875. [Google Scholar] [CrossRef]
  48. Caterino, M.; Ruoppolo, M.; Villani, G.R.D.; Marchese, E.; Costanzo, M.; Sotgiu, G.; Dore, S.; Franconi, F.; Campesi, I. Influence of Sex on Urinary Organic Acids: A Cross-Sectional Study in Children. Int. J. Mol. Sci. 2020, 21, 582. [Google Scholar] [CrossRef]
  49. Santos-Marcos, J.A.; Rangel-Zuñiga, O.A.; Jimenez-Lucena, R.; Quintana-Navarro, G.M.; Garcia-Carpintero, S.; Malagon, M.M.; Landa, B.B.; Tena-Sempere, M.; Perez-Martinez, P.; Lopez-Miranda, J.; et al. Influence of Gender and Menopausal Status on Gut Microbiota. Maturitas 2018, 116, 43–53. [Google Scholar] [CrossRef]
  50. Guerra, A.; Ticinesi, A.; Allegri, F.; Nouvenne, A.; Prati, B.; Pinelli, S.; Merli, R.; Tana, C.; Lauretani, F.; Aloe, R.; et al. Insights about Urinary Hippuric and Citric Acid as Biomarkers of Fruit and Vegetable Intake in Patients with Kidney Stones: The Role of Age and Sex. Nutrition 2019, 59, 83–89. [Google Scholar] [CrossRef]
  51. Liang, S.; Nasir, R.F.; Bell-Anderson, K.S.; Toniutti, C.A.; O’Leary, F.M.; Skilton, M.R. Biomarkers of Dietary Patterns: A Systematic Review of Randomized Controlled Trials. Nutr. Rev. 2022, 80, 1856–1895. [Google Scholar] [CrossRef]
  52. Ferrari, L.; Panaite, S.A.; Bertazzo, A.; Visioli, F. Animal- and Plant-Based Protein Sources: A Scoping Review of Human Health Outcomes and Environmental Impact. Nutrients 2022, 14, 5115. [Google Scholar] [CrossRef]
  53. Chadid, S.; Kreger, B.E.; Singer, M.R.; Loring Bradlee, M.; Moore, L.L. Anthropometric Measures of Body Fat and Obesity-Related Cancer Risk: Sex-Specific Differences in Framingham Offspring Study Adults. Int. J. Obes. 2020, 44, 601–608. [Google Scholar] [CrossRef] [PubMed]
  54. Wohlgemuth, K.J.; Arieta, L.R.; Brewer, G.J.; Hoselton, A.L.; Gould, L.M.; Smith-Ryan, A.E. Sex Differences and Considerations for Female Specific Nutritional Strategies: A Narrative Review. J. Int. Soc. Sports Nutr. 2021, 18, 27. [Google Scholar] [CrossRef] [PubMed]
  55. Ravanbakhsh, S.; Liu, P.; Bjordahl, T.C.; Mandal, R.; Grant, J.R.; Wilson, M.; Eisner, R.; Sinelnikov, I.; Hu, X.; Luchinat, C.; et al. Accurate, Fully-Automated NMR Spectral Profiling for Metabolomics. PLoS ONE 2015, 10, e0124219. [Google Scholar] [CrossRef] [PubMed]
  56. Hertel, J.; Fässler, D.; Heinken, A.; Weiß, F.U.; Rühlemann, M.; Bang, C.; Franke, A.; Budde, K.; Henning, A.K.; Petersmann, A.; et al. NMR Metabolomics Reveal Urine Markers of Microbiome Diversity and Identify Benzoate Metabolism as a Mediator between High Microbial Alpha Diversity and Metabolic Health. Metabolites 2022, 12, 308. [Google Scholar] [CrossRef]
  57. Vernocchi, P.; Del Chierico, F.; Putignani, L. Gut Microbiota Profiling: Metabolomics Based Approach to Unravel Compounds Affecting Human Health. Front. Microbiol. 2016, 7, 1144. [Google Scholar] [CrossRef]
Figure 1. Representative Nuclear Magnetic Resonance (NMR) spectra highlighting the most relevant peaks corresponding to the urinary metabolites identified in the analysis.
Metabolites 15 00348 g001
Figure 2. Spearman correlations between the 34 metabolites analyzed by Nuclear Magnetic Resonance (NMR) and the 14 categories of the EAT-Lancet score analyzed for all the volunteers of the Dietary Deal project (n = 138). Fruit and nut consumption is associated with hippuric acid concentration, which is indicated in the figure with arrows and boxes to facilitate identification. * p < 0.05.
Metabolites 15 00348 g002
Figure 3. Linear regression analysis between hippuric acid (mmol/L) and nuts consumption (g/d) derived from the Food Frequency Questionnaire (FFQ) among participants in the Dietary Deal project. Portion size was described mostly between 0 and 70 g/d, with only a few participants with consumption higher than 100 g/d (a). More specific analysis was performed independently in men (b) and women (c). Extreme values (<P5 and >P95) were excluded, and the model was adjusted for age, sex, Body Mass Index (BMI), and total energy intake. The model explained 24% of the variability in hippurate levels. In men, higher intake of nuts (g/day) was positively associated with hippurate levels, independent of age, BMI, and total energy intake (β = 0.057, 95% CI: 0.007 to 0.107, p = 0.026). Conversely, in women, nut intake showed no significant association (β = –0.002, 95% CI: –0.048 to 0.044, p = 0.936), and the model had very limited explanatory power (R2 = 0.02).
Metabolites 15 00348 g003
Figure 4. Average nut intake derived from the Food Frequency Questionnaire (FFQ) (g/d) expressed by median (P50) in males (M) and females (F) (a). Highlighting hippuric acid concentration, with the same nut consumption, males and females described different concentrations (b).
Metabolites 15 00348 g004
Table 1. List of 34 metabolites analyzed by Proton Nuclear Magnetic Resonance (1H-NMR), including their chemical shifts (ppm) and signal assignment, categorized into six putative groups based on their origins (macronutrient metabolism—fats, proteins, carbohydrates, gut microbiota metabolism, nitrogen metabolism, and nucleotide metabolism).
MetabolismPutative Associated GroupCompound AnalyzedChemical Shift (ppm)Signal
Amino acids or derived compoundsAliphatic amino acids and derived compoundsAlanine1.5D
Alloisoleucine0.9D
Glycine3.6S
Isoleucine1.0D
Leucine1.0T
Valine1.0D
Aromatic amino acids and derived compounds4-Hydroxyphenyllactate6.9M
Phenylalanine7.4M
Tyrosine6.9M
Sulfonic acidTaurine3.3T
Energy and carbohydrate metabolismKrebs cyclecis-Aconitate5.7M
Citrate2.7M
Methylsuccinate1.1D
Carbohydrate metabolismGalactose5.3D
Glucose5.2D
Glycolate4.0S
Gut microbiota metabolismCarboxylic acidsAcetate1.9S
Formate8.5S
Metabolites derived from nitrogenous compoundsDimethylamine2.7S
Trimethylamine N-oxide (TMAO)3.3S
Phenolic compounds related to dietary polyphenolsHippurate7.8M
Sulfur-containing compounds derived from amino acids3-Indoxylsulfate7.7M
Nitrogenous compoundsNitrogen-related metabolitesCreatinine4.1S
Urea5.8S
Methylation-related metabolitesBetaine3.3S
Trigonelline9.1S
Nucleotide metabolismPrecursors or intermediates of nucleotidesUracil5.8D
Xanthosine5.9D
Degradation products of nucleotides3-Aminoisobutyrate1.2D
Fatty acid metabolismIntermediates in branched-chain fatty acid oxidation3-Methyl-2-oxovalerate1.1D
3-Hydroxyisovalerate1.3S
Metabolites from beta-oxidation and alternative pathways3-Hydroxyisobutyrate1.1D
Short-chain fatty acids (SCFAs)Isobutyrate1.1D
2-Hydroxyisobutyrate1.4S
S: Singlet, an isolated proton with no neighboring protons; D: Doublet, a proton with one neighboring proton; T: Triplet, a proton with two equivalent neighboring protons; M: Multiplet, a proton coupled to multiple non-equivalent protons or involved in more complex systems.
Table 2. Description of the 14 components of the EAT-Lancet score based on low or high adherence according to the median (P50), differentiated by sex.
EAT Lancet Score (n = 138)EAT-Lancet Score < P50 (n = 75) EAT-Lancet Score ≥ P50 (n = 63)
Total (n = 138)Male (n = 29)Female (n = 46) Male (n = 13)Female (n = 50)
EAT Lancet food group (g/d)P50 (IQR)P50 (IQR)P50 (IQR)pP50 (IQR)P50 (IQR)pp-EATp-Sex
EAT-Lancet Score (0–14p)8 (7–9)8 (7–8)8 (7–8)0.7329 (9–10)9 (9–10)0.826<0.0010.316
Grains120.6 (79.3–169.1)162 (103.2–191.4)100.8 (60–173.3)0.027126.2 (103.3–171.3)107.6 (77–161.4)0.3440.5040.010
Potatoes31.4 (20–74.3)42.8 (21.4–85.7)31.4 (20–64.3)0.15153.6 (10–74.3)31.4 (20–64.3)0.7370.3850.148
Vegetables473.1 (364.2–808.2)416.6 (307.6–594.5)504.6 (349.9–754.7)0.262593.3 (399.9–776)469 (378.5–828.5)0.9850.1680.282
Fruits345.4 (196.8–499.2)210.7 (124.6–286.8)358.5 (222.7–474.7)0.003353.4 (267.8–542.3)372.8 (207.1–613.5)0.5910.0120.005
Milk and derivatives347.1 (226–558.6)342.2 (240.1–607.1)503.3 (276.6–564.3)0.960285.5 (202.8–365.1)299 (142.6–517.6)0.7250.0100.790
Beef, lamb, pork115.2 (77.3–160)161.9 (113.5–189.3)104.2 (71.4–149.9)0.001125 (84.7–178.8)98.8 (51.9–142.8)0.3350.0960.001
Poultry64.3 (31.4–74.3)64.3 (64.3–74.3)64.3 (64.3–74.3)0.49864.3 (31.4–74.3)31.4 (21.4–64.3)0.144<0.0010.045
Eggs25.7 (25.7–47.1)25.7 (25.7–47.1)25.7 (25.7–47.1)0.62125.7 (25.7–47.1)25.7 (25.7–47.1)0.4760.6760.375
Fish81.6 (56.2–117)78.7 (45.1–109.8)94.9 (62–137.8)0.03789.5 (64.3–103)77.3 (56.8–98.9)0.2390.1390.349
Legumes17.1 (12.6–29.7)16.8 (16–27.4)16.6 (12–25.7)0.60025.4 (16–46.8)21.1 (12.6–29.7)0.2000.1100.364
Nuts21.4 (7.1–39.3)21.4 (3.3–21.4)21.4 (7.1–21.4)0.82844.6 (21.4–50)39.3 (7.1–50)0.484<0.0010.934
Oils, fats (unsat/sat ratio)18 (5.8–37.5)11.7 (4.7–18.5)22.6 (5.8–37.5)0.33114.5 (14–35)24 (5–40.8)0.9190.9410.456
Sweeteners1.4 (0–10)8.6 (0.3–25)1.3 (0–10.7)0.1290 (0–7.9)1.4 (0–10)0.1010.0640.657
IQR: Interquartile range. Grains: score of 1 for consumption ≤ 464 g/day and fiber > 5 g; potatoes and cassava: score of 1 for consumption ≤ 100 g/day; vegetables: score of 1 for consumption ≥ 200 g/day; fruits: score of 1 for consumption ≥ 100 g/day; milk and dairy products: score of 1 for consumption ≤ 500 g/day; beef, lamb, and pork: score of 1 for consumption ≤ 28 g/day; poultry: score of 1 for consumption ≤ 58 g/day; eggs: score of 1 for consumption ≤ 25 g/day; fish: score of 1 for consumption ≤ 100 g/day; legumes: score of 1 for consumption ≤ 100 g/day; nuts and seeds: score of 1 for consumption ≥ 25 g/day; oils and fats: score of 1 if the unsaturated-to-saturated fat ratio is ≥0.8; sweeteners: score of 1 for consumption ≤ 31 g/day.
Table 3. Concentration of gut microbiota metabolism (mmol/L) in urine samples from volunteers in the Dietary Deal study (n = 138) analyzed by Proton Nuclear Magnetic Resonance (1H-NMR) based on low or high adherence according to the median (P50) using the EAT-Lancet Score.
EAT-Lancet < Median (n = 75) EAT-Lancet ≥ Median (n = 63)
Total (n = 138)Male (n = 29)Female (n = 46) Male (n = 13)Female (n = 50)
Metabolite (mmol/L)Missing/TotalP50 (IR)P50 (IQR)P50 (IQR)pP50 (IQR)P50 (IQR)pp-EATp-Sex
3-indoxylsulfate14/1380.347 (0.2–0.55)0.349 (0.178–0.609)0.38 (0.26–0.621)0.6590.342 (0.133–0.46)0.292 (0.199–0.454)0.8760.0740.783
Acetate28/1380.041 (0.023–0.066)0.039 (0.015–0.058)0.035 (0.024–0.068)0.2100.058 (0.032–0.127)0.042 (0.024–0.1)0.3830.2920.688
Dimethylamine1/1380.542 (0.371–0.776)0.617 (0.443–0.896)0.552 (0.374–0.778)0.4610.522 (0.354–0.736)0.493 (0.361–0.732)0.9260.2490.475
Formate8/1380.249 (0.169–0.353)0.214 (0.174–0.401)0.289 (0.202–0.419)0.4170.224 (0.182–0.297)0.196 (0.147–0.295)0.4740.0200.904
Hippurate5/1383.589 (2.252–6.8)3.367 (1.611–5.121)3.934 (2.784–7.294)0.0452.871 (2.372–4.236)3.846 (2.105–7.668)0.2180.9090.020
Trimethylamine-N-oxide35/1380.681 (0.417–1.776)1.032 (0.438–1.436)0.621 (0.417–1.828)0.6530.539 (0.279–0.873)0.612 (0.393–1.486)0.3440.3370.838
IQR: Interquartile range.
Disclaimer/Publisher’s Note: The statements, opinions and data contained in all publications are solely those of the individual author(s) and contributor(s) and not of MDPI and/or the editor(s). MDPI and/or the editor(s) disclaim responsibility for any injury to people or property resulting from any ideas, methods, instructions or products referred to in the content.

