

Association of Trace Elements with Polycystic Ovary Syndrome in Women—A Case-Control Study

 , , , , and
Abstract
1. Introduction
2. Materials and Methods
2.1. Study Population
2.2. Questionnaire Data
2.3. Sample Analysis
2.3.1. Biochemical and Hormonal Assays
2.3.2. Analysis of Trace Elements
2.4. Statistical Analysis
3. Results
3.1. General Characteristics of the Study Population
3.2. Anthropometric, Ultrasonographic, and Laboratory Features of the Study Population
3.3. Trace Element Levels in Study Population
3.3.1. Sociodemographic Characteristics and Mo and Cu Levels
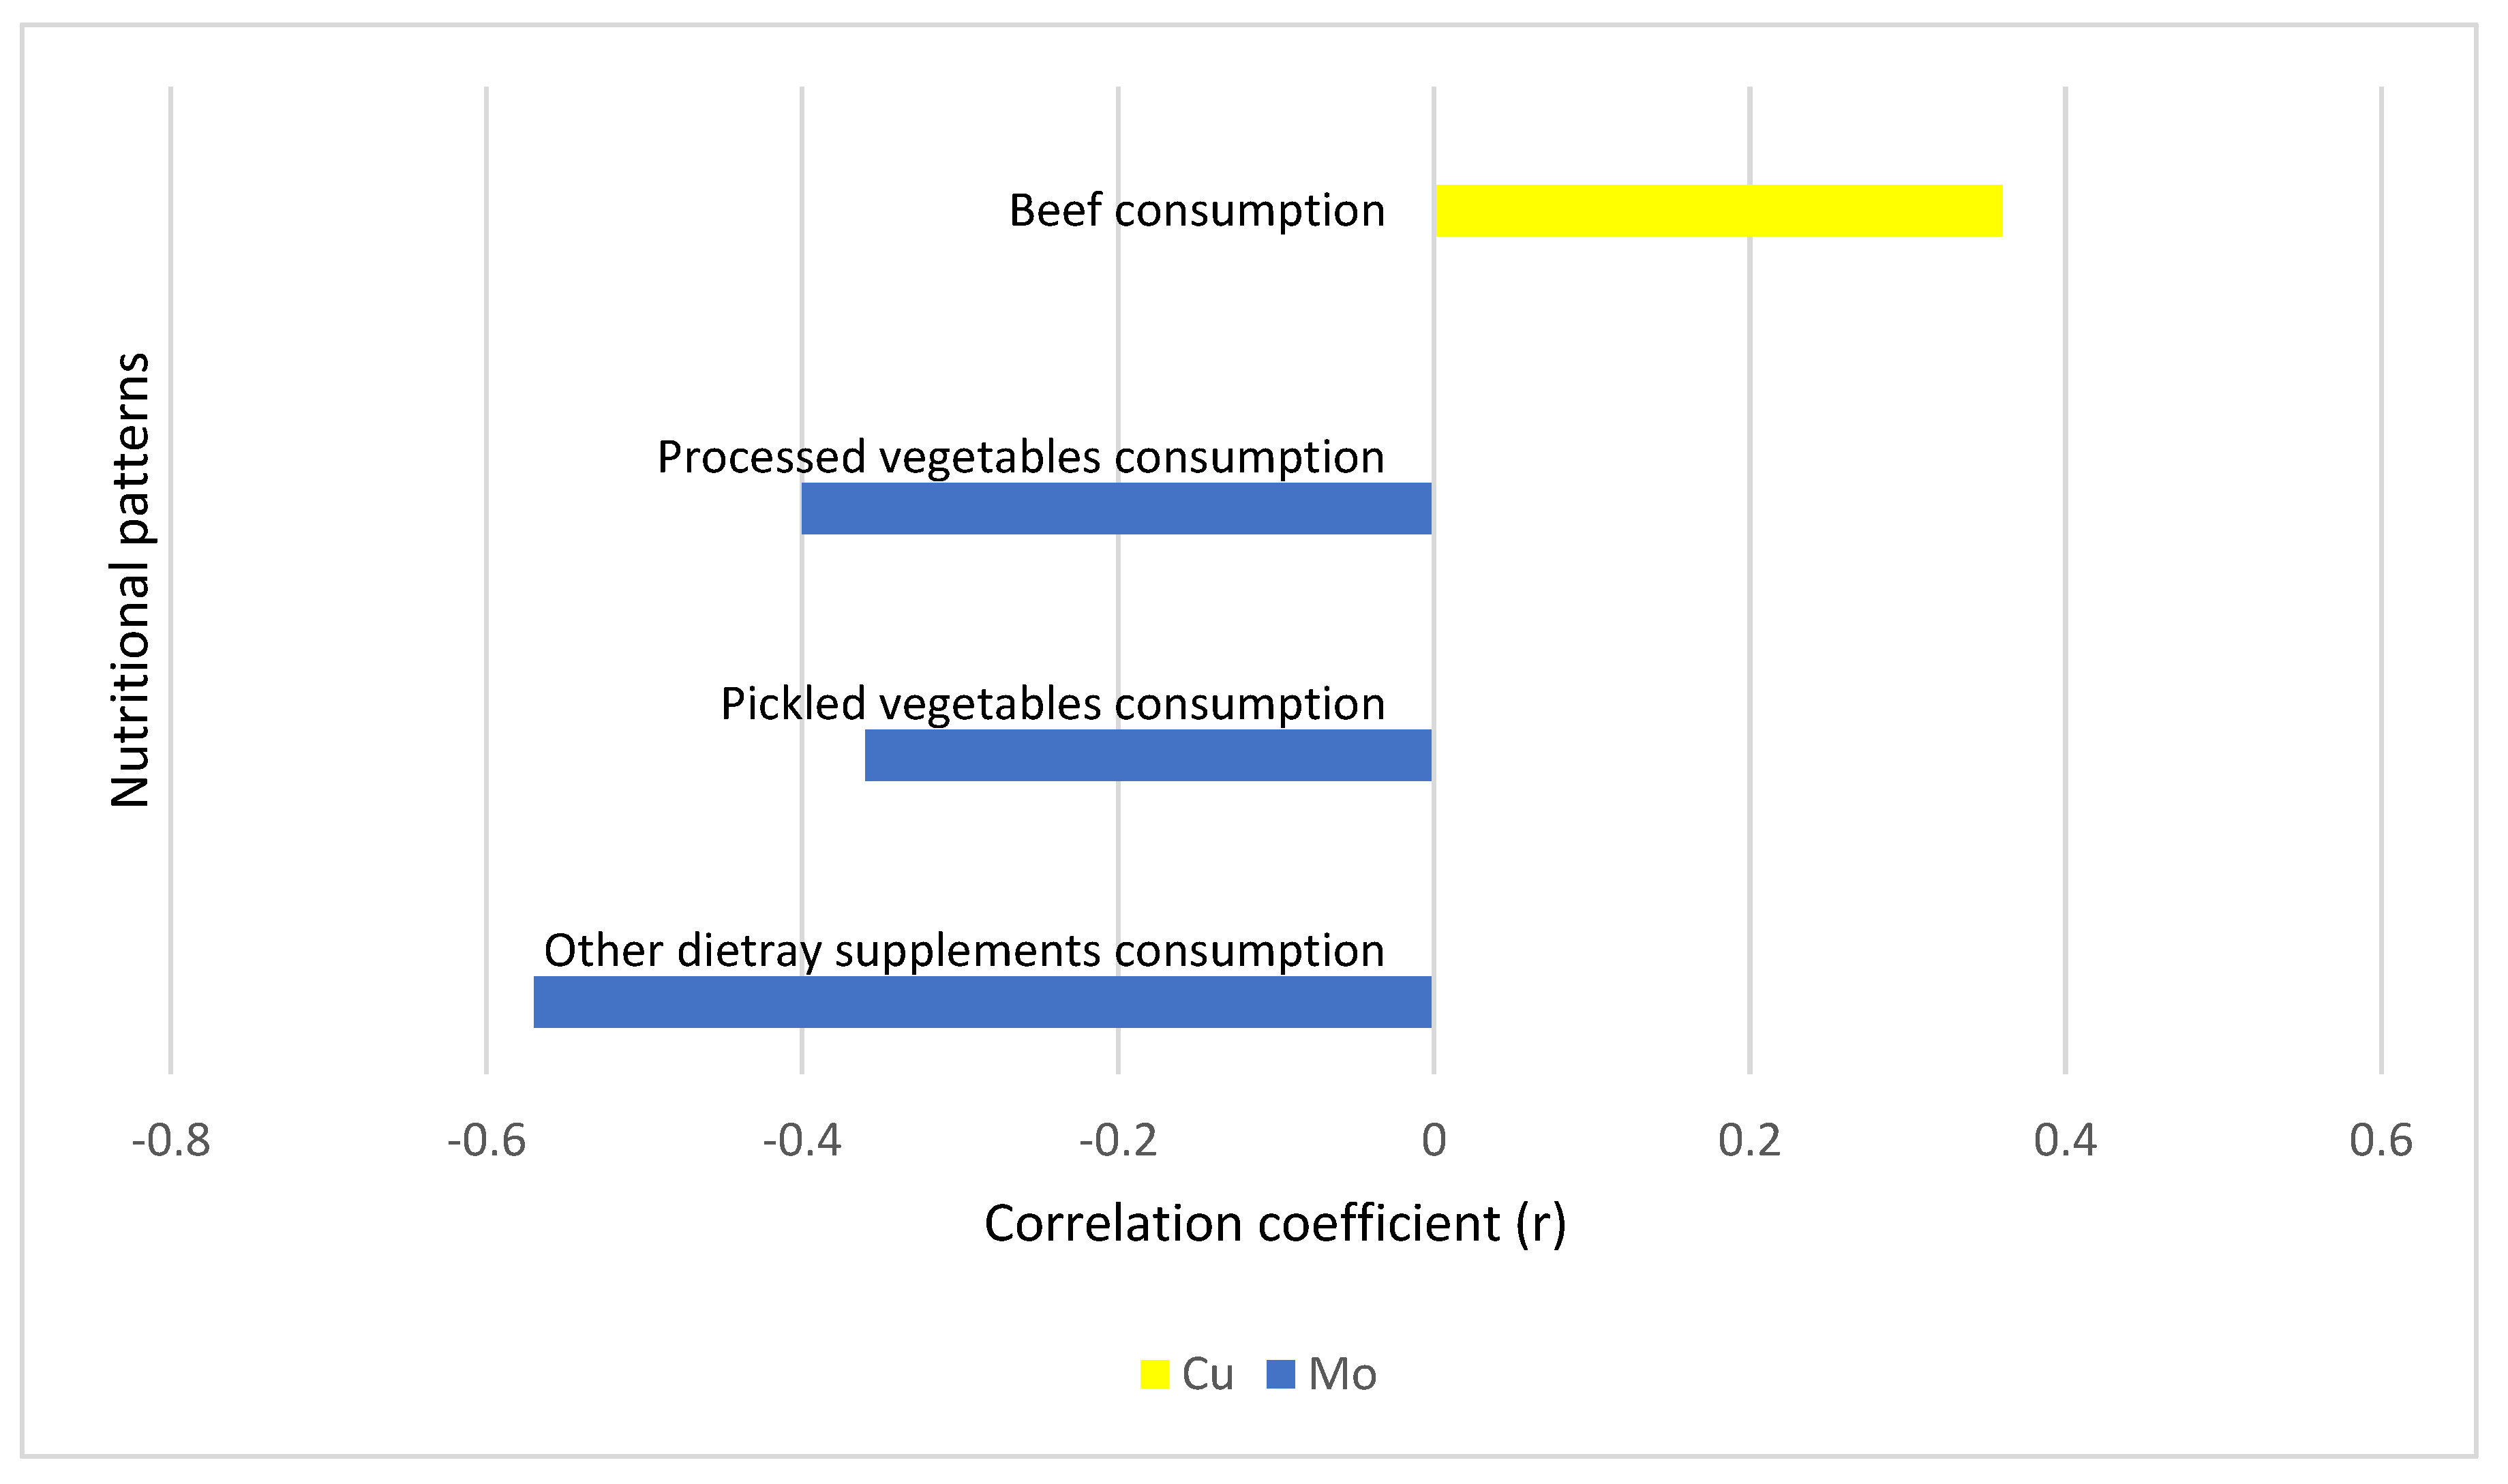
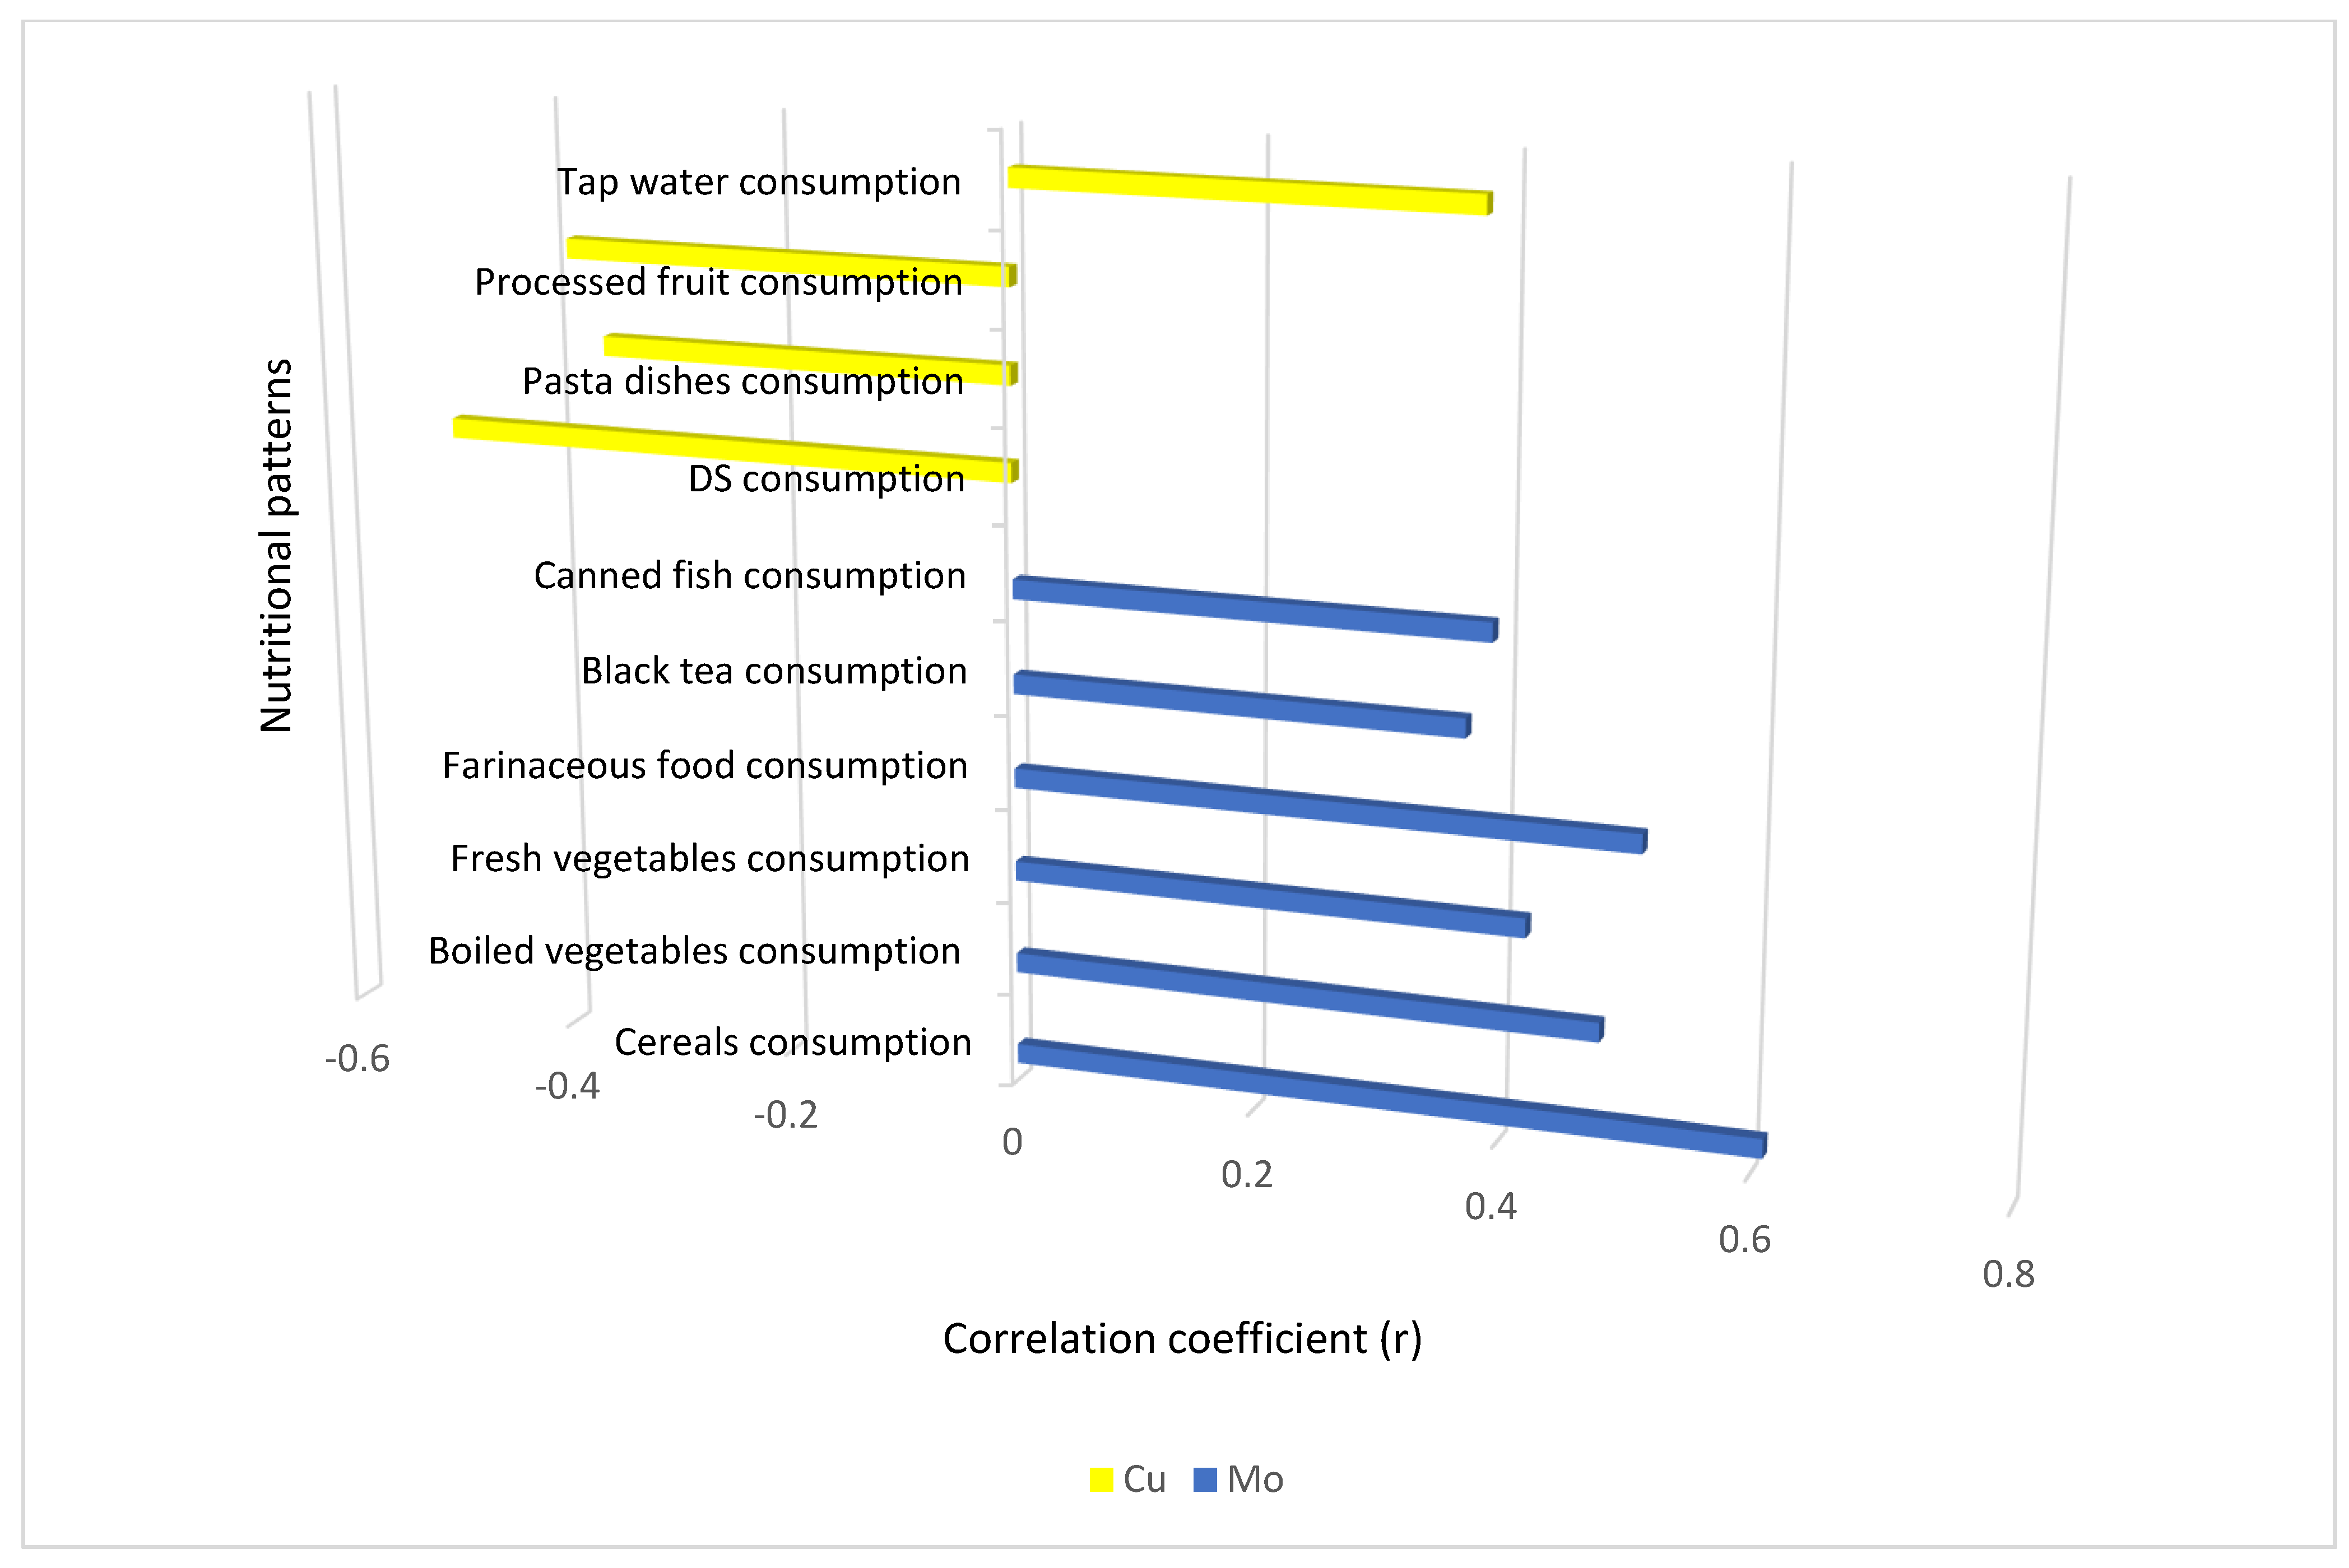
3.3.2. Nutritional Patterns, Laboratory Features, and Mo and Cu Levels
3.3.3. Liver and Kidney Function and Mo and Cu Levels
3.3.4. Zinc/Copper Ratios
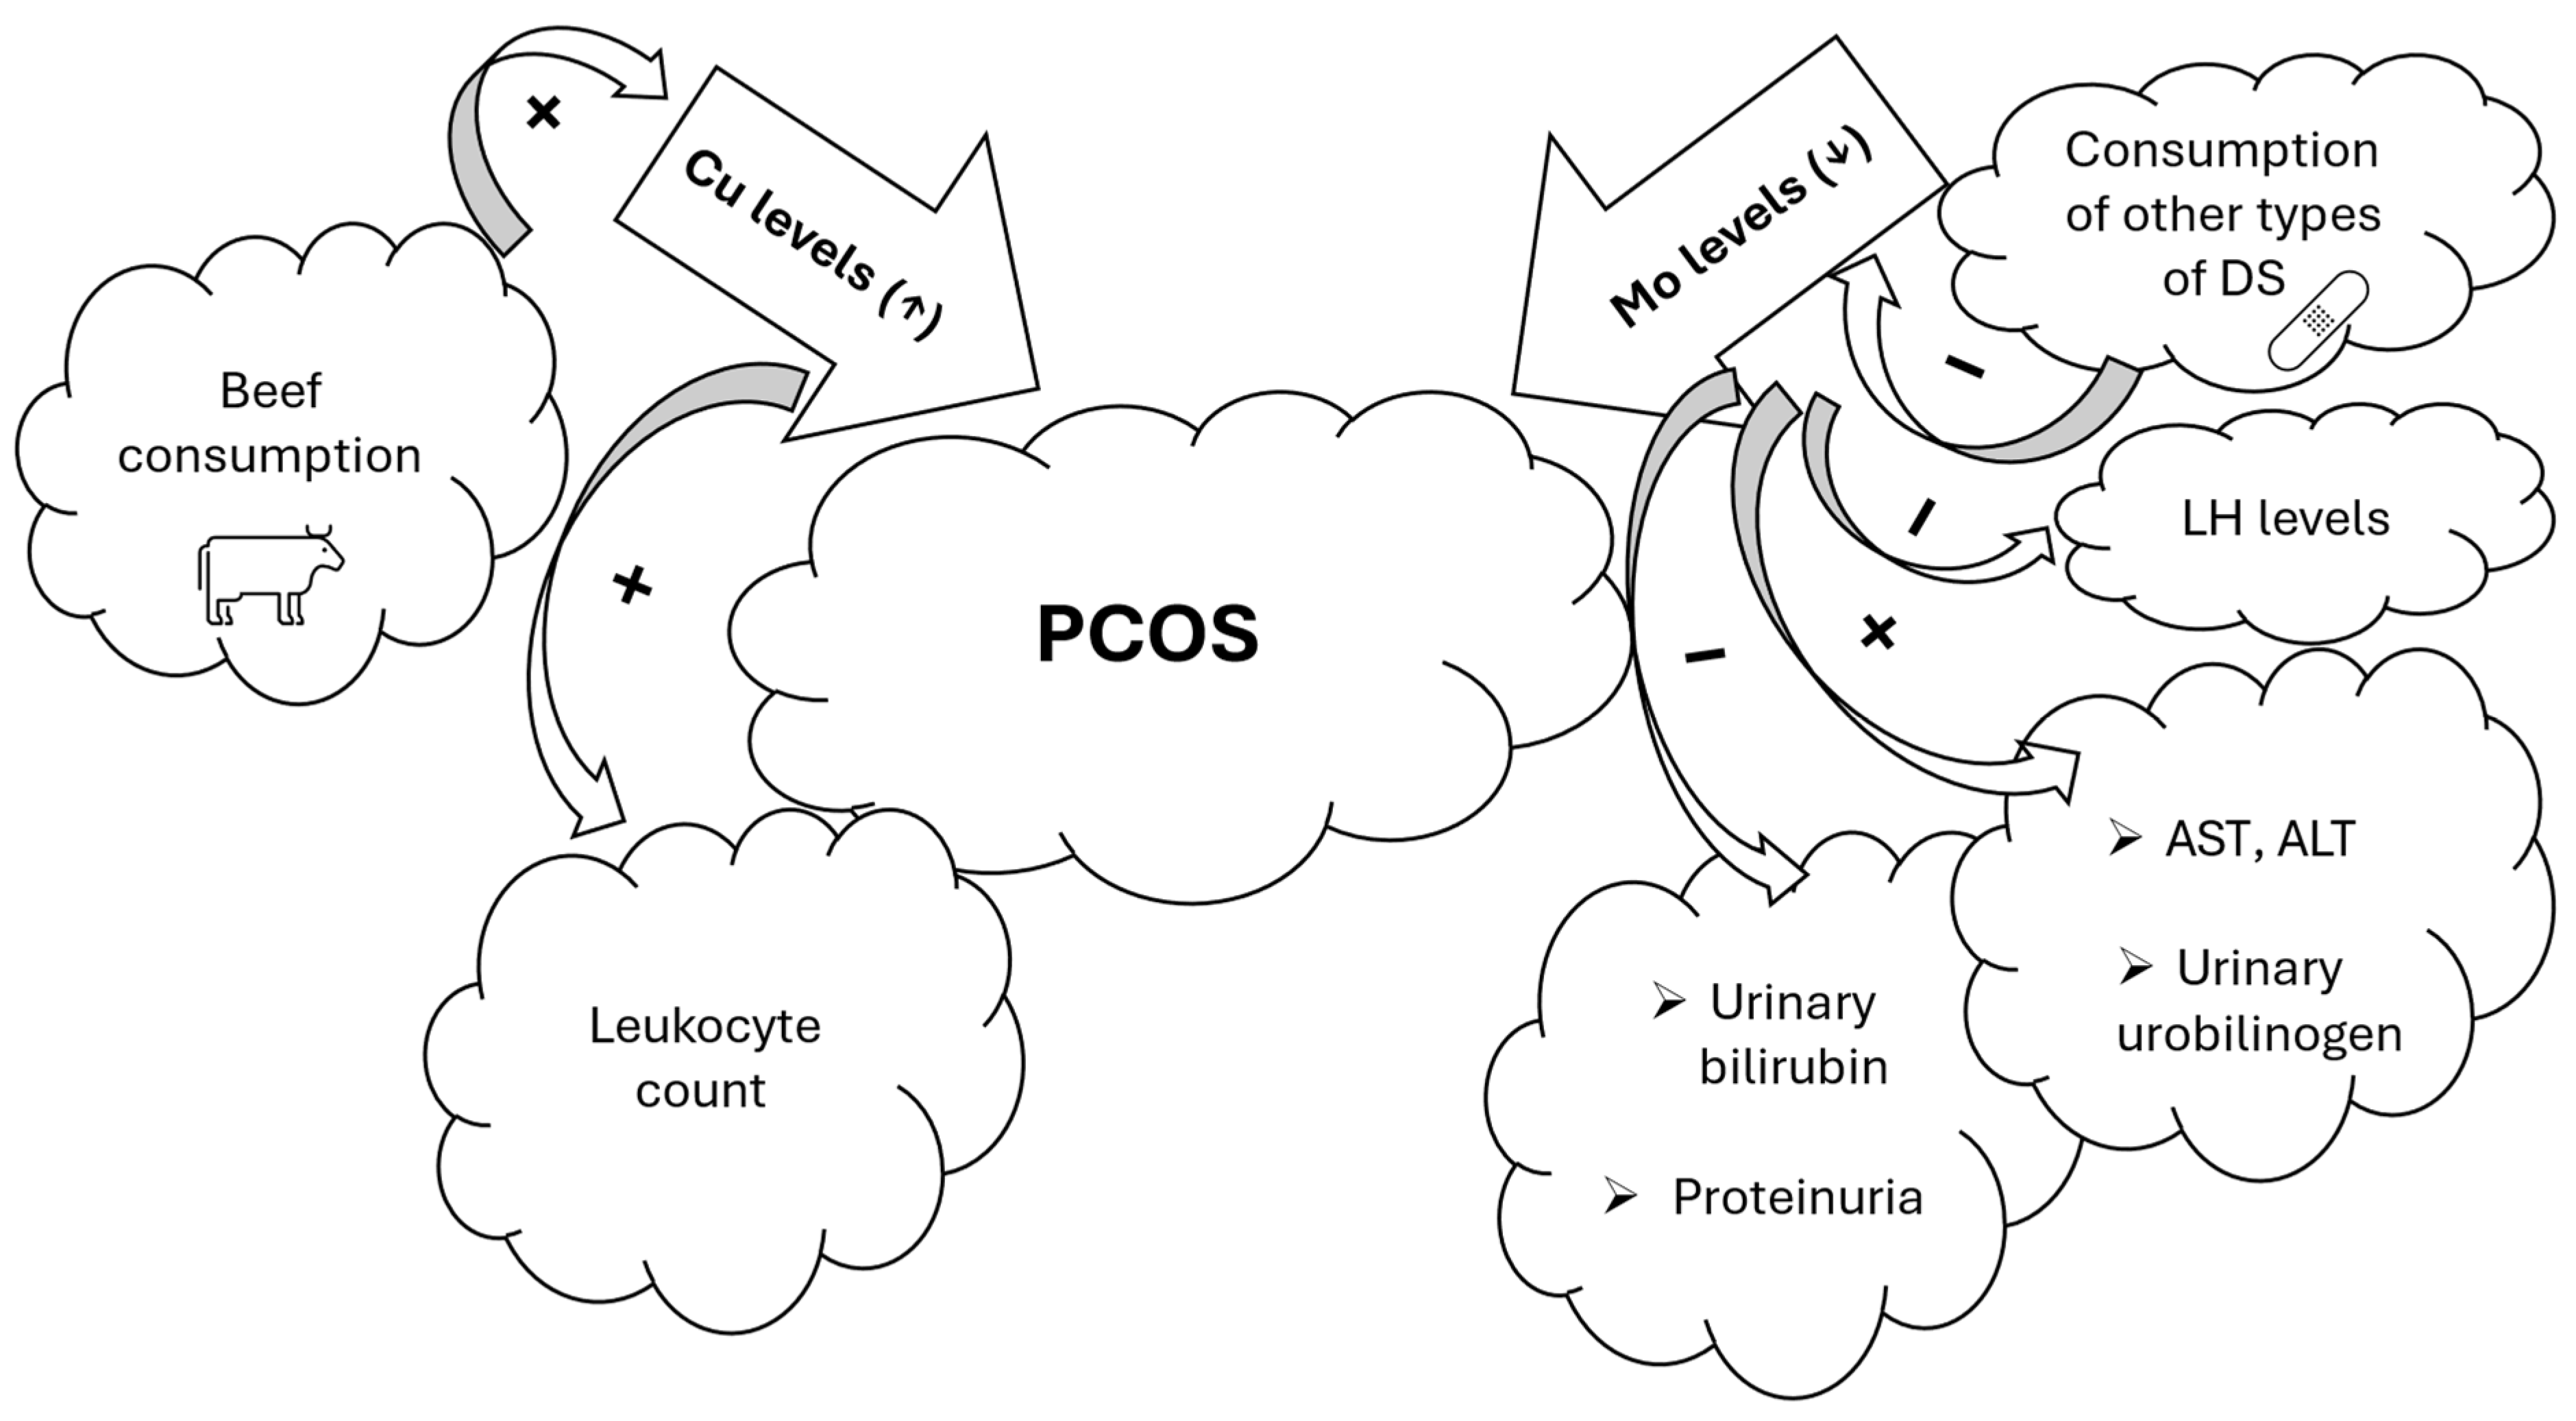
3.4. Summary of the Most Important Results of the Study
4. Discussion
4.1. Comparison and Contrast with the Findings of Similar Studies
4.2. Limitations and Strengths of the Study
4.3. Implications of the Study Results for PCOS
4.4. Suggestions for Future Research in the Field
5. Conclusions
Supplementary Materials
Author Contributions
Funding
Institutional Review Board Statement
Informed Consent Statement
Data Availability Statement
Acknowledgments
Conflicts of Interest
Abbreviations
| A | Androstenedione |
| Alb | Albumin |
| Alpha-1-microgl. | Alpha-1-Microglobulin |
| ALT | Alanine Aminotransferase |
| As | Arsenic |
| AST | Aspartate Aminotransferase |
| AFC | Antral Follicle Count |
| BMI | Body Mass Index |
| CI | Confidence Interval |
| Cd | Cadmium |
| Cu | Copper |
| Creat | Creatinine |
| DHEAS | Dehydroepiandrosterone Sulphate |
| DS | Dietary Supplement |
| FAI | Free Androgen Index |
| FSH | Follicle-Stimulating Hormone |
| GM | Geometric Mean |
| GSH | Glutathione |
| HDL | High-Density Lipoprotein |
| Hg | Mercury |
| IgG | Immunoglobulin G |
| IR | Insulin Resistance |
| L | Leukocyte Count |
| LH | Luteinizing Hormone |
| LDL | Low-Density Lipoprotein |
| LOD | Limit of Detection |
| MCH | Mean Corpuscular Hemoglobin |
| MCHC | Mean Corpuscular Hemoglobin Concentration |
| MCV | Mean Corpuscular Volume |
| Mn | Manganese |
| Mo | Molybdenum |
| NA | Not Available |
| oGF | Glomerular Filtration Rate |
| ORV | Outside the Reference Value |
| OS | Oxidative Stress |
| OV | Ovarian Volume |
| P | Progesterone |
| Pb | Lead |
| PCOS | Polycystic Ovary Syndrome |
| PRL | Prolactin |
| r | Correlation Coefficient |
| RDW | Red Blood Cell Distribution Width |
| RV95 | Reference Value (95th percentile) |
| S | Serum |
| SG | Specific Gravity |
| SG-norm | Specific Gravity Normalization |
| SHBG | Sex Hormone-Binding Globulin |
| Se | Selenium |
| SD | Standard Deviation |
| SOD | Superoxide Dismutase |
| TE | Trace Elements |
| TSH | Thyroid-Stimulating Hormone |
| TT | Total Testosterone |
| U | Urine |
| U-bilirub. | Urinary Bilirubin |
| U-creat. | Urinary Creatinine |
| U-Hb | Hemoglobin in Urine |
| U-ket. | Ketone Bodies in Urine |
| U-pH | Urine pH |
| U-urobil. | Urinary Urobilinogen |
| WB | Whole Blood |
| WC | Wrist Circumference |
| Zn | Zinc |
| γ-GT | Gamma-Glutamyl Transferase |
| 25(OH)-vit.D | 25-hydroxyvitamin D3 |
References
- Azziz, R.; Woods, K.S.; Reyna, R.; Key, T.J.; Knochenhauer, E.S.; Yildiz, B.O. The Prevalence and Features of the Polycystic Ovary Syndrome in an Unselected Population. J. Clin. Endocrinol. Metab. 2004, 89, 2745–2749. [Google Scholar] [CrossRef]
- The Rotterdam ESHRE/ASRM-Sponsored PCOS Consensus Workshop Group. Revised 2003 Consensus on Diagnostic Criteria and Long-Term Health Risks Related to Polycystic Ovary Syndrome. Fertil. Steril. 2004, 81, 19–25. [Google Scholar] [CrossRef]
- Jiang, Q.; Zhang, F.; Han, L.; Zhu, B.; Liu, X. Serum Copper Level and Polycystic Ovarian Syndrome: A Meta-Analysis. Gynecol Obs. Investig. 2021, 86, 239–246. [Google Scholar] [CrossRef] [PubMed]
- Kirmizi, D.A.; Baser, E.; Turksoy, V.A.; Kara, M.; Yalvac, E.S.; Gocmen, A.Y. Are Heavy Metal Exposure and Trace Element Levels Related to Metabolic and Endocrine Problems in Polycystic Ovary Syndrome? Biol. Trace Elem. Res. 2020, 198, 77–86. [Google Scholar] [CrossRef] [PubMed]
- Srnovršnik, T.; Virant-Klun, I.; Pinter, B. Heavy Metals and Essential Elements in Association with Oxidative Stress in Women with Polycystic Ovary Syndrome—A Systematic Review. Antioxidants 2023, 12, 1398. [Google Scholar] [CrossRef] [PubMed]
- González, F.; Rote, N.S.; Minium, J.; Kirwan, J.P. Reactive Oxygen Species-Induced Oxidative Stress in the Development of Insulin Resistance and Hyperandrogenism in Polycystic Ovary Syndrome. J. Clin. Endocrinol. Metab. 2006, 91, 336–340. [Google Scholar] [CrossRef]
- Kurdoglu, Z.; Kurdoglu, M.; Demir, H.; Sahin, H. Serum Trace Elements and Heavy Metals in Polycystic Ovary Syndrome. Hum. Exp. Toxicol. 2012, 31, 452–456. [Google Scholar] [CrossRef]
- Spritzer, P.M.; Lecke, S.B.; Fabris, V.C.; Ziegelmann, P.K.; Amaral, L. Blood Trace Element Concentrations in Polycystic Ovary Syndrome: Systematic Review and Meta-Analysis. Biol. Trace Elem. Res. 2017, 175, 254–262. [Google Scholar] [CrossRef] [PubMed]
- ElObeid, T.; Awad, M.O.; Ganji, V.; Moawad, J. The Impact of Mineral Supplementation on Polycystic Ovarian Syndrome. Metabolites 2022, 12, 338. [Google Scholar] [CrossRef]
- Pokorska-Niewiada, K.; Brodowska, A.; Szczuko, M. The Content of Minerals in the PCOS Group and the Correlation with the Parameters of Metabolism. Nutrients 2021, 13, 2214. [Google Scholar] [CrossRef] [PubMed]
- Jackson, L.W.; Howards, P.P.; Wactawski-Wende, J.; Schisterman, E.F. The Association between Cadmium, Lead and Mercury Blood Levels and Reproductive Hormones among Healthy, Premenopausal Women. Hum. Reprod. 2011, 26, 2887–2895. [Google Scholar] [CrossRef]
- Pollack, A.Z.; Schisterman, E.F.; Goldman, L.R.; Mumford, S.L.; Albert, P.S.; Jones, R.L.; Wactawski-Wende, J. Cadmium, Lead, and Mercury in Relation to Reproductive Hormones and Anovulation in Premenopausal Women. Environ. Health Perspect. 2011, 119, 1156–1161. [Google Scholar] [CrossRef]
- Stohs, S. Oxidative Mechanisms in the Toxicity of Metal Ions. Free Radic. Biol. Med. 1995, 18, 321–336. [Google Scholar] [CrossRef]
- Wang, X.-N.; Zhang, C.-J.; Diao, H.-L.; Zhang, Y. Protective Effects of Curcumin against Sodium Arsenite-Induced Ovarian Oxidative Injury in a Mouse Model. Chin. Med. J. 2017, 130, 1026–1032. [Google Scholar] [CrossRef] [PubMed]
- Chen, Y.W.; Yang, C.Y.; Huang, C.F.; Hung, D.Z.; Leung, Y.M.; Liu, S.H. Heavy Metals, Islet Function and Diabetes Development. Islets 2009, 1, 169–176. [Google Scholar] [CrossRef]
- Bhardwaj, J.K.; Paliwal, A.; Saraf, P. Effects of Heavy Metals on Reproduction Owing to Infertility. J. Biochem. Mol. Toxicol. 2021, 35, e22823. [Google Scholar] [CrossRef] [PubMed]
- Zheng, G.; Wang, L.; Guo, Z.; Sun, L.; Wang, L.; Wang, C.; Zuo, Z.; Qiu, H. Association of Serum Heavy Metals and Trace Element Concentrations with Reproductive Hormone Levels and Polycystic Ovary Syndrome in a Chinese Population. Biol. Trace Elem. Res. 2015, 167, 1–10. [Google Scholar] [CrossRef] [PubMed]
- Liang, C.; Zhang, Z.; Cao, Y.; Wang, J.; Shen, L.; Jiang, T.; Li, D.; Zou, W.; Zong, K.; Liang, D.; et al. Exposure to Multiple Toxic Metals and Polycystic Ovary Syndrome Risk: Endocrine Disrupting Effect from As, Pb and Ba. Sci. Total Environ. 2022, 849, 157780. [Google Scholar] [CrossRef]
- Abudawood, M.; Tabassum, H.; Alanazi, A.H.; Almusallam, F.; Aljaser, F.; Ali, M.N.; Alenzi, N.D.; Alanazi, S.T.; Alghamdi, M.A.; Altoum, G.H.; et al. Antioxidant Status in Relation to Heavy Metals Induced Oxidative Stress in Patients with Polycystic Ovarian Syndrome (PCOS). Sci. Rep. 2021, 11, 22935. [Google Scholar] [CrossRef]
- Zhang, C.; Xu, L.; Zhao, Y.; Wang, Y. Changes in Serum Heavy Metals in Polycystic Ovary Syndrome and Their Association with Endocrine, Lipid-Metabolism, Inflammatory Characteristics and Pregnancy Outcomes. Reprod. Toxicol. 2022, 111, 20–26. [Google Scholar] [CrossRef]
- Coskun, A.; Arikan, T.; Kilinc, M.; Arikan, D.C.; Ekerbiçer, H.Ç. Plasma Selenium Levels in Turkish Women with Polycystic Ovary Syndrome. Eur. J. Obstet. Gynecol. Reprod. Biol. 2013, 168, 183–186. [Google Scholar] [CrossRef]
- Kapper, C.; Oppelt, P.; Ganhör, C.; Gyunesh, A.A.; Arbeithuber, B.; Stelzl, P.; Rezk-Füreder, M. Minerals and the Menstrual Cycle: Impacts on Ovulation and Endometrial Health. Nutrients 2024, 16, 1008. [Google Scholar] [CrossRef]
- Pieczyńska, J.; Grajeta, H. The Role of Selenium in Human Conception and Pregnancy. J. Trace Elem. Med. Biol. 2015, 29, 31–38. [Google Scholar] [CrossRef]
- Zhao, J.; Dong, L.; Lin, Z.; Sui, X.; Wang, Y.; Li, L.; Liu, T.; Liu, J. Effects of Selenium Supplementation on Polycystic Ovarian Syndrome: A Systematic Review and Meta-Analysis on Randomized Clinical Trials. BMC Endocr. Disord. 2023, 23, 33. [Google Scholar] [CrossRef] [PubMed]
- Li, M.; Tang, Y.; Lin, C.; Huang, Q.; Lei, D.; Hu, Y. Serum Macroelement and Microelement Concentrations in Patients with Polycystic Ovary Syndrome: A Cross-Sectional Study. Biol. Trace Elem. Res. 2017, 176, 73–80. [Google Scholar] [CrossRef]
- Chakraborty, P.; Ghosh, S.; Goswami, S.K.; Kabir, S.N.; Chakravarty, B.; Jana, K. Altered Trace Mineral Milieu Might Play An Aetiological Role in the Pathogenesis of Polycystic Ovary Syndrome. Biol. Trace Elem. Res. 2013, 152, 9–15. [Google Scholar] [CrossRef]
- Kaushansky, A.; Frydman, M.; Kaufman, H.; Homburg, R. Endocrine Studies of the Ovulatory Disturbances in Wilson’s Disease (Hepatolenticular Degeneration). Fertil. Steril. 1987, 47, 270–273. [Google Scholar] [CrossRef] [PubMed]
- Liu, Y.; Zhang, W.; Liu, Z.; Zheng, A.; Liang, B.; Li, H.; Meng, Q. Serum Copper Assessment in Patients with Polycystic Ovary Syndrome and Tubal Infertility: A Retrospective 5-year Study. Food Sci. Nutr. 2024, 12, 5979–5989. [Google Scholar] [CrossRef]
- Das, J.; Bhuyan, B.; Kumar, P.; Nath, C.; Malakar, H.; Rajkhowa, P.; Boruah, P. Exploring Serum Zinc and Copper Levels as Potential Biomarkers in Polycystic Ovary Syndrome: A Cross-Sectional Study From Northeast India. Cureus 2024, 16, e57393. [Google Scholar] [CrossRef] [PubMed]
- Özer, A.; Bakacak, M.; Kıran, H.; Ercan, Ö.; Köstü, B.; Kanat-Pektaş, M.; Kılınç, M.; Aslan, F. Increased Oxidative Stress Is Associated with Insulin Resistance and Infertility in Polycystic Ovary Syndrome. Ginekol. Pol. 2016, 87, 733–738. [Google Scholar] [CrossRef] [PubMed]
- Yin, D.; Mao, R.; Wang, D.; Yu, P.; Zhou, C.; Liu, J.; Li, S.; Nie, Y.; Liao, H.; Peng, C. Association of Plasma Metal Levels with Outcomes of Assisted Reproduction in Polycystic Ovary Syndrome. Biol. Trace Elem. Res. 2024, 202, 4961–4977. [Google Scholar] [CrossRef] [PubMed]
- Sharma, P.; Kapoor, H.S.; Kaur, B.; Kamra, P.; Khetarpal, P. Investigation of the Association of Serum Trace Elements Concentrations and Serum Biochemical Parameters with the Risk of Polycystic Ovary Syndrome: A Case–Control Study. Biol. Trace Elem. Res. 2024, 202, 73–86. [Google Scholar] [CrossRef]
- Awonuga, A.O.; Camp, O.G.; Abu-Soud, H.M. A Review of Nitric Oxide and Oxidative Stress in Typical Ovulatory Women and in the Pathogenesis of Ovulatory Dysfunction in PCOS. Reprod. Biol. Endocrinol. 2023, 21, 111. [Google Scholar] [CrossRef] [PubMed]
- Foteva, V.; Fisher, J.J.; Qiao, Y.; Smith, R. Does the Micronutrient Molybdenum Have a Role in Gestational Complications and Placental Health? Nutrients 2023, 15, 3348. [Google Scholar] [CrossRef] [PubMed]
- The Amsterdam ESHRE/ASRM-Sponsored 3rd PCOS Consensus Workshop Group; Fauser, B.C.J.M.; Tarlatzis, B.C.; Rebar, R.W.; Legro, R.S.; Balen, A.H.; Lobo, R.; Carmina, H.; Chang, R.J.; Yildiz, B.O.; et al. Consensus on Women’s Health Aspects of Polycystic Ovary Syndrome (PCOS). Hum. Reprod. 2012, 27, 14–24. [Google Scholar] [CrossRef]
- Capizzi, M.; Leto, G.; Petrone, A.; Zampetti, S.; Papa, R.E.; Osimani, M.; Spoletini, M.; Lenzi, A.; Osborn, J.; Mastantuono, M.; et al. Wrist Circumference Is a Clinical Marker of Insulin Resistance in Overweight and Obese Children and Adolescents. Circulation 2011, 123, 1757–1762. [Google Scholar] [CrossRef] [PubMed]
- Amisi, C.A.; Ciccozzi, M.; Pozzilli, P. Wrist Circumference: A New Marker for Insulin Resistance in African Women with Polycystic Ovary Syndrome. World J. Diabetes 2020, 11, 42–51. [Google Scholar] [CrossRef] [PubMed]
- Snoj Tratnik, J.; Falnoga, I.; Mazej, D.; Kocman, D.; Fajon, V.; Jagodic, M.; Stajnko, A.; Trdin, A.; Šlejkovec, Z.; Jeran, Z.; et al. Results of the First National Human Biomonitoring in Slovenia: Trace Elements in Men and Lactating Women, Predictors of Exposure and Reference Values. Int. J. Hyg. Environ. Health 2019, 222, 563–582. [Google Scholar] [CrossRef]
- Hoet, P.; Deumer, G.; Bernard, A.; Lison, D.; Haufroid, V. Urinary Trace Element Concentrations in Environmental Settings: Is There a Value for Systematic Creatinine Adjustment or Do We Introduce a Bias? J. Expo. Sci. Environ. Epidemiol. 2016, 26, 296–302. [Google Scholar] [CrossRef] [PubMed]
- Tkalec, Ž.; Kosjek, T.; Snoj Tratnik, J.; Stajnko, A.; Runkel, A.A.; Sykiotou, M.; Mazej, D.; Horvat, M. Exposure of Slovenian Children and Adolescents to Bisphenols, Parabens and Triclosan: Urinary Levels, Exposure Patterns, Determinants of Exposure and Susceptibility. Environ. Int. 2021, 146, 106172. [Google Scholar] [CrossRef]
- Safarian, H.; Parizadeh, S.M.R.; Saberi-Karimain, M.; Darroudi, S.; Javandoost, A.; Mohammadi, F.; Moammeri, M.; Ferns, G.A.; Ghayour-Mobarhan, M.; Mohebati, M. The Effect of Curcumin on Serum Copper and Zinc and Zn/Cu Ratio in Individuals with Metabolic Syndrome: A Double-Blind Clinical Trial. J. Diet. Suppl. 2019, 16, 625–634. [Google Scholar] [CrossRef] [PubMed]
- Bornhorst, J.A.; McMillin, G.A. Trace and Toxic Elemental Testing in the Clinical Laboratory. Lab. Med. 2006, 37, 690–695. [Google Scholar] [CrossRef]
- Barceloux, D.G.; Barceloux, D. Molybdenum. J. Toxicol. Clin. Toxicol. 1999, 37, 231–237. [Google Scholar] [CrossRef]
- Saravanabhavan, G.; Werry, K.; Walker, M.; Haines, D.; Malowany, M.; Khoury, C. Human Biomonitoring Reference Values for Metals and Trace Elements in Blood and Urine Derived from the Canadian Health Measures Survey 2007–2013. Int. J. Hyg. Environ. Health 2017, 220, 189–200. [Google Scholar] [CrossRef] [PubMed]
- France Štiglic, A.; Falnoga, I.; Briški, A.S.; Žavbi, M.; Osredkar, J.; Skitek, M.; Marc, J. Reference Intervals of 24 Trace Elements in Blood, Plasma and Erythrocytes for the Slovenian Adult Population. Clin. Chem. Lab. Med. (CCLM) 2024, 62, 946–957. [Google Scholar] [CrossRef]
- Bizoń, A.; Tchórz, A.; Madej, P.; Leśniewski, M.; Wójtowicz, M.; Piwowar, A.; Franik, G. The Activity of Superoxide Dismutase, Its Relationship with the Concentration of Zinc and Copper and the Prevalence of Rs2070424 Superoxide Dismutase Gene in Women with Polycystic Ovary Syndrome—Preliminary Study. J. Clin. Med. 2022, 11, 2548. [Google Scholar] [CrossRef]
- Kanafchian, M.; Esmaeilzadeh, S.; Mahjoub, S.; Rahsepar, M.; Ghasemi, M. Status of Serum Copper, Magnesium, and Total Antioxidant Capacity in Patients with Polycystic Ovary Syndrome. Biol. Trace Elem. Res. 2020, 193, 111–117. [Google Scholar] [CrossRef] [PubMed]
- Pokorska-Niewiada, K.; Brodowska, A.; Brodowski, J.; Szczuko, M. Levels of Trace Elements in Erythrocytes as Endocrine Disruptors in Obese and Nonobese Women with Polycystic Ovary Syndrome. Int. J. Environ. Res. Public Health 2022, 19, 976. [Google Scholar] [CrossRef] [PubMed]
- Sun, Y.; Wang, W.; Guo, Y.; Zheng, B.; Li, H.; Chen, J.; Zhang, W. High Copper Levels in Follicular Fluid Affect Follicle Development in Polycystic Ovary Syndrome Patients: Population-Based and in Vitro Studies. Toxicol. Appl. Pharmacol. 2019, 365, 101–111. [Google Scholar] [CrossRef]
- Chen, L.; Min, J.; Wang, F. Copper Homeostasis and Cuproptosis in Health and Disease. Sig. Transduct. Target. Ther. 2022, 7, 378. [Google Scholar] [CrossRef] [PubMed]
- Barceloux, D.G.; Barceloux, D. Copper. J. Toxicol. Clin. Toxicol. 1999, 37, 217–230. [Google Scholar] [CrossRef] [PubMed]
- Prohaska, J.R. Impact of Copper Deficiency in Humans. Ann. N. Y. Acad. Sci. 2014, 1314, 1–5. [Google Scholar] [CrossRef]
- Xiao, L.; Yang, C.; Gu, W.; Liu, R.; Chen, D. Associations between Serum Copper, Zinc, Selenium Level and Sex Hormones among 6–19 Years Old Children and Adolescents in NHANES 2013–2016. Front. Endocrinol. 2022, 13, 924338. [Google Scholar] [CrossRef]
- Yuan, Y.; Peng, T.-Y.; Yu, G.-Y.; Zou, Z.; Wu, M.-Z.; Zhu, R.; Wu, S.; Lv, Z.; Luo, S.-X. Association between Serum Copper Level and Reproductive Health of Women in the United States: A Cross-Sectional Study. Int. J. Environ. Health Res. 2024, 34, 2441–2450. [Google Scholar] [CrossRef] [PubMed]
- Morrell, A.; Tallino, S.; Yu, L.; Burkhead, J.L. The Role of Insufficient Copper in Lipid Synthesis and Fatty-liver Disease. IUBMB Life 2017, 69, 263–270. [Google Scholar] [CrossRef]
- Blades, B.; Ayton, S.; Hung, Y.H.; Bush, A.I.; La Fontaine, S. Copper and Lipid Metabolism: A Reciprocal Relationship. Biochim. Biophys. Acta (BBA)-Gen. Subj. 2021, 1865, 129979. [Google Scholar] [CrossRef] [PubMed]
- Tsai, H.-J.; Hung, C.-H.; Wang, C.-W.; Tu, H.-P.; Li, C.-H.; Tsai, C.-C.; Lin, W.-Y.; Chen, S.-C.; Kuo, C.-H. Associations among Heavy Metals and Proteinuria and Chronic Kidney Disease. Diagnostics 2021, 11, 282. [Google Scholar] [CrossRef] [PubMed]
- Jiang, C.; Ye, H.; Cui, L.; Pai, P.; Wang, G. Relationship of Serum Copper and Zinc with Kidney Function and Urinary Albumin to Creatinine Ratio: Cross-Sectional Data from the NHANES 2011–2016. Eur. J. Clin. Nutr. 2022, 76, 1748–1754. [Google Scholar] [CrossRef]
- Hamasaki, H.; Kawashima, Y.; Yanai, H. Serum Zn/Cu Ratio Is Associated with Renal Function, Glycemic Control, and Metabolic Parameters in Japanese Patients with and without Type 2 Diabetes: A Cross-Sectional Study. Front. Endocrinol. 2016, 7, 147. [Google Scholar] [CrossRef] [PubMed]
- Toxicological Profile for Molybdenum; Agency for Toxic Substances and Disease Registry (ATSDR) Toxicological Profiles; Agency for Toxic Substances and Disease Registry (US): Atlanta, GA, USA, 2020.
- Adamus, J.P.; Ruszczyńska, A.; Wyczałkowska-Tomasik, A. Molybdenum’s Role as an Essential Element in Enzymes Catabolizing Redox Reactions: A Review. Biomolecules 2024, 14, 869. [Google Scholar] [CrossRef] [PubMed]
- Huang, J.; Zheng, W.; Wang, A.; Han, W.; Chen, J.; An, H.; Yan, L.; Li, Z.; Li, G. Molybdenum Concentration and the Risk of Spontaneous Preterm Birth: A Nested Case-Control Study—Beijing Municipality, China, 2018–2020. China CDC Wkly. 2024, 6, 261–266. [Google Scholar] [CrossRef] [PubMed]
- Rixen, S.; Indorf, P.M.; Kubitza, C.; Struwe, M.A.; Klopp, C.; Scheidig, A.J.; Kunze, T.; Clement, B. Reduction of Hydrogen Peroxide by Human Mitochondrial Amidoxime Reducing Component Enzymes. Molecules 2023, 28, 6384. [Google Scholar] [CrossRef] [PubMed]
- Clement, B.; Struwe, M. The History of mARC. Molecules 2023, 28, 4713. [Google Scholar] [CrossRef]
- Crinnion, W.J. The CDC Fourth National Report on Human Exposure to Environmental Chemicals: What It Tells Us about Our Toxic Burden and How It Assist Environmental Medicine Physicians. Altern. Med. Rev. 2010, 15, 101–109. [Google Scholar] [PubMed]
- Coelho, F.C.; Cerchiaro, G.; Araújo, S.E.S.; Daher, J.P.L.; Cardoso, S.A.; Coelho, G.F.; Guimarães, A.G. Is There a Connection between the Metabolism of Copper, Sulfur, and Molybdenum in Alzheimer’s Disease? New Insights on Disease Etiology. Int. J. Mol. Sci. 2022, 23, 7935. [Google Scholar] [CrossRef]
- Murray, F.J.; Sullivan, F.M.; Tiwary, A.K.; Carey, S. 90-Day Subchronic Toxicity Study of Sodium Molybdate Dihydrate in Rats. Regul. Toxicol. Pharmacol. 2014, 70, 579–588. [Google Scholar] [CrossRef] [PubMed]
- Murray, F.J.; Sullivan, F.M.; Hubbard, S.A.; Hoberman, A.M.; Carey, S. A Two-Generation Reproductive Toxicity Study of Sodium Molybdate Dihydrate Administered in Drinking Water or Diet to Sprague-Dawley Rats. Reprod. Toxicol. 2019, 84, 75–92. [Google Scholar] [CrossRef]
- Murray, F.J.; Aveyard, L.; Hubbard, S.A.; Hoberman, A.M.; Carey, S. Sodium Molybdate Dihydrate Does Not Exhibit Developmental or Reproductive Toxicity in Sprague-Dawley Rats Maintained on a Marginal Copper Diet. Reprod. Toxicol. 2023, 120, 108442. [Google Scholar] [CrossRef]
- Fungwe, T.V.; Buddingh, F.; Demick, D.S.; Lox, C.D.; Yang, M.T.; Yang, S.P. The Role of Dietary Molybdenum on Estrous Activity, Fertility, Reproduction and Molybdenum and Copper Enzyme Activities of Female Rats. Nutr. Res. 1990, 10, 515–524. [Google Scholar] [CrossRef]
- Cao, H.; Xia, B.; Zhang, M.; Liao, Y.; Yang, Z.; Hu, G.; Zhang, C. Changes of Antioxidant Function and the mRNA Expression Levels of Apoptosis Genes in Duck Ovaries Caused by Molybdenum or/and Cadmium. Biol. Trace Elem. Res. 2016, 171, 410–418. [Google Scholar] [CrossRef] [PubMed]
- Cui, T.; Dai, X.; Guo, H.; Wang, D.; Huang, B.; Pu, W.; Chu, X.; Zhang, C. Molybdenum and Cadmium Co-Induce Necroptosis through Th1/Th2 Imbalance-Mediated Endoplasmic Reticulum Stress in Duck Ovaries. J. Environ. Sci. 2024, 142, 92–102. [Google Scholar] [CrossRef] [PubMed]
- Wang, D.; Zhang, C.; Guo, H.; Cui, T.; Pu, W.; Huang, B.; Zhu, J.; Dai, X. Co-Exposure to Environmentally Relevant Levels of Molybdenum and Cadmium Induces Oxidative Stress and Ferroptosis in the Ovary of Ducks. Biol. Trace Elem. Res. 2025, 203, 374–383. [Google Scholar] [CrossRef]
- Haywood, S.; Dincer, Z.; Holding, J.; Parry, N.M. Metal (Molybdenum, Copper) Accumulation and Retention in Brain, Pituitary and Other Organs of Ammonium Tetrathiomolybdate-Treated Sheep. Br. J. Nutr. 1998, 79, 329–331. [Google Scholar] [CrossRef]
- Haywood, S.; Dincer, Z.; Jasani, B.; Loughran, M.J. Molybdenum-Associated Pituitary Endocrinopathy in Sheep Treated with Ammonium Tetrathiomolybdate. J. Comp. Pathol. 2004, 130, 21–31. [Google Scholar] [CrossRef] [PubMed]
- Moffor, F.M.; Rodway, R.G. The Effect of Tetrathiomolybdate on Growth Rate and Onset of Puberty in Ewe-Lambs. Br. Vet. J. 1991, 147, 421–431. [Google Scholar] [CrossRef] [PubMed]
- Xin, Z.; Silvia, W.J.; Waterman, D.F.; Hemken, R.W.; Tucker, W.B. Effect of Copper Status on Luteinizing Hormone Secretion in Dairy Steers. J. Dairy Sci. 1993, 76, 437–444. [Google Scholar] [CrossRef]
- Kendall, N.R.; Marsters, P.; Guo, L.; Scaramuzzi, R.J.; Campbell, B.K. Effect of Copper and Thiomolybdates on Bovine Theca Cell Differentiation in Vitro. J. Endocrinol. 2006, 189, 455–463. [Google Scholar] [CrossRef]
- Shyamala, G.; Leonard, L. Inhibition of Uterine Estrogen Receptor Transformation by Sodium Molybdate. J. Biol. Chem. 1980, 255, 6028–6031. [Google Scholar] [CrossRef]
- Roychoudhury, S.; Detvanova, L.; Sirotkin, A.V.; Toman, R.; Kolesarova, A. In Vitro Changes in Secretion Activity of Rat Ovarian Fragments Induced by Molybdenum. Physiol. Res. 2014, 63, 807–809. [Google Scholar] [CrossRef]
- Bandyopadhyay, S.K.; Chatterjee, K.; Tiwari, R.K.; Mitra, A.; Banerjee, A.; Ghosh, K.K.; Chatterjee, G.C. Biochemical Studies on Molybdenum Toxicity in Rats: Effects of High Protein Feeding. Int. J. Vitam. Nutr. Res. 1981, 51, 401–409. [Google Scholar]
- Meeker, J.D.; Rossano, M.G.; Protas, B.; Padmanahban, V.; Diamond, M.P.; Puscheck, E.; Daly, D.; Paneth, N.; Wirth, J.J. Environmental Exposure to Metals and Male Reproductive Hormones: Circulating Testosterone Is Inversely Associated with Blood Molybdenum. Fertil. Steril. 2010, 93, 130–140. [Google Scholar] [CrossRef] [PubMed]
- Wang, Y.-X.; Sun, Y.; Huang, Z.; Wang, P.; Feng, W.; Li, J.; Yang, P.; Wang, M.; Sun, L.; Chen, Y.-J.; et al. Associations of Urinary Metal Levels with Serum Hormones, Spermatozoa Apoptosis and Sperm DNA Damage in a Chinese Population. Environ. Int. 2016, 94, 177–188. [Google Scholar] [CrossRef] [PubMed]
- Liu, F.-J.; Dong, W.-Y.; Zhao, H.; Shi, X.-H.; Zhang, Y.-L. Effect of Molybdenum on Reproductive Function of Male Mice Treated with Busulfan. Theriogenology 2019, 126, 49–54. [Google Scholar] [CrossRef] [PubMed]
- Zhang, Y.-L.; Liu, F.-J.; Chen, X.-L.; Zhang, Z.-Q.; Shu, R.-Z.; Yu, X.-L.; Zhai, X.-W.; Jin, L.-J.; Ma, X.-G.; Qi, Q.; et al. Dual Effects of Molybdenum on Mouse Oocyte Quality and Ovarian Oxidative Stress. Syst. Biol. Reprod. Med. 2013, 59, 312–318. [Google Scholar] [CrossRef]
- Li, X.; Dehghan, M.; Tse, L.A.; Lang, X.; Rangarajan, S.; Liu, W.; Hu, B.; Yusuf, S.; Wang, C.; Li, W. Associations of Dietary Copper Intake with Cardiovascular Disease and Mortality: Findings from the Chinese Perspective Urban and Rural Epidemiology (PURE-China) Study. BMC Public Health 2023, 23, 2525. [Google Scholar] [CrossRef] [PubMed]
- Zhuang, J.; Nie, G.; Hu, R.; Wang, C.; Xing, C.; Li, G.; Hu, G.; Yang, F.; Zhang, C. Inhibition of Autophagy Aggravates Molybdenum-Induced Mitochondrial Dysfunction by Aggravating Oxidative Stress in Duck Renal Tubular Epithelial Cells. Ecotoxicol. Environ. Saf. 2021, 209, 111771. [Google Scholar] [CrossRef]
- Shi, L.; Cao, H.; Luo, J.; Liu, P.; Wang, T.; Hu, G.; Zhang, C. Effects of Molybdenum and Cadmium on the Oxidative Damage and Kidney Apoptosis in Duck. Ecotoxicol. Environ. Saf. 2017, 145, 24–31. [Google Scholar] [CrossRef]
- Pu, W.; Chu, X.; Xu, S.; Dai, X.; Xiao, L.; Cui, T.; Huang, B.; Hu, G.; Zhang, C. Molybdenum Exposure Induces Inflammatory Response via the Regulatory Effects of lncRNA-00072124/miR-308/OSMR Crosstalk on JAK/STAT Axis in Duck Kidneys. Sci. Total Environ. 2024, 912, 169374. [Google Scholar] [CrossRef] [PubMed]
- Wu, Y.; Yang, F.; Zhou, G.; Wang, Q.; Xing, C.; Bai, H.; Yi, X.; Xiong, Z.; Yang, S.; Cao, H. Molybdenum and Cadmium Co-Induce Mitochondrial Quality Control Disorder via FUNDC1-Mediated Mitophagy in Sheep Kidney. Front. Vet. Sci. 2022, 9, 842259. [Google Scholar] [CrossRef] [PubMed]
- Kuang, H.-X.; Li, M.-Y.; Zeng, X.-W.; Chen, D.; Zhou, Y.; Zheng, T.; Xiang, M.-D.; Wu, Q.-Z.; Chen, X.-C.; Dong, G.-H.; et al. Human Molybdenum Exposure Risk in Industrial Regions of China: New Critical Effect Indicators and Reference Dose. Ecotoxicol. Environ. Saf. 2024, 278, 116400. [Google Scholar] [CrossRef]
- Liu, Y.; Yuan, Y.; Xiao, Y.; Li, Y.; Yu, Y.; Mo, T.; Jiang, H.; Li, X.; Yang, H.; Xu, C.; et al. Associations of Plasma Metal Concentrations with the Decline in Kidney Function: A Longitudinal Study of Chinese Adults. Ecotoxicol. Environ. Saf. 2020, 189, 110006. [Google Scholar] [CrossRef] [PubMed]
- Yang, F.; Yi, X.; Guo, J.; Xu, S.; Xiao, Y.; Huang, X.; Duan, Y.; Luo, D.; Xiao, S.; Huang, Z.; et al. Association of Plasma and Urine Metals Levels with Kidney Function: A Population-Based Cross-Sectional Study in China. Chemosphere 2019, 226, 321–328. [Google Scholar] [CrossRef] [PubMed]
- Yang, G.; Belostotsky, V.; Kobrzynski, M.; Huang, S.-H.S.; Yang, L. High Prevalence of Elevated Molybdenum Levels in Pediatric CKD Patients. A Cross-Sectional and Longitudinal Study. Clin. Nephrol. 2017, 88, 79–85. [Google Scholar] [CrossRef] [PubMed]
- Ortega-Romero, M.; Rojas-Lima, E.; Rubio-Gutiérrez, J.C.; Aztatzi-Aguilar, O.G.; Narváez-Morales, J.; Esparza-García, M.; Barrera-Hernández, Á.; Mejia, M.Á.; Mendez-Hernández, P.; Medeiros, M.; et al. Associations among Environmental Exposure to Trace Elements and Biomarkers of Early Kidney Damage in the Pediatric Population. Biometals 2024, 37, 721–737. [Google Scholar] [CrossRef]
- Griffin, B.R.; Faubel, S.; Edelstein, C.L. Biomarkers of Drug-Induced Kidney Toxicity. Ther. Drug Monit. 2019, 41, 213–226. [Google Scholar] [CrossRef] [PubMed]
- Joun, J.H.; Li, L.; An, J.N.; Jang, J.; Oh, Y.K.; Lim, C.S.; Kim, Y.S.; Choi, K.; Lee, J.P.; Lee, J. Antioxidative Effects of Molybdenum and Its Association with Reduced Prevalence of Hyperuricemia in the Adult Population. PLoS ONE 2024, 19, e0306025. [Google Scholar] [CrossRef] [PubMed]
- Bourke, C.A. Astrocyte Dysfunction Following Molybdenum-Associated Purine Loading Could Initiate Parkinson’s Disease with Dementia. NPJ Park. Dis. 2018, 4, 7. [Google Scholar] [CrossRef]
- Walravens, P.A.; Moure-Eraso, R.; Solomons, C.C.; Chappell, W.R.; Bentley, G. Biochemical Abnormalities in Workers Exposed to Molybdenum Dust. Arch. Environ. Health Int. J. 1979, 34, 302–308. [Google Scholar] [CrossRef]
- Juraschek, S.P.; Miller, E.R.; Gelber, A.C. Effect of Oral Vitamin C Supplementation on Serum Uric Acid: A Meta-analysis of Randomized Controlled Trials. Arthritis Care Res. 2011, 63, 1295–1306. [Google Scholar] [CrossRef]
- Wang, J.; Yang, Z.; Celi, P.; Yan, L.; Ding, X.; Bai, S.; Zeng, Q.; Mao, X.; Feng, B.; Xu, S.; et al. Alteration of the Antioxidant Capacity and Gut Microbiota under High Levels of Molybdenum and Green Tea Polyphenols in Laying Hens. Antioxidants 2019, 8, 503. [Google Scholar] [CrossRef]
- Zhuang, Y.; Liu, P.; Wang, L.; Luo, J.; Zhang, C.; Guo, X.; Hu, G.; Cao, H. Mitochondrial Oxidative Stress-Induced Hepatocyte Apoptosis Reflects Increased Molybdenum Intake in Caprine. Biol. Trace Elem. Res. 2016, 170, 106–114. [Google Scholar] [CrossRef] [PubMed]
- Sachdeva, S.; Maret, W. Comparative Outcomes of Exposing Human Liver and Kidney Cell Lines to Tungstate and Molybdate. Toxicol. Mech. Methods 2021, 31, 690–698. [Google Scholar] [CrossRef]
- Ge, X.; Liu, Z.; Hou, Q.; Huang, L.; Zhou, Y.; Li, D.; Huang, S.; Luo, X.; Lv, Y.; Li, L.; et al. Plasma Metals and Serum Bilirubin Levels in Workers from Manganese-Exposed Workers Healthy Cohort (MEWHC). Environ. Pollut. 2020, 258, 113683. [Google Scholar] [CrossRef] [PubMed]
- Cheng, P.; Tao, Y.; Hu, J.; Wang, H.; Zhao, R.; Mei, S.; Yang, Y.; Ye, F.; Chen, Z.; Ding, H.; et al. Relationship of Individual and Mixed Urinary Metals Exposure with Liver Function in the China National Human Biomonitoring (CNHBM) of Zhejiang Province. Chemosphere 2023, 342, 140050. [Google Scholar] [CrossRef]
- Stocker, R.; Yamamoto, Y.; McDonagh, A.F.; Glazer, A.N.; Ames, B.N. Bilirubin Is an Antioxidant of Possible Physiological Importance. Science 1987, 235, 1043–1046. [Google Scholar] [CrossRef]
- Hinds, T.D.; Stec, D.E. Bilirubin, a Cardiometabolic Signaling Molecule. Hypertension 2018, 72, 788–795. [Google Scholar] [CrossRef]

| PCOS Group (n = 35) | Control Group (n= 35) | p-Value | ||
|---|---|---|---|---|
| Region of residence (%) | Osrednjeslovenska | 82.9 | 77.1 | 0.630 |
| Gorenjska | 0 | 2.9 | ||
| Goriška | 2.9 | 0 | ||
| Jugovzhodna Slovenija | 0 | 2.9 | ||
| Obalno-Kraška | 2.9 | 2.9 | ||
| Podravska | 8.6 | 2.9 | ||
| Pomurska | 2.9 | 2.9 | ||
| Posavska | 0 | 2.9 | ||
| Primorsko-Notranjska | 0 | 2.9 | ||
| Savinjska | 0 | 2.9 | ||
| Region of birth (%) | Osrednjeslovenska | 54.3 | 62.9 | 0.804 |
| Gorenjska | 5.7 | 8.6 | ||
| Goriška | 2.9 | 2.9 | ||
| Jugovzhodna Slovenija | 2.9 | 5.7 | ||
| Koroška | 2.9 | 0 | ||
| Obalno-Kraška | 2.9 | 2.9 | ||
| Podravska | 11.4 | 5.7 | ||
| Pomurska | 2.9 | 0 | ||
| Posavska | 0 | 2.9 | ||
| Primorsko-Notranjska | 0 | 2.9 | ||
| Foreign country | 14.3 | 5.8 | ||
| Level of education (%) | Primary school education | 2.9 | 0 | 0.528 |
| Secondary school education | 28.6 | 22.9 | ||
| Tertiary education | 5.7 | 0 | ||
| Bachelor’s degree | 31.4 | 45.7 | ||
| Master’s degree | 28.6 | 28.6 | ||
| Doctorate | 2.9 | 2.9 | ||
| Profession (%) | Lead position | 0 | 2.9 | 0.109 |
| Expert/specialist | 32.4 | 44.1 | ||
| Technical job | 11.8 | 14.7 | ||
| Administrative job | 20.6 | 5.9 | ||
| Service sector | 32.4 | 20.6 | ||
| Agricultural sector | 2.9 | 0 | ||
| Ergonomically demanding | 0 | 11.8 | ||
| Employment status (%) | Employed | 68.6 | 62.9 | 0.519 |
| Unemployed | 2.9 | 0 | ||
| Student | 28.6 | 34.3 | ||
| Other | 0 | 2.9 | ||
| Current workplace (%) | Lead position | 0 | 3.1 | 0.180 |
| Expert/specialist | 32.4 | 28.1 | ||
| Technical job | 11.8 | 9.4 | ||
| Administrative job | 20.6 | 43.8 | ||
| Service sector | 32.4 | 12.5 | ||
| Agricultural sector | 2.9 | 0 | ||
| Oher | 0 | 3.1 | ||
| Vicinity of manufacturing industry (%) | Yes | 14.3 | 23.5 | 0.251 |
| No | 85.7 | 76.5 | ||
| Vicinity of waste disposal site (%) | Yes | 17.1 | 14.3 | 0.500 |
| No | 82.9 | 85.7 | ||
| Home surroundings, agriculture (%) | Yes | 34.3 | 29.4 | 0.430 |
| No | 65.7 | 70.6 | ||
| Home surroundings, vegetable plots (%) | Yes | 60.0 | 61.8 | 0.538 |
| No | 40 | 38.2 | ||
| Home surroundings, fruit farming (%) | Yes | 5.7 | 8.8 | 0.486 |
| No | 94.3 | 91.2 | ||
| Environmental issue in the neighbourhood (%) | Yes | 20.0 | 23.5 | 0.474 |
| No | 80.0 | 76.5 | ||
| Metal implants, dental appliances (%) | Yes | 25.7 | 40.0 | 0.154 |
| No | 74.3 | 60.0 | ||
| Smoking status (%) | Smoker | 20.0 | 23.5 | 0.474 |
| Former smoker | 3.6 | 21.7 | 0.058 | |
| Non-smoker, exposed to tobacco | 35.7 | 38.5 | 0.529 | |
| Coffee consumption (%) | Yes | 65.7 | 74.3 | 0.301 |
| No | 34.3 | 25.7 | ||
| Alcohol consumption (%) | Never | 14.3 | 5.7 | 0.472 |
| Occasionally | 77.1 | 82.9 | ||
| On regular basis | 8.6 | 11.4 | ||
| Clinical Feature (Mean ± SD) | PCOS Group (n = 35) | Control Group (n = 35) | p-Value |
|---|---|---|---|
| WC (cm) | 15.3 ± 1.0 * | 14.7 ± 0.79 ** | 0.027 |
| BMI (kg/m2) | 23.1 ± 2.79 | 21.3 ± 1.83 | 0.004 |
| Menstrual cycle length (days) | 45.3 ± 28.4 | 28.2 ± 1.56 | <0.001 |
| Endometrium thickness (mm) | 5.57 ± 2.37 | 7.60 ± 2.96 | 0.004 |
| AFC (average) | 24.5 ± 10.2 | 10.1 ± 3.91 | <0.001 |
| Average OV (cm3) | 10.1 ± 4.58 | 5.33 ± 1.70 | <0.001 |
| FSH (IU/L) | 5.79 ± 2.08 | 7.58 ± 2.42 | 0.007 |
| P (nmol/L) | 6.01 ± 12.1 | 1.84 ± 0.87 | 0.018 |
| TT (nmol/L) | 1.31 ± 0.53 | 1.02 ± 0.29 | 0.006 |
| FAI (%) | 2.45 ± 1.37 | 1.50 ± 0.62 | <0.001 |
| A (nmol/L) | 14.7 ± 6.50 | 10.3 ± 3.79 | 0.002 |
| L (109/L) | 6.00 ± 1.34 | 5.45 ± 1.16 | 0.048 |
| Biomarker (ng/g) | PCOS Group (n = 35) | Control Group (n = 35) | p-Value (SG-Norm) | Reference Value (ng/g) [38,44] | ||
|---|---|---|---|---|---|---|
| GM (Min–Max); ORV (%) | SG-norm (Min–Max) | GM (Min–Max); ORV (%) | SG-norm (Min–Max) | |||
| Mn | 0.24 (<0.4 *–0.51) | 0.24 (<0.4 *–0.50) | 0.26 (<0.4 *–1.55) | 0.26 (<0.4 *–0.54) | 1.000 (0.599) | NA |
| Cu | 11.1 (3.3–23.4); 0.00 | 11.0 (3.32–23.0) | 11.2 (1.99–22.8); 0.00 | 11.1 (2.01–22.5) | 0.542 (0.526) | 1.48–29.6 |
| Zn | 372 (82–1787); 5.71 | 370 (81–1766) | 425 (<40 *–1863); 14.3 | 421 (<40 *–1850) | 0.470 (0.481) | 49.4–1085 |
| As | 11.2 (2.59–155); 20.0 | 9.76 (0.64–140) | 11.2 (2.59–154); 8.57 | 9.69 (0.64–138) | 0.921 (0.902) | 29.6 |
| Se | 31.2 (6.9–62.7); 34.3 | 31.1 (6.90–61.7) | 34.5 (3.7–92.0); 45.7 | 34.2 (3.80–90.4) | 0.112 (0.113) | 1.97–39.4 |
| Mo | 47.7 (13.2–136); 0.00 | 47.5 (13.2–135) | 63.8 (5.02–349); 5.71 | 63.3 (4.99–345) | 0.050 (0.052) | 168 |
| Cd | 0.30 (0.08–1.34); 2.86 | 0.30 (0.08–1.33) | 0.33 (0.10–1.28); 11.4 | 0.32 (0.10–1.26) | 0.664 (0.720) | 0.69 |
| Hg | 0.84 (0.28–4.79); 5.71 | 0.84 (0.28–4.75) | 0.74 (0.11–3.36); 0.00 | 0.73 (0.11–3.32) | 0.769 (0.774) | 3.95 |
| Pb | 0.57 (0.16–1.51); 11.4 | 0.57 (0.16–1.50) | 0.51 (0.04–2.26); 14.3 | 0.51 (0.04–2.25) | 0.700 (0.698) | 1.09 |
| Biomarker (µg/L) | PCOS Group (n = 35) | Control Group (n = 35) | p-Value | Reference Interval (µg/L) a |
|---|---|---|---|---|
| Whole blood | ||||
| GM (min–max); ORV (%) | GM (min–max); ORV (%) | |||
| Mn | 8.41 (5.49–16.9); 0.00 | 8.59 (4.64–22.7); 2.86 | 0.720 | 4.0–19.0 |
| Cu | 867 (746–1160); 0.00 | 853 (673–1698); 2.86 | 0.382 | 550–1450 |
| Zn | 4683 (3546–6388); 26.0 | 4585 (3851–5625); 29.0 | 0.557 | 4000–7000 |
| As | 1.09 (0.43–8.26); 5.71 | 0.91 (0.33–33.9); 5.71 | 0.162 | 3.5 |
| Se | 156 (122–345); 11.4 | 154 (114–207); 14.3 | 0.760 | 80–170 |
| Mo | 0.60 (0.24–1.86); 2.90 | 0.71 (0.14–1.58); 2.90 | 0.024 * | <0.19–1.50 |
| Cd | 0.34 (0.11–1.64); 0.00 | 0.37 (0.13–3.81); 2.86 | 0.716 | 3.5 |
| Hg | 1.30 (0.51–6.58); 2.86 | 1.26 (0.12–11.1); 8.57 | 0.690 | 5.2 |
| Pb | 8.82 (4.45–17.9); 0.00 | 7.77 (3.18–21); 0.00 | 0.081 | 40.0 |
| Serum | ||||
| Mn | 0.55 (<0.31 #–2.39); 34.3 | 0.47 (<0.31 #–2.35); 48.6 | 0.180 | <0.40–1.00 |
| Cu | 1028 (747–1443); 0.00 | 940 (751–1200); 0.00 | 0.026 * | 600–1900 |
| Zn | 925 (688–1356); 2.86 | 877 (659–1600); 2.86 | 0.222 | 580–1350 |
| As | 0.45 (0.15–4.01); 14.3 | 0.36 (0.11–8.57); 5.71 | 0.137 | 1.4 |
| Se | 105 (85–138); 11.4 | 103 (83–125); 8.57 | 0.796 | 62–115 |
| Mo | 0.85 (0.31–2.35); 5.71 | 1.00 (0.17–2.57); 5.71 | 0.011 * | 0.45–2.00 |
| Cd | 0.03 (<0.02 #–0.31); 0.00 | 0.02 (<0.02 #–0.44); 0.00 | 0.127 | 0.70 |
| Hg | 0.48 (0.15–1.88); 0.00 | 0.49 (0.14–3.20); 0.00 | 0.967 | 4.00 |
| Pb | 0.17 (<0.09 #–2.12); 5.71 | 0.15 (0.05–2.17); 2.86 | 0.441 | 0.85 |
| Mo-SG | Mo-WB | Cu-S | Mo-S | |||||
|---|---|---|---|---|---|---|---|---|
| r (p) | ||||||||
| PCOS | Control | PCOS | Control | PCOS | Control | PCOS | Control | |
| Consumption of other types of dietary supplements | −0.57 (0.020) * | 0.18 (0.467) | −0.08 (0.762) | 0.02 (0.948) | −0.369 (0.160) | −0.49 (0.039) * | −0.29 (0.281) | −0.09 (0.725) |
| Consumption of cereals | 0.18 (0.303) | 0.59 (<0.001) * | −0.03 (0.888) | 0.61 (<0.001) * | −0.02 (0.889) | 0.09 (0.624) | −0.02 (0.908) | 0.48 (0.004) * |
| Consumption of pasta dishes | 0.12 (0.505) | −0.02 (0.903) | 0.14 (0.435) | −0.27 (0.110) | 0.05 (0.771) | −0.35 (0.037) * | 0.12 (0.474) | −0.24 (0.158) |
| Beef consumption | 0.05 (0.782) | −0.14 (0.395) | 0 (1) | −0.16 (0.350) | 0.36 (0.032) * | 0.08 (0.656) | 0.16 (0.329) | −0.10 (0.571) |
| Canned fish consumption | 0.02 (0.919) | 0.16 (0.351) | −0.15 (0.386) | 0.28 (0.099) | 0.01 (0.959) | −0.13 (0.441) | −0.08 (0.611) | 0.39 (0.019) * |
| Fresh vegetable consumption | 0.21 (0.218) | 0.42 (0.012) * | 0.30 (0.071) | 0.29 (0.093) | 0.07 (0.709) | 0.06 (0.719) | 0.31 (0.066) | 0.24 (0.160) |
| Boiled vegetable consumption | 0.12 (0.493) | 0.48 (0.003) * | 0.11 (0.499) | 0.40 (0.018) * | 0.04 (0.804) | 0.32 (0.055) | 0.23 (0.166) | 0.37 (0.029) * |
| Processed fruit consumption | 0.26 (0.127) | 0.13 (0.454) | −0.14 (0.409) | 0.14 (0.418) | −0.16 (0.332) | −0.38 (0.024) * | −0.05 (0.748) | −0.05 (0.747) |
| Pickled vegetable consumption | −0.25 (0.13) | 0.11 (0.496) | −0.28 (0.097) | 0.01 (0.946) | 0.09 (0.576) | −0.16 (0.336) | −0.36 (0.031) * | −0.04 (0.813) |
| Processed vegetable consumption | −0.40 (0.016) * | −0.14 (0.439) | −0.12 (0.488) | −0.14 (0.414) | 0.04 (0.818) | −0.21 (0.209) | −0.40 (0.016) * | −0.15 (0.366) |
| Farinaceous food consumption | −0.06 (0.722) | 0.51 (0.002) * | −0.22 (0.199) | 0.11 (0.512) | 0.13 (0.445) | 0.04 (0.776) | −0.20 (0.260) | 0.12 (0.480) |
| Tap water consumption | −0.14 (0.436) | 0.17 (0.316) | 0.20 (0.240) | 0.28 (0.100) | −0.15 (0.381) | 0.38 (0.026) * | 0.10 (0.560) | 0.30 (0.076) |
| Fruit juice consumption | −0.13 (0.450) | −0.25 (0.152) | −0.16 (0.332) | −0.43 (0.009) * | 0.10 (0.548) | −0.28 (0.098) | −0.18 (0.312) | −0.55 (0.001) * |
| Black tea consumption | 0.04 (0.797) | 0.37 (0.029) * | 0.02 (0.913) | 0.05 (0.787) | −0.15 (0.360) | −0.21 (0.230) | 0.02 (0.865) | 0.09 (0.632) |
| Estimate of Change (95% CI) | ||||
|---|---|---|---|---|
| Total Population (n = 70) | PCOS Group (n = 35) | Control Group (n = 35) | ||
| Dietary Habits | ||||
| Mo-SG (ng/g) | ||||
| Consumption of other types of DSd a,b | Once/month | - | - | - |
| At least once/week | 1.16 (0.92–1.46) | 0.08 (0.57–1.14) | 1.42 (1.05–1.93) * | |
| BMI adjustment | 1.09 (0.86–1.39) | 1.14 (0.82–1.60) | 1.18 (0.86–1.61) | |
| Age adjustment | 0.81 (0.65–1.03) | 0.96 (0.68–1.36) | 0.76 (0.55–1.03) | |
| Consumption of cereals | Once/week | - | - | - |
| 2–6x/week | 1.36 (1.11–1.66) * | 1.24 (0.86–1.79) | 1.43 (1.11–1.85) * | |
| Every day | 1.68 (1.39–2.02) * | 1.23 (0.87–1.75) | 2.07 (1.68–2.56) * | |
| BMI adjustment | 1.15 (0.94–1.41) * | 1.16 (0.82–1.63) | 1.14 (0.90–1.46) * | |
| Age adjustment | 0.80 (0.66–0.97) * | 0.86 (0.61–1.20) | 0.79 (0.62–1.00) * | |
| Consumption of boiled vegetables | Once/week | - | - | - |
| 2–6x/week | 1.30 (1.00–1.67) * | 1.36 (0.92–2.01) | 1.37 (0.99–1.90) | |
| Every day | 1.51 (1.18–1.92) * | 1.15 (0.77–1.70) | 2.12 (1.58–2.86) * | |
| BMI adjustment | 1.08 (0.86–1.35) | 1.10 (0.79–1.53) | 0.90 (0.67–1.20) | |
| Age adjustment | 0.83 (0.67–1.03) | 0.85 (0.61–1.19) | 0.81 (0.62–1.05) | |
| Mo-WB (ng/g) | ||||
| Consumption of cereals | Once/week | - | - | - |
| 2–6x/week | 1.36 (1.08–1.71) * | 1.17 (0.80–1.70) | 1.66 (1.26–2.18) * | |
| Every day | 1.32 (1.05–1.65) * | 0.94 (0.66–1.36) | 1.80 (1.40–2.32) * | |
| BMI adjustment | 0.99 (0.79–1.26) | 1.06 (0.74–1.50) | 0.86 (0.66–1.13) | |
| Age adjustment | 0.92 (0.74–1.15) | 0.98 (0.70–1.39) | 0.90 (0.69–1.17) | |
| Consumption of boiled vegetables | Once/week | - | - | - |
| 2–6x/week | 1.27 (0.96–1.67) | 1.04 (0.68–1.59) | 1.60 (1.13–2.26) * | |
| Every day | 1.30 (1.00–1.71) | 1.08 (0.71–1.63) | 1.84 (1.29–2.62) * | |
| BMI adjustment | 0.95 (0.75–1.21) | 1.02 (0.72–1.44) | 0.78 (0.56–1.07) | |
| Age adjustment | 0.94 (0.75–1.19) | 1.00 (0.70–1.42) | 0.92 (0.68–1.23) | |
| Mo-S (ng/g) | ||||
| Consumption of cereals | Once/week | - | - | - |
| 2–6x/week | 1.24 (0.99–1.57) | 1.09 (0.75–1.60) | 1.44 (1.07–1.94) * | |
| Every day | 1.37 (1.09–1.71) * | 0.99 (0.69–1.44) | 1.80 (1.39–2.32) * | |
| BMI adjustment | 1.01 (0.80–1.28) | 1.07 (0.75–1.52) | 0.91 (0.69–1.21) | |
| Age adjustment | 0.85 (0.68–1.05) | 0.85 (0.60–1.19) | 0.87 (0.66–1.14) | |
| Consumption of boiled vegetables | Once/week | - | - | - |
| 2–6x/week | 1.29 (0.99–1.69) | 1.27 (0.85–1.90) | 1.39 (0.98–1.98) | |
| Every day | 1.40 (1.08–1.81) * | 1.21 (0.82–1.80) | 1.91 (1.35–2.69) * | |
| BMI adjustment | 0.97 (0.77–1.23) | 1.05 (0.75–1.46) | 0.76 (0.55–1.04) | |
| Age adjustment | 0.86 (0.69–1.07) | 0.82 (0.59–1.51) | 0.88 (0.66–1.19) | |
| Cu-S (ng/g) | ||||
| Consumption of beef | Less than once/month | - | - | - |
| At least once/week | 1.27 (1.03–1.57) * | 1.51 (1.10–2.07) * | 1.10 (0.79–1.54) | |
| BMI adjustment | 1.21 (0.96–1.51) | 1.27 (0.94–1.72) | 1.10 (0.79–1.53) | |
| Age adjustment | 1.10 (0.88–1.36) | 1.14 (0.81–1.59) | 1.23 (0.88–1.70) | |
| Mo-SG | Mo-WB | Cu-S | Mo-S | |||||
|---|---|---|---|---|---|---|---|---|
| r (p) | ||||||||
| PCOS | Control | PCOS | Control | PCOS | Control | PCOS | Control | |
| TSH (mIU/L) | 0.02 (0.916) | 0.20 (0.260) | −0.01 (0.969) | 0.56 (<0.001) * | 0.05 (0.763) | −0.04 (0.811) | −0.04 (0.804) | 0.39 (0.020) * |
| LH (IU/L) | −0.26 (0.119) | 0.21 (0.222) | −0.24 (0.166) | 0.19 (0.263) | −0.23 (0.188) | 0.17 (0.322) | −0.35 (0.037) * | 0.25 (0.137) |
| P (µg/L) | 0.07 (0.709) | 0.44 (0.008) * | −0.22 (0.200) | 0.28 (0.108) | 0.10 (0.576) | −0.06 (0.719) | −0.21 (0.235) | 0.18 (0.296) |
| SHBG (nmol/L) | −0.09 (0.593) | −0.20 (0.248) | −0.06 (0.737) | −0.16 (0.371) | 0.06 (0.747) | 0.34 (0.044) * | 0.01 (0.982) | 0.01 (0.950) |
| Serum creatinine (µmol/L) | −0.05 (0.781) | 0.10 (0.582) | −0.11 (0.522) | 0.43 (0.008) * | 0.13 (0.463) | 0.15 (0.384) | 0.09 (0.621) | 0.51 (0.002) |
| AST (µkat/L) | 0.17 (0.324) | 0.09 (0.588) | 0.34 (0.049) * | 0.21 (0.231) | −0.06 (0.738) | 0.11 (0.545) | 0.53 (0.001) * | 0.27 (0.113) |
| ALT (µkat/L) | 0.10 (0.582) | −0.02 (0.928) | 0.26 (0.133) | 0.14 (0.435) | −0.06 (0.736) | −0.03 (0.847) | 0.46 (0.005) * | 0.16 (0.366) |
| L (109/L) | 0.00 (0.995) | −0.06 (0.731) | −0.02 (0.889) | 0.15 (0.401) | 0.40 (0.018) * | 0.02 (0.925) | −0.12 (0.475) | 0.04 (0.838) |
| MCV | 0.38 (0.026) * | −0.08 (0.661) | −0.01 (0.948) | −0.34 (0.045) * | −0.08 (0.631) | −0.20 (0.258) | 0.38 (0.024) * | −0.23 (0.189) |
| MCH | 0.50 (0.002) * | −0.13 (0.467) | 0.06 (0.742) | −0.36 (0.033) * | 0.13 (0.463) | −0.19 (0.283) | 0.34 (0.042) * | −0.22 (0.214) |
| U-SG | 0.50 (0.002) * | 0.54 (0.001) * | −0.42 (0.012) * | −0.01 (0.960) | 0.18 (0.289) | 0.03 (0.873) | −0.05 (0.789) | −0.05 (0.780) |
| U-pH | −0.03 (0.843) | −0.42 (0.013) * | 0.20 (0.239) | −0.35 (0.037) * | −0.03 (0.884) | −0.30 (0.080) | 0.02 (0.914) | −0.35 (0.038) * |
| U-prot. | −0.10 (0.587) | 0.05 (0.760) | −0.37 (0.028) | 0.06 (0.712) | 0.30 (0.077) | −0.11 (0.522) | −0.32 (0.065) | 0.10 (0.581) |
| U-urobil. | 0.35 (0.041) * | 0.15 (0.383) | −0.13 (0.464) | −0.20 (0.238) | −0.06 (0.729) | −0.19 (0.266) | −0.03 (0.847) | −0.15 (0.401) |
| U-bilirub. | −0.30 (0.075) | 0.19 (0.283) | −0.34 (0.044) * | −0.20 (0.240) | 0.08 (0.626) | −0.25 (0.140) | −0.37 (0.031) * | −0.27 (0.114) |
| U-creat. (mmol/L) | 0.44 (0.009) * | 0.64 (<0.001) * | −0.59 (<0.001) * | 0.04 (0.826) | 0.15 (0.379) | 0.02 (0.895) | −0.24 (0.169) | −0.02 (0.926) |
Disclaimer/Publisher’s Note: The statements, opinions and data contained in all publications are solely those of the individual author(s) and contributor(s) and not of MDPI and/or the editor(s). MDPI and/or the editor(s) disclaim responsibility for any injury to people or property resulting from any ideas, methods, instructions or products referred to in the content. |
© 2025 by the authors. Licensee MDPI, Basel, Switzerland. This article is an open access article distributed under the terms and conditions of the Creative Commons Attribution (CC BY) license (https://creativecommons.org/licenses/by/4.0/).
Share and Cite
Srnovršnik, T.; Pinter, B.; Horvat, M.; Snoj Tratnik, J.; Falnoga, I.; Mazej, D.; Verdenik, I.; Virant-Klun, I. Association of Trace Elements with Polycystic Ovary Syndrome in Women—A Case-Control Study. Metabolites 2025, 15, 79. https://doi.org/10.3390/metabo15020079
Srnovršnik T, Pinter B, Horvat M, Snoj Tratnik J, Falnoga I, Mazej D, Verdenik I, Virant-Klun I. Association of Trace Elements with Polycystic Ovary Syndrome in Women—A Case-Control Study. Metabolites. 2025; 15(2):79. https://doi.org/10.3390/metabo15020079
Chicago/Turabian StyleSrnovršnik, Tinkara, Bojana Pinter, Milena Horvat, Janja Snoj Tratnik, Ingrid Falnoga, Darja Mazej, Ivan Verdenik, and Irma Virant-Klun. 2025. "Association of Trace Elements with Polycystic Ovary Syndrome in Women—A Case-Control Study" Metabolites 15, no. 2: 79. https://doi.org/10.3390/metabo15020079
APA StyleSrnovršnik, T., Pinter, B., Horvat, M., Snoj Tratnik, J., Falnoga, I., Mazej, D., Verdenik, I., & Virant-Klun, I. (2025). Association of Trace Elements with Polycystic Ovary Syndrome in Women—A Case-Control Study. Metabolites, 15(2), 79. https://doi.org/10.3390/metabo15020079