MSdeCIpher: A Tool to Link Data from Complementary Ionization Techniques in High-Resolution GC-MS to Identify Molecular Ions


Abstract
:1. Introduction
2. Materials and Methods
2.1. Analytical Standards
2.2. Sample Preparation
2.3. Data Acquisition
2.4. Data Deconvolution
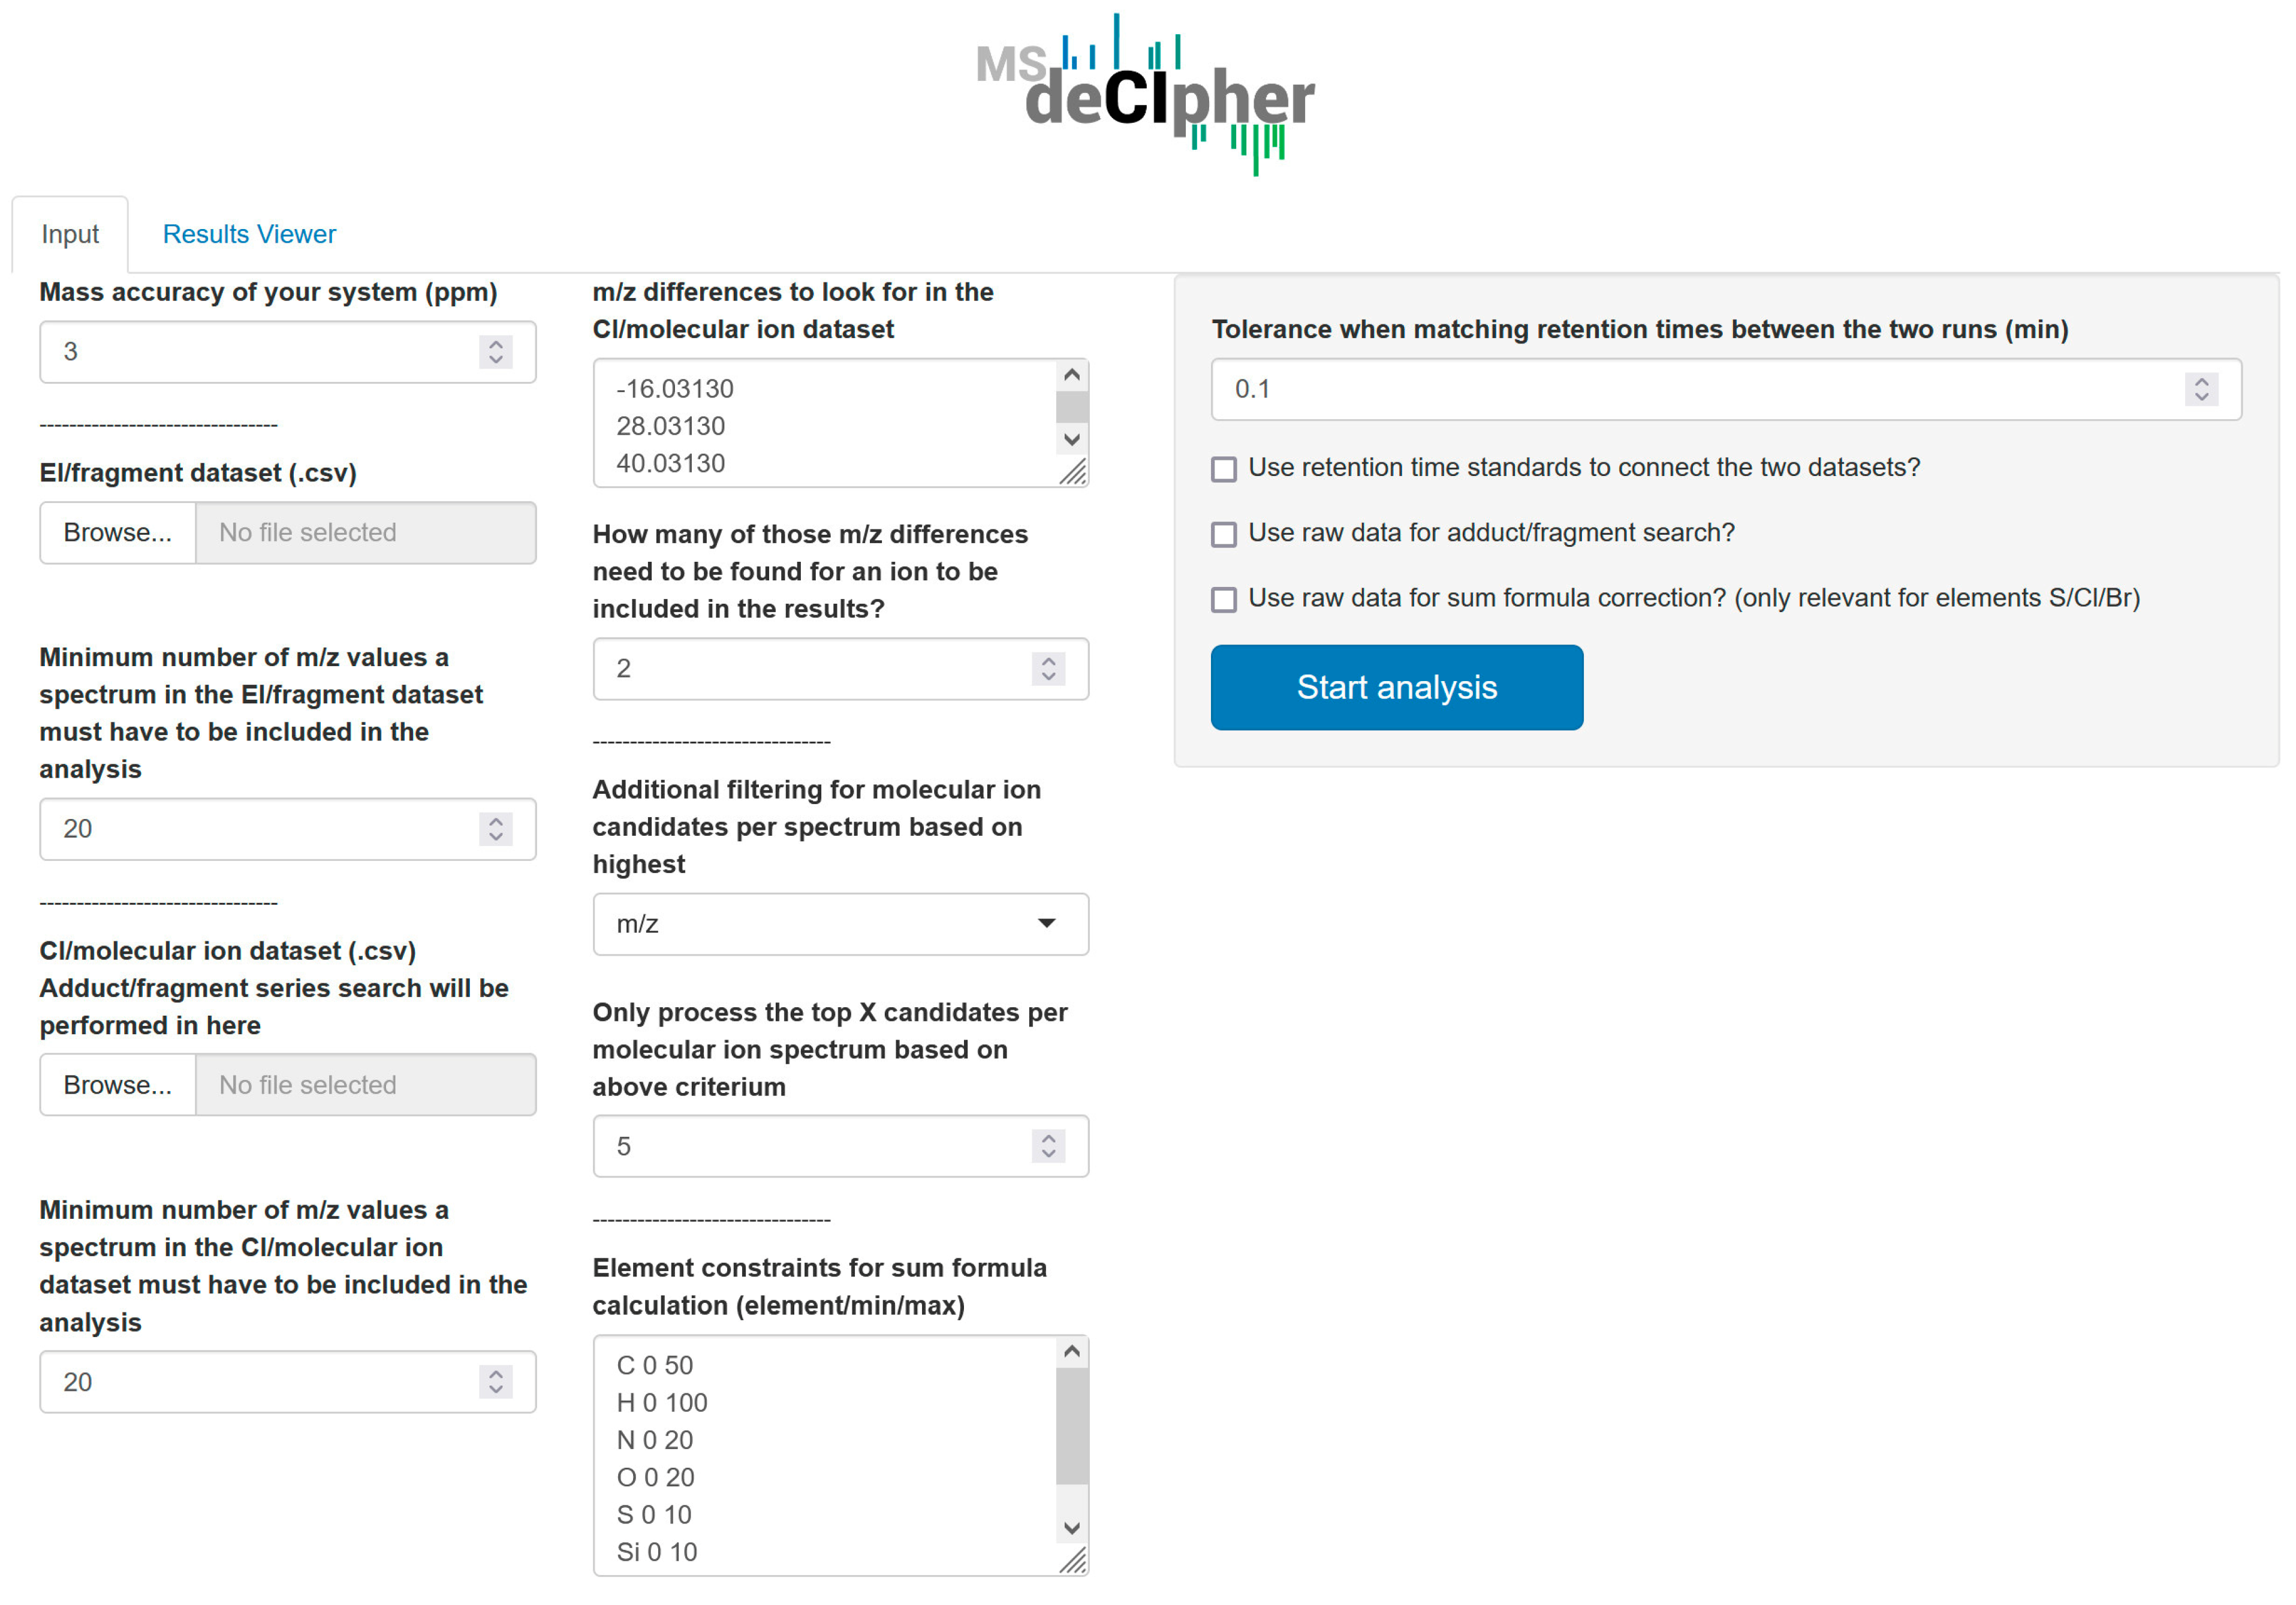
2.5. MSdeCIpher Settings
3. Results
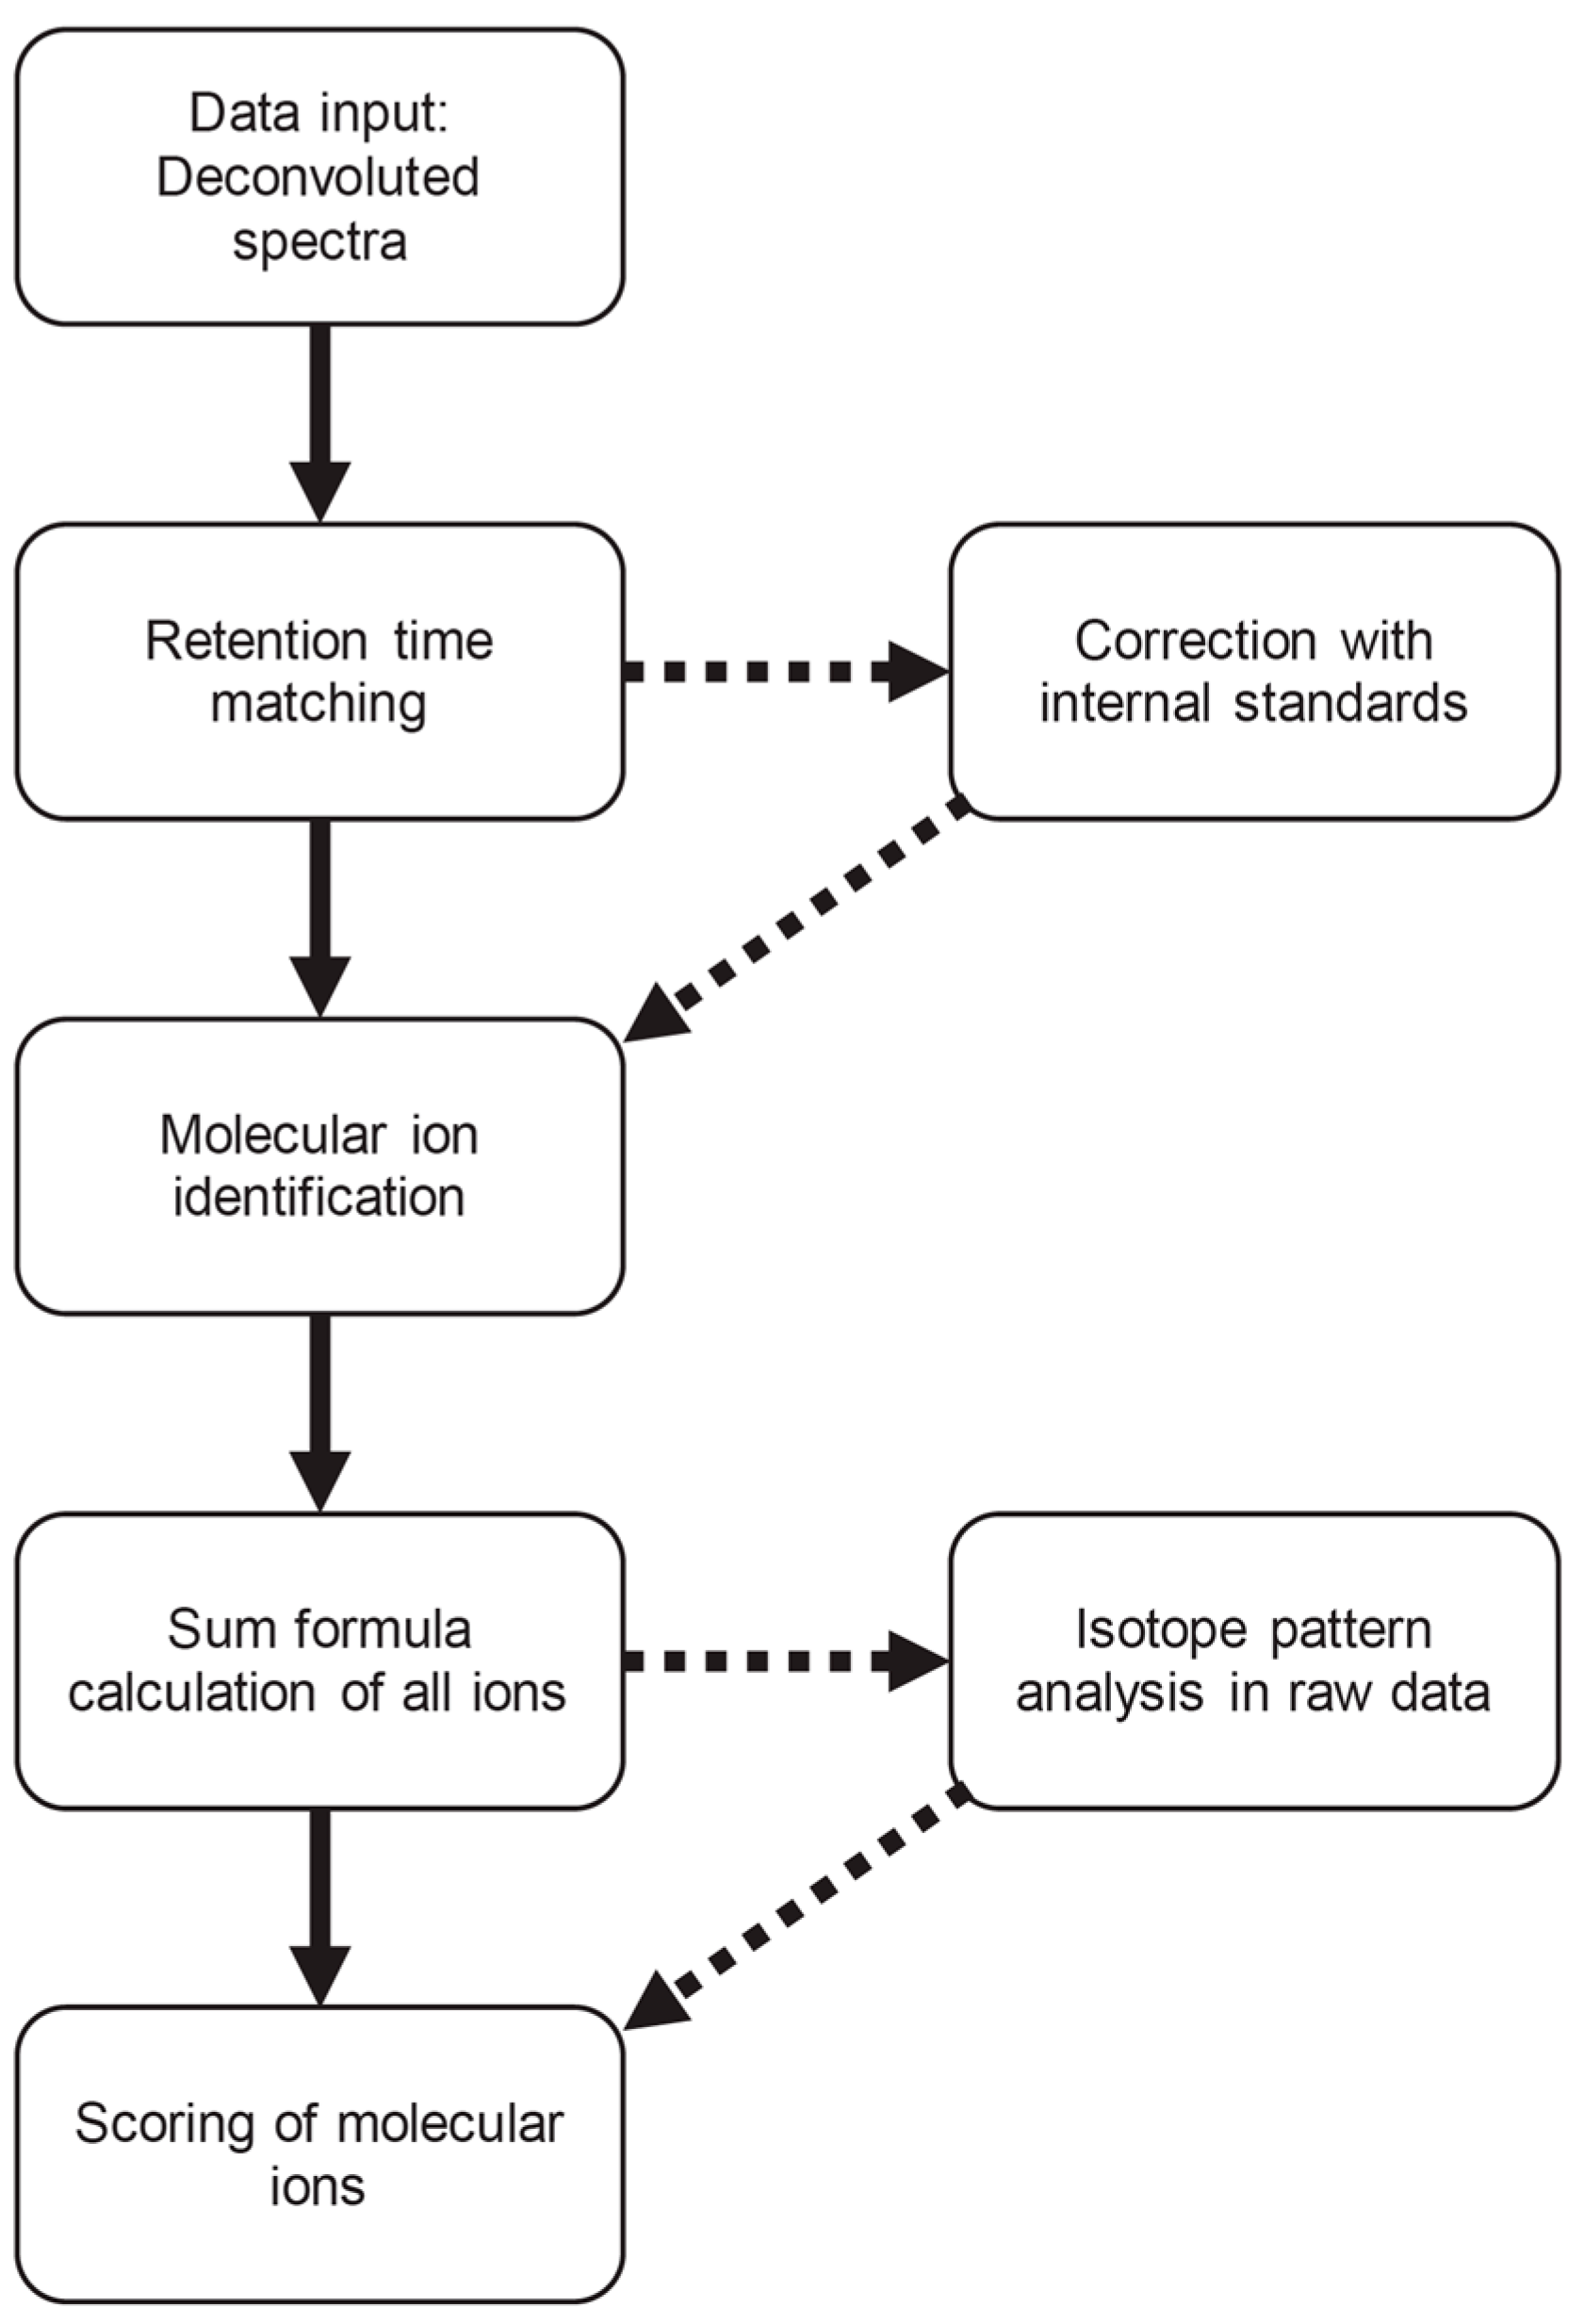
3.1. Workflow
3.2. Performance Evaluation
4. Discussion
5. Conclusions
Supplementary Materials
Author Contributions
Funding
Data Availability Statement
Acknowledgments
Conflicts of Interest
References
- Maher, S.; Jjunju, F.P.M.; Taylor, S. Colloquium: 100 years of mass spectrometry: Perspectives and future trends. Rev. Mod. Phys. 2015, 87, 113–135. [Google Scholar] [CrossRef]
- Monge, M.E.; Dodds, J.N.; Baker, E.S.; Edison, A.S.; Fernandez, F.M. Challenges in Identifying the Dark Molecules of Life. Annu. Rev. Anal. Chem. 2019, 12, 177–199. [Google Scholar] [CrossRef] [PubMed]
- Shao, B.; Li, H.; Shen, J.; Wu, Y. Nontargeted Detection Methods for Food Safety and Integrity. Annu. Rev. Food Sci. Technol. 2019, 10, 429–455. [Google Scholar] [CrossRef] [PubMed]
- Pico, Y.; Alfarhan, A.H.; Barcelo, D. How recent innovations in gas chromatography-mass spectrometry have improved pesticide residue determination: An alternative technique to be in your radar. TrAC-Trends Anal. Chem. 2020, 122, 14. [Google Scholar] [CrossRef]
- Aderemi, A.V.; Ayeleso, A.O.; Oyedapo, O.O.; Mukwevho, E. Metabolomics: A Scoping Review of Its Role as a Tool for Disease Biomarker Discovery in Selected Non-Communicable Diseases. Metabolites 2021, 11, 418. [Google Scholar] [CrossRef] [PubMed]
- Alarcon-Barrera, J.C.; Kostidis, S.; Ondo-Mendez, A.; Giera, M. Recent advances in metabolomics analysis for early drug development. Drug Discov. Today 2022, 27, 1763–1773. [Google Scholar] [CrossRef]
- Viant, M.R.; Kurland, I.J.; Jones, M.R.; Dunn, W.B. How close are we to complete annotation of metabolomes? Curr. Opin. Chem. Biol. 2017, 36, 64–69. [Google Scholar] [CrossRef]
- Matsuo, T.; Tsugawa, H.; Miyagawa, H.; Fukusaki, E. Integrated Strategy for Unknown EI–MS Identification Using Quality Control Calibration Curve, Multivariate Analysis, EI–MS Spectral Database, and Retention Index Prediction. Anal. Chem. 2017, 89, 6766–6773. [Google Scholar] [CrossRef]
- Tsugawa, H.; Kind, T.; Nakabayashi, R.; Yukihira, D.; Tanaka, W.; Cajka, T.; Saito, K.; Fiehn, O.; Arita, M. Hydrogen Rearrangement Rules: Computational MS/MS Fragmentation and Structure Elucidation Using MS-FINDER Software. Anal. Chem. 2016, 88, 7946–7958. [Google Scholar] [CrossRef]
- Allen, F.; Pon, A.; Greiner, R.; Wishart, D. Computational Prediction of Electron Ionization Mass Spectra to Assist in GC/MS Compound Identification. Anal. Chem. 2016, 88, 7689–7697. [Google Scholar] [CrossRef]
- Qiu, F.; Lei, Z.T.; Sumner, L.W. MetExpert: An expert system to enhance gas chromatography-mass spectrometry-based metabolite identifications. Anal. Chim. Acta 2018, 1037, 316–326. [Google Scholar] [CrossRef] [PubMed]
- Blazenovic, I.; Kind, T.; Ji, J.; Fiehn, O. Software Tools and Approaches for Compound Identification of LC-MS/MS Data in Metabolomics. Metabolites 2018, 8, 31. [Google Scholar] [CrossRef] [PubMed]
- McLafferty, F.; Turecek, F. Interpretation of Mass Spectra, 4th ed.; University Science Books: Sausalito, CA, USA, 1994. [Google Scholar]
- Stettin, D.; Poulin, R.X.; Pohnert, G. Metabolomics Benefits from Orbitrap GC-MS-Comparison of Low- and High-Resolution GC-MS. Metabolites 2020, 10, 143. [Google Scholar] [CrossRef]
- Abate, S.; Ahn, Y.G.; Kind, T.; Cataldi, T.R.I.; Fiehn, O. Determination of elemental compositions by gas chromatography/time-of-flight mass spectrometry using chemical and electron ionization. Rapid Commun. Mass Spectrom. 2010, 24, 1172–1180. [Google Scholar] [CrossRef] [PubMed]
- Carrasco-Pancorbo, A.; Nevedomskaya, E.; Arthen-Engeland, T.; Zey, T.; Zurek, G.; Baessmann, C.; Deelder, A.M.; Mayboroda, O.A. Gas Chromatography/Atmospheric Pressure Chemical Ionization-Time of Flight Mass Spectrometry: Analytical Validation and Applicability to Metabolic Profiling. Anal. Chem. 2009, 81, 10071–10079. [Google Scholar] [CrossRef] [PubMed]
- Lai, Z.J.; Kind, T.; Fiehn, O. Using Accurate Mass Gas Chromatography-Mass Spectrometry with the MINE Database for Epimetabolite Annotation. Anal. Chem. 2017, 89, 10171–10180. [Google Scholar] [CrossRef]
- Lai, Z.J.; Tsugawa, H.; Wohlgemuth, G.; Mehta, S.; Mueller, M.; Zheng, Y.X.; Ogiwara, A.; Meissen, J.; Showalter, M.; Takeuchi, K.; et al. Identifying metabolites by integrating metabolome databases with mass spectrometry cheminformatics. Nat. Methods 2018, 15, 53–56. [Google Scholar] [CrossRef]
- Qiu, Y.P.; Moir, R.D.; Willis, I.M.; Seethapathy, S.; Biniakewitz, R.C.; Kurland, I.J. Enhanced Isotopic Ratio Outlier Analysis (IROA) Peak Detection and Identification with Ultra-High Resolution GC-Orbitrap/MS: Potential Application for Investigation of Model Organism Metabolomes. Metabolites 2018, 8, 9. [Google Scholar] [CrossRef]
- Misra, B.B.; Olivier, M. High Resolution GC-Orbitrap-MS Metabolomics Using Both Electron Ionization and Chemical Ionization for Analysis of Human Plasma. J. Proteome Res. 2020, 19, 2717–2731. [Google Scholar] [CrossRef]
- Girod, C.; Staub, C. Analysis of drugs of abuse in hair by automated solid-phase extraction, GC/EI/MS and GC ion trap/CI/MS. Forensic Sci. Int. 2000, 107, 261–271. [Google Scholar] [CrossRef]
- Umebachi, R.; Saito, T.; Aoki, H.; Namera, A.; Nakamoto, A.; Kawamura, M.; Inokuchi, S. Detection of synthetic cannabinoids using GC-EI-MS, positive GC-CI-MS, and negative GC-CI-MS. Int. J. Legal Med. 2017, 131, 143–152. [Google Scholar] [CrossRef] [PubMed]
- Lebedev, A.T.; Mazur, D.M.; Artaev, V.B.; Tikhonov, G.Y. Better screening of non-target pollutants in complex samples using advanced chromatographic and mass spectrometric techniques. Environ. Chem. Lett. 2020, 18, 1753–1760. [Google Scholar] [CrossRef]
- Javelle, T.; Righezza, M.; Danger, G. Identify low mass volatile organic compounds from cometary ice analogs using gas chromatography coupled to an Orbitrap mass spectrometer associated to electron and chemical ionizations. J. Chromatogr. A 2021, 1652, 462343. [Google Scholar] [CrossRef] [PubMed]
- Bräkling, S.; Kroll, K.; Stoermer, C.; Rohner, U.; Gonin, M.; Benter, T.; Kersten, H.; Klee, S. Parallel Operation of Electron Ionization and Chemical Ionization forGC-MS Using a Single TOF Mass AnalyzerS. Anal. Chem. 2022, 94, 6057–6064. [Google Scholar] [CrossRef] [PubMed]
- Hoffmann, E.d.; Stroobant, V. Mass spectrometry: Principles and Applications, 3rd ed.; J. Wiley: Chichester, UK; Hoboken, NJ, USA, 2007. [Google Scholar]
- Smith, C.A.; Want, E.J.; O’Maille, G.; Abagyan, R.; Siuzdak, G. XCMS: Processing Mass Spectrometry Data for Metabolite Profiling Using Nonlinear Peak Alignment, Matching, and Identification. Anal. Chem. 2006, 78, 779–787. [Google Scholar] [CrossRef] [PubMed]
- Kuhl, C.; Tautenhahn, R.; Böttcher, C.; Larson, T.R.; Neumann, S. CAMERA: An Integrated Strategy for Compound Spectra Extraction and Annotation of Liquid Chromatography/Mass Spectrometry Data Sets. Anal. Chem. 2012, 84, 283–289. [Google Scholar] [CrossRef]
- Wehrens, R.; Weingart, G.; Mattivi, F. metaMS: An open-source pipeline for GC-MS-based untargeted metabolomics. J. Chromatogr. B 2014, 966, 109–116. [Google Scholar] [CrossRef]
- Wang, S.Y.; Valdiviez, L.; Ye, H.L.; Fiehn, O. Automatic Assignment of Molecular Ion Species to Elemental Formulas in Gas Chromatography/Methane Chemical Ionization Accurate Mass Spectrometry. Metabolites 2023, 13, 962. [Google Scholar] [CrossRef]
- Munson, M.S.; Field, F.-H. Chemical ionization mass spectrometry. I. General introduction. J. Am. Chem. Soc. 1966, 88, 2621–2630. [Google Scholar] [CrossRef]
- Guha, R. Chemical Informatics functionality in R. J. Stat. Softw. 2007, 18, 16. [Google Scholar] [CrossRef]
- Steinbeck, C.; Hoppe, C.; Kuhn, S.; Floris, M.; Guha, R.; Willighagen, E.L. Recent developments of the Chemistry Development Kit (CDK)–An open-source Java library for chemo- and bioinformatics. Curr. Pharm. Design 2006, 12, 2111–2120. [Google Scholar] [CrossRef] [PubMed]
- Kind, T.; Fiehn, O. Metabolomic database annotations via query of elemental compositions: Mass accuracy is insufficient even at less than 1 ppm. BMC Bioinform. 2006, 7, 234. [Google Scholar] [CrossRef] [PubMed]
- Hufsky, F.; Rempt, M.; Rasche, F.; Pohnert, G.; Bocker, S. De novo analysis of electron impact mass spectra using fragmentation trees. Anal. Chim. Acta 2012, 739, 67–76. [Google Scholar] [CrossRef] [PubMed]
- Kind, T.; Fiehn, O. Seven Golden Rules for heuristic filtering of molecular formulas obtained by accurate mass spectrometry. Bmc Bioinformatics 2007, 8, 20. [Google Scholar] [CrossRef]
- Elsa, O.; Emmanuelle, B.; Sebastien, H.; Anne-Lise, R.; Fabrice, M.; Helene, G.; Paul, H.; Gerald, R.; Gaud, D.P.; Cariou, R.; et al. Toward the characterisation of non-intentionally added substances migrating from polyester-polyurethane lacquers by comprehensive gas chromatography-mass spectrometry technologies. J. Chromatogr. A 2019, 1601, 327–334. [Google Scholar]
- Cheng, Z.P.; Dong, F.S.; Xu, J.; Liu, X.G.; Wu, X.H.; Chen, Z.L.; Pan, X.L.; Gan, J.; Zheng, Y.Q. Simultaneous determination of organophosphorus pesticides in fruits and vegetables using atmospheric pressure gas chromatography quadrupole-time-of-flight mass spectrometry. Food Chem. 2017, 231, 365–373. [Google Scholar] [CrossRef]


| Analyte | [M + H]+ m/z | Top Result # | Score | Correct Sum Formula |
|---|---|---|---|---|
| 2,4-Dihydroxypyrimidine-5-carboxylic acid (3 TMS) | 373.1431 | 1 | 96.94% | yes |
| 2′-Deoxyadenosine (3 TMS) | 468.2272 | 1 | 95.35% | yes |
| 2-Deoxy-d-glucose (4 TMS, 1 MeOX) | 482.2608 | 5 | 85.70% | yes |
| 3-Hydroxybutanoic acid (2 TMS) | 249.1338 | 1 | 86.41% | yes |
| 3-Ureidopropionate (2 TMS) | 277.1399 | 2 | 94.79% | yes |
| 4-Aminobutanoate (3 TMS) | 320.1895 | 1 | 95.99% | no |
| 5-Aminopentanoate (3 TMS) | 334.2050 | 1 | 94.82% | yes |
| Adenine (2 TMS) | 280.1407 | 1 | 88.10% | yes |
| Beta-alanine (3 TMS) | No molecular ion present in raw data | |||
| d-Glucosamine (4 TMS, 1 MeOX) | 497.2716 | 5 | 84.71% | no |
| d-Glucosamine (5 TMS, 1 MeOX) | 569.3119 | 1 | 90.54% | no |
| d-Lactose (8 TMS, 1 MeOX) | No adduct/fragment pattern in raw data | |||
| dl-Normetanephrine (3 TMS) | Deconvolution of molecular ion failed | |||
| dl-Normetanephrine (4 TMS) | 472.2550 | 1 | 61.67% | no |
| Dopamine (4 TMS) | 442.2449 | 3 | 49.87% | no |
| Erythritol (4 TMS) | No adduct/fragment pattern in raw data | |||
| Ethyl-3-ureidopropionate (3 TMS) | No molecular ion present in raw data | |||
| Homoserine (2 TMS) | 264.1445 | 1 | 92.91% | yes |
| Homoserine (3 TMS) | 336.1843 | 2 | 92.24% | yes |
| Leucine (2 TMS) | 276.1813 | 1 | 72.18% | yes |
| l-Isoleucine (2 TMS) | 276.1811 | 1 | 64.76% | yes |
| l-Threonine (3 TMS) | 336.1841 | 1 | 92.70% | yes |
| N-Formylglycine (3 TMS) | No molecular ion present in raw data | |||
| Nicotinate (1 TMS) | 196.0789 | 1 | 84.40% | yes |
| N-Methyl-d-aspartic acid (3 TMS) | No molecular ion present in raw data | |||
| Norleucine (2 TMS) | 276.1811 | 1 | 92.54% | yes |
| Octopamine (4 TMS) | 442.2450 | 1 | 56.69% | no |
| Putrescine (4 TMS) | 377.2661 | 1 | 87.24% | no |
| Spermidine (4 TMS) | 434.3235 | 1 | 84.49% | no |
| Succinate (2 TMS) | 263.1130 | 1 | 87.70% | yes |
| Theophylline (1 TMS) | Deconvolution of molecular ion failed | |||
| Xylitol (5 TMS) | No adduct/fragment pattern in raw data | |||
| Phytol (1 TMS) | No molecular ion present in raw data | |||
| 5-Oxo-l-proline (2 TMS) | 274.1291 | 1 | 94.56% | yes |
| l-Arabitol (5 TMS) | No adduct/fragment pattern in raw data | |||
| Glycine (3 TMS) | 292.1580 | 1 | 95.98% | yes |
| l-Rhamnose (4 TMS, 1 MeOX) | 482.2608 | 2 | 82.24% | no |
| Phosphoric acid (3 TMS) | 315.1025 | 1 | 95.43% | yes |
| l-Serine (3 TMS) | 322.1685 | 2 | 97.24% | yes |
| scyllo-Inositol (6 TMS) | No adduct/fragment pattern in raw data | |||
| Urea (2 TMS) | No match due to retention time shift | |||
| l-Tyrosine (3 TMS) | 398.2000 | 3 | 54.26% | no |
| l-Lysine (4 TMS) | 435.2709 | 2 | 81.44% | yes |
| Cholesterol (1 TMS) | No molecular ion present in raw data | |||
| l-Methionine (2 TMS) | 294.1374 | 1 | 91.85% | no |
| myo-Inositol (6 TMS) | 614.3108 | 1 | 96.34% | no |
| Cholesta-3,5-diene | 369.3508 | 1 | 99.08% | yes |
| Docosahexaenoic acid (1 TMS) | 401.2875 | 1 | 95.89% | yes |
| α-Tocopherol (1 TMS) | 503.4252 | 1 | 65.59% | no |
| Spermine (6 TMS) | 635.4631 | 2 | 98.76% | no |
| Glycero-1-phosphate (4 TMS) | 461.1792 | 1 | 98.76% | yes |
| Glycero-2-phosphate (4 TMS) | Deconvolution of molecular ion failed | |||
| d-Mannose (5 TMS, 1 MeOX) | 570.2961 | 1 | 97.15% | no |
| d-Allose (5 TMS, 1 MeOX) | 570.2961 | 1 | 98.35% | no |
| Analyte | [M + H+] m/z | Top Result # | Score | Correct Sum Formula |
|---|---|---|---|---|
| Dimethoate | 230.0068 | 1 | 94.73% | yes |
| Disulfoton | 275.0360 | 1 | 96.46% | yes |
| Famphur | 326.0281 | 1 | 83.29% | yes |
| Parathion | 292.0404 | 1 | 84.93% | yes |
| Parathion methyl | 264.0090 | 1 | 47.06% | yes |
| Phorate | 261.0202 | 1 | 96.37% | yes |
| Sulfotep | 323.0300 | 1 | 92.45% | yes |
| Thionazin | 249.0456 | 1 | 93.12% | yes |
| Triethyl thiophosphate | 199.0548 | 1 | 96.11% | yes |
| Analyte | [M + H+] m/z | Top Result # | Score | Correct Sum Formula |
|---|---|---|---|---|
| l-Valine (2 TMS) | 262.1656 | 1 | 92.05% | yes |
| l-Isoleucine (2 TMS) | 276.1810 | 1 | 89.78% | yes |
| l-Proline (2 TMS) | 260.1499 | 1 | 91.01% | yes |
| Pyrrole-2-carboxylic acid (2 TMS) | Deconvolution of molecular ion failed | |||
| Threonic acid lactone (2 TMS) | Too few ions in molecular ion spectrum | |||
| l-Threonine (3 TMS) | 336.1843 | 2 | 97.13% | yes |
| 5-Oxo-l-proline (2 TMS) | 274.1291 | 1 | 96.12% | yes |
| l-Glutamic acid (2 TMS) | 292.1396 | 1 | 89.55% | yes |
| l-Phenylalanin (1 TMS) | 238.1258 | 1 | 77.65% | yes |
| l-Phenylalanin (2 TMS) | 310.1654 | 1 | 92.73% | yes |
| l-Ornithine (3 TMS) | Too few ions in molecular ion spectrum | |||
| l-Ornithine (4 TMS) | No molecular ion present in raw data | |||
| l-Citric acid (4 TMS) | Deconvolution of molecular ion failed | |||
| l-Tyrosine (2 TMS) | 326.1604 | 1 | 92.40% | yes |
| d-Glucose (5 TMS, 1 MeOX) isomer 1 | 570.2958 | 1 | 98.97% | yes |
| d-Glucose (5 TMS, 1 MeOX) isomer 2 | 570.2957 | 1 | 99.73% | no |
| l-Lysine (4 TMS) | No molecular ion present in raw data | |||
| Dehydroascorbate (2 TMS, 2 MeOX) | 377.1561 | 1 | 97.62% | yes |
| l-Tyrosine (3 TMS) | No molecular ion present in raw data | |||
| l-Tryptophan (4 TMS) | No molecular ion present in raw data | |||
| Eicosapentaenoic acid (1 TMS) | 375.2714 | 1 | 96.43% | no |
| Desmosterol (1 TMS) | Deconvolution of molecular ion failed | |||
| Phytol (1 TMS) | 369.3551 | 1 | 91.62% | yes |
| l-Arabitol (5 TMS) | No adduct/ fragment pattern in raw data | |||
| Glycine | 292.1580 | 1 | 95.20% | yes |
| l-Rhamnose (4 TMS, 1 MeOX) | 482.2608 | 2 | 88.27% | no |
| Putrescine (4 TMS) | 377.2656 | 3 | 91.99% | no |
| Phosphoric acid (3 TMS) | 315.1025 | 1 | 94.29% | yes |
| l-Serine | 322.1685 | 1 | 90.89% | yes |
| scyllo-Inositol (6 TMS) | No adduct/ fragment pattern in raw data | |||
| Urea (2 TMS) | 205.1188 | 1 | 77.11% | yes |
| l-Methionine (2 TMS) | Too few ions in molecular ion spectrum | |||
| myo-Inositol | 614.3108 | 1 | 90.04% | no |
| Docosahexaenoic acid (1 TMS) | 401.2875 | 1 | 99.59% | yes |
| 4-Aminobutanoic acid (3 TMS) | Too few ions in molecular ion spectrum | |||
| Glycero-1-phosphate (4 TMS) | 461.1792 | 1 | 99.02% | yes |
| Glycero-2-phosphate (4 TMS) | 461.1792 | 2 | 97.86% | yes |
Disclaimer/Publisher’s Note: The statements, opinions and data contained in all publications are solely those of the individual author(s) and contributor(s) and not of MDPI and/or the editor(s). MDPI and/or the editor(s) disclaim responsibility for any injury to people or property resulting from any ideas, methods, instructions or products referred to in the content. |
© 2023 by the authors. Licensee MDPI, Basel, Switzerland. This article is an open access article distributed under the terms and conditions of the Creative Commons Attribution (CC BY) license (https://creativecommons.org/licenses/by/4.0/).
Share and Cite
Stettin, D.; Pohnert, G. MSdeCIpher: A Tool to Link Data from Complementary Ionization Techniques in High-Resolution GC-MS to Identify Molecular Ions. Metabolites 2024, 14, 10. https://doi.org/10.3390/metabo14010010
Stettin D, Pohnert G. MSdeCIpher: A Tool to Link Data from Complementary Ionization Techniques in High-Resolution GC-MS to Identify Molecular Ions. Metabolites. 2024; 14(1):10. https://doi.org/10.3390/metabo14010010
Chicago/Turabian StyleStettin, Daniel, and Georg Pohnert. 2024. "MSdeCIpher: A Tool to Link Data from Complementary Ionization Techniques in High-Resolution GC-MS to Identify Molecular Ions" Metabolites 14, no. 1: 10. https://doi.org/10.3390/metabo14010010
APA StyleStettin, D., & Pohnert, G. (2024). MSdeCIpher: A Tool to Link Data from Complementary Ionization Techniques in High-Resolution GC-MS to Identify Molecular Ions. Metabolites, 14(1), 10. https://doi.org/10.3390/metabo14010010