
Life-Threatening Cardiogenic Shock Related to Venlafaxine Poisoning—A Case Report with Metabolomic Approach

 ,
,  , , ,
, , ,  and
and 
Abstract
1. Introduction
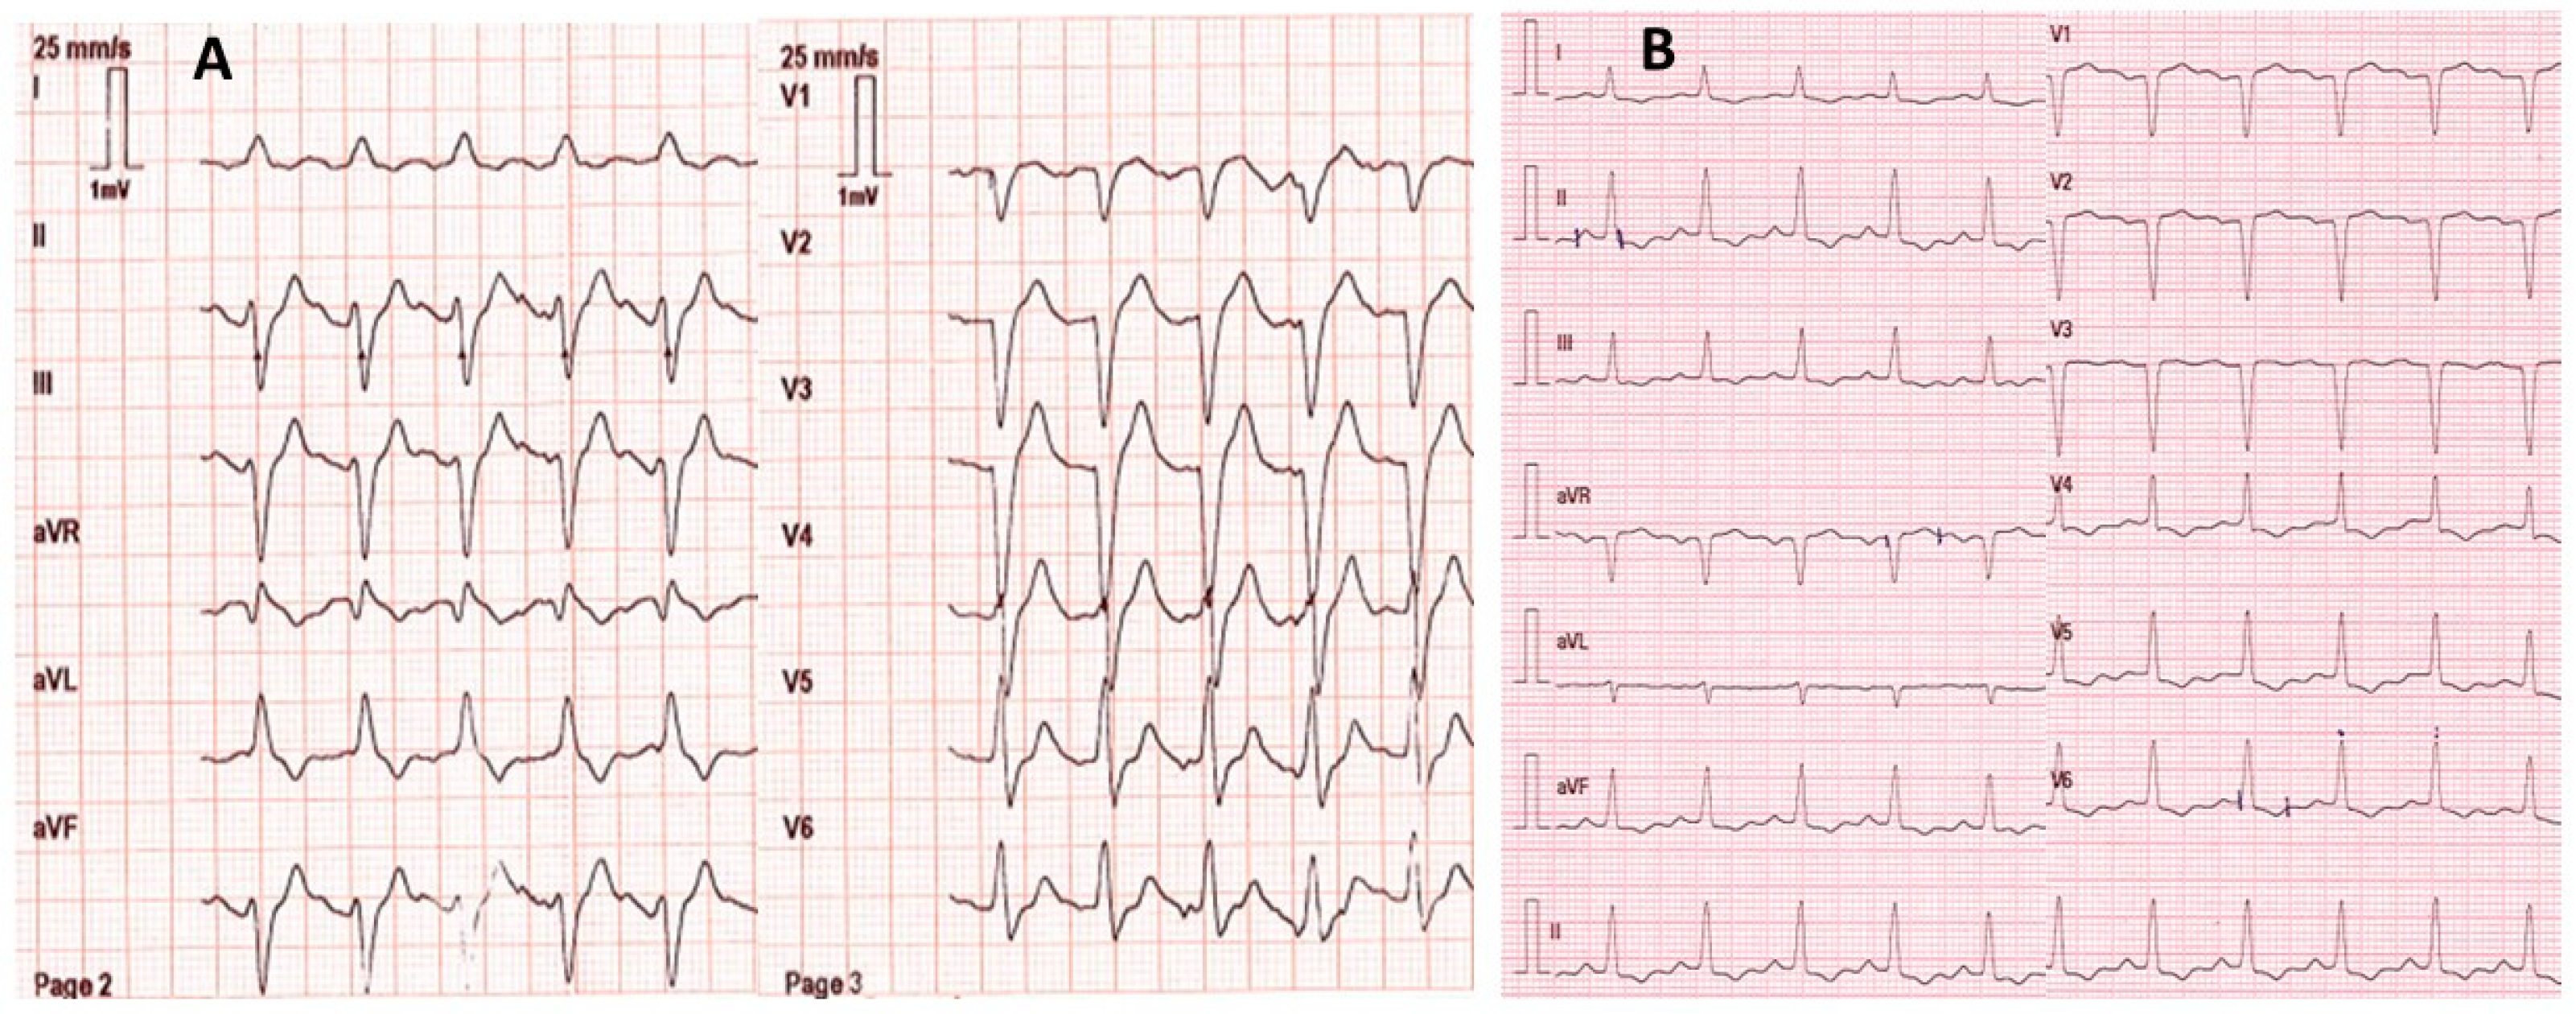
2. Case Report
3. Materials and Methods
3.1. Chemical and Reagents
3.2. Quantitative Targeted Analyses
3.3. Non Targeted Analyses
3.4. Statistical Analyses
4. Results
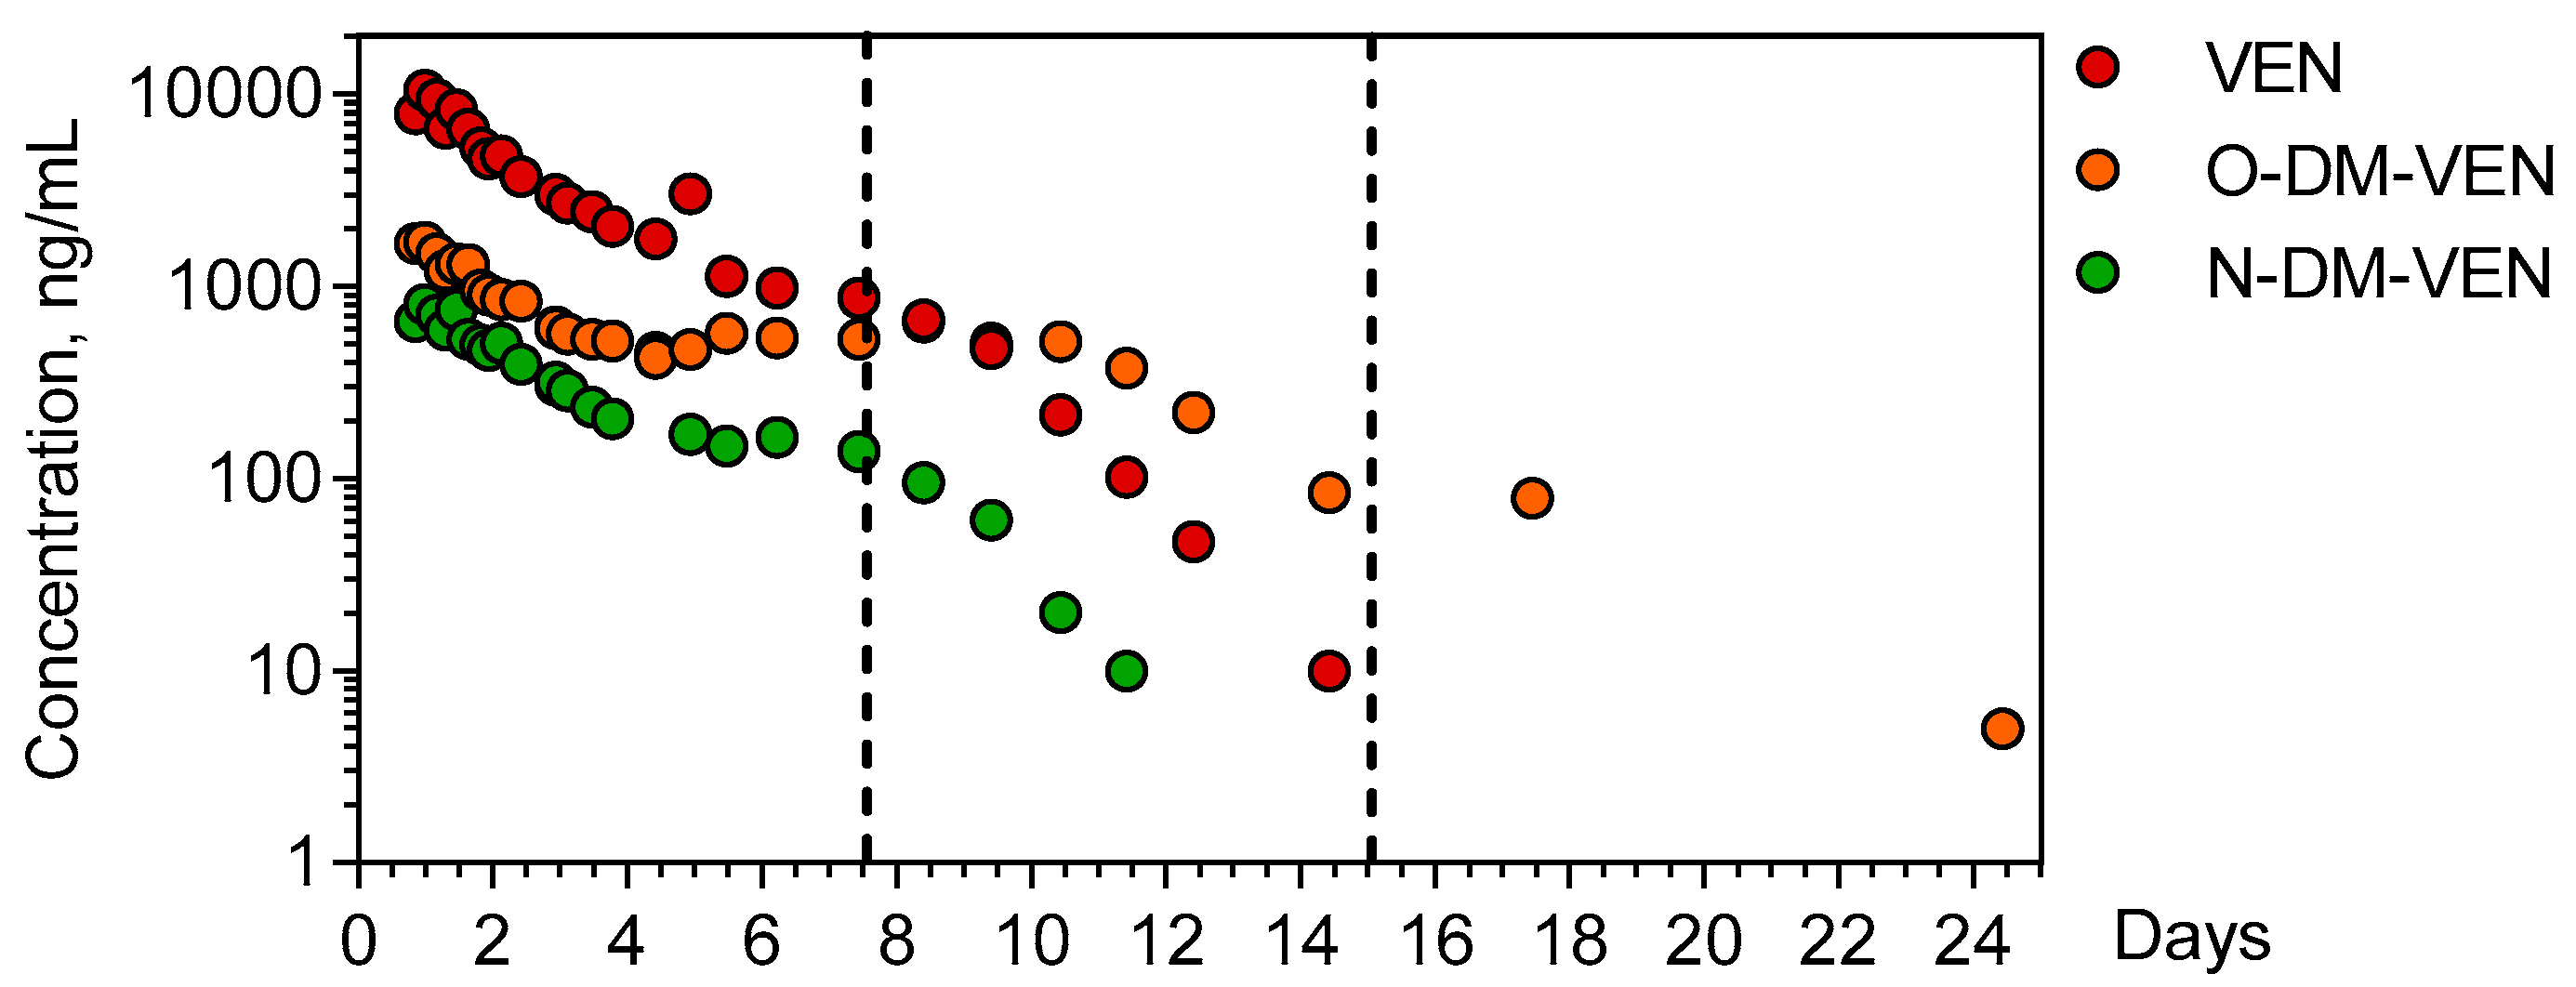
4.1. Pharmacokinetics of Venlafaxine, O-desmethyl-venlafaxine, and N-desmethyl-venlafaxine Metabolites
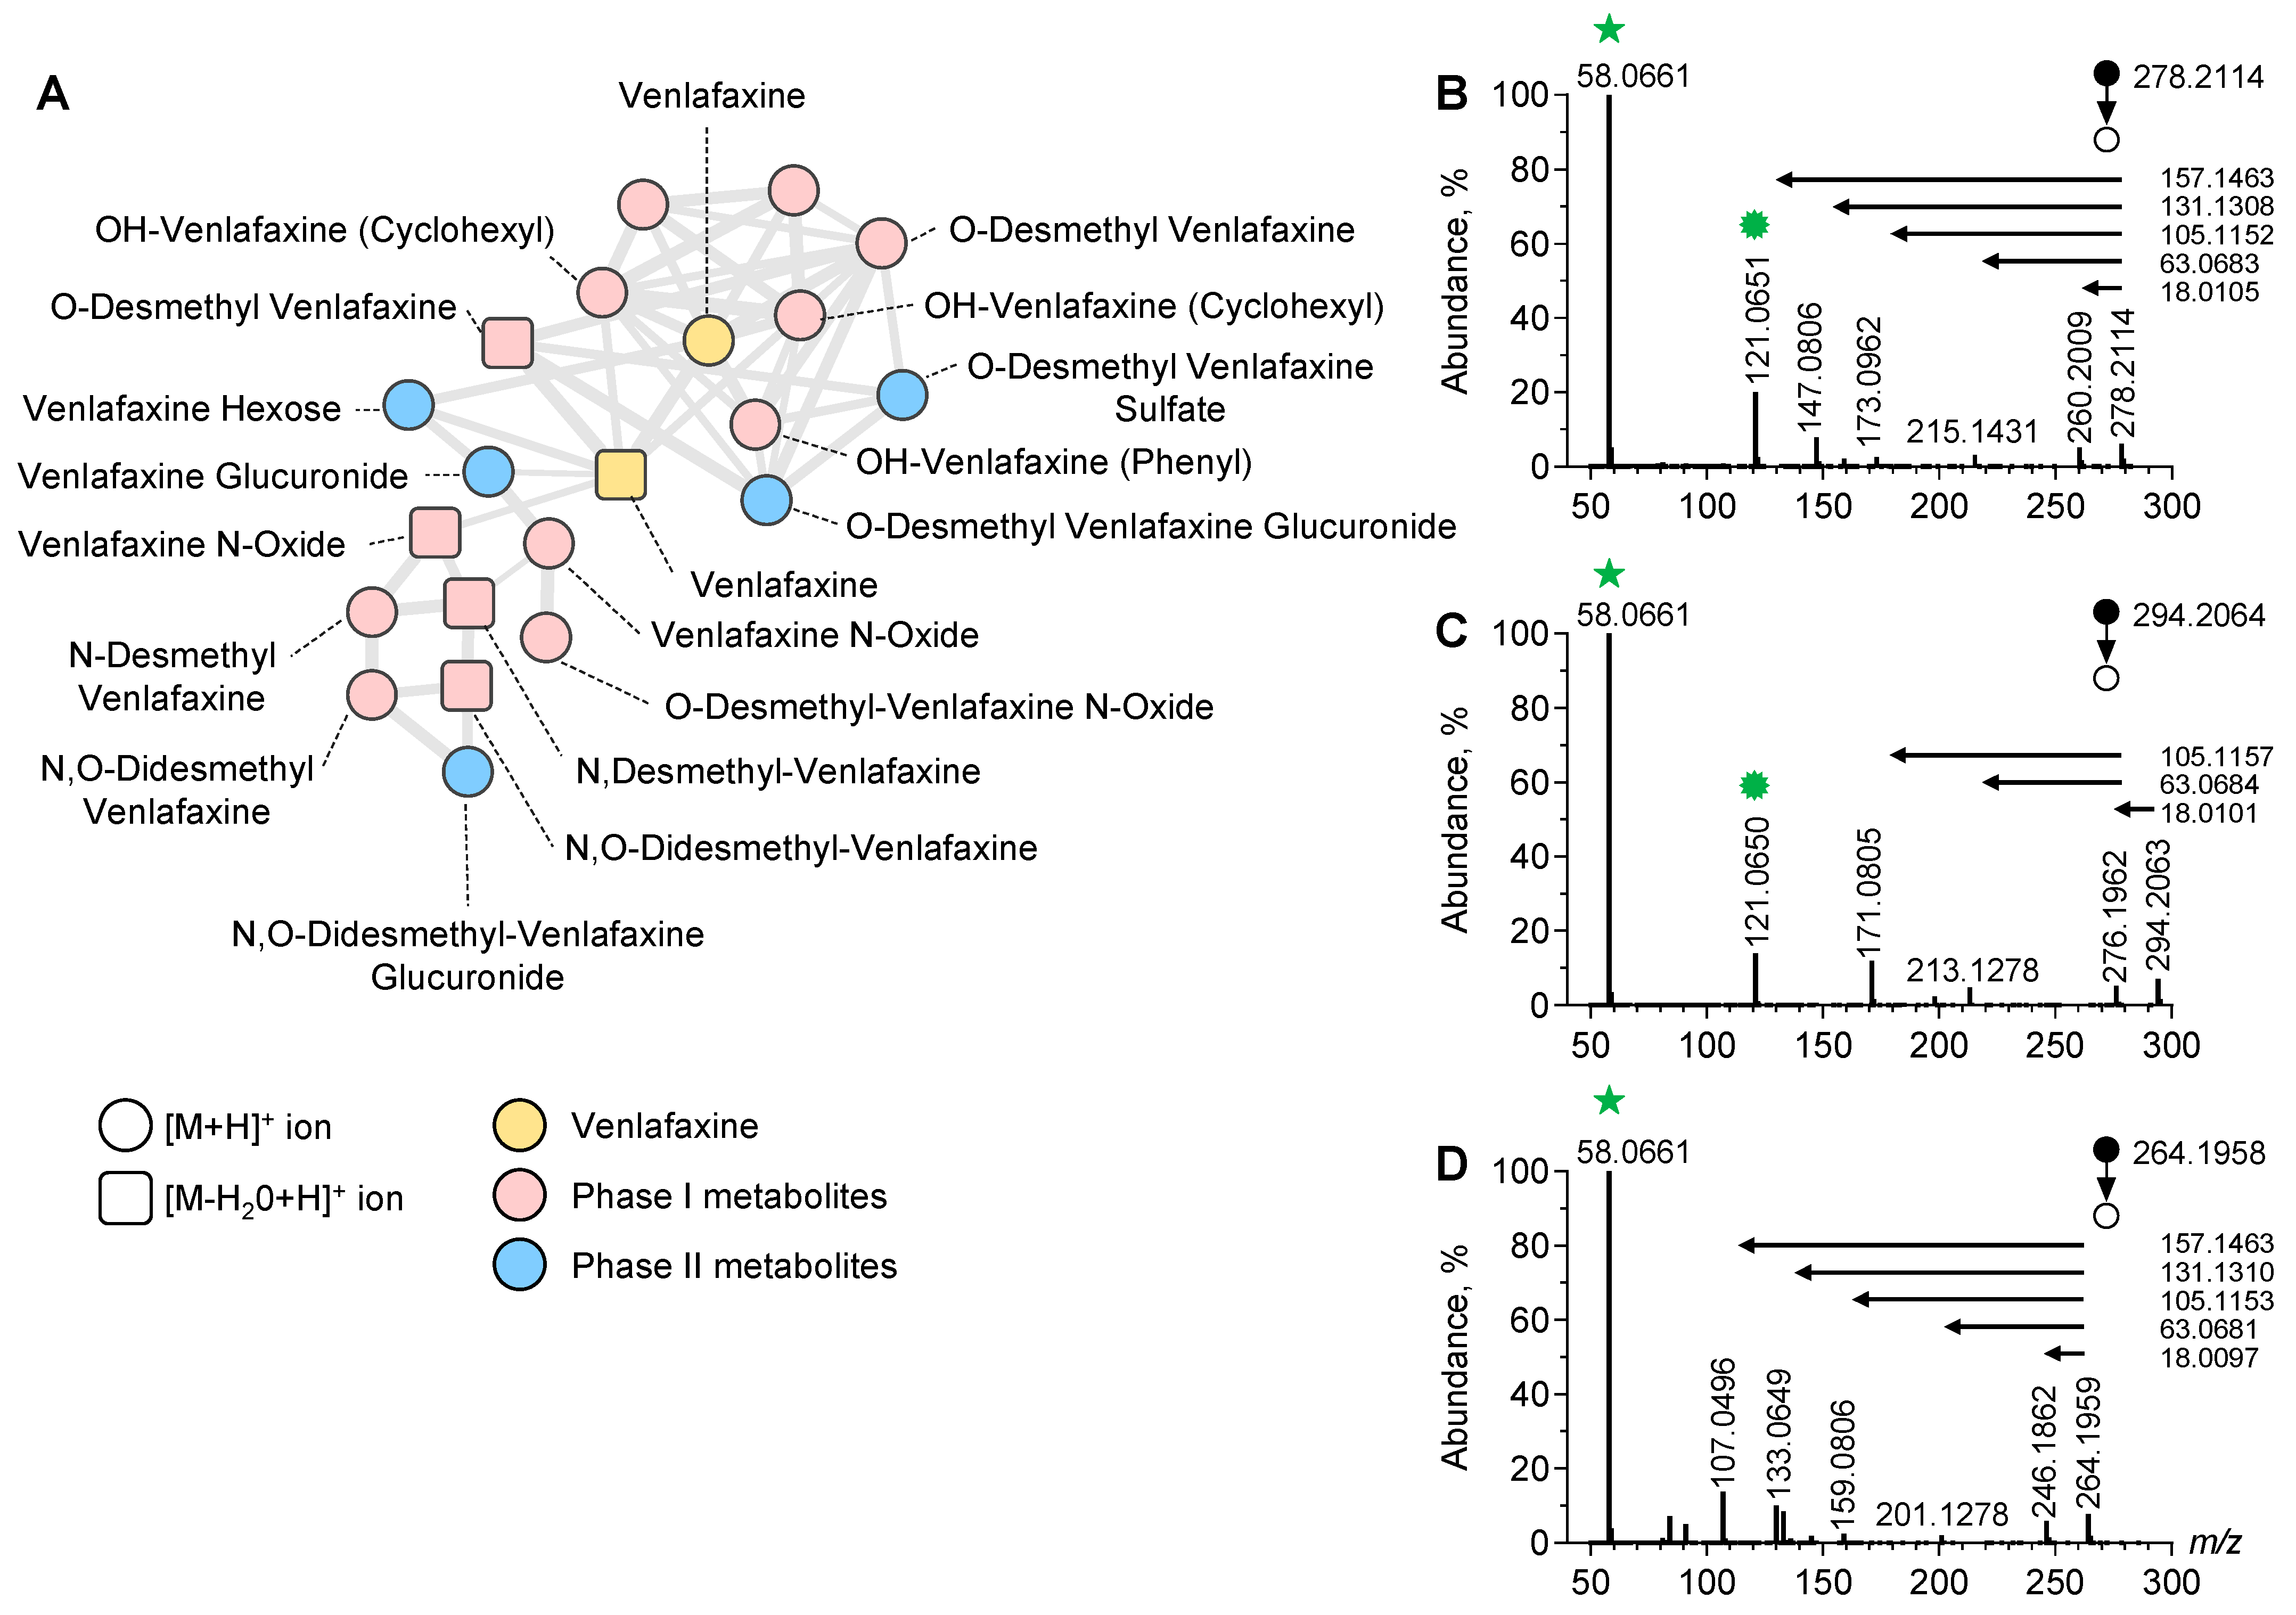
4.2. Identification of Phase-I and Phase-II Metabolites of Venlafaxine
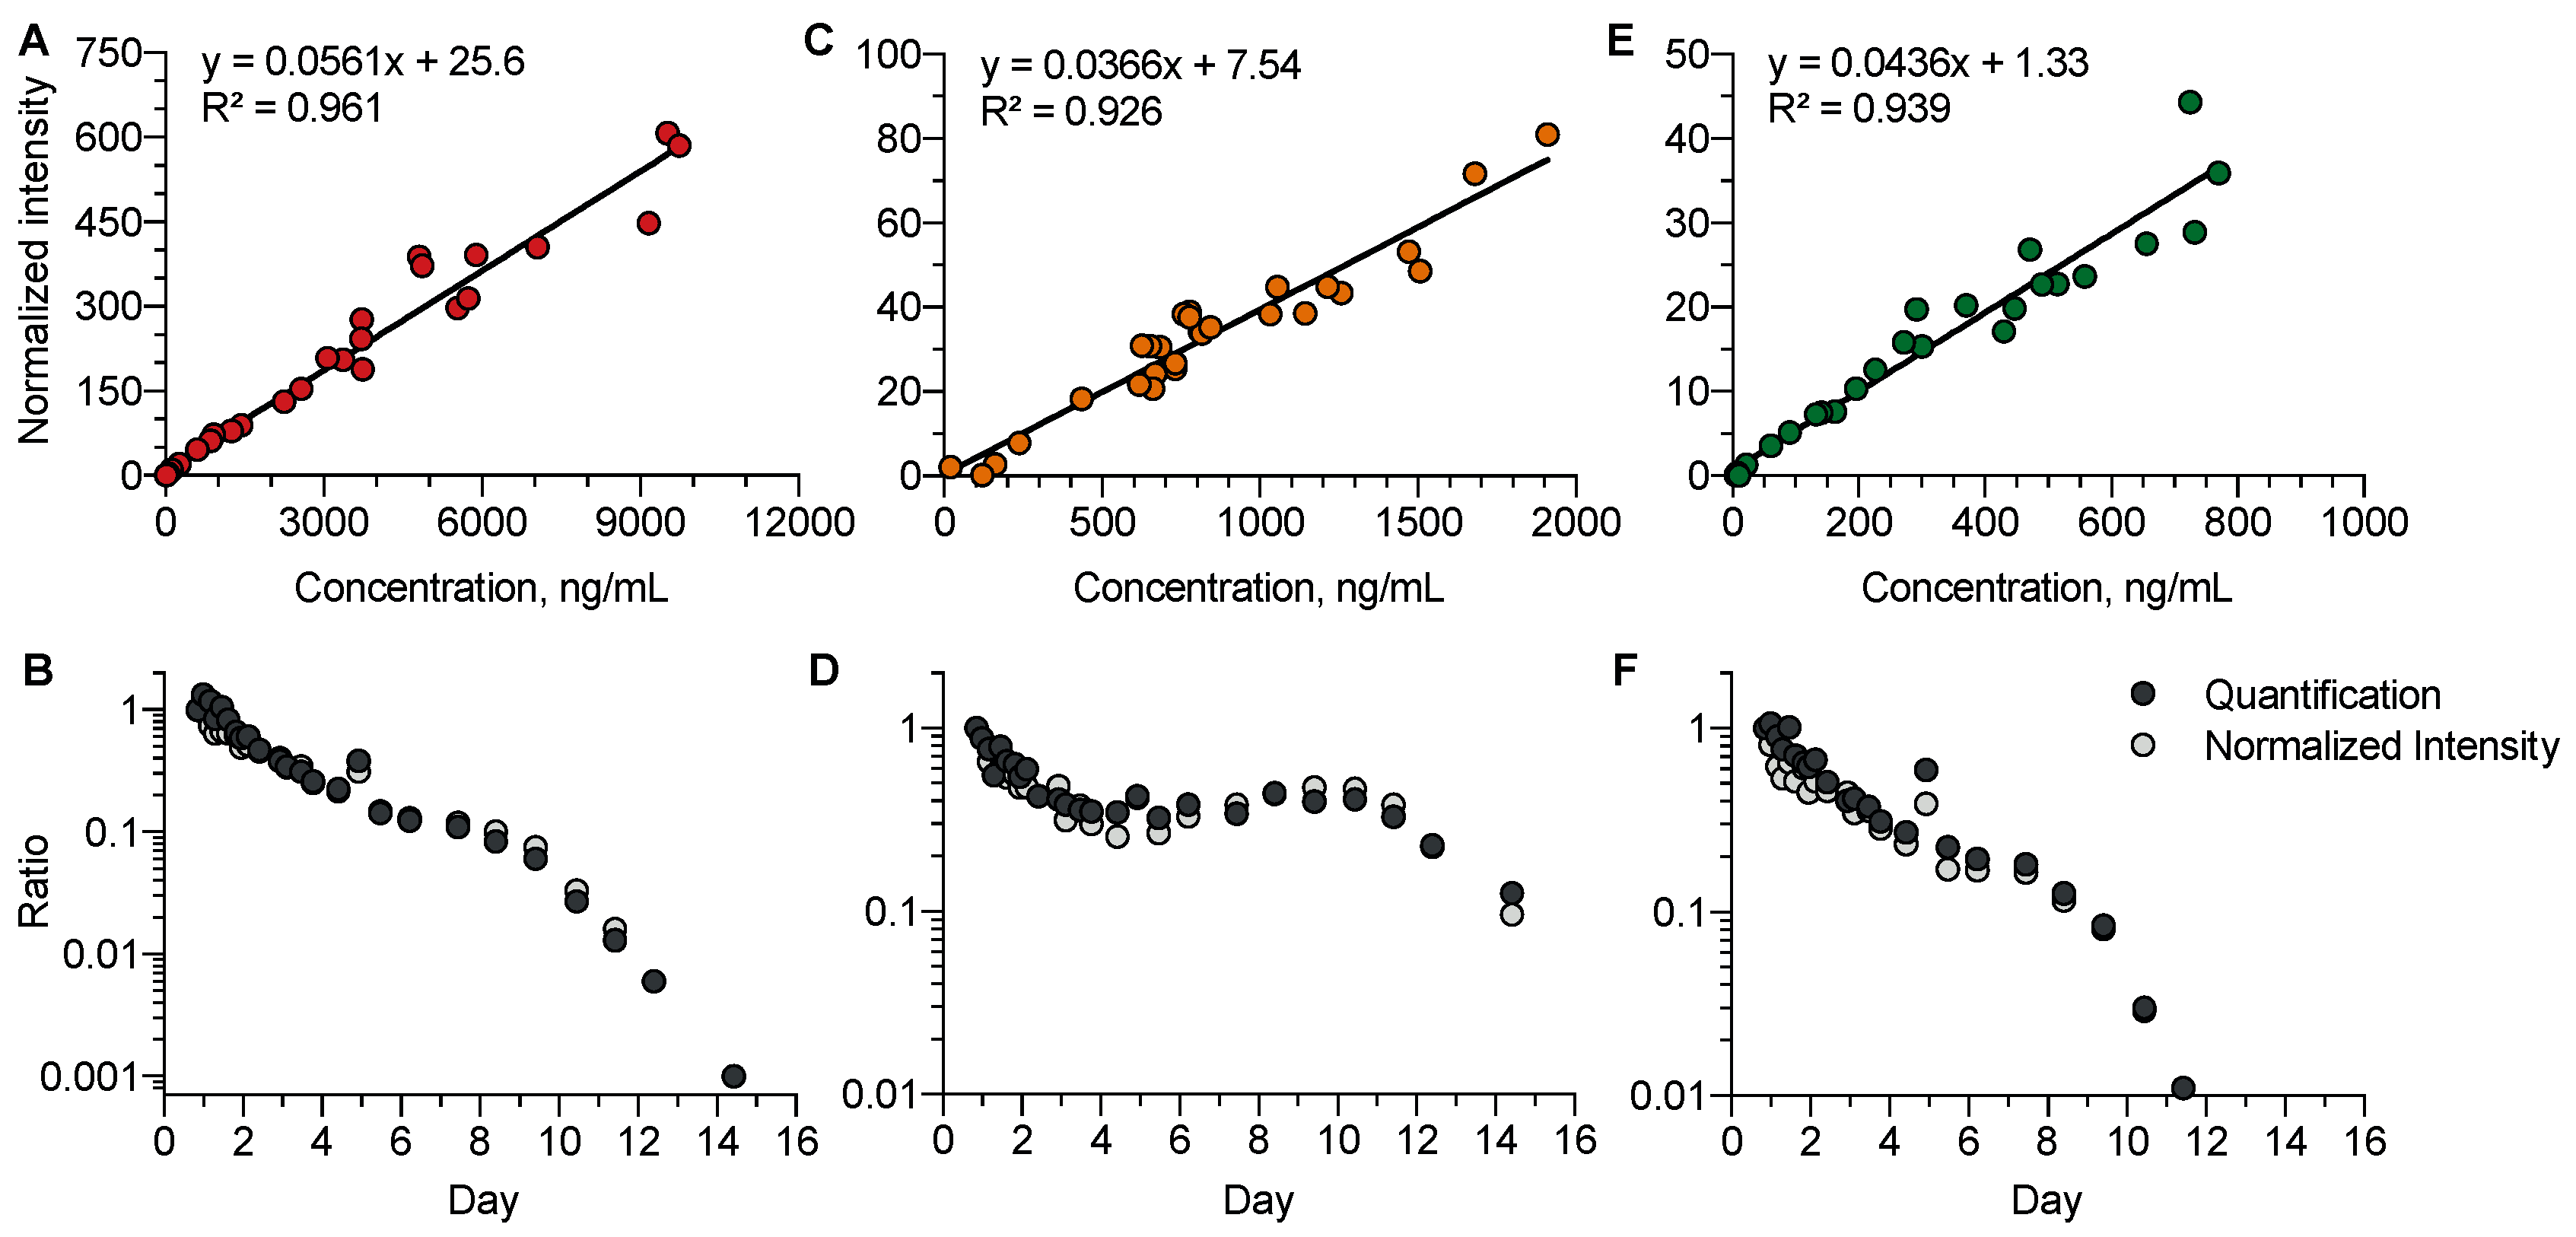
4.3. Comparison of the Absolute Quantification and Semi-Quantification of Venlafaxine, O-Desmethyl-Venlafaxine, and N-Desmethyl-Venlafaxine
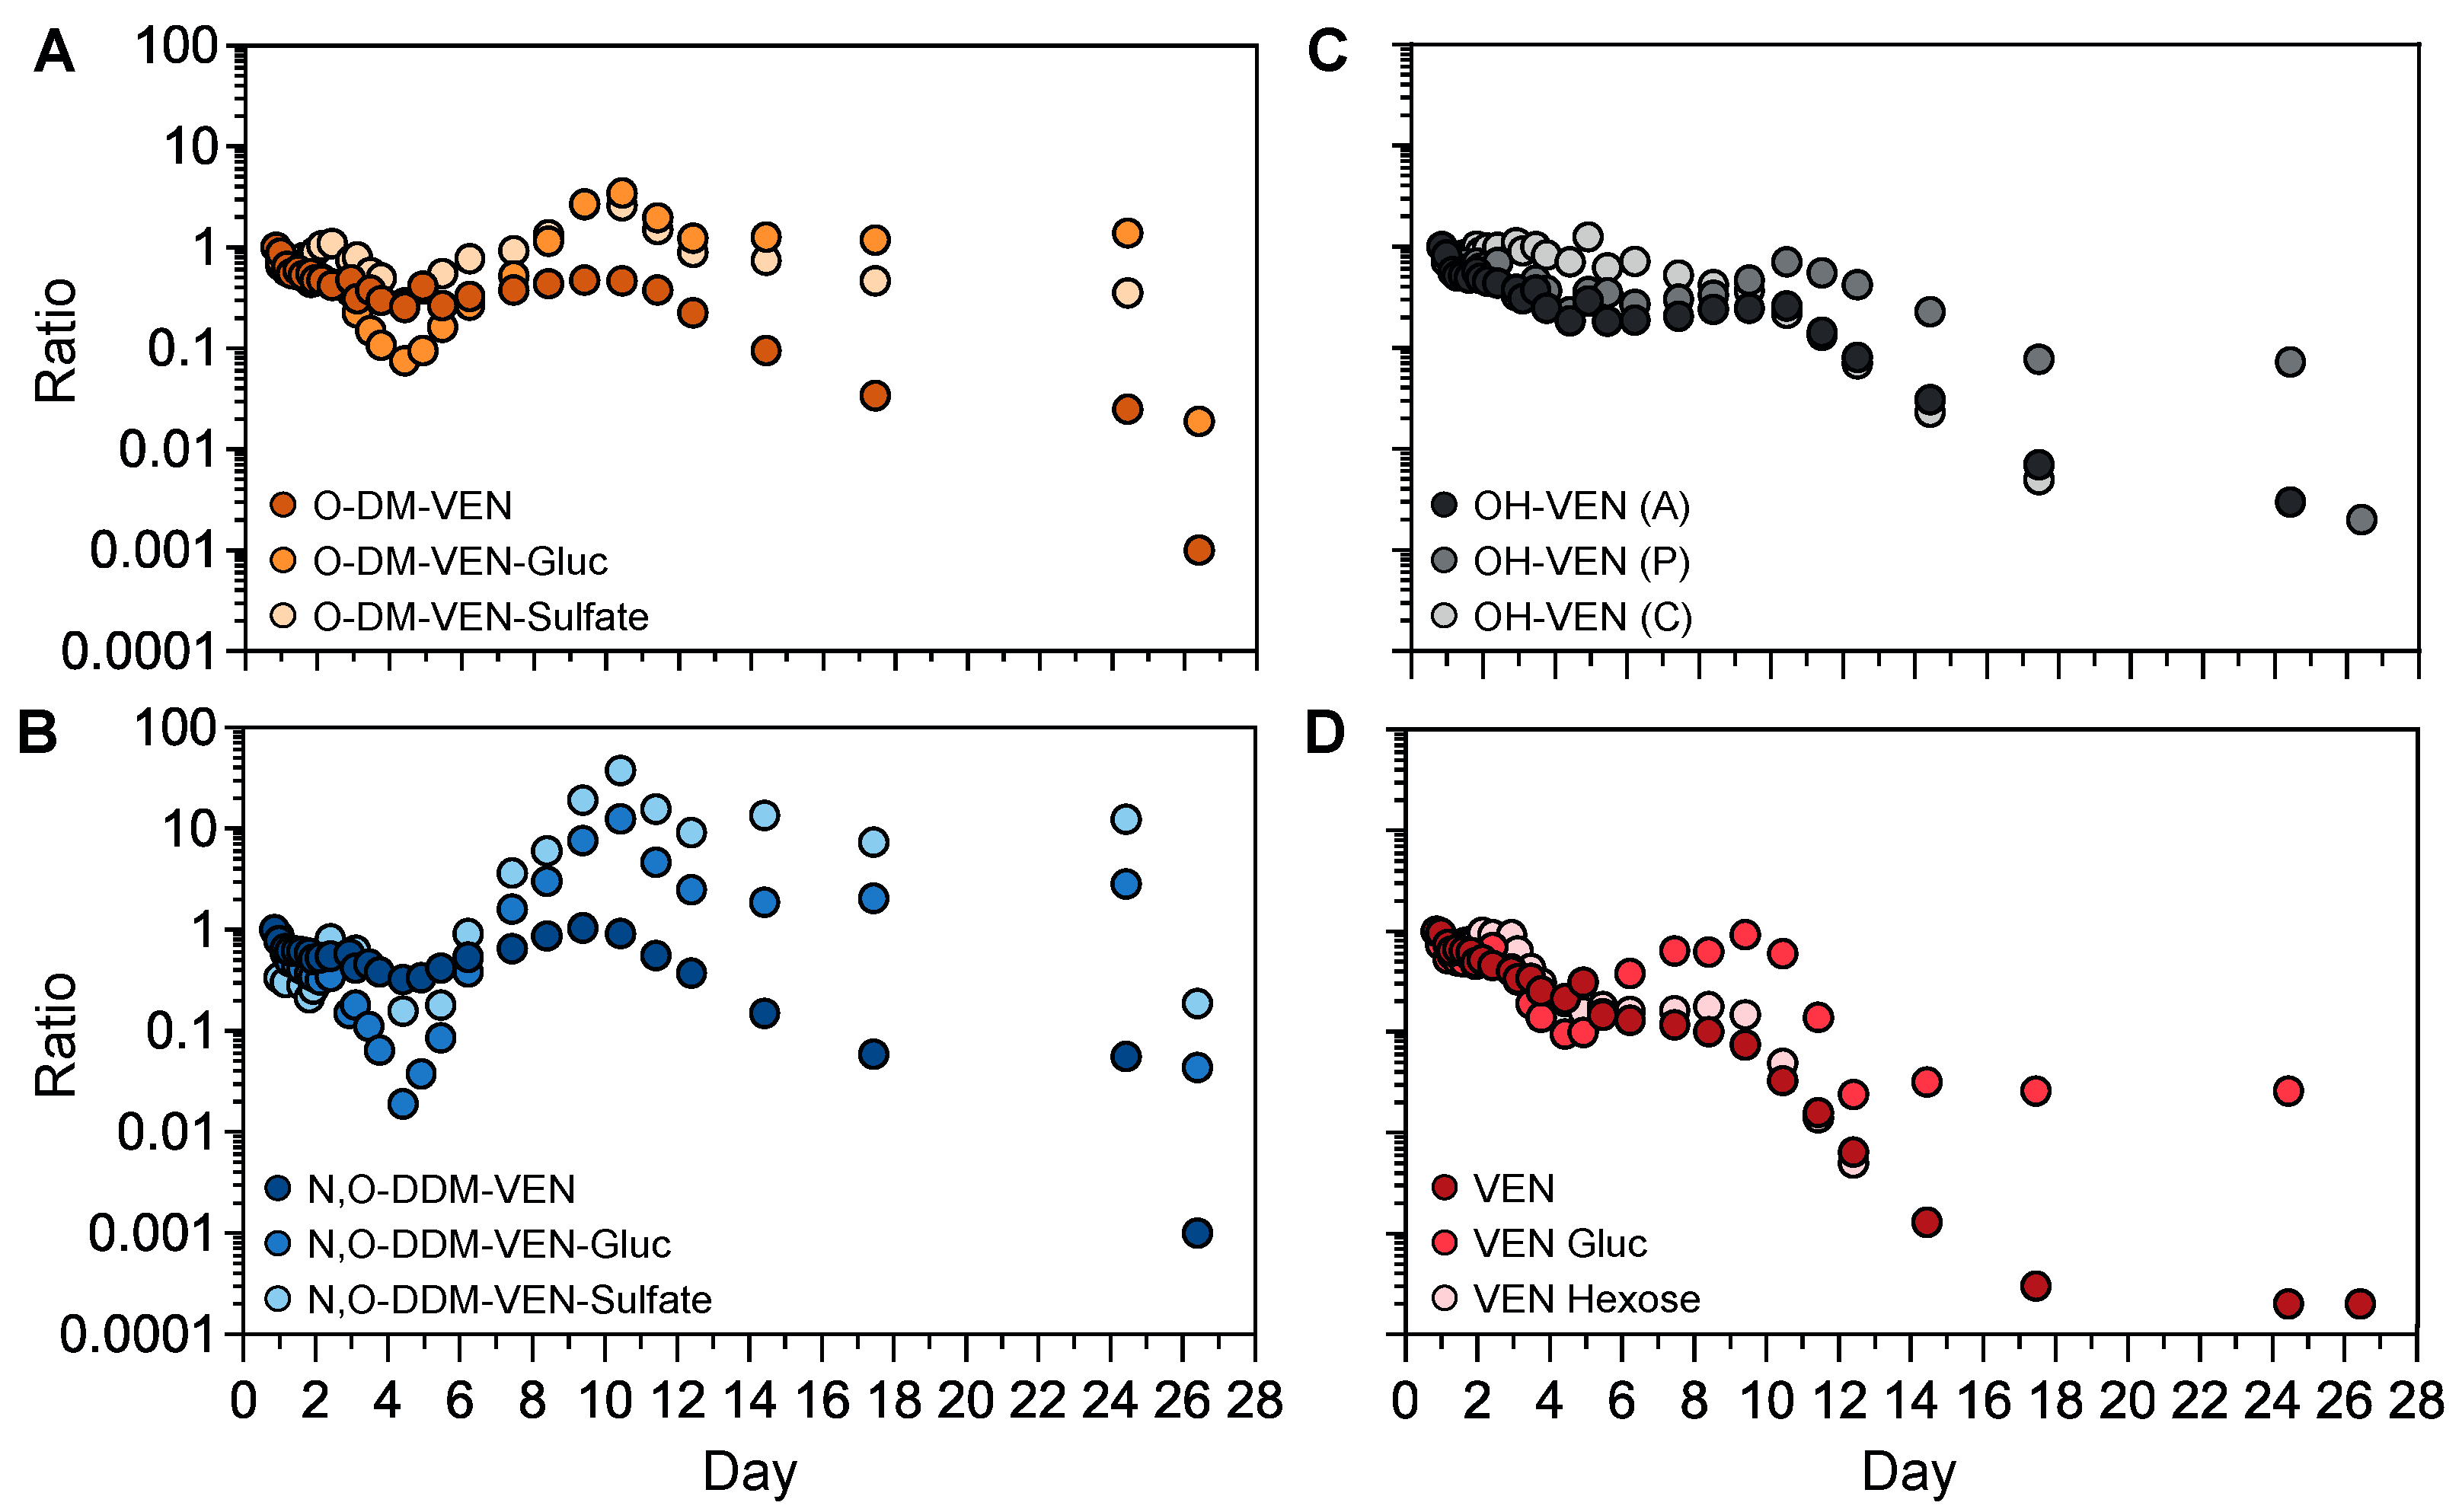
4.4. Kinetic Profiles of the Semi-Quantified Venlafaxine Metabolites
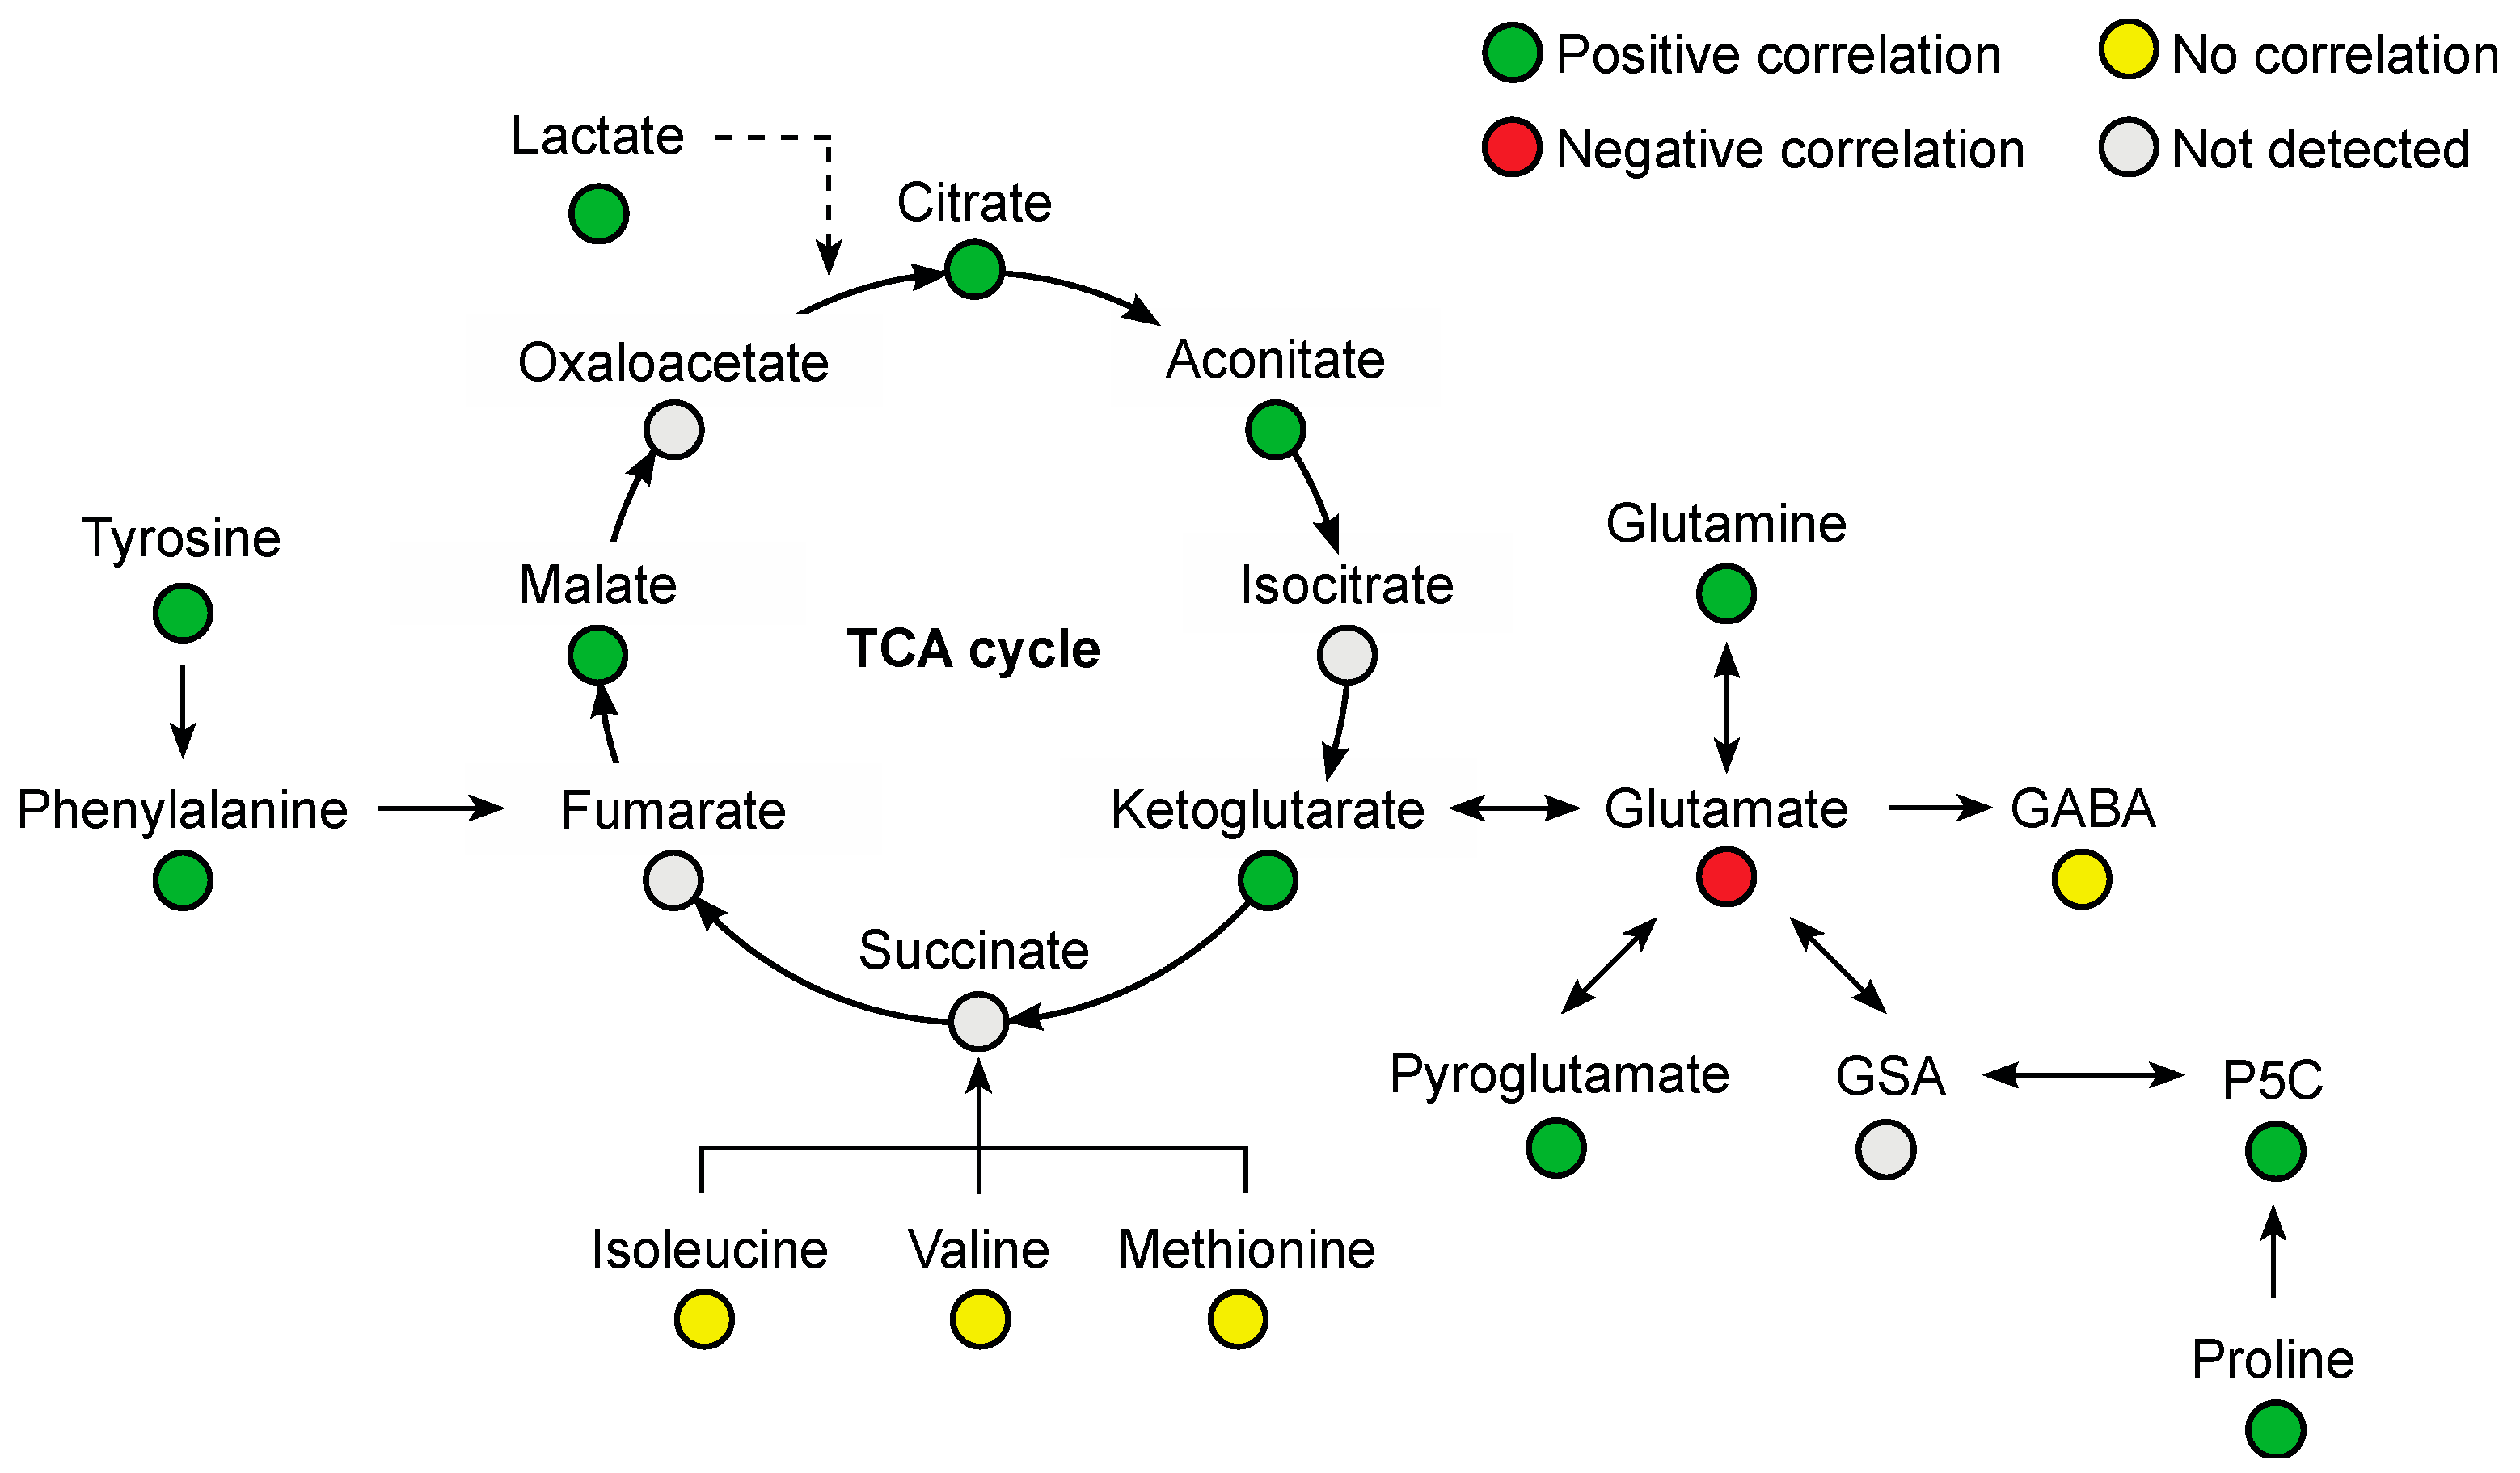
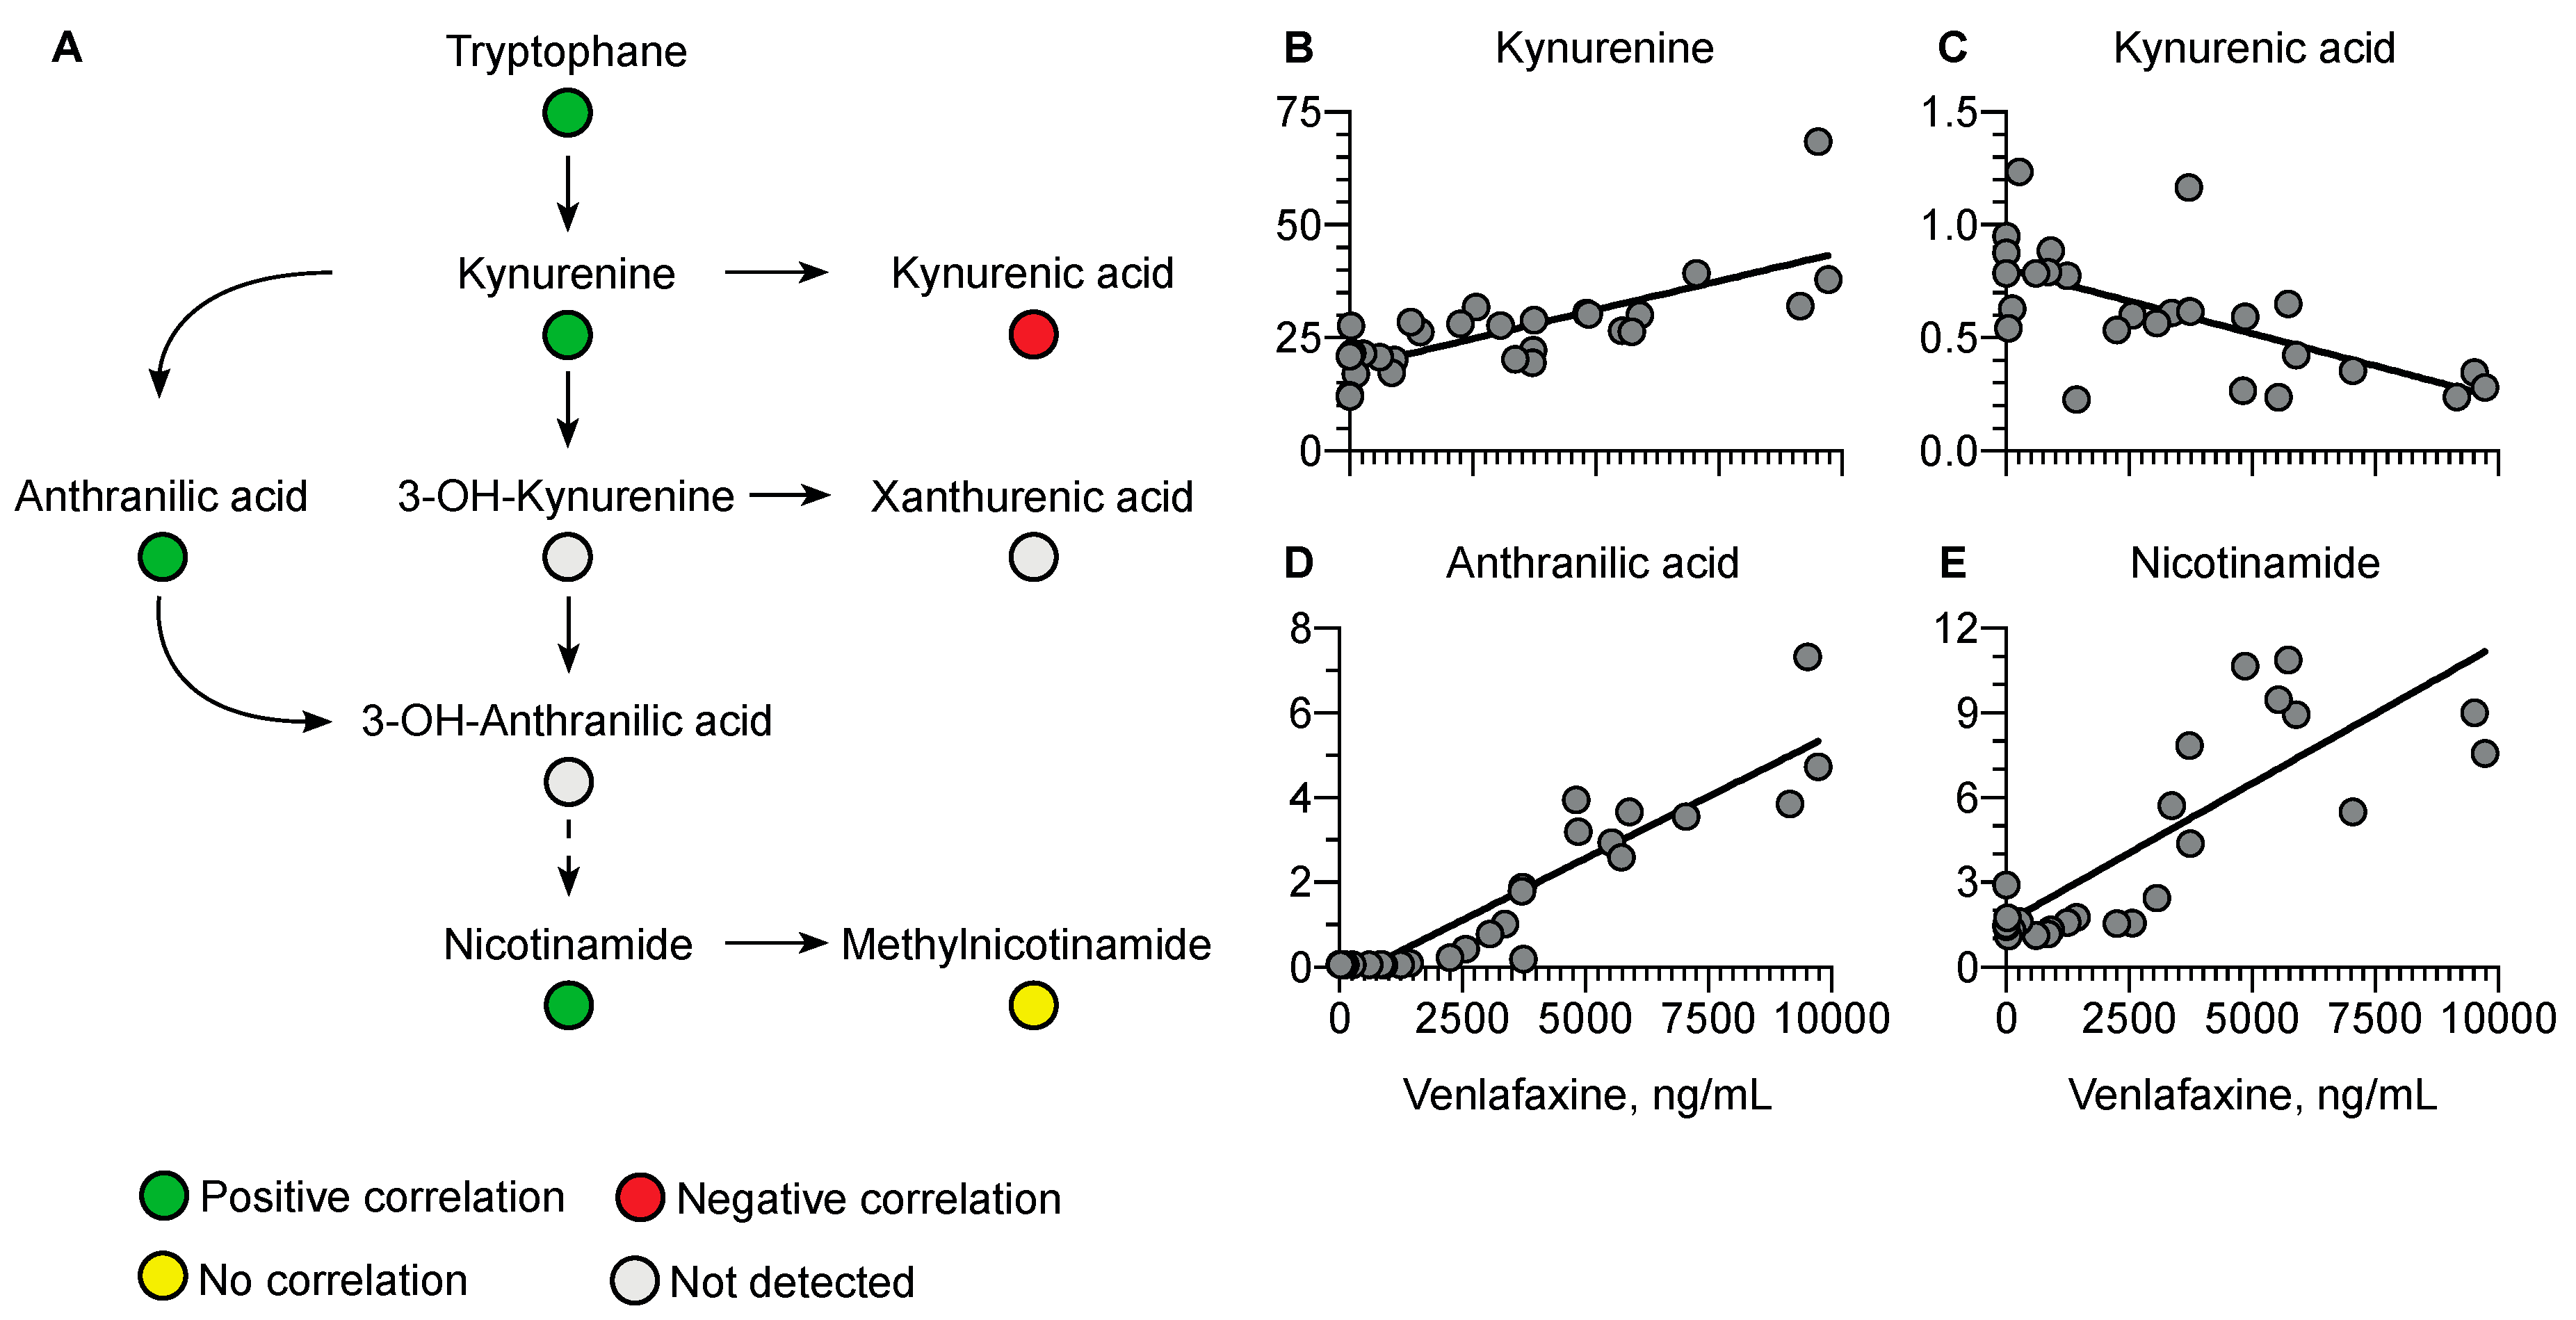
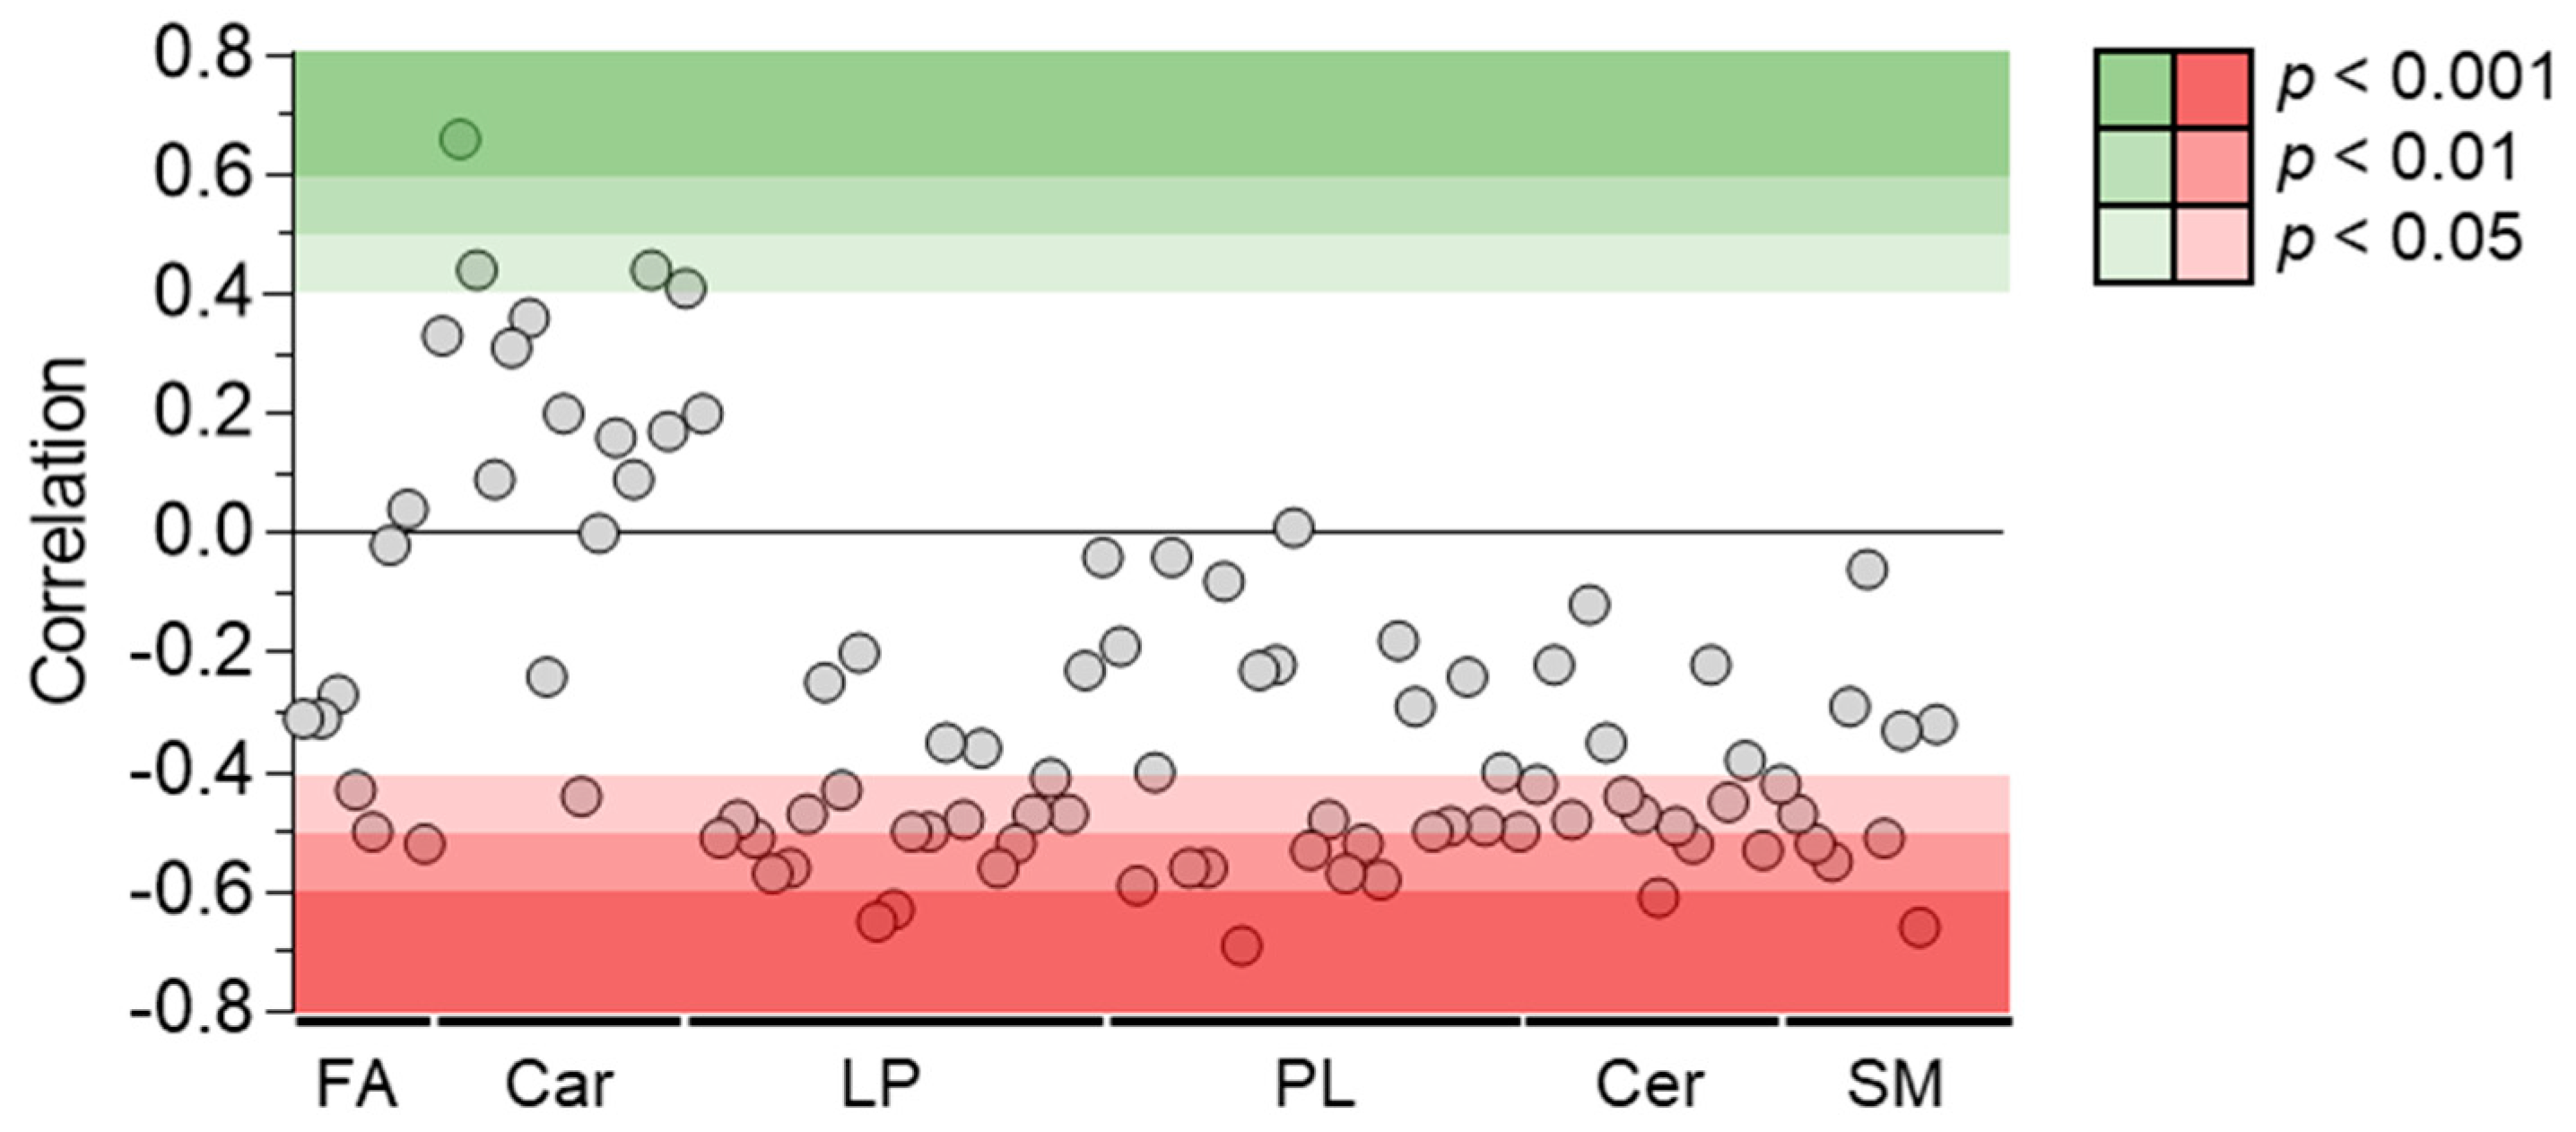
4.5. Effects of Venlafaxine on Plasma Endogenous Metabolites
5. Discussion
6. Conclusions
Supplementary Materials
Author Contributions
Funding
Institutional Review Board Statement
Informed Consent Statement
Data Availability Statement
Acknowledgments
Conflicts of Interest
References
- Malhi, G.S.; Mann, J.J. Depression. Lancet 2018, 392, 2299–2312. [Google Scholar] [CrossRef] [PubMed]
- Howard, P.; Twycross, R.; Shuster, J.; Mihalyo, M.; Wilcock, A. Antidepressant drugs. J. Pain Symptom Manag. 2012, 44, 763–783. [Google Scholar] [CrossRef] [PubMed]
- Wan, G.J.; Crown, W.H.; Berndt, E.R.; Finkelstein, S.N.; Ling, D. Treatment costs of venlafaxine and selective serotonin-reuptake inhibitors for depression and anxiety. Manag. Care Interface 2002, 15, 24–30. [Google Scholar] [PubMed]
- Doyle, J.J.; Casciano, J.; Arikian, S.; Tarride, J.E.; Gonzalez, M.A.; Casciano, R. A multinational pharmacoeconomic evaluation of acute Major Depressive Disorder (MDD): A comparison of cost-effectiveness between venlafaxine, SSRIs and TCAs. Value Health 2001, 4, 16–31. [Google Scholar] [CrossRef] [PubMed]
- Wellington, K.; Perry, C.M. Venlafaxine extended-release: A review of its use in the management of major depression. CNS Drugs 2001, 15, 643–669. [Google Scholar] [CrossRef] [PubMed]
- Gale, C.K.; Millichamp, J. Generalised anxiety disorder. BMJ Clin. Evid. 2007, 2007, 334. [Google Scholar] [CrossRef] [PubMed]
- PT, N. Use of venlafaxine in other psychiatric disorders. Depress. Anxiety 2000, 12 (Suppl. S1), 90–94. [Google Scholar] [CrossRef]
- Magalhães, P.; Alves, G.; Llerena, A.; Falcão, A. Venlafaxine pharmacokinetics focused on drug metabolism and potential biomarkers. Drug Metab. Drug Interact 2014, 29, 129–141. [Google Scholar] [CrossRef]
- Ereshefsky, L.; Dugan, D. Review of the pharmacokinetics, pharmacogenetics, and drug interaction potential of antidepressants: Focus on venlafaxine. Depress. Anxiety 2000, 12 (Suppl. S1), 30–44. [Google Scholar] [CrossRef]
- MacAluso, M.; Preskorn, S.H. CYP 2D6 PM status and antidepressant response to nortriptyline and venlafaxine: Is it more than just drug metabolism? J. Clin. Psychopharmacol. 2011, 31, 143–145. [Google Scholar] [CrossRef]
- Westenberg, H.G.M. Pharmacology of antidepressants: Selectivity or multiplicity? J. Clin. Psychiatry 1999, 60, 4–8. [Google Scholar] [PubMed]
- Hertzog, T.; Cetran, L.; Labadie, M.; Braganca, C.; Goncalves, R. Delayed cardiotoxicity in venlafaxine and quetiapine overdose. Clin. Toxicol. 2021, 59, 1279–1280. [Google Scholar] [CrossRef] [PubMed]
- Batista, M.; Dugernier, T.; Simon, M.; Haufroid, V.; Capron, A.; Fonseca, S.; Bonbled, F.; Hantson, P. The spectrum of acute heart failure after venlafaxine overdose. Clin. Toxicol. 2013, 51, 92–95. [Google Scholar] [CrossRef] [PubMed]
- Höjer, J.; Hulting, J.; Salmonson, H. Fatal cardiotoxicity induced by venlafaxine overdosage. Clin. Toxicol. 2008, 46, 336–337. [Google Scholar] [CrossRef] [PubMed]
- Jasiak, N.M.; Bostwick, J.R. Risk of QT/QTc Prolongation Among Newer Non-SSRI Antidepressants. Ann. Pharmacother. 2014, 48, 1620–1628. [Google Scholar] [CrossRef] [PubMed]
- Born, B.; Hoffer, E.; Fraipont, V.; Joachim, S.; Gougnard, T.; Minon, J.M. Case of refractory cardiogenic shock due to venlafaxine overdose: Illustration of the support with veno-arterial extracorporeal membrane oxygenation. Rev. Med. Liege 2020, 75, 699–702. [Google Scholar] [PubMed]
- Forsberg, S.; Abazi, L.; Forsman, P. Successful use of extended cardiopulmonary resuscitation followed by extracorporeal oxygenation after venlafaxine-induced takotsubo cardiomyopathy and cardiac arrest: A case report. J. Med. Case Rep. 2021, 15, 485. [Google Scholar] [CrossRef] [PubMed]
- Marquetand, C.; Langer, H.F.; Klein, J.P.; Graf, T. The Use of Extracorporeal Life Support in a Patient Suffering from Venlafaxine Intoxication. A Case Report. J. Crit. Care Med. 2020, 6120–6123. [Google Scholar] [CrossRef]
- Schroeder, I.; Zoller, M.; Angstwurm, M.; Kur, F.; Frey, L. Venlafaxine intoxication with development of takotsubo cardiomyopathy: Successful use of extracorporeal life support, intravenous lipid emulsion and CytoSorb®. Int. J. Artif. Organs 2017, 40, 358–360. [Google Scholar] [CrossRef]
- Murphy, L.; Rasmussen, J.; Murphy, N.G. Venlafaxine overdose treated with extracorporeal life support. CMAJ 2021, 193, E167–E170. [Google Scholar] [CrossRef]
- Gowda, G.A.N.; Zhang, S.; Gu, H.; Asiago, V.; Shanaiah, N.; Raftery, D. Metabolomics-based methods for early disease diagnostics. Expert Rev. Mol. Diagn 2008, 8, 617–633. [Google Scholar] [CrossRef] [PubMed]
- Johnson, C.H.; Ivanisevic, J.; Siuzdak, G. Metabolomics: Beyond biomarkers and towards mechanisms. Nat. Rev. Mol. Cell Biol. 2016, 17, 451–459. [Google Scholar] [CrossRef] [PubMed]
- Wishart, D.S. Metabolomics for investigating physiological and pathophysiological processes. Physiol. Rev. 2019, 99, 1819–1875. [Google Scholar] [CrossRef] [PubMed]
- Szeremeta, M.; Pietrowska, K.; Niemcunowicz-Janica, A.; Kretowski, A.; Ciborowski, M. Applications of metabolomics in forensic toxicology and forensic medicine. Int. J. Mol. Sci. 2021, 22, 3010. [Google Scholar] [CrossRef] [PubMed]
- Araújo, A.M.; Carvalho, F.; de Pinho, P.G.; Carvalho, M. Toxicometabolomics: Small Molecules to Answer Big Toxicological Questions. Metabolites 2021, 11, 692. [Google Scholar] [CrossRef]
- Nothias, L.F.; Petras, D.; Schmid, R.; Dührkop, K.; Rainer, J.; Sarvepalli, A.; Protsyuk, I.; Ernst, M.; Tsugawa, H.; Fleischauer, M.; et al. Feature-based molecular networking in the GNPS analysis environment. Nat. Methods 2020, 17, 905–908. [Google Scholar] [CrossRef]
- Quinn, R.A.; Nothias, L.F.; Vining, O.; Meehan, M.; Esquenazi, E.; Dorrestein, P.C. Molecular Networking as a Drug Discovery, Drug Metabolism, and Precision Medicine Strategy. Trends Pharm. Sci. 2017, 38, 143–154. [Google Scholar] [CrossRef]
- Wang, M.; Carver, J.J.; Phelan, V.V.; Sanchez, L.M.; Garg, N.; Peng, Y.; Nguyen, D.D.; Watrous, J.; Kapono, C.A.; Luzzatto-Knaan, T.; et al. Sharing and community curation of mass spectrometry data with Global Natural Products Social Molecular Networking. Nat. Biotechnol. 2016, 34, 828–837. [Google Scholar] [CrossRef]
- van der Hooft, J.J.J.; Padmanabhan, S.; Burgess, K.E.V.; Barrett, M.P. Urinary antihypertensive drug metabolite screening using molecular networking coupled to high-resolution mass spectrometry fragmentation. Metabolomics 2016, 12, 1–15. [Google Scholar] [CrossRef]
- Magny, R.; Regazzetti, A.; Kessal, K.; Genta-Jouve, G.; Baudouin, C.; Mélik-Parsadaniantz, S.; Brignole-Baudouin, F.; Laprévote, O.; Auzeil, N. Lipid Annotation by Combination of UHPLC-HRMS (MS), Molecular Networking, and Retention Time Prediction: Application to a Lipidomic Study of In Vitro Models of Dry Eye Disease. Metabolites 2020, 10, 225. [Google Scholar] [CrossRef]
- Cajka, T.; Fiehn, O. Toward Merging Untargeted and Targeted Methods in Mass Spectrometry-Based Metabolomics and Lipidomics. Anal Chem. 2016, 88, 524–545. [Google Scholar] [CrossRef] [PubMed]
- Bai, S.; Hu, Q.; Chen, Z.; Liang, Z.; Wang, W.; Shen, P.; Wang, T.; Wang, H.; Xie, P. Brain region-specific metabolite networks regulate antidepressant effects of venlafaxine. RSC Adv. 2017, 7, 46358–46369. [Google Scholar] [CrossRef]
- Bai, S.; Zhang, X.; Chen, Z.; Wang, W.; Hu, Q.; Liang, Z.; Shen, P.; Gui, S.; Zeng, L.; Liu, Z.; et al. Insight into the metabolic mechanism of Diterpene Ginkgolides on antidepressant effects for attenuating behavioural deficits compared with venlafaxine. Sci. Rep. 2017, 7, 9591. [Google Scholar] [CrossRef]
- Kessner, D.; Chambers, M.; Burke, R.; Agus, D.; Mallick, P. ProteoWizard: Open source software for rapid proteomics tools development. Bioinformatics 2008, 24, 2534–2536. [Google Scholar] [CrossRef]
- Adusumilli, R.; Mallick, P. Data conversion with proteoWizard msConvert. In Methods in Molecular Biology; Humana Press Inc.: Totowa, NJ, USA, 2017; pp. 339–368. [Google Scholar]
- Pluskal, T.; Castillo, S.; Villar-Briones, A.; Orešič, M. MZmine 2: Modular framework for processing, visualizing, and analyzing mass spectrometry-based molecular profile data. BMC Bioinform. 2010, 11, 395. [Google Scholar] [CrossRef] [PubMed]
- Magny, R.; Auzeil, N.; Lefrère, B.; Mégarbane, B.; Houzé, P.; Labat, L. Molecular Network-Based Identification of Tramadol Metabolites in a Fatal Tramadol Poisoning. Metabolites 2022, 12, 665. [Google Scholar] [CrossRef] [PubMed]
- Myers, O.D.; Sumner, S.J.; Li, S.; Barnes, S.; Du, X. One Step Forward for Reducing False Positive and False Negative Compound Identifications from Mass Spectrometry Metabolomics Data: New Algorithms for Constructing Extracted Ion Chromatograms and Detecting Chromatographic Peaks. Anal Chem. 2017, 89, 8696–8703. [Google Scholar] [CrossRef]
- Olivon, F.; Elie, N.; Grelier, G.; Roussi, F.; Litaudon, M.; Touboul, D. MetGem Software for the Generation of Molecular Networks Based on the t-SNE Algorithm. Anal Chem. 2018, 90, 13900–13908. [Google Scholar] [CrossRef]
- Shannon, P.; Markiel, A.; Ozier, O.; Baliga, N.S.; Wang, J.T.; Ramage, D.; Amin, N.; Schwikowski, B.; Ideker, T. Cytoscape: A software Environment for integrated models of biomolecular interaction networks. Genome Res. 2003, 13, 2498–2504. [Google Scholar] [CrossRef]
- Dührkop, K.; Fleischauer, M.; Ludwig, M.; Aksenov, A.A.; Melnik, A.V.; Meusel, M.; Dorrestein, P.C.; Rousu, J.; Böcker, S. SIRIUS 4: A rapid tool for turning tandem mass spectra into metabolite structure information. Nat. Methods 2019, 16, 299–302. [Google Scholar] [CrossRef]
- Schulz, M.; Schmoldt, A.; Andresen-Streichert, H.; Iwersen-Bergmann, S. Revisited: Therapeutic and toxic blood concentrations of more than 1100 drugs and other xenobiotics. Crit. Care 2020, 24, 195. [Google Scholar] [CrossRef] [PubMed]
- Klamerus, K.J.; Moloney, K.; Rudolph, R.L.; Sisenwine, S.F.; Jusko, W.J.; Chiang, S.T. Introduction of a Composite Parameter to the Pharmacokinetics of Venlafaxine and its Active O-Desmethyl Metabolite. J. Clin. Pharmacol. 1992, 32, 716–724. [Google Scholar] [CrossRef]
- Panitchpakdi, M.; Weldon, K.C.; Jarmusch, A.K.; Gentry, E.C.; Choi, A.; Sepulveda, Y.; Aguirre, S.; Sun, K.; Momper, J.D.; Dorrestein, P.C.; et al. Non-invasive skin sampling detects systemically administered drugs in humans. PLoS ONE 2022, 17, e0271794. [Google Scholar] [CrossRef] [PubMed]
- Sumner, L.W.; Amberg, A.; Barrett, D.; Beale, M.H.; Beger, R.; Daykin, C.A.; Fan, T.W.M.; Fiehn, O.; Goodacre, R.; Griffin, J.L.; et al. Proposed minimum reporting standards for chemical analysis: Chemical Analysis Working Group (CAWG) Metabolomics Standards Initiative (MSI). Metabolomics 2007, 3, 211–221. [Google Scholar] [CrossRef]
- Koppel, N.; Rekdal, V.M.; Balskus, E.P. Chemical transformation of xenobiotics by the human gut microbiota. Science 2017, 356, 1246–1257. [Google Scholar] [CrossRef] [PubMed]
- Sun, L.; Fang, L.; Lian, B.; Xia, J.J.; Zhou, C.J.; Wang, L.; Mao, Q.; Wang, X.F.; Gong, X.; Liang, Z.H.; et al. Biochemical effects of venlafaxine on astrocytes as revealed by 1H NMR-based metabolic profiling. Mol. Biosyst. 2017, 13, 338–349. [Google Scholar] [CrossRef]
- Milanese, M.; Tardito, D.; Musazzi, L.; Treccani, G.; Mallei, A.; Bonifacino, T.; Gabriel, C.; Mocaer, E.; Racagni, G.; Popoli, M.; et al. Chronic treatment with agomelatine or venlafaxine reduces depolarization-evoked glutamate release from hippocampal synaptosomes. BMC Neurosci. 2013, 14, 75. [Google Scholar] [CrossRef]
- Aldosary, F.; Norris, S.; Tremblay, P.; James, J.S.; Ritchie, J.C.; Blier, P. Differential Potency of Venlafaxine, Paroxetine, and Atomoxetine to Inhibit Serotonin and Norepinephrine Reuptake in Patients with Major Depressive Disorder. Int. J. Neuropsychopharmacol. 2022, 25, 283–292. [Google Scholar] [CrossRef]
- Blier, P.; Saint-André, É.; Hébert, C.; de Montigny, C.; Lavoie, N.; Debonnel, G. Effects of different doses of venlafaxine on serotonin and norepinephrine reuptake in healthy volunteers. Int. J. Neuropsychopharmacol. 2007, 10, 41–50. [Google Scholar] [CrossRef]
- Miura, H.; Ozaki, N.; Sawada, M.; Isobe, K.; Ohta, T.; Nagatsu, T. A link between stress and depression: Shifts in the balance between the kynurenine and serotonin pathways of tryptophan metabolism and the etiology and pathophysiology of depression. Stress 2009, 11, 198–209. [Google Scholar] [CrossRef]
- Correia, A.S.; Vale, N. Tryptophan Metabolism in Depression: A Narrative Review with a Focus on Serotonin and Kynurenine Pathways. Int. J. Mol. Sci. 2022, 23, 8493. [Google Scholar] [CrossRef] [PubMed]
- Kanai, M.; Funakoshi, H.; Takahashi, H.; Hayakawa, T.; Mizuno, S.; Matsumoto, K.; Nakamura, T. Tryptophan 2,3-dioxygenase is a key modulator of physiological neurogenesis and anxiety-related behavior in mice. Mol. Brain 2009, 2, 8. [Google Scholar] [CrossRef] [PubMed]
- Qiao, M.; Jiang, Q.S.; Liu, Y.J.; Hu, X.Y.; Wang, L.J.; Zhou, Q.X.; Qiu, H.M. Antidepressant mechanisms of venlafaxine involving increasing histone acetylation and modulating tyrosine hydroxylase and tryptophan hydroxylase expression in hippocampus of depressive rats. Neuroreport 2019, 30, 255–261. [Google Scholar] [CrossRef] [PubMed]
- Dawood, S.; Bano, S.; Badawy, A.A.B. Inflammation and serotonin deficiency in major depressive disorder: Molecular docking of antidepressant and anti-inflammatory drugs to tryptophan and indoleamine 2,3-dioxygenases. Biosci. Rep. 2022, 42, BSR20220426. [Google Scholar] [CrossRef] [PubMed]
- Wigner, P.; Synowiec, E.; Jóźwiak, P.; Czarny, P.; Bijak, M.; Białek, K.; Szemraj, J.; Gruca, P.; Papp, M.; Śliwiński, T. The Effect of Chronic Mild Stress and Venlafaxine on the Expression and Methylation Levels of Genes Involved in the Tryptophan Catabolites Pathway in the Blood and Brain Structures of Rats. J. Mol. Neurosci. 2020, 70, 1425–1436. [Google Scholar] [CrossRef]
- Brouns, R.; Verkerk, R.; Aerts, T.; de Surgeloose, D.; Wauters, A.; Scharpé, S.; de Deyn, P.P. The role of tryptophan catabolism along the kynurenine pathway in acute ischemic stroke. Neurochem. Res. 2010, 35, 1315–1322. [Google Scholar] [CrossRef]
- Ristagno, G.; Latini, R.; Vaahersalo, J.; Masson, S.; Kurola, J.; Varpula, T.; Lucchetti, J.; Fracasso, C.; Guiso, G.; Montanelli, A.; et al. Early activation of the kynurenine pathway predicts early death and long-term outcome in patients resuscitated from out-of-hospital cardiac arrest. J. Am. Heart Assoc. 2014, 3, e001094. [Google Scholar] [CrossRef] [PubMed]
- Loretz, N.; Becker, C.; Hochstrasser, S.; Metzger, K.; Beck, K.; Mueller, J.; Gross, S.; Vincent, A.; Amacher, S.A.; Sutter, R.; et al. Activation of the kynurenine pathway predicts mortality and neurological outcome in cardiac arrest patients: A validation study. J. Crit. Care 2022, 67, 57–65. [Google Scholar] [CrossRef]


Disclaimer/Publisher’s Note: The statements, opinions and data contained in all publications are solely those of the individual author(s) and contributor(s) and not of MDPI and/or the editor(s). MDPI and/or the editor(s) disclaim responsibility for any injury to people or property resulting from any ideas, methods, instructions or products referred to in the content. |
© 2023 by the authors. Licensee MDPI, Basel, Switzerland. This article is an open access article distributed under the terms and conditions of the Creative Commons Attribution (CC BY) license (https://creativecommons.org/licenses/by/4.0/).
Share and Cite
Magny, R.; Mégarbane, B.; Guillaud, P.; Chevillard, L.; Auzeil, N.; Thiebot, P.; Voicu, S.; Malissin, I.; Deye, N.; Labat, L.; et al. Life-Threatening Cardiogenic Shock Related to Venlafaxine Poisoning—A Case Report with Metabolomic Approach. Metabolites 2023, 13, 353. https://doi.org/10.3390/metabo13030353
Magny R, Mégarbane B, Guillaud P, Chevillard L, Auzeil N, Thiebot P, Voicu S, Malissin I, Deye N, Labat L, et al. Life-Threatening Cardiogenic Shock Related to Venlafaxine Poisoning—A Case Report with Metabolomic Approach. Metabolites. 2023; 13(3):353. https://doi.org/10.3390/metabo13030353
Chicago/Turabian StyleMagny, Romain, Bruno Mégarbane, Pauline Guillaud, Lucie Chevillard, Nicolas Auzeil, Pauline Thiebot, Sebastian Voicu, Isabelle Malissin, Nicolas Deye, Laurence Labat, and et al. 2023. "Life-Threatening Cardiogenic Shock Related to Venlafaxine Poisoning—A Case Report with Metabolomic Approach" Metabolites 13, no. 3: 353. https://doi.org/10.3390/metabo13030353
APA StyleMagny, R., Mégarbane, B., Guillaud, P., Chevillard, L., Auzeil, N., Thiebot, P., Voicu, S., Malissin, I., Deye, N., Labat, L., & Houzé, P. (2023). Life-Threatening Cardiogenic Shock Related to Venlafaxine Poisoning—A Case Report with Metabolomic Approach. Metabolites, 13(3), 353. https://doi.org/10.3390/metabo13030353