Abstract
Studies have indicated that increasing plasma bilirubin levels might be useful for preventing and treating hepatic lipid accumulation that occurs with metabolic diseases such as obesity and diabetes. We have previously demonstrated that mice with hyperbilirubinemia had significantly less lipid accumulation in a diet-induced non-alcoholic fatty liver disease (NAFLD) model. However, bilirubin’s effects on individual lipid species are currently unknown. Therefore, we used liquid chromatography-mass spectroscopy (LC-MS) to determine the hepatic lipid composition of obese mice with NAFLD treated with bilirubin nanoparticles or vehicle control. We placed the mice on a high-fat diet (HFD) for 24 weeks and then treated them with bilirubin nanoparticles or vehicle control for 4 weeks while maintaining the HFD. Bilirubin nanoparticles suppressed hepatic fat content overall. After analyzing the lipidomics data, we determined that bilirubin inhibited the accumulation of ceramides in the liver. The bilirubin nanoparticles significantly lowered the hepatic expression of two essential enzymes that regulate ceramide production, Sgpl1 and Degs1. Our results demonstrate that the bilirubin nanoparticles improve hepatic fat content by reducing ceramide production, remodeling the liver fat content, and improving overall metabolic health.
Keywords:
bilirubin; ceramides; NAFLD; lipidomics; HO-1; Blvra; heme oxygenase; lipids; hepatic steatosis; obese 1. Introduction
The prevalence of non-alcoholic fatty liver disease (NAFLD) is on the rise worldwide, increasing from 25.5% in 2005 to an estimated 32.4% in 2022 [1]. NAFLD is the most common liver disease, which is characterized by an increase in lipid accumulation (hepatic steatosis) and inflammation within the liver [2,3]. NAFLD can cause the development of comorbidities, including diabetes and cardiovascular disease [4,5]. Even with such a high prevalence of NAFLD, no approved pharmacological therapies exist. Recent studies have investigated the therapeutic potential of bilirubin [6]. Bilirubin has been shown to directly bind to the nuclear receptor peroxisome proliferator-activated receptor alpha (PPARα) and activate its transcriptional activity [7,8,9,10]. This activation has been demonstrated to improve metabolic dysfunction in rodents with diet-induced NAFLD and its related comorbidities [10,11]. Within the adipose tissue, bilirubin has been shown to reshape the coregulator profile of PPARα, increase the number of mitochondria, and decrease the adipocyte size [10]. In the liver, bilirubin lowers lipid accumulation by inhibiting de novo lipogenesis and activating the hepatic β-oxidation pathway [11].
This study aimed to determine if bilirubin nanoparticles change the lipid species within the liver, which might protect against diet-induced NAFLD. This was achieved using a model of chronic high-fat diet feeding in mice as they developed NAFLD. The specific lipid species that accumulate within the liver during NAFLD are critical for determining the prognosis and progression of the disease. Ceramides have deleterious effects on the liver and have been linked to the development of insulin resistance and inflammation [12]. There are three distinct mechanisms through which ceramides are produced in the liver. Most commonly, ceramides are formed through de novo ceramide synthesis in the endoplasmic reticulum [13]. Ceramides can also be produced from the hydrolysis of sphingomyelin or through the salvage pathways [14]. For these reasons, serum and liver levels of ceramides have been correlated with the severity of NAFLD in humans [15]. Since inhibiting the formation of ceramides blocks lipid accumulation in rats with NAFLD [16]. Here, we wanted to determine whether bilirubin nanoparticles remodel the lipid species in the liver of mice with NAFLD.
2. Materials and Methods
2.1. Animals
The experimental procedures and protocols of this study conformed to the National Institutes of Health Guide for the Care and Use of Laboratory Animals. The Institutional Animal Care and Use Committee of the University of Mississippi Medical Center approved them. Eight-week-old male C57BL/6J mice were purchased from Jackson Labs (Bar Harbor, ME, USA) and placed on a 60% high-fat diet (diet #D12492, Research Diets, Inc., New Brunswick, NJ, USA) for 24 weeks with full access to tap water. After this time, mice were randomly assigned to either a treatment group consisting of pegylated bilirubin nanoparticles (PEG-BR) (30 mg/kg every other day, i.p.) (n = 6) or vehicle/saline (VEH) (n = 5) for 4 weeks while continuing on the high-fat diet as previously described [10,11]. At the end of the 4 week treatment period, mice were euthanized by isoflurane inhalation, and tissues were harvested, weighed, and stored at −80 °C. The livers were sliced and prepared for hematoxylin and eosin (H&E) staining, as we have previously described [11,17,18,19,20,21].
2.2. Bilirubin Nanoparticle Synthesis
As we have previously described in [10,11], the synthesis of pegylated bilirubin (PEG-BR) was performed at the Research Institute of Pharmaceutical Sciences at the University of Mississippi (Oxford, MS, USA). In brief, the preparation of PEG-BR was from bilirubin-IX-alpha (Frontier Scientific, Logan, UT, USA) and mPEG2000-NH2 (Sigma-Aldrich, St. Louis, MO, USA), as previously described [17,22,23]. The size and morphology of PEG-BR were determined by transmission electron microscopy (TEM) using a model JEM-2100 (JEOL Ltd., Tokyo, Japan). The purity of the PEG-BR was found to be 95%. For these studies, the PEG-BR was resuspended in saline with slight sonication to dissolve and stored at −20 °C in the dark.
2.3. Lipidomics
Lipids were extracted using acidified organic solvents as described previously [24,25,26]. The SPLASH® LIPIDOMIX® Mass Spec lipid class-specific internal standards (Avanti Polar Lipids, Alabaster, AL, USA) were added at the start of the extraction. These are stable isotope-labeled standards for all the major lipid classes with unique masses that do not overlap significantly with the naturally occurring lipids in the samples so that they can be quantified independently. Dried lipid residues were reconstituted for analysis. The instrument system was a Shimadzu Nexera UHPLC system coupled with an AB Sciex 6500+ Q-Trap linear ion trap/triple quadrupole mass spectrometer. Lipids were separated by HILIC chromatography using a Phenomenex Luna Silica Column with a guard column of the same material and detected in multiple reaction monitoring modes using method adaptations in the literature. In brief, this method takes advantage of the ability of HILIC chromatography to separate the major classes of glycerolipids and sphingolipids, which then enables the use of time-scheduled measurements of multiple lipid species within each class. Weakly alkaline solvents (pH 8.0) enhance the detection of anionic lipids in negative-ionization mode. Most lipids were monitored as their precursor molecular ions, but in some instances, lipids were monitored as ammoniated adducts. The high sensitivity and speed of the instrument allow for the accurate integration of chromatographic peaks. The method was optimized using a standard mouse liver lipid extract to identify retention times and exclude lipid species present at low levels and/or not detected consistently. The final optimized method was used to analyze lipids in experimental samples, with data collected for three technical replicates of each sample. Data were analyzed using AB Sciex MultiQuant software (Framingham, MA, USA) for peak finding and integration. The raw peak areas were normalized for recovery of the appropriate internal standards. Lipid species with coefficients of variation greater than 20% were excluded from the final report.
2.4. Lipidomics Analysis
The LipidSig differential analysis tool was used to analyze the lipidomics data using the web-based platform [27]. The lipidomics data were normalized to the sample weight, and duplicate values were removed before analysis (n = 5 for VEH and n = 6 for PEG-BR). The normalized data and sample annotations were uploaded to LipidSig for analysis. Lipid species with more than 50% missing samples were excluded from the analysis. A t-test method was used to identify different species. For global visualization of altered lipid species, hierarchical clustering was performed with a Pearson distance measure and a complete clustering method. Only significantly changed lipid species were analyzed using hierarchical clustering. Differential lipid species were shown using a relative signal intensity range and visualized via a heatmap. BioPAN on Lipid Maps was used to create the network analysis via the web-based platform [28]. Input data files can be found in the project’s GitHub repository (https://github.com/The-Hinds-Lab/Pegylated-Bilirubin-Nanoparticles-Lipidomics, accessed on 23 December 2022).
To ensure the rigor of the lipidomics analysis, we performed a second analysis. This time the data was normalized to the median abundance of lipid species. After quality control and assurance, the data was log-transformed. If more than 3 were missing for a given lipid species, missing values were imputed. If there were fewer than three values, all values were replaced with the imputed value above. For this analysis, we had an n = 4 for both groups. A t-test was used to analyze the log2-transformed data for statistical significance. p-values were adjusted using the Benjamini–Hochberg method. We then performed binomial enrichment, where each lipid formula is broken down into lipid class, total carbon chain length, the total number of double bonds, single chain lengths, and single chain double bonds. From these, we group the lipids with shared annotations. Then, for each annotation, we counted how many lipids had positive log-fold-changes and negative log-fold-changes (regardless of the adjusted p-value) and compared the positive LFC/negative LFC to an expected random ratio of 0.5 using a binomial test.
2.5. Quantitative Real-Time PCR Analysis
The measurement of gene expression via real-time PCR was performed as previously described [18]. Total RNA was harvested from the VEH- and PEG-BR-treated mouse livers. Briefly, the tissue was homogenized using a Qiagen Tissue Lyser LT (Qiagen, Hilden, Germany) and then extracted using phenol-chloroform extraction followed by purification using the RNeasy Mini Kit (Qiagen). Total RNA concentration was read on a NanoDrop 2000 spectrophotometer (Thermo Fisher Scientific, Wilmington, DE, USA), and cDNA was synthesized using a High-Capacity cDNA Reverse Transcription Kit (Applied Biosystems, Waltham, MA, USA). PCR amplification of the cDNA was performed by quantitative real-time PCR using TrueAmp SYBR Green qPCR SuperMix (Alkali Scientific, Fort Lauderdale, FL, USA) for gene-specific primers (Table 1) and as previously described [17,21,29]. The thermocycling protocol consisted of 5 min at 95 °C, 40 cycles of 15 s at 95 °C, and 30 s at 60 °C, finishing with a melting curve ranging from 60 to 95 °C to allow distinction of specific products. Normalization was performed in separate reactions with primers to 36B4.

Table 1.
Sequences of primers used in this study.
2.6. Statistical Analysis
The real-time PCR data were graphed and analyzed using Prism 9 (GraphPad Software, San Diego, CA, USA) using an analysis of variance and Tukey’s post-hoc test compared to the group means. A two-tailed, unpaired t-test was used to determine statistical significance when comparing two groups. p-values of 0.05 or smaller were considered statistically significant.
3. Results
3.1. Lipid Family Clustering
To determine how bilirubin affects hepatic lipid species in NAFLD, mice were placed on a HFD for 24 weeks, followed by treatments with VEH or PEG-BR for 4 weeks while remaining on the HFD. The VEH-treated mice developed NAFLD, which was reduced in the PEG-BR-treated animals (Figure 1a). Lipidomics was then performed as previously described in [30], which detected 707 lipid species in both groups. After normalization and quality control, 693 lipid species were used for the subsequent analyses. The PCA plot in Figure 1b was used to visualize the overall clustering of the data, and two distinct groups were visualized between the treatments. Figure 1c shows the 10 top lipid species and their contributions to the clustering observed in Figure 1b. The red arrows denote the lipid species that contributed to the clustering, and the blue arrows indicate a lesser role. Most arrows point to the left, denoting a decrease in lipid species in the PEG-BR-treated group versus the vehicle-treated group. Figure 1 shows the overall changes in the hepatic lipids and lipidomics data by PEG-BR, and next, the specific lipid species were identified.
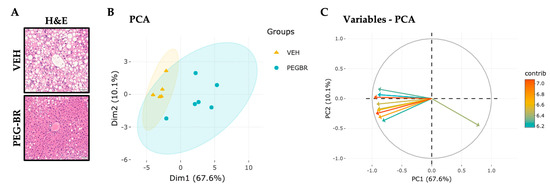
Figure 1.
Hepatic lipids and lipid species clusters in the livers of obese mice treated with bilirubin nanoparticles or vehicle. (A) Hematoxylin and eosin (H&E) staining of bilirubin nanoparticles (PEG-BR) and vehicle (VEH) treated mouse livers (scale bar = 50 μm). (B) PCA plot showing the clustering of the VEH and PEG-BR liver lipid species, and (C) showing the top lipid species (arrows) and their contribution to the clustering.
3.2. Significantly Changed Lipid Species
A volcano plot analysis was used to compare the overall changes in lipid species (Figure 2a). The volcano plot shows the changes in individual lipid species by PEG-BR compared to VEH that were measured. We determined that there was a cluster of ceramides (orange) and dihydroceramides (yellow), as indicated by the lower arrows in the PEG-BR-treated group. We then determined the identity of the significantly changed lipid species. In Figure 2b, we show that the lipid species were significantly different, with five increasing and twelve decreasing. The PEG-BR treatments most significantly reduced phosphoinositide (PI) 18:2/20:4 in the liver. Of the lipid species that were significantly decreased, 11 belonged to the ceramide class, including ceramides (CER), dihydroceramides (DCER), and hexosyl-ceramides (HCER) (Figure 3a). To get a better look at the different ceramide and dihydroceramide species, we created a bubble plot of the log fold change (y-axis) and −log10(p-value) (bubble size) for each ceramide and dihydroceramide species measured (Figure 3b). We observed a greater change in the shorter chain length fatty acids (CER 16:0, CER 18:0, DCER 18:0, and CER 14:0).
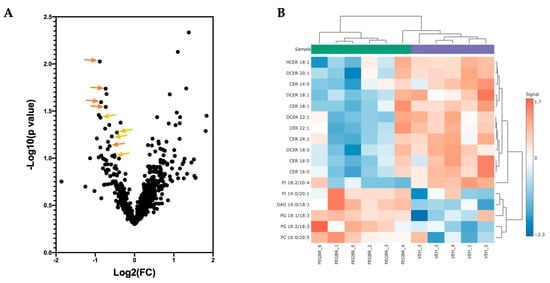
Figure 2.
Bilirubin nanoparticles reduce the number of ceramides and dihydroceramides in the liver of obese mice. (A) A volcano plot showing all lipid species measured. The orange arrows point to ceramides, and the yellowish-orange arrows point to dihydroceramides. (B) A heatmap showing the most significantly different lipid species in the PEG-BR vs. VEH groups.
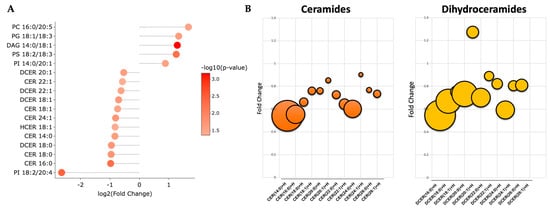
Figure 3.
Bilirubin nanoparticles inhibit the accumulation of ceramides within the liver of obese mice. (A) Shows the log2(fold change) for the statistically significant lipid species. The color of the bubbles denotes the −log10(p-value), with the darker shades of red indicating greater significance. (B) Bubble plots of the ceramide and dihydroceramide lipid species with different chain lengths. The size of the bubble denotes the −log10(p-value), with the larger bubbles indicating more significance.
3.3. Validation of Significantly Changed Lipid Species
To validate the previous findings, we normalized the data by median abundance instead of sample mass and calculated adjusted p-values. As we found in the previous analysis, bilirubin lowered the level of ceramides. However, this analysis identified that bilirubin nanoparticles also significantly increased the levels of phosphatidylethanolamine (PE) (Figure 4a). Bilirubin nanoparticles increased the level of most PEs regardless of the number of carbons or double bonds (Figure 4b). Bilirubin nanoparticles lowered the amount of all ceramide lipid species (Figure 4c).
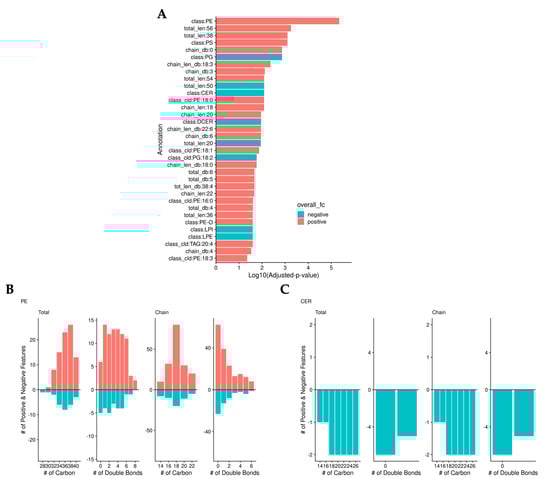
Figure 4.
Bilirubin nanoparticles regulate phosphatidylethanolamine (PE) and ceramide (CER) levels within the liver of obese mice. (A) Log10(adjusted-p-values) from binomial tests of lipid annotations. Color represents whether there are more positive (red) or negative (blue) log-fold-change lipids. The number of positive (red) and negative (blue) LogFC lipids is determined by the total and chain numbers of carbon and double bonds in PE (B) and CER (C).
3.4. Network Analysis
In Figure 5, we show a network analysis of the lipid classes and species in the bilirubin nanoparticles and vehicle-treated obese mice. The green color represents the classes/species that are changed by the bilirubin nanoparticle treatments. The network analysis shows that the PEG-BR primarily altered sphingomyelins (SM) and ceramides (Cer).
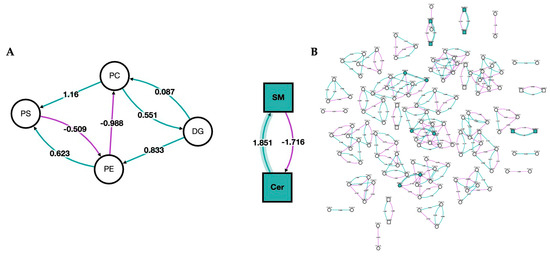
Figure 5.
Network of lipid classes and species changed in bilirubin nanoparticles and vehicle-treated obese mice. Network analysis of PEG-BR vs. VEH-treated mouse livers. (A) Network analysis of the lipid class; and (B) network analysis of the lipid species. Node shape denotes the lipid type, with circles representing glycerolipids and glycerophospholipids and squares representing sphingolipids. The node color represents whether the lipid class or species was changed by the PEG-BR (green) or remain unchanged (white). The purple line denotes a negative z-score, and the green line indicates a positive z-score. The shaded line indicates that the z-score is implied in a lipid class or species that was changed by PEG-BR.
3.5. RTPCR of the Ceramide Synthesis Pathway
To determine whether the bilirubin nanoparticle compared to the vehicle-treated obese mice had changes in the mRNA expression of key enzymes that regulate ceramide production, we used real-time PCR to measure the expression of genes within the ceramide synthesis pathways in the livers (Table 2). The bilirubin nanoparticle treatment did not significantly change the expression of ceramide synthases (Cers1–6). However, they did significantly reduce the expression of Sgpl1 (p = 0.0092) and Degs1 (p = 0.0283), which are enzymes involved in generating fatty acids [14,31,32].
Table 2.
Fold Change (FC) of real-time PCR expression of genes in the livers of obese mice treated with PEG-BR or VEH.
4. Discussion
Plasma bilirubin levels are negatively associated with obesity in humans [33] and rodents [6,34,35]. Several studies have demonstrated that hepatic bilirubin deficiency promotes steatosis [17,36,37,38], and treatment with bilirubin to raise plasma levels reverses dietary-induced hepatic fat accumulation [7,11,17,38,39,40]. However, the effect of bilirubin on hepatic fat metabolism and lipid species has not been previously studied in detail. The current study demonstrated for the first time that bilirubin nanoparticles modified the hepatic lipid pool by increasing the amount of phosphatidylethanolamine and inhibiting the accumulation of ceramides within the liver. The reduction in hepatic ceramides by bilirubin nanoparticles in this study could be a potential mechanism by which bilirubin significantly reduces insulin resistance in mice on a high-fat diet [10,41]. The accumulation of ceramides has been shown to be associated with insulin resistance by inhibiting Akt, leading to a decrease in GLUT4-mediated glucose uptake [42]. Ceramides activate atypical protein kinase C zeta (PKCζ), which phosphorylates Akt at an inhibitory site in the PH domain [43]. Ceramides also mediate lipotoxicity by promoting endoplasmic reticulum (ER) stress and inflammation and by activating caspases that result in proteolysis, nuclear fragmentation, and apoptotic cell death [12].
As a result of our analysis in this study, we also observed that bilirubin nanoparticle treatment significantly increased the amount of phosphatidylethanolamine in the liver of obese mice. Prior studies have identified that a lower ratio of phosphatidylcholine to phosphatidylethanolamine is associated with developing NAFLD [44]. By inhibiting ER stress and reducing reactive oxygen species (ROS), phosphatidylethanolamine can protect against the development of NAFLD [45]. Likewise, bilirubin treatments in leptin receptor-deficient db/db mice were demonstrated to enhance insulin sensitivity through inhibition of ER stress [46]. ROS can contribute to the pathogenesis of NAFLD, and it has been proposed that targeting ROS through heme oxygenase-1-mediated bilirubin production could be a potential therapeutic for NAFLD [39]. Bilirubin decreases ROS production through direct ROS scavenging and by inhibiting NADPH oxidase, which is the enzyme responsible for ROS production [47,48,49,50,51].
In this study, we show that bilirubin nanoparticle treatments in obese mice inhibited the accumulation of ceramides and suppressed the hepatic expression of Sgpl1 and Degs1. Ruangsiriluk et al. demonstrated that silencing enzymes such as Degs1, which are involved in ceramide biosynthesis, causes distinct global alterations of lipid homeostasis and gene expression [31]. Chaurasia et al. showed that targeting Degs1 improved insulin resistance and hepatic steatosis [52]. Similarly, suppression of Sgpl1 disrupts lipid homeostasis in the liver and reduces total body fat [32]. The Sgpl1 gene produces sphingolipids, which have been shown to induce inflammation [53]. Not surprisingly, bilirubin and bilirubin nanoparticles have been shown to reduce inflammation [11,41,46].
There are a few limits to the current study. First, previous studies show that roughly 95% of the transcriptional responses to bilirubin in human hepatocytes are mediated by PPARα [9]. However, it is unknown whether the changes in lipid species and the decreased mRNA expression in this study are mediated by PPARα. Follow-up studies are needed using PPARα knockout mice to determine if bilirubin causes these changes through a PPARα-dependent mechanism. Secondly, while the HFD model utilized in the present study causes significant steatosis and inflammation, which are alleviated by bilirubin nanoparticle treatment, this model does not develop significant hepatic fibrosis, so the effect of bilirubin nanoparticle treatment on fibrosis is not known. The effect on fibrosis can be studied in other mouse models of NASH [18].
In conclusion, we show that bilirubin nanoparticle treatments remodeled the liver fat content by reducing ceramides and increasing phosphatidylethanolamine, which promotes metabolic health. The bilirubin nanoparticles might be useful for regulating disorders where ceramide levels are elevated, particularly those observed in metabolic diseases such as fatty liver disease. There are other incidences where ceramides are elevated and bilirubin nanoparticle treatment might be useful, such as obesity, diabetes, cancer, hepatic steatosis, NAFLD, hypertension, heart failure, and atherosclerosis. These are supported by our work and that of Ai et al., who demonstrated that bilirubin nanoparticles improve cardiovascular phenotypes in mice with ischemia/reperfusion (I/R) injury [54]. Future work to further reveal the mechanistic actions of the bilirubin nanoparticles and their safety is needed. Studies have shown that bilirubin nanoparticles improve liver function as measured by significantly reduced levels of the liver dysfunction biomarker, AST, and lower hepatic inflammation [11]. Other factors to investigate include the duration of treatments to reduce ceramide production and how long the bilirubin nanoparticle treatments sustain reduced levels for protection. An additional consideration in future studies is how the bilirubin nanoparticles might improve cardiovascular diseases through a reduction of ceramides. Future studies to determine the roles of bilirubin in other, less-known tissues, such as muscle or kidney, are also needed. Overall, bilirubin nanoparticles show therapeutic potential in metabolic and cardiovascular diseases.
Author Contributions
Conceptualization and experimental design, T.D.H.J.; experimental—animals, D.E.S.; experimental—mass spectrometry lipidomics measurements, A.J.M.; data analysis—lipidomics, Z.A.K., E.A.B., R.M.F., and H.N.B.M.; extraction of RNA from mouse livers, A.B.M.; experimental—real-time PCR measurements, G.J.M.; data analysis and interpretation, Z.A.K., E.A.B., G.J.M., R.M.F., and H.N.B.M.; manuscript—writing, Z.A.K. and T.D.H.J.; final manuscript—review and revision, Z.A.K., E.A.B., G.J.M., A.B.M., R.M.F., H.N.B.M., A.J.M., D.E.S., and T.D.H.J. All authors have read and agreed to the published version of the manuscript.
Funding
This work was supported by the National Institutes of Health R01DK121797 (T.D.H.J.) and R01DK126884 (D.E.S.), the National Heart, Lung, and Blood Institute K01HL125445 (T.D.H.J.) and P01 HL0519711 (D.E.S.), and the National Institute of General Medical Sciences P20GM104357 (D.E.S.). The lipidomics analysis was supported by the COBRE grant (P30GM127211) at the University of Kentucky. Research reported in this study was supported by an Institutional Development Award (IDeA) from the National Institute of General Medical Sciences of the National Institute of Health under grant number P30 GM127211. The content is solely the responsibility of the authors and does not necessarily represent the official views of the National Institutes of Health.
Institutional Review Board Statement
Animal studies were conducted under the full approval of the University of Mississippi Medical Center’s IACUC in accordance with the NIH Guide for the Care and Use of Laboratory Animals protocol number 1283, with the most recent approval date on 1 October 2022.
Informed Consent Statement
Not applicable.
Data Availability Statement
All data and supplemental information regarding this manuscript are included on GitHub or can be provided upon request.
Conflicts of Interest
T.D.H.J. and D.E.S. have submitted patents on bilirubin and obesity-related disorders. The other authors have nothing to declare or a conflict of interest to disclose.
References
- Riazi, K.; Azhari, H.; Charette, J.H.; Underwood, F.E.; King, J.A.; Afshar, E.E.; Swain, M.G.; Congly, S.E.; Kaplan, G.G.; Shaheen, A.A. The prevalence and incidence of NAFLD worldwide: A systematic review and meta-analysis. Lancet Gastroenterol. Hepatol. 2022, 7, 851–861. [Google Scholar] [CrossRef] [PubMed]
- Badmus, O.O.; Hillhouse, S.A.; Anderson, C.D.; Hinds, T.D.; Stec, D.E. Molecular mechanisms of metabolic associated fatty liver disease (MAFLD): Functional analysis of lipid metabolism pathways. Clin. Sci. 2022, 136, 1347–1366. [Google Scholar] [CrossRef] [PubMed]
- Brunt, E.M. Pathology of nonalcoholic fatty liver disease. Nat. Rev. Gastroenterol. Hepatol. 2010, 7, 195–203. [Google Scholar] [CrossRef] [PubMed]
- Targher, G.; Corey, K.E.; Byrne, C.D.; Roden, M. The complex link between NAFLD and type 2 diabetes mellitus—Mechanisms and treatments. Nat. Rev. Gastroenterol. Hepatol. 2021, 18, 599–612. [Google Scholar] [CrossRef]
- Kasper, P.; Martin, A.; Lang, S.; Kutting, F.; Goeser, T.; Demir, M.; Steffen, H.M. NAFLD and cardiovascular diseases: A clinical review. Clin. Res. Cardiol. 2021, 110, 921–937. [Google Scholar] [CrossRef]
- Creeden, J.F.; Gordon, D.M.; Stec, D.E.; Hinds, T.D., Jr. Bilirubin as a metabolic hormone: The physiological relevance of low levels. Am. J. Physiol. Endocrinol. Metab. 2021, 320, E191–E207. [Google Scholar] [CrossRef]
- Stec, D.E.; John, K.; Trabbic, C.J.; Luniwal, A.; Hankins, M.W.; Baum, J.; Hinds, T.D., Jr. Bilirubin Binding to PPARalpha Inhibits Lipid Accumulation. PLoS ONE 2016, 11, e0153427. [Google Scholar] [CrossRef]
- Gordon, D.M.; Hong, S.H.; Kipp, Z.A.; Hinds, T.D., Jr. Identification of Binding Regions of Bilirubin in the Ligand-Binding Pocket of the Peroxisome Proliferator-Activated Receptor-A (PPARalpha). Molecules 2021, 26, 2975. [Google Scholar] [CrossRef]
- Gordon, D.M.; Blomquist, T.M.; Miruzzi, S.A.; McCullumsmith, R.; Stec, D.E.; Hinds, T.D., Jr. RNA sequencing in human HepG2 hepatocytes reveals PPAR-alpha mediates transcriptome responsiveness of bilirubin. Physiol. Genom. 2019, 51, 234–240. [Google Scholar] [CrossRef]
- Gordon, D.M.; Neifer, K.L.; Hamoud, A.A.; Hawk, C.F.; Nestor-Kalinoski, A.L.; Miruzzi, S.A.; Morran, M.P.; Adeosun, S.O.; Sarver, J.G.; Erhardt, P.W.; et al. Bilirubin remodels murine white adipose tissue by reshaping mitochondrial activity and the coregulator profile of peroxisome proliferator-activated receptor alpha. J. Biol. Chem. 2020, 295, 9804–9822. [Google Scholar] [CrossRef]
- Hinds, T.D., Jr.; Creeden, J.F.; Gordon, D.M.; Stec, D.F.; Donald, M.C.; Stec, D.E. Bilirubin Nanoparticles Reduce Diet-Induced Hepatic Steatosis, Improve Fat Utilization, and Increase Plasma beta-Hydroxybutyrate. Front. Pharmacol. 2020, 11, 594574. [Google Scholar] [CrossRef]
- Pagadala, M.; Kasumov, T.; McCullough, A.J.; Zein, N.N.; Kirwan, J.P. Role of ceramides in nonalcoholic fatty liver disease. Trends Endocrinol. Metab. 2012, 23, 365–371. [Google Scholar] [CrossRef]
- Levy, M.; Futerman, A.H. Mammalian ceramide synthases. IUBMB Life 2010, 62, 347–356. [Google Scholar] [CrossRef]
- Kitatani, K.; Idkowiak-Baldys, J.; Hannun, Y.A. The sphingolipid salvage pathway in ceramide metabolism and signaling. Cell. Signal. 2008, 20, 1010–1018. [Google Scholar] [CrossRef]
- Poss, A.M.; Summers, S.A. Too Much of a Good Thing? An Evolutionary Theory to Explain the Role of Ceramides in NAFLD. Front. Endocrinol. 2020, 11, 505. [Google Scholar] [CrossRef]
- Jiang, M.; Li, C.; Liu, Q.; Wang, A.; Lei, M. Inhibiting Ceramide Synthesis Attenuates Hepatic Steatosis and Fibrosis in Rats With Non-alcoholic Fatty Liver Disease. Front. Endocrinol. 2019, 10, 665. [Google Scholar] [CrossRef]
- Hinds, T.D., Jr.; Burns, K.A.; Hosick, P.A.; McBeth, L.; Nestor-Kalinoski, A.; Drummond, H.A.; AlAmodi, A.A.; Hankins, M.W.; Vanden Heuvel, J.P.; Stec, D.E. Biliverdin reductase A attenuates hepatic steatosis by inhibition of glycogen synthase kinase (GSK) 3beta phosphorylation of serine 73 of peroxisome proliferator-activated receptor (PPAR) alpha. J. Biol. Chem. 2016, 291, 25179–25191. [Google Scholar] [CrossRef]
- Creeden, J.F.; Kipp, Z.A.; Xu, M.; Flight, R.M.; Moseley, H.N.B.; Martinez, G.J.; Lee, W.H.; Alganem, K.; Imami, A.S.; McMullen, M.R.; et al. Hepatic Kinome Atlas: An In-Depth Identification of Kinase Pathways in Liver Fibrosis of Humans and Rodents. Hepatology 2022, 76, 1376–1388. [Google Scholar] [CrossRef]
- Hinds, T.D., Jr.; Creeden, J.F.; Gordon, D.M.; Spegele, A.C.; Britton, S.L.; Koch, L.G.; Stec, D.E. Rats Genetically Selected for High Aerobic Exercise Capacity Have Elevated Plasma Bilirubin by Upregulation of Hepatic Biliverdin Reductase-A (BVRA) and Suppression of UGT1A1. Antioxidants 2020, 9, 889. [Google Scholar] [CrossRef]
- Stec, D.E.; Gordon, D.M.; Hipp, J.A.; Hong, S.; Mitchell, Z.L.; Franco, N.R.; Robison, J.W.; Anderson, C.D.; Stec, D.F.; Hinds, T.D., Jr. The loss of hepatic PPARalpha promotes inflammation and serum hyperlipidemia in diet-induced obesity. Am. J. Physiol. Regul. Integr. Comp. Physiol. 2019, 317, R733–R745. [Google Scholar] [CrossRef]
- Hinds, T.D., Jr.; Hosick, P.A.; Hankins, M.W.; Nestor-Kalinoski, A.; Stec, D.E. Mice with hyperbilirubinemia due to Gilbert’s Syndrome polymorphism are resistant to hepatic steatosis by decreased serine 73 phosphorylation of PPARalpha. Am. J. Physiol. Endocrinol. Metab. 2017, 312, E244–E252. [Google Scholar] [CrossRef] [PubMed]
- Lee, Y.; Kim, H.; Kang, S.; Lee, J.; Park, J.; Jon, S. Bilirubin Nanoparticles as a Nanomedicine for Anti-inflammation Therapy. Angew. Chem. Int. Ed. Engl. 2016, 55, 7460–7463. [Google Scholar] [CrossRef] [PubMed]
- Kim, D.E.; Lee, Y.; Kim, M.; Lee, S.; Jon, S.; Lee, S.H. Bilirubin nanoparticles ameliorate allergic lung inflammation in a mouse model of asthma. Biomaterials 2017, 140, 37–44. [Google Scholar] [CrossRef] [PubMed]
- Mueller, P.A.; Yang, L.; Ubele, M.; Mao, G.; Brandon, J.; Vandra, J.; Nichols, T.C.; Escalante-Alcalde, D.; Morris, A.J.; Smyth, S.S. Coronary Artery Disease Risk-Associated Plpp3 Gene and Its Product Lipid Phosphate Phosphatase 3 Regulate Experimental Atherosclerosis. Arter. Thromb. Vasc. Biol. 2019, 39, 2261–2272. [Google Scholar] [CrossRef]
- Kraemer, M.P.; Mao, G.; Hammill, C.; Yan, B.; Li, Y.; Onono, F.; Smyth, S.S.; Morris, A.J. Effects of diet and hyperlipidemia on levels and distribution of circulating lysophosphatidic acid. J. Lipid Res. 2019, 60, 1818–1828. [Google Scholar] [CrossRef]
- Khan, M.J.; Codreanu, S.G.; Goyal, S.; Wages, P.A.; Gorti, S.K.K.; Pearson, M.J.; Uribe, I.; Sherrod, S.D.; McLean, J.A.; Porter, N.A.; et al. Evaluating a targeted multiple reaction monitoring approach to global untargeted lipidomic analyses of human plasma. Rapid Commun. Mass Spectrom. 2020, 34, e8911. [Google Scholar] [CrossRef]
- Lin, W.J.; Shen, P.C.; Liu, H.C.; Cho, Y.C.; Hsu, M.K.; Lin, I.C.; Chen, F.H.; Yang, J.C.; Ma, W.L.; Cheng, W.C. LipidSig: A web-based tool for lipidomic data analysis. Nucleic Acids Res. 2021, 49, W336–W345. [Google Scholar] [CrossRef]
- Gaud, C.; Sousa, B.C.; Nguyen, A.; Fedorova, M.; Ni, Z.; O’Donnell, V.B.; Wakelam, M.J.O.; Andrews, S.; Lopez-Clavijo, A.F. BioPAN: A web-based tool to explore mammalian lipidome metabolic pathways on LIPID MAPS. F1000Res 2021, 10, 4. [Google Scholar] [CrossRef]
- Marino, J.S.; Stechschulte, L.A.; Stec, D.E.; Nestor-Kalinoski, A.; Coleman, S.; Hinds, T.D., Jr. Glucocorticoid receptor beta induces hepatic steatosis by augmenting inflammation and inhibition of the peroxisome proliferator-activated receptor (PPAR) alpha. J. Biol. Chem. 2016, 291, 25776–25788. [Google Scholar] [CrossRef]
- Hinds, T.D., Jr.; Kipp, Z.A.; Xu, M.; Yiannikouris, F.B.; Morris, A.J.; Stec, D.F.; Wahli, W.; Stec, D.E. Adipose-Specific PPARalpha Knockout Mice Have Increased Lipogenesis by PASK-SREBP1 Signaling and a Polarity Shift to Inflammatory Macrophages in White Adipose Tissue. Cells 2021, 11, 4. [Google Scholar] [CrossRef]
- Ruangsiriluk, W.; Grosskurth, S.E.; Ziemek, D.; Kuhn, M.; des Etages, S.G.; Francone, O.L. Silencing of enzymes involved in ceramide biosynthesis causes distinct global alterations of lipid homeostasis and gene expression. J. Lipid. Res 2012, 53, 1459–1471. [Google Scholar] [CrossRef]
- Bektas, M.; Allende, M.L.; Lee, B.G.; Chen, W.; Amar, M.J.; Remaley, A.T.; Saba, J.D.; Proia, R.L. Sphingosine 1-phosphate lyase deficiency disrupts lipid homeostasis in liver. J. Biol. Chem. 2010, 285, 10880–10889. [Google Scholar] [CrossRef]
- Kipp, Z.A.; Xu, M.; Bates, E.A.; Lee, W.-H.; Kern, P.A.; Hinds, T.D. Bilirubin Levels Are Negatively Correlated with Adiposity in Obese Men and Women, and Its Catabolized Product, Urobilin, Is Positively Associated with Insulin Resistance. Antioxidants 2023, 12, 170. [Google Scholar] [CrossRef]
- Hinds, T.D., Jr.; Stec, D.E. Bilirubin Safeguards Cardiorenal and Metabolic Diseases: A Protective Role in Health. Curr. Hypertens. Rep. 2019, 21, 87. [Google Scholar] [CrossRef]
- Hinds, T.D., Jr.; Stec, D.E. Bilirubin, a Cardiometabolic Signaling Molecule. Hypertension 2018, 72, 788–795. [Google Scholar] [CrossRef]
- Weaver, L.; Hamoud, A.R.; Stec, D.E.; Hinds, T.D., Jr. Biliverdin reductase and bilirubin in hepatic disease. Am. J. Physiol. Gastrointest Liver Physiol. 2018, 314, G668–G676. [Google Scholar] [CrossRef]
- Hamoud, A.R.; Weaver, L.; Stec, D.E.; Hinds, T.D., Jr. Bilirubin in the Liver-Gut Signaling Axis. Trends Endocrinol Metab 2018, 29, 140–150. [Google Scholar] [CrossRef]
- Chen, W.; Tumanov, S.; Fazakerley, D.J.; Cantley, J.; James, D.E.; Dunn, L.L.; Shaik, T.; Suarna, C.; Stocker, R. Bilirubin deficiency renders mice susceptible to hepatic steatosis in the absence of insulin resistance. Redox Biol. 2021, 47, 102152. [Google Scholar] [CrossRef]
- Stec, D.E.; Hinds, T.D., Jr. Natural Product Heme Oxygenase Inducers as Treatment for Nonalcoholic Fatty Liver Disease. Int. J. Mol. Sci. 2020, 21, 9493. [Google Scholar] [CrossRef]
- Hinds, T.D., Jr.; Adeosun, S.O.; Alamodi, A.A.; Stec, D.E. Does bilirubin prevent hepatic steatosis through activation of the PPARalpha nuclear receptor? Med. Hypotheses 2016, 95, 54–57. [Google Scholar] [CrossRef]
- Takei, R.; Inoue, T.; Sonoda, N.; Kohjima, M.; Okamoto, M.; Sakamoto, R.; Inoguchi, T.; Ogawa, Y. Bilirubin reduces visceral obesity and insulin resistance by suppression of inflammatory cytokines. PLoS ONE 2019, 14, e0223302. [Google Scholar] [CrossRef] [PubMed]
- Galadari, S.; Rahman, A.; Pallichankandy, S.; Galadari, A.; Thayyullathil, F. Role of ceramide in diabetes mellitus: Evidence and mechanisms. Lipids Health Dis. 2013, 12, 98. [Google Scholar] [CrossRef] [PubMed]
- Powell, D.J.; Hajduch, E.; Kular, G.; Hundal, H.S. Ceramide disables 3-phosphoinositide binding to the pleckstrin homology domain of protein kinase B (PKB)/Akt by a PKCzeta-dependent mechanism. Mol. Cell Biol. 2003, 23, 7794–7808. [Google Scholar] [CrossRef] [PubMed]
- Arendt, B.M.; Ma, D.W.; Simons, B.; Noureldin, S.A.; Therapondos, G.; Guindi, M.; Sherman, M.; Allard, J.P. Nonalcoholic fatty liver disease is associated with lower hepatic and erythrocyte ratios of phosphatidylcholine to phosphatidylethanolamine. Appl. Physiol. Nutr. Metab. Physiol. Appl. Nutr. Et Metab. 2013, 38, 334–340. [Google Scholar] [CrossRef] [PubMed]
- Trentzsch, M.; Nyamugenda, E.; Miles, T.K.; Griffin, H.; Russell, S.; Koss, B.; Cooney, K.A.; Phelan, K.D.; Tackett, A.J.; Iyer, S.; et al. Delivery of phosphatidylethanolamine blunts stress in hepatoma cells exposed to elevated palmitate by targeting the endoplasmic reticulum. Cell Death Discov. 2020, 6, 8. [Google Scholar] [CrossRef]
- Dong, H.; Huang, H.; Yun, X.; Kim, D.S.; Yue, Y.; Wu, H.; Sutter, A.; Chavin, K.D.; Otterbein, L.E.; Adams, D.B.; et al. Bilirubin increases insulin sensitivity in leptin-receptor deficient and diet-induced obese mice through suppression of ER stress and chronic inflammation. Endocrinology 2014, 155, 818–828. [Google Scholar] [CrossRef]
- Fujii, M.; Inoguchi, T.; Sasaki, S.; Maeda, Y.; Zheng, J.; Kobayashi, K.; Takayanagi, R. Bilirubin and biliverdin protect rodents against diabetic nephropathy by downregulating NAD(P)H oxidase. Kidney Int. 2010, 78, 905–919. [Google Scholar] [CrossRef]
- Stocker, R.; Yamamoto, Y.; McDonagh, A.F.; Glazer, A.N.; Ames, B.N. Bilirubin is an antioxidant of possible physiological importance. Science 1987, 235, 1043–1046. [Google Scholar] [CrossRef]
- Gordon, D.M.; Adeosun, S.O.; Ngwudike, S.I.; Anderson, C.D.; Hall, J.E.; Hinds, T.D., Jr.; Stec, D.E. CRISPR Cas9-mediated deletion of biliverdin reductase A (BVRA) in mouse liver cells induces oxidative stress and lipid accumulation. Arch. Biochem. Biophys. 2019, 672, 108072. [Google Scholar] [CrossRef]
- Adeosun, S.O.; Gordon, D.M.; Weeks, M.F.; Moore, K.H.; Hall, J.E.; Hinds, T.D.; Stec, D.E. Loss of biliverdin reductase-A (BVRA) promotes lipid accumulation and lipotoxicity in mouse proximal tubule cells. Am. J. Physiol. Renal. Physiol. 2018, 315, F323–F331. [Google Scholar] [CrossRef]
- Thomas, D.T.; DelCimmuto, N.R.; Flack, K.D.; Stec, D.E.; Hinds, T.D., Jr. Reactive Oxygen Species (ROS) and Antioxidants as Immunomodulators in Exercise: Implications for Heme Oxygenase and Bilirubin. Antioxidants 2022, 11, 179. [Google Scholar] [CrossRef]
- Chaurasia, B.; Tippetts, T.S.; Mayoral Monibas, R.; Liu, J.; Li, Y.; Wang, L.; Wilkerson, J.L.; Sweeney, C.R.; Pereira, R.F.; Sumida, D.H.; et al. Targeting a ceramide double bond improves insulin resistance and hepatic steatosis. Science 2019, 365, 386–392. [Google Scholar] [CrossRef]
- Albi, E.; Alessenko, A.; Grosch, S. Sphingolipids in Inflammation. Mediat. Inflamm. 2018, 2018, 7464702. [Google Scholar] [CrossRef]
- Ai, W.; Bae, S.; Ke, Q.; Su, S.; Li, R.; Chen, Y.; Yoo, D.; Lee, E.; Jon, S.; Kang, P.M. Bilirubin Nanoparticles Protect Against Cardiac Ischemia/Reperfusion Injury in Mice. J. Am. Heart Assoc. 2021, 10, e021212. [Google Scholar] [CrossRef]


Disclaimer/Publisher’s Note: The statements, opinions and data contained in all publications are solely those of the individual author(s) and contributor(s) and not of MDPI and/or the editor(s). MDPI and/or the editor(s) disclaim responsibility for any injury to people or property resulting from any ideas, methods, instructions or products referred to in the content. |
© 2023 by the authors. Licensee MDPI, Basel, Switzerland. This article is an open access article distributed under the terms and conditions of the Creative Commons Attribution (CC BY) license (https://creativecommons.org/licenses/by/4.0/).