

PPA1 Deficiency Causes a Deranged Galactose Metabolism Recognizable in Neonatal Screening


 , , , , , and
Abstract
:
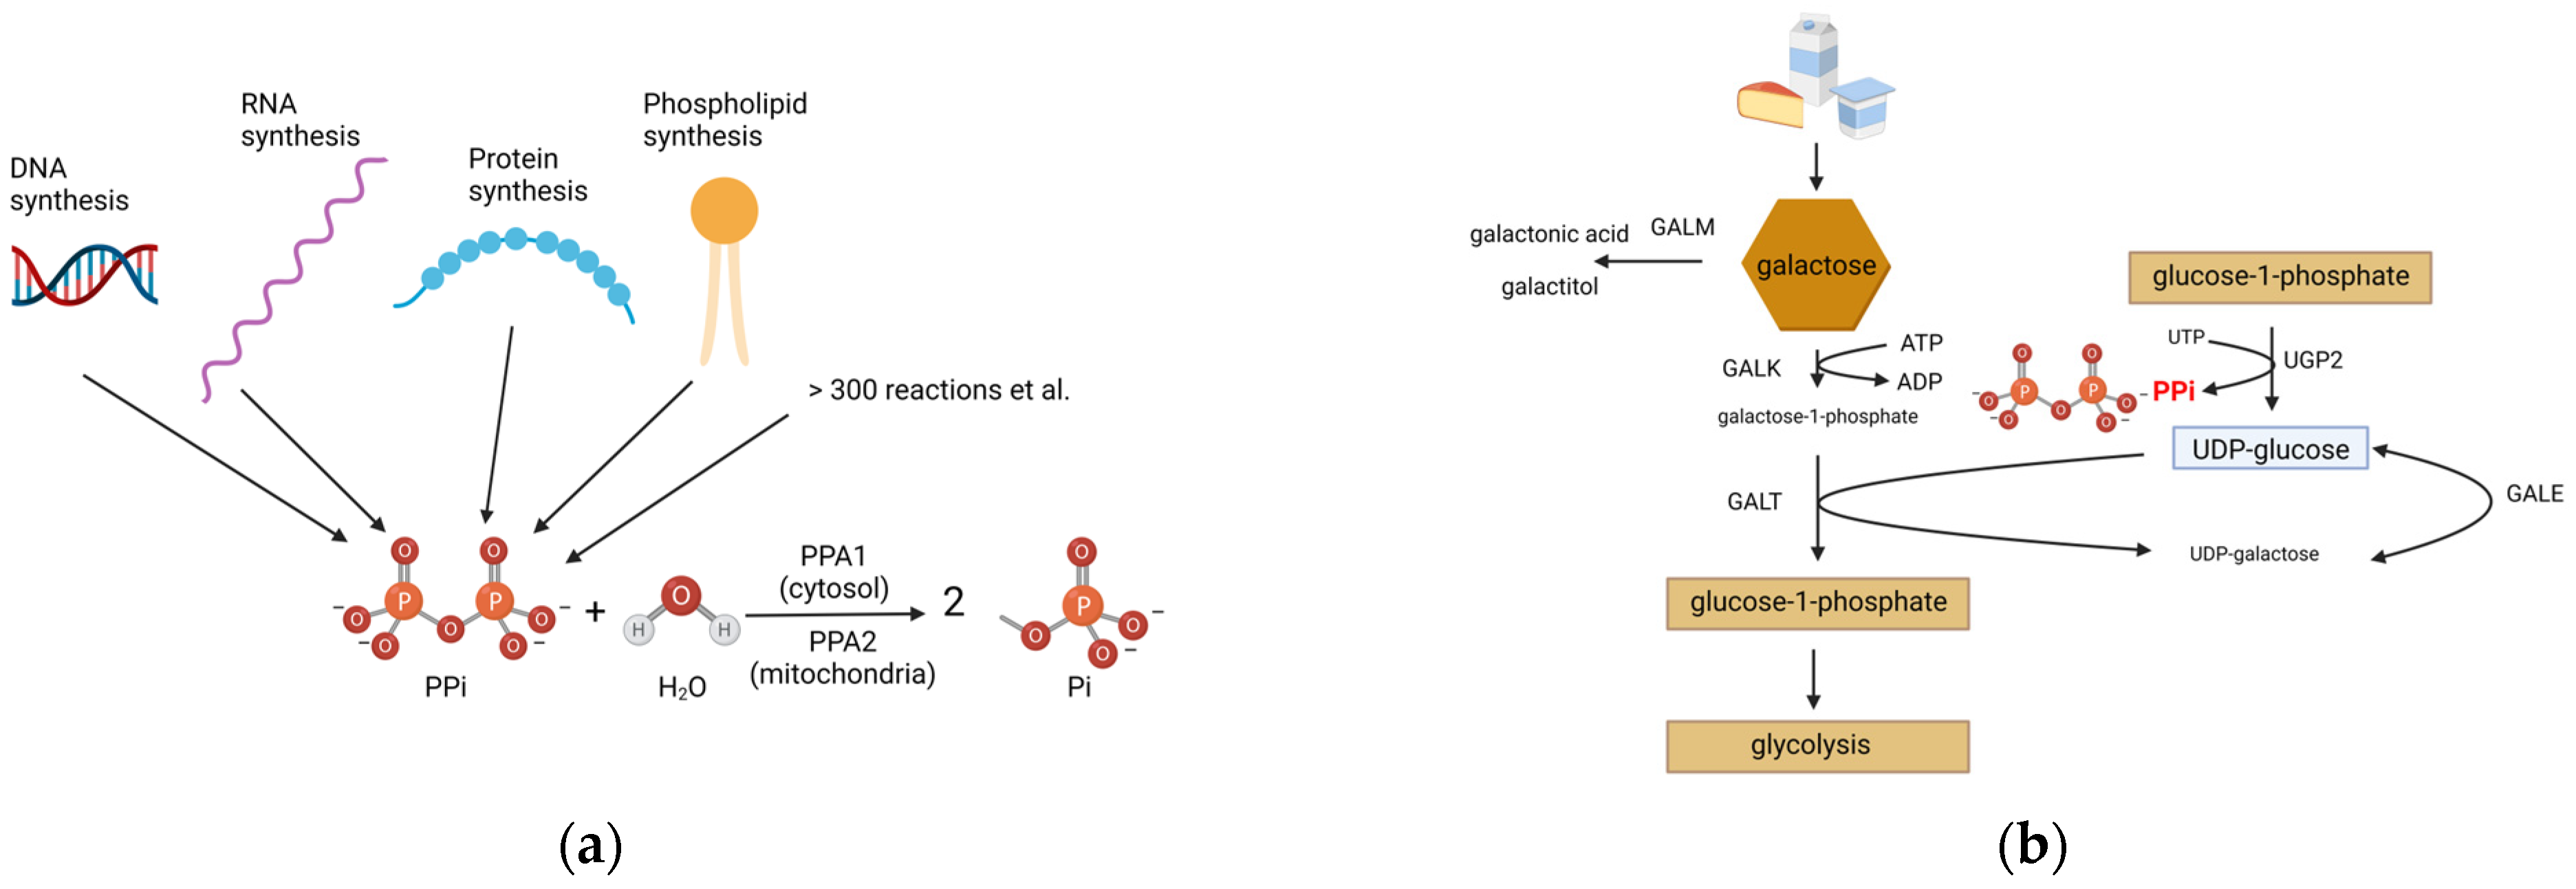
1. Introduction
2. Materials and Methods
2.1. Neonatal Screening
2.2. Genetic Testing
2.3. Sample Preparation for Untargeted Metabolomics
2.4. Untargeted Metabolomics
2.5. Data Analysis of Untargeted Metabolomics
2.6. Cell Culture
2.7. 10,000× g Supernatant from Primary Human Skin Fibroblasts
2.8. Quantification of PPA Activity in 10,000× g Supernatants
2.9. Western Blot Analysis
2.10. Enzyme Activity Measurement of Recombinant PPA1
2.11. Extracellular Flux Assay of Primary Human Skin Fibroblasts
2.12. Determination of UDP-Gal and UDP-Glc Levels via UPLC-PDA
2.13. Isoelectric Focusing of Serum Transferrin and Alpha-1-Antitrypsin
2.14. LC-MS Analysis of Whole-Serum N-Glycans
3. Results
3.1. Clinical Information
3.2. Genetic Investigations
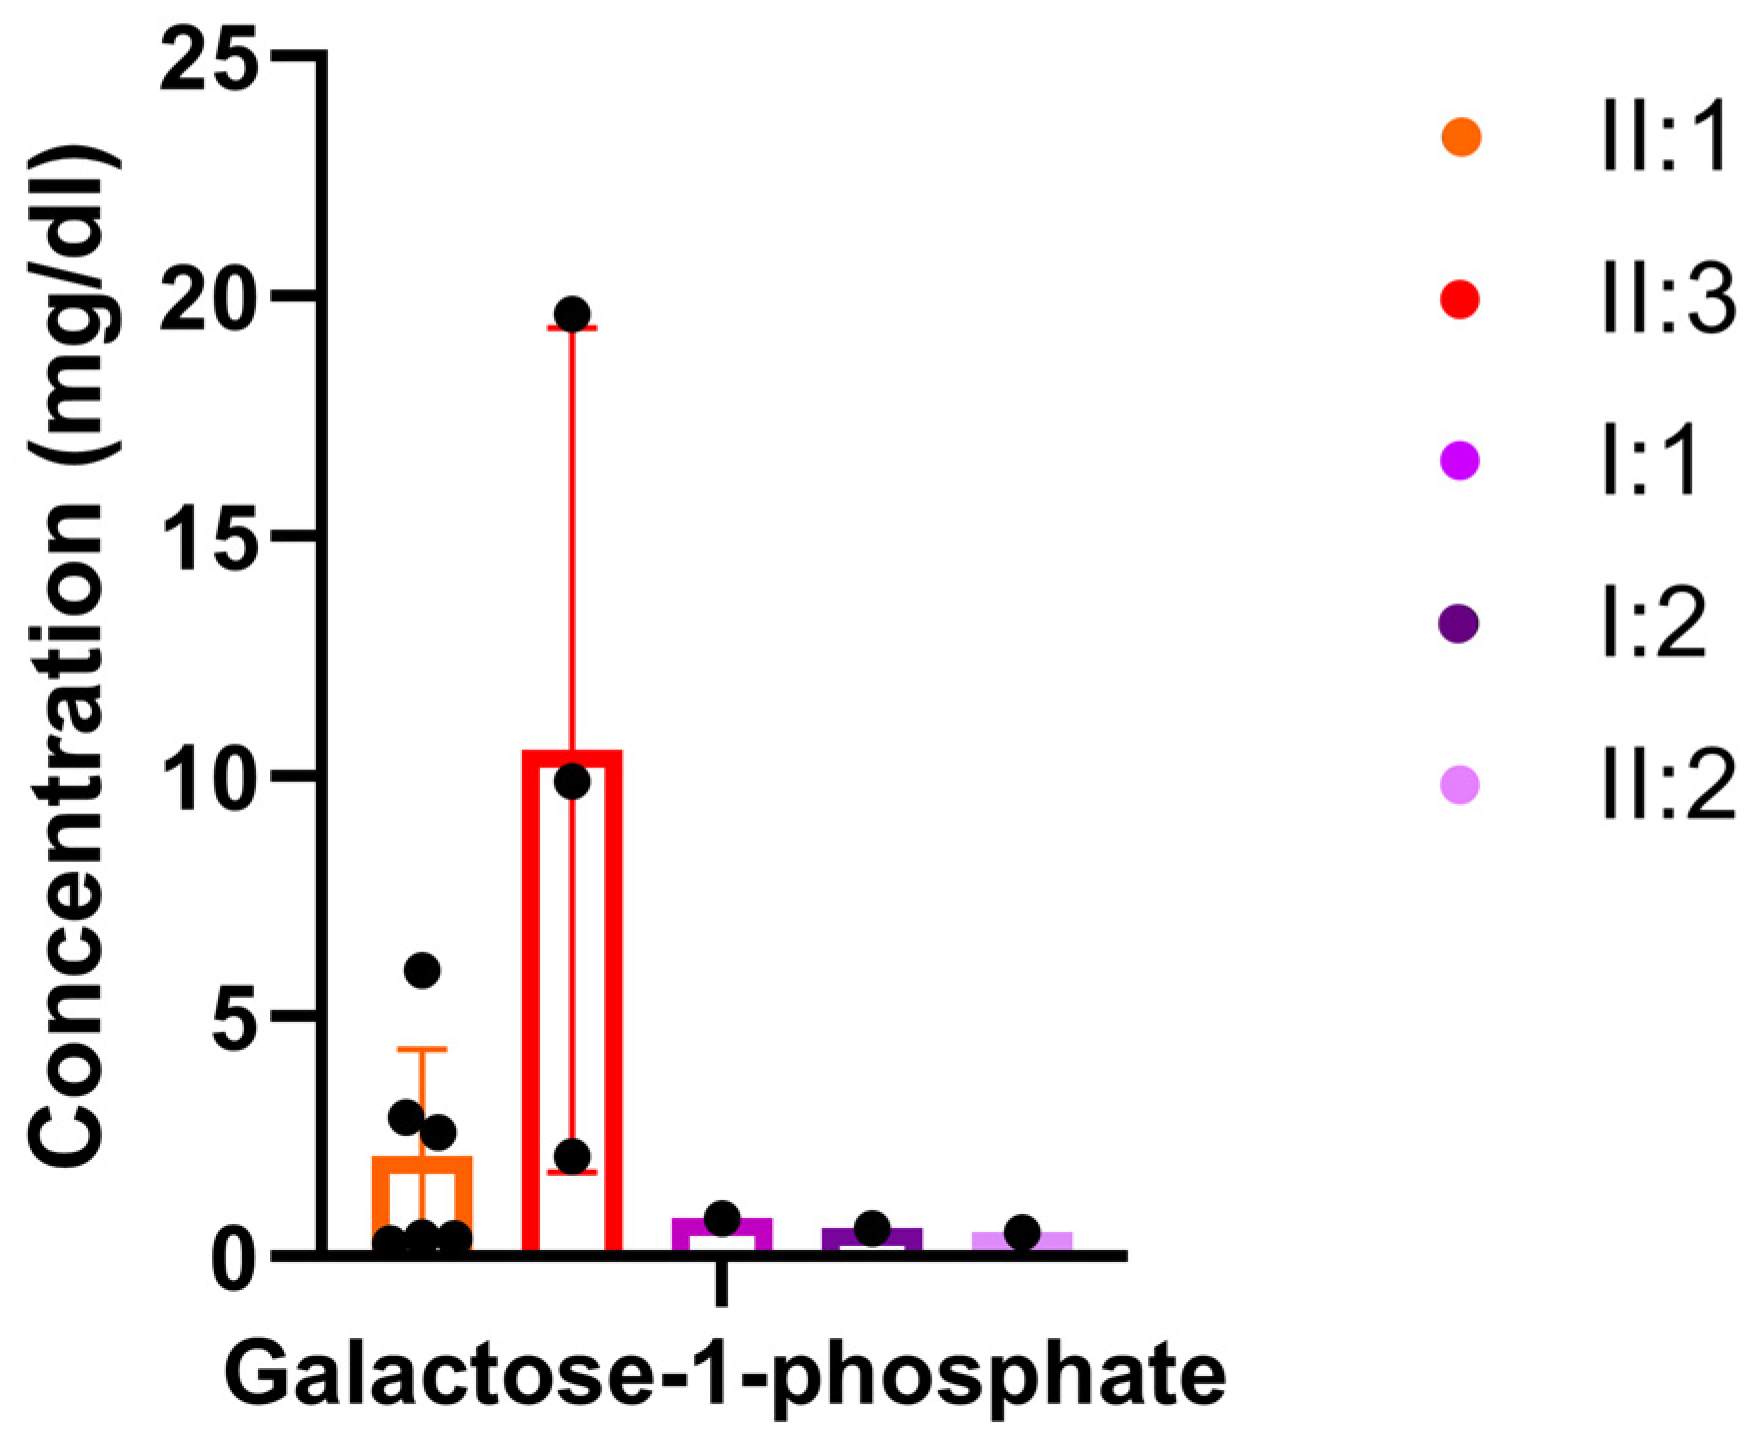
3.3. Metabolic Investigations
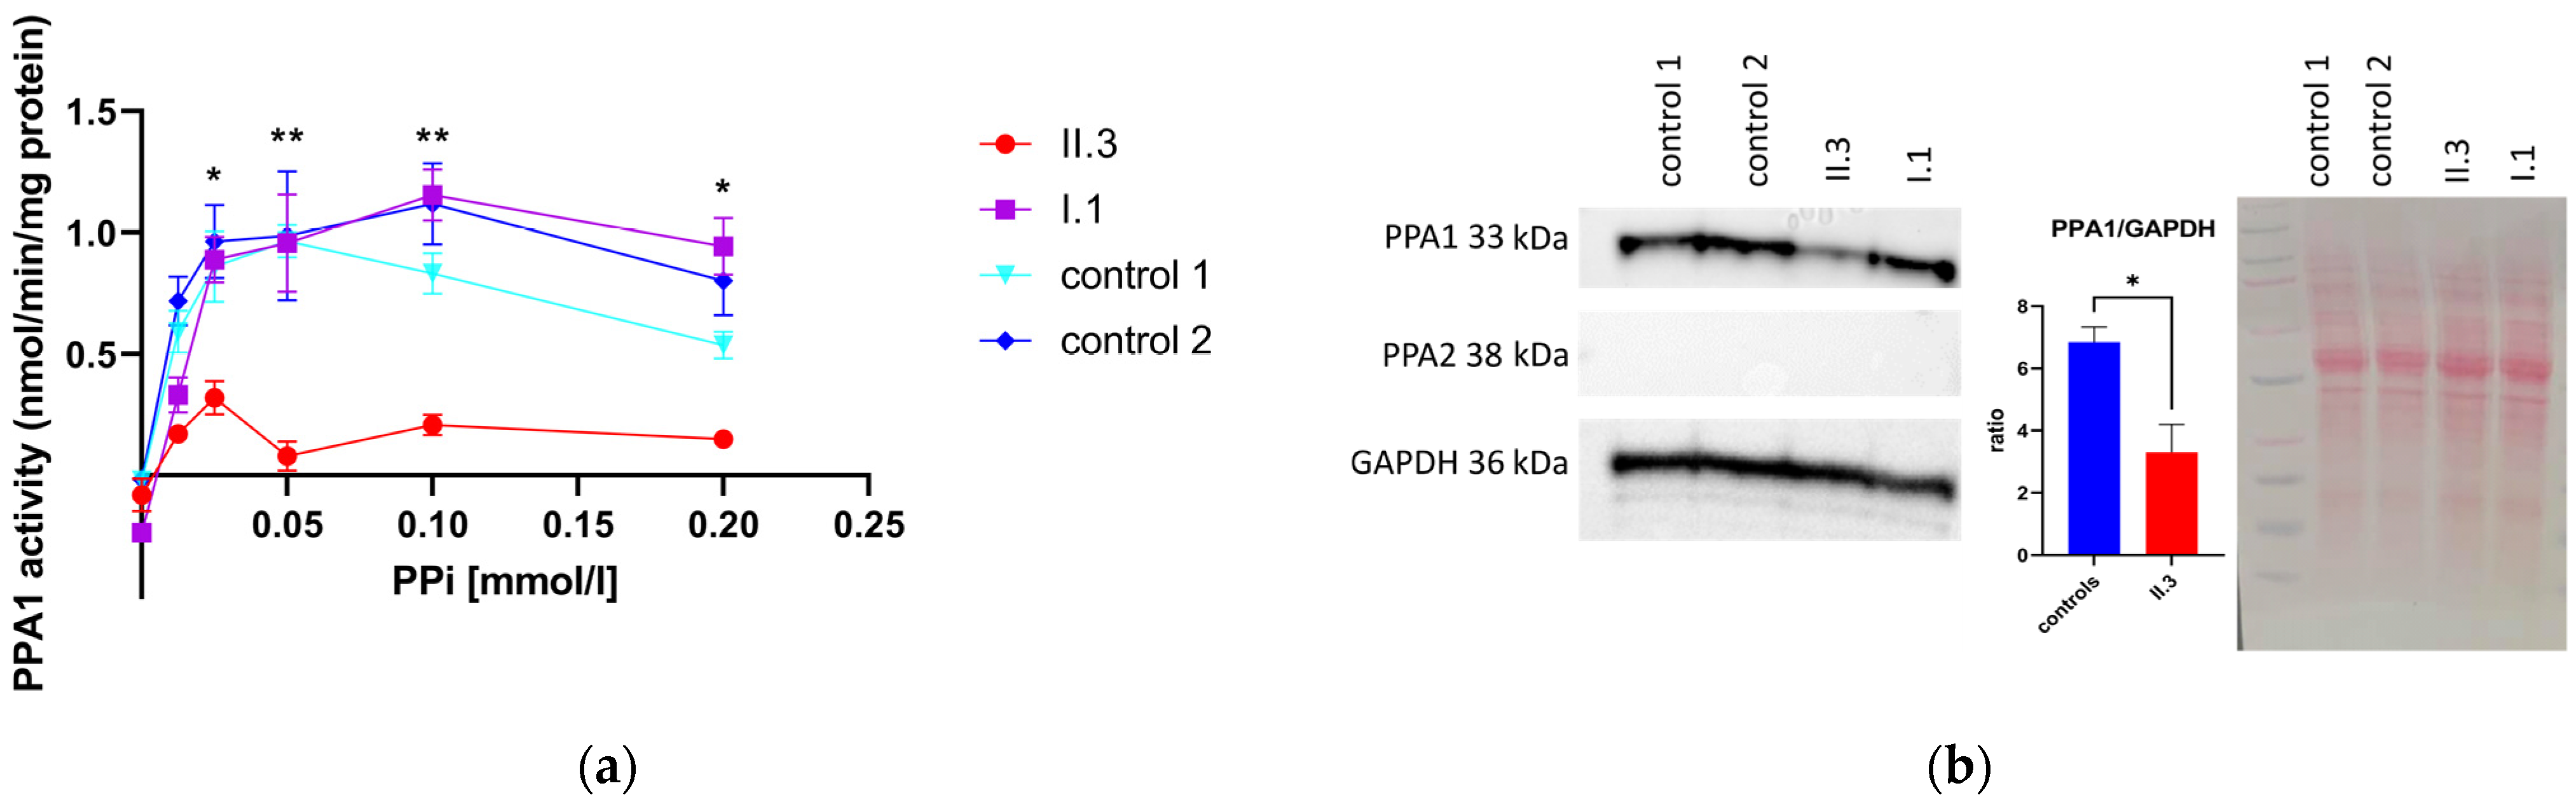
3.4. Determination of PPA1 and PPA2 Protein Amount via Western Blotting
3.5. Pyrophosphatase Activity in Primary Human Skin Fibroblasts
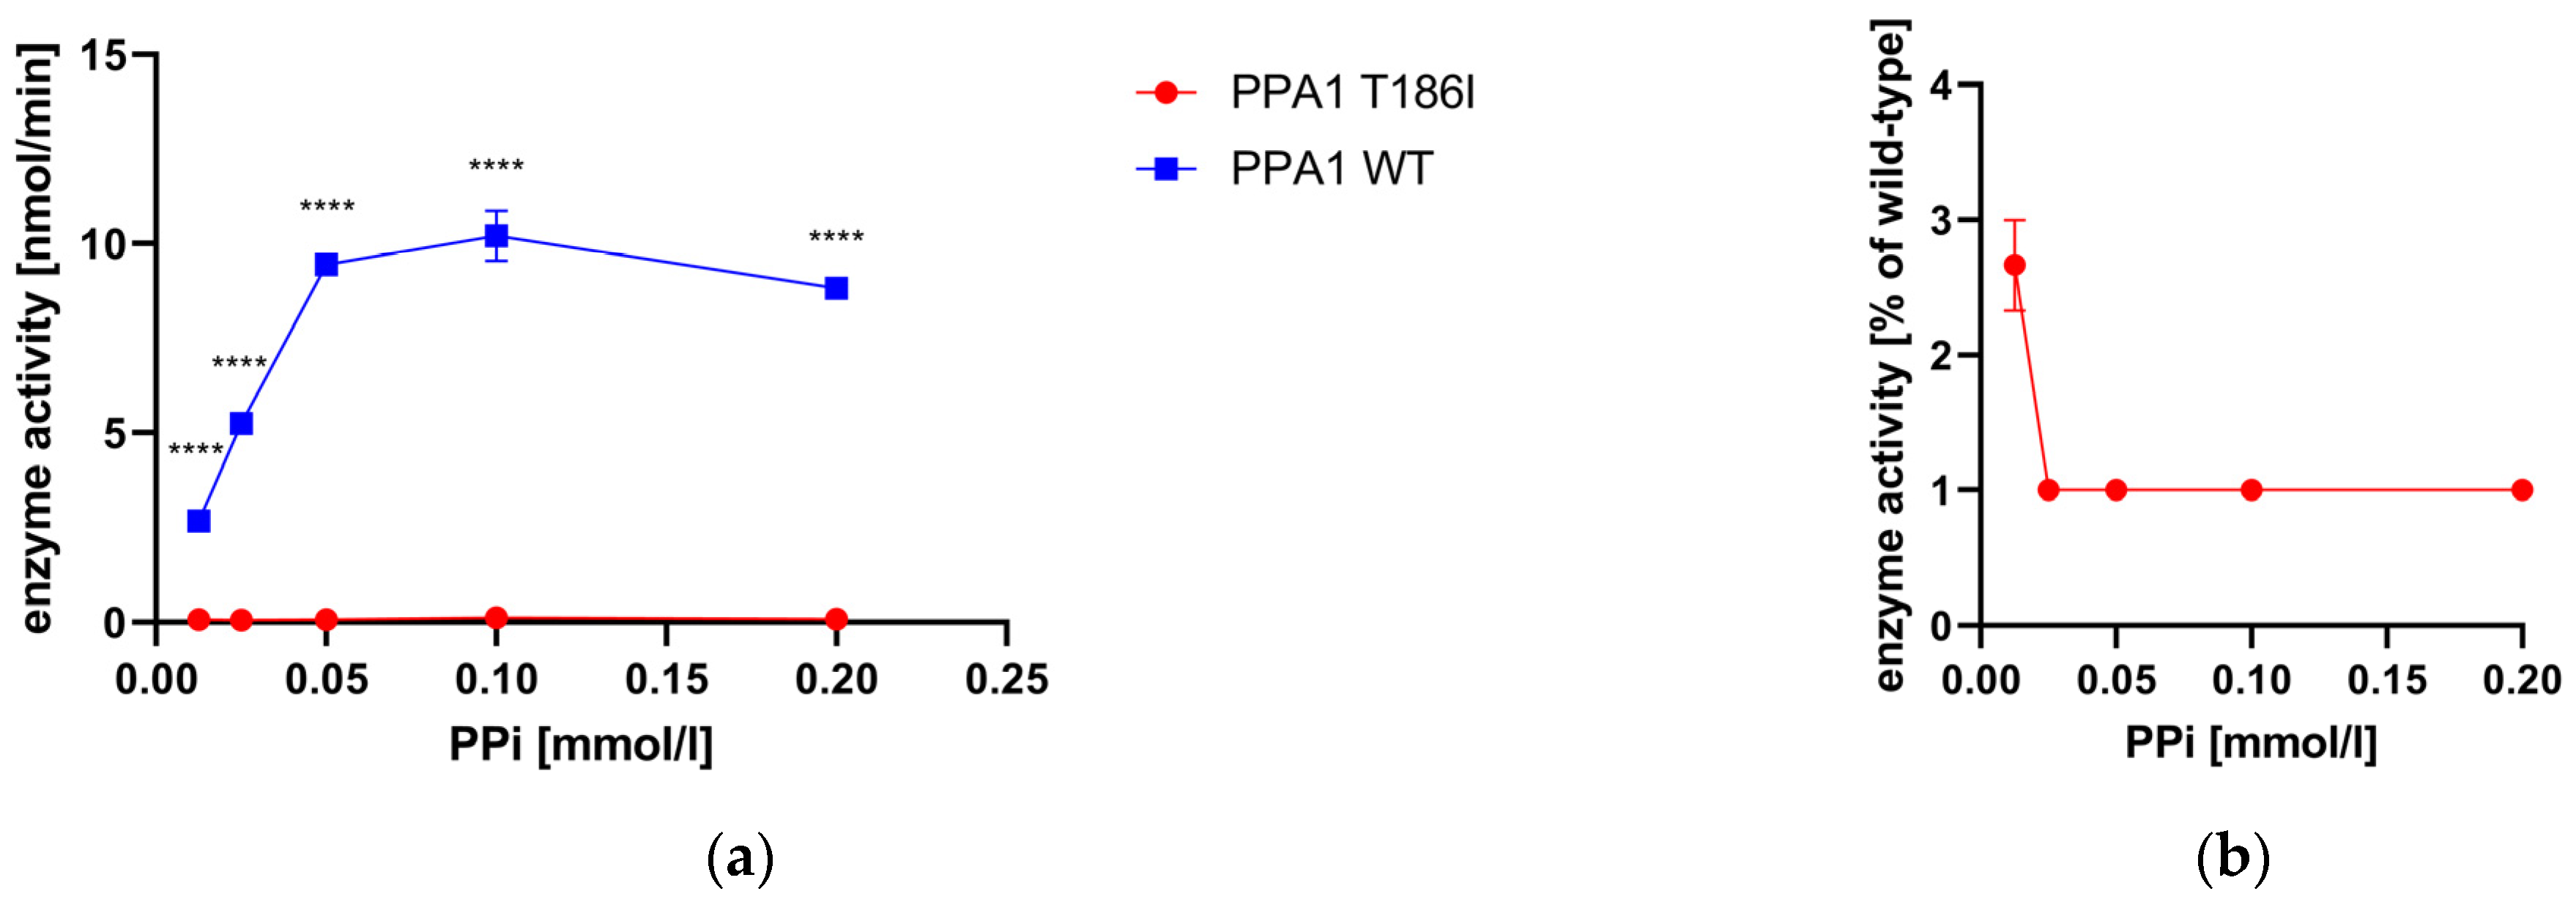
3.6. Enzyme Activity Measurement of Recombinant PPA1
3.7. Extracellular Flux Assay of Primary Human Skin Fibroblasts
3.8. Determination of the Nucleotide Content in Primary Human Skin Fibroblasts
4. Discussion
Supplementary Materials
Author Contributions
Funding
Institutional Review Board Statement
Informed Consent Statement
Data Availability Statement
Acknowledgments
Conflicts of Interest
References
- Morava, E.; Rahman, S.; Peters, V.; Baumgartner, M.R.; Patterson, M.; Zschocke, J. Quo vadis: The re-definition of “inborn metabolic diseases”. J. Inherit. Metab. Dis. 2015, 38, 1003–1006. [Google Scholar] [CrossRef] [PubMed]
- Andermann, A.; Blancquaert, I.; Beauchamp, S.; Dery, V. Revisiting Wilson and Jungner in the genomic age: A review of screening criteria over the past 40 years. Bull. World Health Organ. 2008, 86, 317–319. [Google Scholar] [CrossRef] [PubMed]
- Cuthbert, C.; Klapper, H.; Elsas, L. Diagnosis of inherited disorders of galactose metabolism. Curr. Protoc. Hum. Genet. 2008, 56, 17.5.1–17.5.29. [Google Scholar] [CrossRef]
- Lundin, M.; Baltscheffsky, H.; Ronne, H. Yeast PPA2 gene encodes a mitochondrial inorganic pyrophosphatase that is essential for mitochondrial function. J. Biol. Chem. 1991, 266, 12168–12172. [Google Scholar] [CrossRef]
- Guimier, A.; Achleitner, M.T.; Moreau de Bellaing, A.; Edwards, M.; de Pontual, L.; Mittal, K.; Dunn, K.E.; Grove, M.E.; Tysoe, C.J.; Dimartino, C.; et al. PPA2-associated sudden cardiac death: Extending the clinical and allelic spectrum in 20 new families. Genet. Med. 2021, 23, 2415–2425. [Google Scholar] [CrossRef] [PubMed]
- Wang, S.; Wei, J.; Li, S.; Luo, Y.; Li, Y.; Wang, X.; Shen, W.; Luo, D.; Liu, D. PPA1, an energy metabolism initiator, plays an important role in the progression of malignant tumors. Front. Oncol. 2022, 12, 1012090. [Google Scholar] [CrossRef]
- Yin, Y.; Wu, Y.; Zhang, X.; Zhu, Y.; Sun, Y.; Yu, J.; Gong, Y.; Sun, P.; Lin, H.; Han, X. PPA1 Regulates Systemic Insulin Sensitivity by Maintaining Adipocyte Mitochondria Function as a Novel PPARgamma Target Gene. Diabetes 2021, 70, 1278–1291. [Google Scholar] [CrossRef]
- Kasper, D.C.; Ratschmann, R.; Metz, T.F.; Mechtler, T.P.; Moslinger, D.; Konstantopoulou, V.; Item, C.B.; Pollak, A.; Herkner, K.R. The national Austrian newborn screening program—Eight years experience with mass spectrometry. past, present, and future goals. Wien. Klin. Wochenschr. 2010, 122, 607–613. [Google Scholar] [CrossRef]
- Schulze, A.; Lindner, M.; Kohlmuller, D.; Olgemoller, K.; Mayatepek, E.; Hoffmann, G.F. Expanded newborn screening for inborn errors of metabolism by electrospray ionization-tandem mass spectrometry: Results, outcome, and implications. Pediatrics 2003, 111, 1399–1406. [Google Scholar] [CrossRef]
- Duzkale, N.; Oz, O.; Turkmenoglu, T.T.; Cetinkaya, K.; Eren, T.; Yalcin, S. Investigation of Hereditary Cancer Predisposition Genes of Patients with Colorectal Cancer: Single-centre Experience. J. Coll. Physicians Surg. Pak. 2021, 30, 811–816. [Google Scholar] [CrossRef]
- Jin, S.C.; Lewis, S.A.; Bakhtiari, S.; Zeng, X.; Sierant, M.C.; Shetty, S.; Nordlie, S.M.; Elie, A.; Corbett, M.A.; Norton, B.Y.; et al. Mutations disrupting neuritogenesis genes confer risk for cerebral palsy. Nat. Genet. 2020, 52, 1046–1056. [Google Scholar] [CrossRef] [PubMed]
- Ziegler, A.; Bader, P.; McWalter, K.; Douglas, G.; Houdayer, C.; Bris, C.; Rouleau, S.; Coutant, R.; Colin, E.; Bonneau, D. Confirmation that variants in TTI2 are responsible for autosomal recessive intellectual disability. Clin. Genet. 2019, 96, 354–358. [Google Scholar] [CrossRef] [PubMed]
- Haijes, H.A.; Willemsen, M.; Van der Ham, M.; Gerrits, J.; Pras-Raves, M.L.; Prinsen, H.; Van Hasselt, P.M.; De Sain-van der Velden, M.G.M.; Verhoeven-Duif, N.M.; Jans, J.J.M. Direct Infusion Based Metabolomics Identifies Metabolic Disease in Patients’ Dried Blood Spots and Plasma. Metabolites 2019, 9, 12. [Google Scholar] [CrossRef]
- Vidali, S.; Gerlini, R.; Thompson, K.; Urquhart, J.E.; Meisterknecht, J.; Aguilar-Pimentel, J.A.; Amarie, O.V.; Becker, L.; Breen, C.; Calzada-Wack, J.; et al. Characterising a homozygous two-exon deletion in UQCRH: Comparing human and mouse phenotypes. EMBO Mol. Med. 2021, 13, e14397. [Google Scholar] [CrossRef] [PubMed]
- Spencer, M.G.; Couldery, A.D. Nasal tooth. J. Laryngol. Otol. 1985, 99, 1147–1150. [Google Scholar] [CrossRef]
- Nagasawa, H.; Yamaguchi, S.; Orii, T.; Schutgens, R.B.; Sweetman, L.; Hashimoto, T. Heterogeneity of defects in mitochondrial acetoacetyl-CoA thiolase biosynthesis in fibroblasts from four patients with 3-ketothiolase deficiency. Pediatr. Res. 1989, 26, 145–149. [Google Scholar] [CrossRef] [PubMed]
- Kennedy, H.; Haack, T.B.; Hartill, V.; Matakovic, L.; Baumgartner, E.R.; Potter, H.; Mackay, R.; Alston, C.L.; O’Sullivan, S.; McFarland, R.; et al. Sudden Cardiac Death Due to Deficiency of the Mitochondrial Inorganic Pyrophosphatase PPA2. Am. J. Hum. Genet. 2016, 99, 674–682. [Google Scholar] [CrossRef] [PubMed]
- Pinho, S.A.; Costa, C.F.; Deus, C.M.; Pinho, S.L.C.; Miranda-Santos, I.; Afonso, G.; Bagshaw, O.; Stuart, J.A.; Oliveira, P.J.; Cunha-Oliveira, T. Mitochondrial and metabolic remodelling in human skin fibroblasts in response to glucose availability. FEBS J. 2022, 289, 5198–5217. [Google Scholar] [CrossRef]
- Wong, S.Y.; Gadomski, T.; van Scherpenzeel, M.; Honzik, T.; Hansikova, H.; Holmefjord, K.S.B.; Mork, M.; Bowling, F.; Sykut-Cegielska, J.; Koch, D.; et al. Oral D-galactose supplementation in PGM1-CDG. Genet. Med. 2017, 19, 1226–1235. [Google Scholar] [CrossRef]
- Thiel, C.; Messner-Schmitt, D.; Hoffmann, G.F.; Korner, C. Screening for congenital disorders of glycosylation in the first weeks of life. J. Inherit. Metab. Dis. 2013, 36, 887–892. [Google Scholar] [CrossRef]
- Himmelreich, N.; Dimitrov, B.; Zielonka, M.; Hullen, A.; Hoffmann, G.F.; Juenger, H.; Muller, H.; Lorenz, I.; Busse, B.; Marschall, C.; et al. Missense variant c.1460 T > C (p.L487P) enhances protein degradation of ER mannosyltransferase ALG9 in two new ALG9-CDG patients presenting with West syndrome and review of the literature. Mol. Genet. Metab. 2022, 136, 274–281. [Google Scholar] [CrossRef]
- Richards, S.; Aziz, N.; Bale, S.; Bick, D.; Das, S.; Gastier-Foster, J.; Grody, W.W.; Hegde, M.; Lyon, E.; Spector, E.; et al. Standards and guidelines for the interpretation of sequence variants: A joint consensus recommendation of the American College of Medical Genetics and Genomics and the Association for Molecular Pathology. Genet. Med. 2015, 17, 405–424. [Google Scholar] [CrossRef]
- Thaxton, C.; Good, M.E.; DiStefano, M.T.; Luo, X.; Andersen, E.F.; Thorland, E.; Berg, J.; Martin, C.L.; Rehm, H.L.; Riggs, E.R.; et al. Utilizing ClinGen gene-disease validity and dosage sensitivity curations to inform variant classification. Hum. Mutat. 2022, 43, 1031–1040. [Google Scholar] [CrossRef]
- Kalakonda, A.; Jenkins, B.A.; John, S. Physiology, Bilirubin. In StatPearls; StatPearls Publishing: Treasure Island, FL, USA, 2023. [Google Scholar]
- Barmore, W.; Azad, F.; Stone, W.L. Physiology, Urea Cycle. In StatPearls; StatPearls Publishing: Treasure Island, FL, USA, 2023. [Google Scholar]
- Haberle, J.; Boddaert, N.; Burlina, A.; Chakrapani, A.; Dixon, M.; Huemer, M.; Karall, D.; Martinelli, D.; Crespo, P.S.; Santer, R.; et al. Suggested guidelines for the diagnosis and management of urea cycle disorders. Orphanet J. Rare Dis. 2012, 7, 32. [Google Scholar] [CrossRef]
- Durrant, C.; Fuehring, J.I.; Willemetz, A.; Chretien, D.; Sala, G.; Ghidoni, R.; Katz, A.; Rotig, A.; Thelestam, M.; Ermonval, M.; et al. Defects in Galactose Metabolism and Glycoconjugate Biosynthesis in a UDP-Glucose Pyrophosphorylase-Deficient Cell Line Are Reversed by Adding Galactose to the Growth Medium. Int. J. Mol. Sci. 2020, 21, 2028. [Google Scholar] [CrossRef]


| Elevated Metabolites in DBS of the Two Affected Siblings and the Heterozygous Father | |||||||
|---|---|---|---|---|---|---|---|
| (a) | |||||||
| Compound | I: 1 (Z-score) | II: 1 (Z-score) | II: 3 (Z-score) | Affected Pathway | HMDB ID | KEGG-ID | PPi formation |
| Galactose-1-phosphate | 0.569 | 6.475 | 5.690 | Galactose Metabolism | HMDB0000645 | map00052 | + |
| Isobutyrylglycine | 1.355 | 2.823 | 6.566 | Valine, Leucine and Isoleucine Degradation | HMDB0000730 | map00280 | − |
| Aminoadipic acid | 0.626 | 2.458 | 4.823 | Lysine Metabolism | HMDB0000510 | map00310 | − |
| 8-[(Aminomethyl)sulfanyl]-6-sulfanyloctanoic acid | 1.561 | 3.116 | 3.964 | Fatty Acid Synthesis/Beta-Oxidation | HMDB0013639 | map00071 | − |
| Imidazole acetol-phosphate | −0.328 | 2.325 | 4.607 | Histidine Metabolism | HMDB0012236 | map00340 | − |
| N-Acetylglutamine | Glycyl-Hydroxyproline | 0.700 | 3.434 | 2.965 | Glutamate Metabolism | HMDB0006029 | HMDB0011173 | map00250 | + |
| Galactitol | −0.624 | 3.156 | 2.812 | Galactose Metabolism | HMDB0000107 | map00052 | + |
| N6-Acetyl-L-lysine | 0.822 | 2.990 | 2.691 | Lysine Metabolism | HMDB0000206 | map00310 | − |
| Portulacaxanthin II | −0.102 | 2.811 | 2.947 | Betalain Metabolism | HMDB0012281 | map00965 | − |
| 2-Hexaprenyl-6-methoxy-1,4-benzoquinol | −0.845 | 3.064 | 2.234 | Ubiquinone and other Terpenoid-quinone Biosynthesis | HMDB0012148 | map00130 | + |
| 7-Sulfocholic acid | −1.741 | 2.289 | 2.982 | Bile Acid Synthesis | HMDB0002421 | map00120, map00121 | − |
| Pyrimidine | 0.887 | 2.069 | 2.489 | Pyrimidine Metabolism | HMDB0003361 | map00240 | + |
| N-Acetyl-L-glutamate 5-semialdehyde | 0.247 | 2.002 | 2.114 | Arginine and Proline Metabolism | HMDB0006488 | map00330 | + |
| (b) | |||||||
| Compound | I: 1 (Z-score) | II: 1 (Z-score) | II: 3 (Z-score) | Affected Pathway | HMDB ID | KEGG-ID | PPi formation |
| Vanilpyruvic acid | −2.226 | 4.723 | 2.692 | Nutrition | HMDB0011714 | NA | − |
| Methionyl-Arginine | −0.911 | 2.863 | 3.539 | Incomplete Protein Degradation | HMDB0028967 | NA | − |
| Prolyl-Tryptophan | 1.498 | 3.010 | 2.379 | Incomplete Protein Degradation | HMDB0029028 | NA | − |
| Hemorphin-4 | −0.352 | 2.233 | 2.422 | Blood Regulation | HMDB0059788 | NA | − |
| Tyramine-O-sulfate | −0.811 | 2.285 | 2.159 | Nutrition | HMDB0006409 | NA | − |
| 3-Methylhistidine | 1.449 | 2.183 | 2.221 | Muscle Degradation | HMDB0000479 | NA | − |
Disclaimer/Publisher’s Note: The statements, opinions and data contained in all publications are solely those of the individual author(s) and contributor(s) and not of MDPI and/or the editor(s). MDPI and/or the editor(s) disclaim responsibility for any injury to people or property resulting from any ideas, methods, instructions or products referred to in the content. |
© 2023 by the authors. Licensee MDPI, Basel, Switzerland. This article is an open access article distributed under the terms and conditions of the Creative Commons Attribution (CC BY) license (https://creativecommons.org/licenses/by/4.0/).
Share and Cite
Achleitner, M.T.; Jans, J.J.M.; Ebner, L.; Spenger, J.; Konstantopoulou, V.; Feichtinger, R.G.; Brugger, K.; Mayr, D.; Wevers, R.A.; Thiel, C.; et al. PPA1 Deficiency Causes a Deranged Galactose Metabolism Recognizable in Neonatal Screening. Metabolites 2023, 13, 1141. https://doi.org/10.3390/metabo13111141
Achleitner MT, Jans JJM, Ebner L, Spenger J, Konstantopoulou V, Feichtinger RG, Brugger K, Mayr D, Wevers RA, Thiel C, et al. PPA1 Deficiency Causes a Deranged Galactose Metabolism Recognizable in Neonatal Screening. Metabolites. 2023; 13(11):1141. https://doi.org/10.3390/metabo13111141
Chicago/Turabian StyleAchleitner, Melanie T., Judith J. M. Jans, Laura Ebner, Johannes Spenger, Vassiliki Konstantopoulou, René G. Feichtinger, Karin Brugger, Doris Mayr, Ron A. Wevers, Christian Thiel, and et al. 2023. "PPA1 Deficiency Causes a Deranged Galactose Metabolism Recognizable in Neonatal Screening" Metabolites 13, no. 11: 1141. https://doi.org/10.3390/metabo13111141
APA StyleAchleitner, M. T., Jans, J. J. M., Ebner, L., Spenger, J., Konstantopoulou, V., Feichtinger, R. G., Brugger, K., Mayr, D., Wevers, R. A., Thiel, C., Wortmann, S. B., & Mayr, J. A. (2023). PPA1 Deficiency Causes a Deranged Galactose Metabolism Recognizable in Neonatal Screening. Metabolites, 13(11), 1141. https://doi.org/10.3390/metabo13111141