
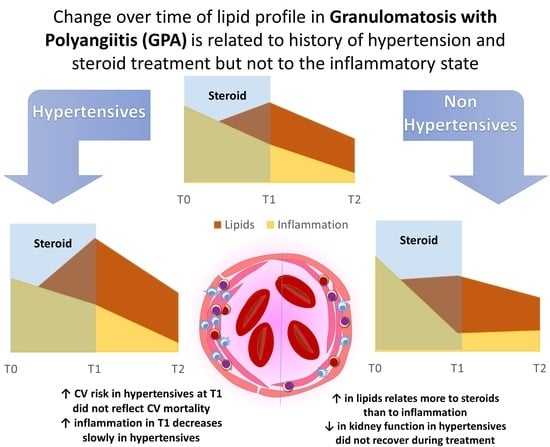
Changes in Lipids in Granulomatosis with Polyangiitis Relates to Glucocorticoids and History of Hypertension

 ,
,  ,
,  , ,
, ,  and
and
Abstract
1. Introduction
2. Materials and Methods
2.1. Study Population
2.2. Disease Activity and CV-Specific Risk Score
2.3. Birmingham Vasculitis Activity Score (BVAS)
2.4. European Society of Cardiology CV Risk Score
2.5. Statistical Analysis
3. Results
3.1. Population Characteristics and Organ Damage at Diagnosis
3.2. Arterial Hypertension Influences the Metabolic and Inflammatory State
3.3. Metabolic and Inflammatory Parameters
3.4. Diagnostic Delay, Population Survival, and CV Disease
4. Discussion
5. Conclusions
Supplementary Materials
Author Contributions
Funding
Institutional Review Board Statement
Informed Consent Statement
Data Availability Statement
Conflicts of Interest
References
- Robson, J.C.; Grayson, P.C.; Ponte, C.; Suppiah, R.; Craven, A.; Judge, A.; Khalid, S.; Hutchings, A.; Watts, R.A.; Merkel, P.A.; et al. 2022 American College of Rheumatology/European Alliance of Associations for Rheumatology Classification Criteria for Granulomatosis with Polyangiitis. Ann. Rheum. Dis. 2022, 81, 315–320. [Google Scholar] [CrossRef] [PubMed]
- Garlapati, P.; Qurie, A. Granulomatosis With Polyangiitis. In StatPearls; StatPearls Publishing: Treasure Island, FL, USA, 2023. [Google Scholar]
- Kitching, A.R.; Anders, H.-J.; Basu, N.; Brouwer, E.; Gordon, J.; Jayne, D.R.; Kullman, J.; Lyons, P.A.; Merkel, P.A.; Savage, C.O.S.; et al. ANCA-Associated Vasculitis. Nat. Rev. Dis. Primers 2020, 6, 71. [Google Scholar] [CrossRef]
- Jennette, J.C.; Falk, R.J.; Bacon, P.A.; Basu, N.; Cid, M.C.; Ferrario, F.; Flores-Suarez, L.F.; Gross, W.L.; Guillevin, L.; Hagen, E.C.; et al. 2012 Revised International Chapel Hill Consensus Conference Nomenclature of Vasculitides. Arthritis Rheum. 2013, 65, 1–11. [Google Scholar] [CrossRef] [PubMed]
- Dammacco, F.; Cicco, S.; Ribatti, D.; Vacca, A. Granulomatosis with Polyangiitis (Wegener’s). In Systemic Vasculitides: Current Status and Perspectives; Dammacco, F., Ribatti, D., Vacca, A., Eds.; Springer International Publishing: Cham, Switzerland, 2016; pp. 119–128. ISBN 978-3-319-40134-8. [Google Scholar]
- Jayne, D. The Diagnosis of Vasculitis. Best Pract. Res. Clin. Rheumatol. 2009, 23, 445–453. [Google Scholar] [CrossRef]
- Seo, P.; Stone, J.H. The Antineutrophil Cytoplasmic Antibody-Associated Vasculitides. Am. J. Med. 2004, 117, 39–50. [Google Scholar] [CrossRef]
- Dammacco, R.; Biswas, J.; Mohanan-Earatt, A.; Lisch, W.; Zito, F.A.; Rubini, G.; Manno, C.; Cicco, S.; Alessio, G.; Dammacco, F. The Eye Is a Common Site of Granulomatosis with Polyangiitis. A Collaborative Study. BMC Ophthalmol. 2023, 23, 26. [Google Scholar] [CrossRef] [PubMed]
- Chironi, G.; Pagnoux, C.; Simon, A.; Pasquinelli-Balice, M.; Del-Pino, M.; Gariepy, J.; Guillevin, L. Increased Prevalence of Subclinical Atherosclerosis in Patients with Small-Vessel Vasculitis. Heart 2007, 93, 96–99. [Google Scholar] [CrossRef] [PubMed][Green Version]
- Swets, B.P.; Brouwer, D.A.; Tervaert, J.W. Patients with Systemic Vasculitis Have Increased Levels of Autoantibodies against Oxidized LDL. Clin. Exp. Immunol. 2001, 124, 163–167. [Google Scholar] [CrossRef]
- Cicco, S.; Desantis, V.; Vacca, A.; Cazzato, G.; Solimando, A.G.; Cirulli, A.; Noviello, S.; Susca, C.; Prete, M.; Brosolo, G.; et al. Cardiovascular Risk in Patients With Takayasu Arteritis Directly Correlates With Diastolic Dysfunction and Inflammatory Cell Infiltration in the Vessel Wall: A Clinical, Ex Vivo and in Vitro Analysis. Front. Med. 2022, 9, 863150. [Google Scholar] [CrossRef]
- Leone, P.; Cicco, S.; Prete, M.; Solimando, A.G.; Susca, N.; Crudele, L.; Buonavoglia, A.; Colonna, P.; Dammacco, F.; Vacca, A.; et al. Early Echocardiographic Detection of Left Ventricular Diastolic Dysfunction in Patients with Systemic Lupus Erythematosus Asymptomatic for Cardiovascular Disease. Clin. Exp. Med. 2020, 20, 11–19. [Google Scholar] [CrossRef]
- Zhu, Y.; Xian, X.; Wang, Z.; Bi, Y.; Chen, Q.; Han, X.; Tang, D.; Chen, R. Research Progress on the Relationship between Atherosclerosis and Inflammation. Biomolecules 2018, 8, 80. [Google Scholar] [CrossRef]
- Conigrave, K.M.; Saunders, J.B.; Reznik, R.B. Predictive Capacity of the AUDIT Questionnaire for Alcohol-Related Harm. Addiction 1995, 90, 1479–1485. [Google Scholar] [CrossRef] [PubMed]
- Contois, J.H.; Warnick, G.R.; Sniderman, A.D. Reliability of Low-Density Lipoprotein Cholesterol, Non-High-Density Lipoprotein Cholesterol, and Apolipoprotein B Measurement. J. Clin. Lipidol. 2011, 5, 264–272. [Google Scholar] [CrossRef]
- Inker, L.A.; Eneanya, N.D.; Coresh, J.; Tighiouart, H.; Wang, D.; Sang, Y.; Crews, D.C.; Doria, A.; Estrella, M.M.; Froissart, M.; et al. New Creatinine- and Cystatin C–Based Equations to Estimate GFR without Race. N. Engl. J. Med. 2021, 385, 1737–1749. [Google Scholar] [CrossRef]
- Yaseen, K.; Mandell, B.F. ANCA Associated Vasculitis (AAV): A Review for Internists. Postgrad. Med 2023, 135, 3–13. [Google Scholar] [CrossRef] [PubMed]
- Fijolek, J.; Wiatr, E.; Petroniec, V.; Augustynowicz-Kopec, E.; Bednarek, M.; Gawryluk, D.; Roszkowski-Sliz, K. Antineutrophil Cytoplasmic Antibodies and Their Relationship with Disease Activity and Presence of Staphylococcal Superantigens in Nasal Swabs in Patients Having Granulomatosis with Polyangiitis: Results of a Study Involving 115 Patients from a Single Center. Clin. Rheumatol. 2019, 38, 3297–3305. [Google Scholar] [CrossRef] [PubMed]
- Cicco, S.; Castellana, G.; Marra, L.; Di Lecce, V.; Carratù, P.; Prete, M.; Ranieri, G.; Resta, O.; Carpagnano, G.E.; Racanelli, V.; et al. Galectin-3 and Neutrophil-to-Lymphocyte Ratio Are Indicative of Heart Remodelling and Disease Severity in Patients with Obstructive Sleep Apnoea. Sleep Med. 2021, 82, 117–124. [Google Scholar] [CrossRef]
- Lamichhane, P.; Agrawal, A.; Abouainain, Y.; Abousahle, S.; Regmi, P.R. Utility of Neutrophil-to-High-Density Lipoprotein-Cholesterol Ratio in Patients with Coronary Artery Disease: A Narrative Review. J. Int. Med. Res. 2023, 51, 030006052311665. [Google Scholar] [CrossRef]
- Scurt, F.G.; Hirschfeld, V.; Schubert, L.; Mertens, P.R.; Chatzikyrkou, C. Monitoring Disease Activity in Antineutrophil Antibody-associated Vasculitis. Scand. J. Immunol. 2023, 98, e13284. [Google Scholar] [CrossRef]
- Mukhtyar, C.; Lee, R.; Brown, D.; Carruthers, D.; Dasgupta, B.; Dubey, S.; Flossmann, O.; Hall, C.; Hollywood, J.; Jayne, D.; et al. Modification and Validation of the Birmingham Vasculitis Activity Score (Version 3). Ann. Rheum. Dis. 2009, 68, 1827–1832. [Google Scholar] [CrossRef]
- SCORE2 Working Group and ESC Cardiovascular Risk Collaboration; Hageman, S.; Pennells, L.; Ojeda, F.; Kaptoge, S.; Kuulasmaa, K.; De Vries, T.; Xu, Z.; Kee, F.; Chung, R.; et al. SCORE2 Risk Prediction Algorithms: New Models to Estimate 10-Year Risk of Cardiovascular Disease in Europe. Eur. Heart J. 2021, 42, 2439–2454. [Google Scholar] [CrossRef]
- Borowiec, A.; Kowalik, I.; Chwyczko, T.; Jankowski, J.; Kandyba, P.; Życińska, K. Predictors of Cardiovascular Events in Patients with Primary Systemic Vasculitis: A 5 Years Prospective Observational Study. Eur. J. Intern. Med. 2021, 91, 70–74. [Google Scholar] [CrossRef]
- Ference, B.A.; Ginsberg, H.N.; Graham, I.; Ray, K.K.; Packard, C.J.; Bruckert, E.; Hegele, R.A.; Krauss, R.M.; Raal, F.J.; Schunkert, H.; et al. Low-Density Lipoproteins Cause Atherosclerotic Cardiovascular Disease. 1. Evidence from Genetic, Epidemiologic, and Clinical Studies. A Consensus Statement from the European Atherosclerosis Society Consensus Panel. Eur. Heart J. 2017, 38, 2459–2472. [Google Scholar] [CrossRef] [PubMed]
- Poppe, K.K.; Wells, S.; Jackson, R.; Doughty, R.N.; Kerr, A.J. Predicting Cardiovascular Disease Risk across the Atherosclerotic Disease Continuum. Eur. J. Prev. Cardiol. 2022, 28, 2010–2017. [Google Scholar] [CrossRef]
- de Leeuw, K.; Sanders, J.-S.; Stegeman, C.; Smit, A.; Kallenberg, C.G.; Bijl, M. Accelerated Atherosclerosis in Patients with Wegener’s Granulomatosis. Ann. Rheum. Dis. 2005, 64, 753–759. [Google Scholar] [CrossRef]
- Kominsky, D.J.; Campbell, E.L.; Colgan, S.P. Metabolic Shifts in Immunity and Inflammation. J. Immunol. 2010, 184, 4062–4068. [Google Scholar] [CrossRef] [PubMed]
- Booth, A.D.; Almond, M.K.; Burns, A.; Ellis, P.; Gaskin, G.; Neild, G.H.; Plaisance, M.; Pusey, C.D.; Jayne, D.R.W. Outcome of ANCA-Associated Renal Vasculitis: A 5-Year Retrospective Study. Am. J. Kidney Dis. 2003, 41, 776–784. [Google Scholar] [CrossRef]
- Walsh, M.; Merkel, P.A.; Peh, C.-A.; Szpirt, W.M.; Puéchal, X.; Fujimoto, S.; Hawley, C.M.; Khalidi, N.; Floßmann, O.; Wald, R.; et al. Plasma Exchange and Glucocorticoids in Severe ANCA-Associated Vasculitis. N. Engl. J. Med. 2020, 382, 622–631. [Google Scholar] [CrossRef]
- Rota, S.; Rambaldi, A.; Gaspari, F.; Noris, M.; Daina, E.; Benigni, A.; Perna, A.; Donadelli, R.; Remuzzi, G.; Garattini, S. Methylprednisolone Dosage Effects on Peripheral Lymphocyte Subpopulations and Eicosanoid Synthesis. Kidney Int. 1992, 42, 981–990. [Google Scholar] [CrossRef]
- Saag, K.G.; Koehnke, R.; Caldwell, J.R.; Brasington, R.; Burmeister, L.F.; Zimmerman, B.; Kohler, J.A.; Furst, D.E. Low Dose Long-Term Corticosteroid Therapy in Rheumatoid Arthritis: An Analysis of Serious Adverse Events. Am. J. Med. 1994, 96, 115–123. [Google Scholar] [CrossRef]
- Wallace, Z.S.; Fu, X.; Liao, K.; Kallenberg, C.G.M.; Langford, C.A.; Merkel, P.A.; Monach, P.; Seo, P.; Specks, U.; Spiera, R.; et al. Disease Activity, Antineutrophil Cytoplasmic Antibody Type, and Lipid Levels in Antineutrophil Cytoplasmic Antibody-Associated Vasculitis. Arthritis Rheumatol. 2019, 71, 1879–1887. [Google Scholar] [CrossRef] [PubMed]
- Flossmann, O.; Berden, A.; De Groot, K.; Hagen, C.; Harper, L.; Heijl, C.; Höglund, P.; Jayne, D.; Luqmani, R.; Mahr, A.; et al. Long-Term Patient Survival in ANCA-Associated Vasculitis. Ann. Rheum. Dis. 2011, 70, 488–494. [Google Scholar] [CrossRef] [PubMed]
- Sun, G.; Yafasova, A.; Baslund, B.; Faurschou, M.; Schou, M.; Shams-Eldin, A.N.; Kristensen, S.L.; Weeke, P.E.; Torp-Pedersen, C.; Fosbøl, E.L.; et al. Long-Term Risk of Heart Failure and Other Adverse Cardiovascular Outcomes in Granulomatosis With Polyangiitis: A Nationwide Cohort Study. J. Rheumatol. 2022, 49, 291–298. [Google Scholar] [CrossRef] [PubMed]
- Akman, B.; Uyar, M.; Afsar, B.; Sezer, S.; Ozdemir, F.N.; Haberal, M. Lipid Profile During Azathioprine or Mycophenolate Mofetil Combinations With Cyclosporine and Steroids. Transplant. Proc. 2007, 39, 135–137. [Google Scholar] [CrossRef] [PubMed]


| Parameter | Value |
|---|---|
| Demography | |
| Age (years) | 54.73 ± 17.20 |
| Females/males | 18 F/18 M |
| Smokers | 1 [2.8%] |
| Clinical | |
| SBP (mmHg) | 129.4 ± 13.5 |
| DBP (mmHg) | 76.5 ± 8.1 |
| HR (bpm) | 80.7 ± 10.7 |
| BVAS | 10.7 ± 5.2 |
| ESC SCORE2/2-OP | 4.3 ± 2.2 |
| Hypertension | 20 [55%] |
| Diabetes | 10 [27%] |
| Length of hospitalization (median days) | 9.5 [5–16.7] |
| Mean survival (months) | 70 [36–113] |
| Disease localization at T0 diagnosis | |
| ENT | 29 [82%] |
| Lung | 21 [59%] |
| Kidney | 2 [9%] |
| Brain | 7 [18%] |
| Abdomen | 3 [18%] |
| Heart | 3 [9%] |
| Skin | 5 [14%] |
| Eyes | 15 [41%] |
| Joints | 7 [18%] |
| Therapy at T0 dismission | |
| Glucocorticoid | 36 [100%] |
| Azathioprine | 11 [31%] |
| Cyclophosphamide | 13 [36%] |
| Methotrexate | 5 [14%] |
| Angiotensin-converting enzyme 2 inhibitors | 2 [5%] |
| Angiotensin II receptor blockers | 10 [27%] |
| Calcium antagonist | 8 [23%] |
| Beta-blockers | 5 [14%] |
| T0 | T1 | P T1 vs. T0 | T2 | P T2 vs. T0 | P T2 vs. T1 | |
|---|---|---|---|---|---|---|
| SBP (mmHg) | 130 ± 13.5 | 135.7 ± 13.4 | ns | 133.5 ± 10.6 | ns | ns |
| DBP (mmHg) | 76.5 ± 7.9 | 77.1 ± 7.2 | ns | 78.5 ± 6.6 | ns | ns |
| HR (bpm) | 80.7 ± 10.5 | 84.4 ± 11.1 | ns | 74.4 ± 9.3 | ns | 0.043 |
| Hb (mg/dL) | 11.9 ± 1.4 | 12.8 ± 1.7 | 0.032 | 14.5 ± 1.6 | 0.0001 | 0.013 |
| MCV (fL) | 84.6 ± 7.1 | 84.5± 9.3 | ns | 85.6 ± 11.2 | ns | ns |
| WBC (×103/dL) | 8.69 ± 3.83 | 8.18 ± 4.26 | ns | 9.50 ± 4.39 | ns | ns |
| N (×103/μL) | 6.47 ± 0.98 | 5.79 ± 0.13 | ns | 6.00 ± 1.94 | 0.018 | ns |
| L (×103/μL) | 1.52 ± 0.79 | 1.70 ± 1.05 | ns | 9.48 ± 2.12 | ns | ns |
| E (×103/μL) | 1.04.2 ± 0.08 | 0.16 ± 0.11 | ns | 0.27 ± 0.08 | 0.0001 | ns |
| M (×103/μL) | 0.54 ± 0.19 | 0.42 ± 0.21 | ns | 0.51 ± 0.31 | ns | ns |
| PLT (×103/μL) | 231 ± 7.9 | 299 ± 15 | ns | 193 ± 100 | 0.025 | 0.048 |
| Creatinine (mg/dL) | 2.1 ± 3.1 | 1.2 ± 0.1 | ns | 0.9 ± 0.2 | ns | ns |
| eGFR (ml/min) | 78.9 ± 30.6 | 83.3 ± 20.8 | ns | 81.6 ± 17.3 | ns | ns |
| Uric acid (mg/dL) | 3.9 ± 0.5 | 4.7 ± 0.6 | ns | 7.5 ± 0.4 | 0.001 | 0.025 |
| T0 | T1 | P T1 vs. T0 | T2 | P T2 vs. T0 | P T2 vs. T1 | |
|---|---|---|---|---|---|---|
| SBP (mmHg) | 136.5 ± 11.7 | 138.3 ± 12.6 | ns | 139 ± 6.9 | ns | ns |
| DBP (mmHg) | 76.5 ± 8.6 | 78.3 ± 7.1 | ns | 80 ± 6.6 | ns | ns |
| HR (bpm) | 83.2 ± 11.2 | 88 ± 9.1 | ns | 78 ± 6.2 | ns | 0.023 |
| Hb (mg/dL) | 11.3 ± 2.1 | 12.9 ± 2.1 | 0.038 | 13.6 ± 1.5 | ns | ns |
| MCV (fL) | 87.5 ± 6.1 | 89.5 ± 4.5 | ns | 96.2 ± 8.2 | ns | ns |
| WBC (×103/dL) | 9.09 ± 3.07 | 8.25 ± 3.18 | ns | 14.38 ±4.59 | 0.037 | 0.026 |
| N (×103/μL) | 6.94 ± 1.08 | 5.978.3 ± 1.66.4 | ns | 12.28 ± 2.17 | 0.001 | ns |
| L (×103/μL) | 1.47 ± 0.88 | 1.74 ± 0.14 | ns | 0,59 ± 0.82 | 0.031 | ns |
| NLR | 7.5 ± 5.8 | 22.6 ± 31.6 | 0.015 | 20.8 ± 16.2 | 0.005 | ns |
| E (×103/μL) | 100 ± 100 | 90.7 ± 57.7 | ns | 0.16 ± 0.12 | ns | ns |
| M (×103/μL) | 0.54 ± 0.15 | 0.52 ± 0.09 | ns | 0.16 ± 0.24 | 0.001 | 0.001 |
| PLT (×103/μL) | 252 ± 89 | 241 ± 55 | 124 ± 43.2 | 0.021 | ||
| Creatinine (mg/dL) | 1.8 ± 2.5 | 1.1 ± 1.1 | ns | 1.5 ± 1.3 | ns | ns |
| eGFR (mL/min) | 68.6 ± 28.7 | 65.3 ± 16.5 | ns | 56 ± 20.4 | ns | ns |
| Uric acid (mg/dL) | 5.2 ± 1.2 | 5.2 ± 0.2 | ns | 7.5 ± 0.6 | 0.024 | 0.024 |
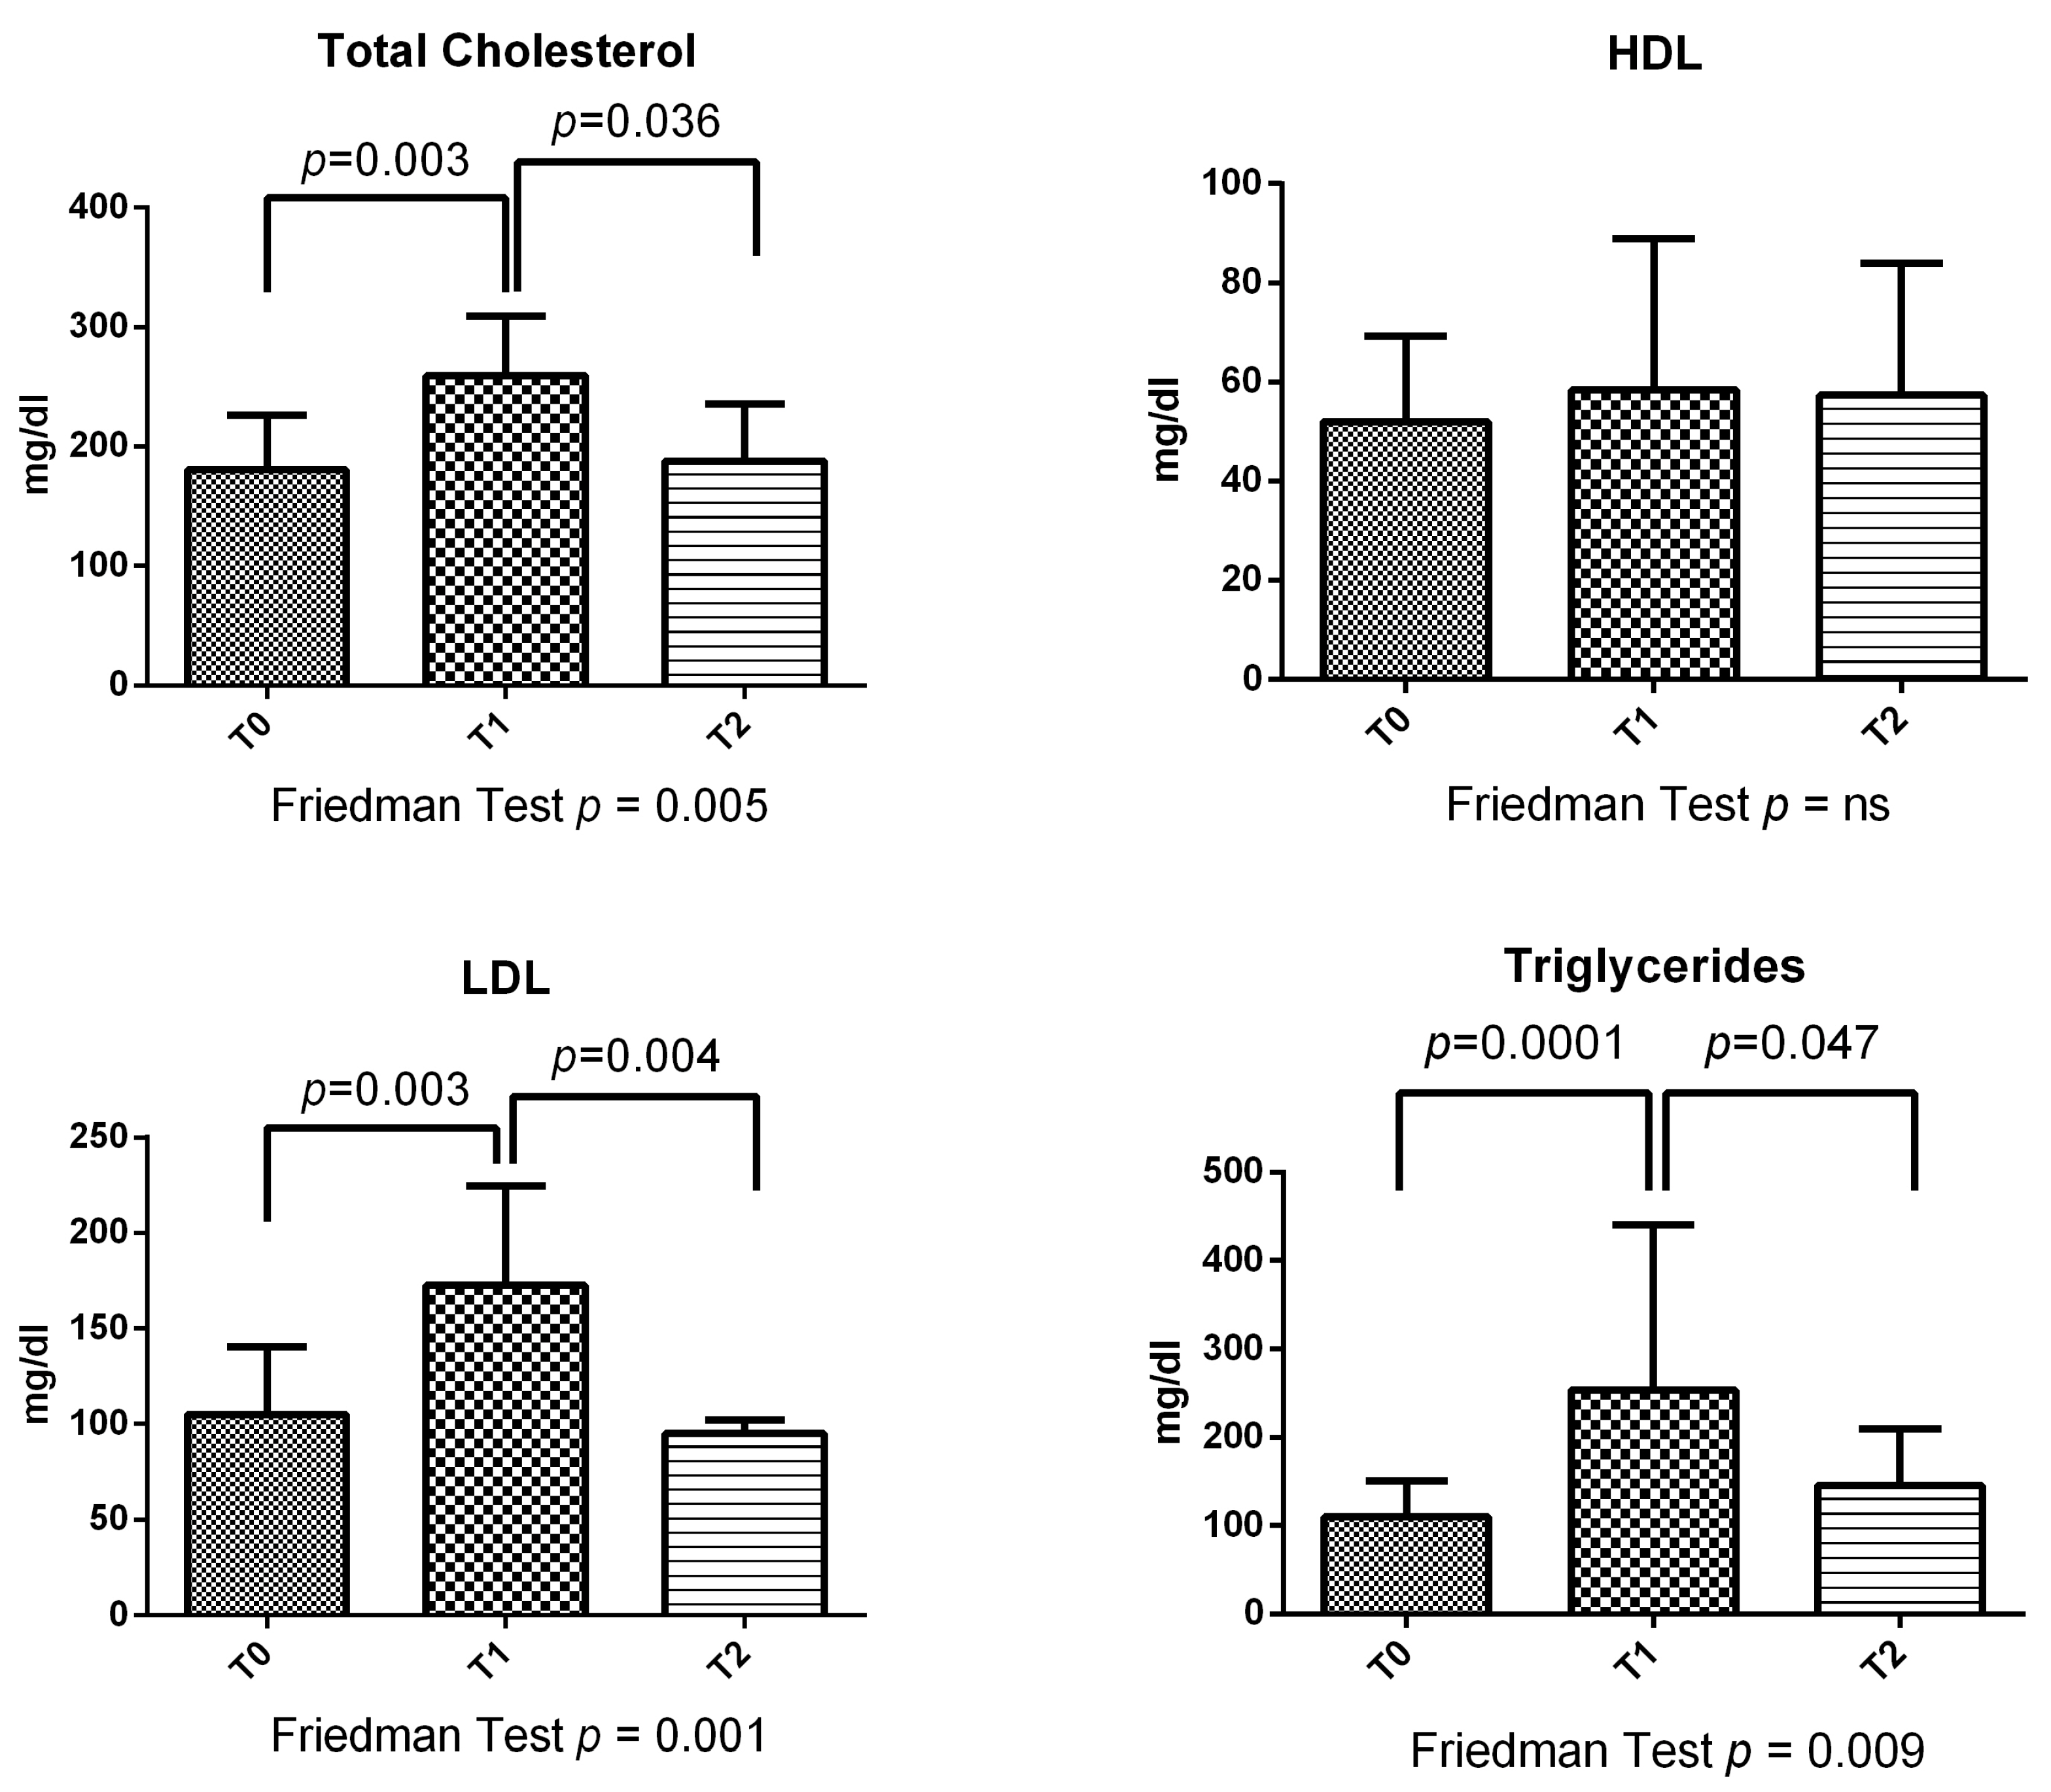
| Total cholesterol (mg/dL) | 177.1 ± 47.7 | 306 ± 53.6 | 0.002 | 120 ± 18.6 | ns | ns |
| HDL (mg/dL) | 49.4 ± 16.6 | 36.8 ± 15.9 | ns | 32.2 ± 7.1 | ns | 0.042 |
| NHR (cel/μL) | 156.4 ± 86.1 | 154.1 ± 77.5 | ns | 145 ± 48.3 | ns | ns |
| LDL (mg/dL) | 94 ± 41.1 | 221.4 ± 51.2 | 0.001 | 132.5 ± 36.8 | ns | 0.021 |
| Triglycerides (mg/dL) | 115.8 ± 48.5 | 357.2 ± 138.7 | 0.0001 | 95 ± 28.8 | ns | 0.010 |
| hsCRP (mg/L) | 57.1 ± 82.3 | 13.6 ± 23.1 | ns | 3.1 ± 1.4 | 0.029 | ns |
| ESR (mm/h) | 62.7 ± 36.2 | 45.7 ± 20.7 | ns | 26.2 ± 18.1 | 0.015 | 0.034 |
| T0 | T1 | P T1 vs. T0 | T2 | P T2 vs. T0 | P T2 vs. T1 | |
|---|---|---|---|---|---|---|
| SBP (mmHg) | 119.1 ± 8.7 | 120 ± 6.6 | ns | 120 ± 7.9 | ns | ns |
| DBP (mmHg) | 76.6 ± 7.1 | 70.2 ± 5.1 | ns | 75 ± 5.7 | ns | ns |
| HR (bpm) | 77 ± 8.5 | 70 ± 9.1 | 0.016 | 60 ± 8.2 | 0.018 | ns |
| Hb (mg/dL) | 12.1 ± 1.1 | 12.6 ± 1.1 | ns | 14.7 ± 1.7 | 0.003 | 0.013 |
| MCV (fL) | 82.6 ± 7.8 | 78.3 ± 10.2 | ns | 83.1 ± 11.1 | ns | ns |
| WBC (×103/dL) | 7,80 ± 4.25 | 8.07 ± 6.01 | 0.065 | 8.28 ± 4.04 | 0.055 | ns |
| N (×103/μL) | 5709.6 ± 850.2 | 5521.9 ± 282.5 | 0.001 | 4.75 ± 0.90 | 0.003 | 0.006 |
| L (×103/μL) | 1404 ± 694.2 | 1646.8 ± 298.7 | ns | 2.21 ± 1.89 | ns | ns |
| NLR | 6.8 ± 6.1 | 3.4 ± 0.8 | 0.021 | 7.1 ± 10.1 | ns | ns |
| E (×103/μL) | 0.10 ± 0.07 | 0.26 ± 0.09 | 0.001 | 0.23 ± 0.07 | 0.0001 | 0.001 |
| M (×103/μL) | 0.49 ± 0.20 | 0.27 ± 0.27 | 0.045 | 0.63 ± 0.01 | ns | 0.041 |
| PLT (×103/μL) | 268 ± 71.7 | 357 ± 207 | ns | 210.7 ±105.6 | 0.007 | ns |
| Creatinine (mg/dL) | 1.1 ± 0.8 | 1.2 ± 0.2 | 0.038 | 0.9 ± 0.2 | ns | 0.017 |
| eGFR (ml/min) | 86.4 ± 35.6 | 109.1 ± 52.8 | 0.007 | 81.6 ± 21.4 | 0.049 | 0.026 |
| Uric acid (mg/dL) | 4.6 ± 1.6 | 4.3 ± 0.2 | ns | 3.7 ± 5.3 | ns | ns |
| Total cholesterol (mg/dL) | 182.4 ± 45.5 | 213 ± 58.6 | 0.005 | 208.3 ± 28.9 | ns | ns |
| HDL (mg/dL) | 55.4 ± 17.6 | 80.1 ± 15.9 | 0.002 | 72.5 ± 14.2 | 0.017 | ns |
| NHR (cel/μL) | 120.8 ± 60.2 | 73.8 ± 50.2 | ns | 81.7 ± 45.9 | ns | ns |
| LDL (mg/dL) | 115.6 ± 26.1 | 124.1 ± 31.2 | ns | 95 ± 8.1 | 0.008 | 0.009 |
| Triglycerides (mg/dL) | 105.1 ± 35.9 | 146 ± 18.7 | 0.038 | 231 ± 15.2 | 0.0001 | ns |
| hsCRP (mg/L) | 309.1 ± 436.8 | 5.5 ± 9.6 | 0.034 | 5.3 ± 3.9 | 0.038 | ns |
| ESR (mm/h) | 56 ± 26.3 | 14 ± 9.7 | 0.0001 | 17 ± 9.3 | 0.0001 | ns |
Disclaimer/Publisher’s Note: The statements, opinions and data contained in all publications are solely those of the individual author(s) and contributor(s) and not of MDPI and/or the editor(s). MDPI and/or the editor(s) disclaim responsibility for any injury to people or property resulting from any ideas, methods, instructions or products referred to in the content. |
© 2023 by the authors. Licensee MDPI, Basel, Switzerland. This article is an open access article distributed under the terms and conditions of the Creative Commons Attribution (CC BY) license (https://creativecommons.org/licenses/by/4.0/).
Share and Cite
Marozzi, M.S.; Vacca, A.; Desantis, V.; Panebianco, T.; Catena, C.; Brosolo, G.; Noviello, S.; Cirulli, A.; Solimando, A.G.; Sechi, L.A.; et al. Changes in Lipids in Granulomatosis with Polyangiitis Relates to Glucocorticoids and History of Hypertension. Metabolites 2023, 13, 1053. https://doi.org/10.3390/metabo13101053
Marozzi MS, Vacca A, Desantis V, Panebianco T, Catena C, Brosolo G, Noviello S, Cirulli A, Solimando AG, Sechi LA, et al. Changes in Lipids in Granulomatosis with Polyangiitis Relates to Glucocorticoids and History of Hypertension. Metabolites. 2023; 13(10):1053. https://doi.org/10.3390/metabo13101053
Chicago/Turabian StyleMarozzi, Marialuisa Sveva, Antonio Vacca, Vanessa Desantis, Teresa Panebianco, Cristiana Catena, Gabriele Brosolo, Silvia Noviello, Anna Cirulli, Antonio Giovanni Solimando, Leonardo Alberto Sechi, and et al. 2023. "Changes in Lipids in Granulomatosis with Polyangiitis Relates to Glucocorticoids and History of Hypertension" Metabolites 13, no. 10: 1053. https://doi.org/10.3390/metabo13101053
APA StyleMarozzi, M. S., Vacca, A., Desantis, V., Panebianco, T., Catena, C., Brosolo, G., Noviello, S., Cirulli, A., Solimando, A. G., Sechi, L. A., Cicco, S., & Ria, R. (2023). Changes in Lipids in Granulomatosis with Polyangiitis Relates to Glucocorticoids and History of Hypertension. Metabolites, 13(10), 1053. https://doi.org/10.3390/metabo13101053