
Mitochondrial and Endoplasmic Reticulum Stress Trigger Triglyceride Accumulation in Models of Parkinson’s Disease Independent of Mutations in MAPT


 ,
,
Abstract
1. Introduction
2. Materials and Methods
2.1. Cell Culture and Dopaminergic Differentiation
2.2. Drug Treatments
2.3. Generation of Isogenic Heterozygous and Homozygous MAPT N279K hiPSCs
2.4. Chemicals and Reagents
2.5. Sample Preparation
2.6. LC-MS Analysis of Aqueous Phase (HILIC)
2.7. LC-MS Analysis of Non-Aqueous Phase (Reversed Phase)
2.8. Data Processing and Statistical Analysis
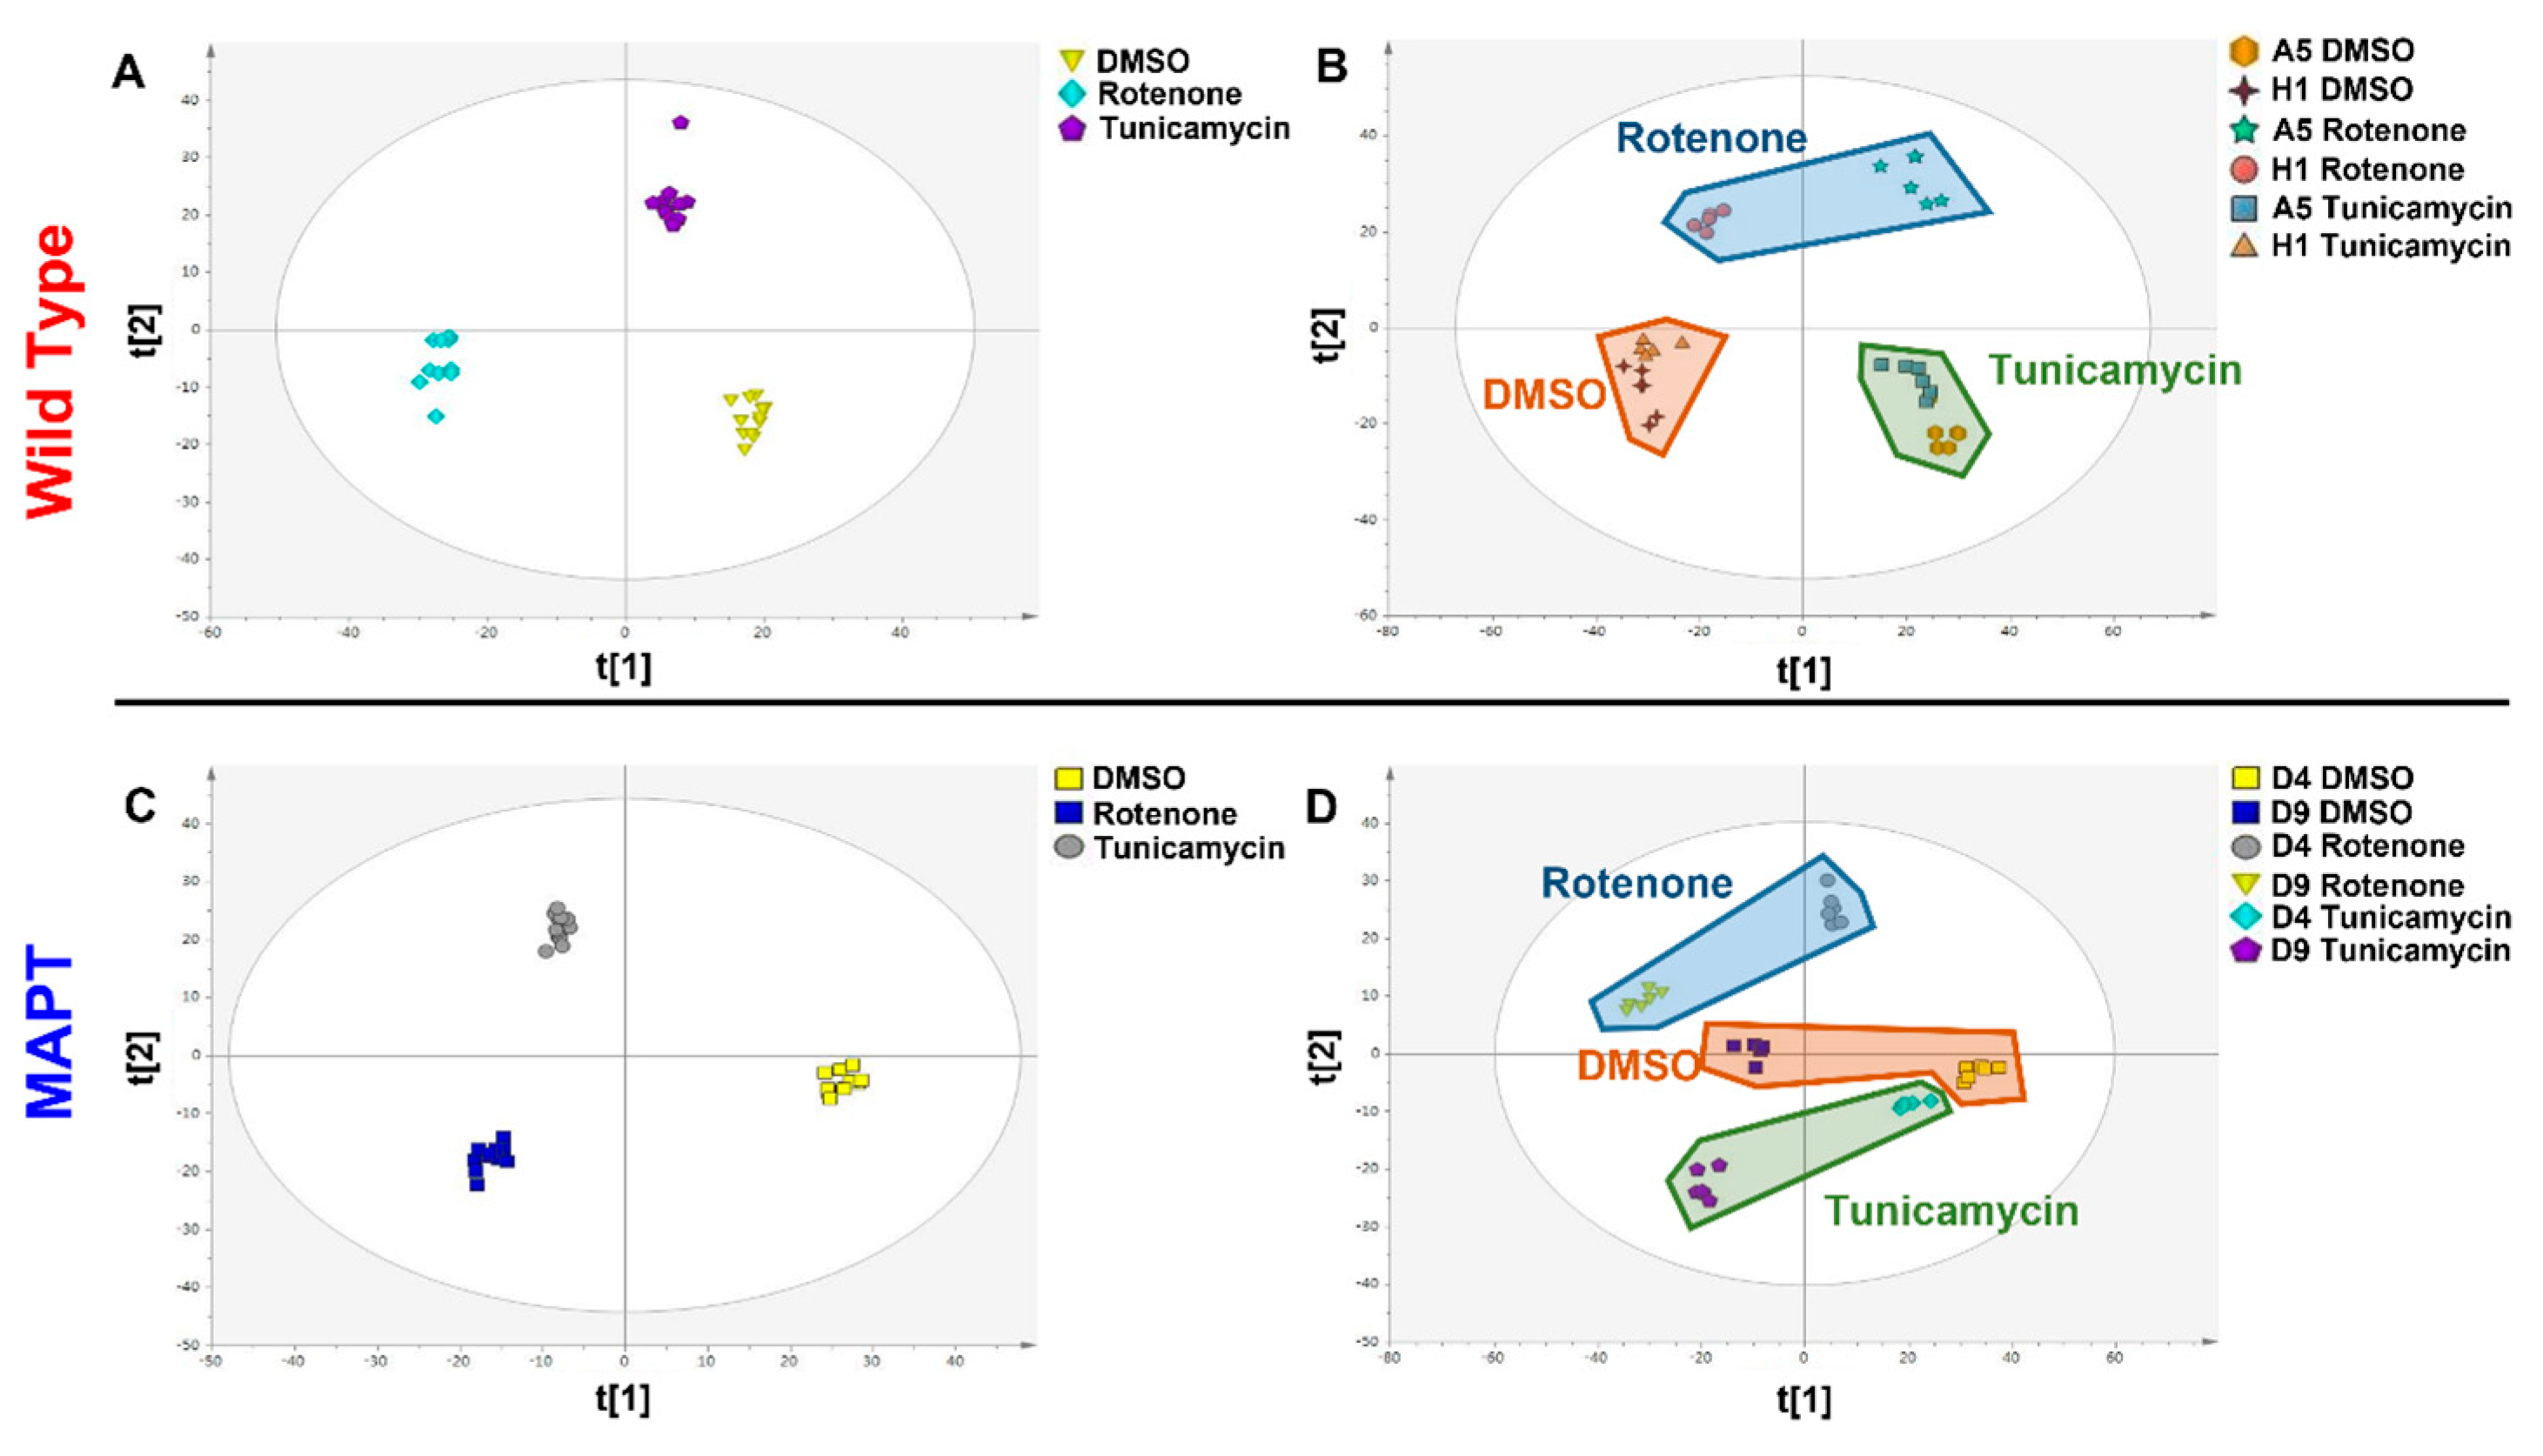
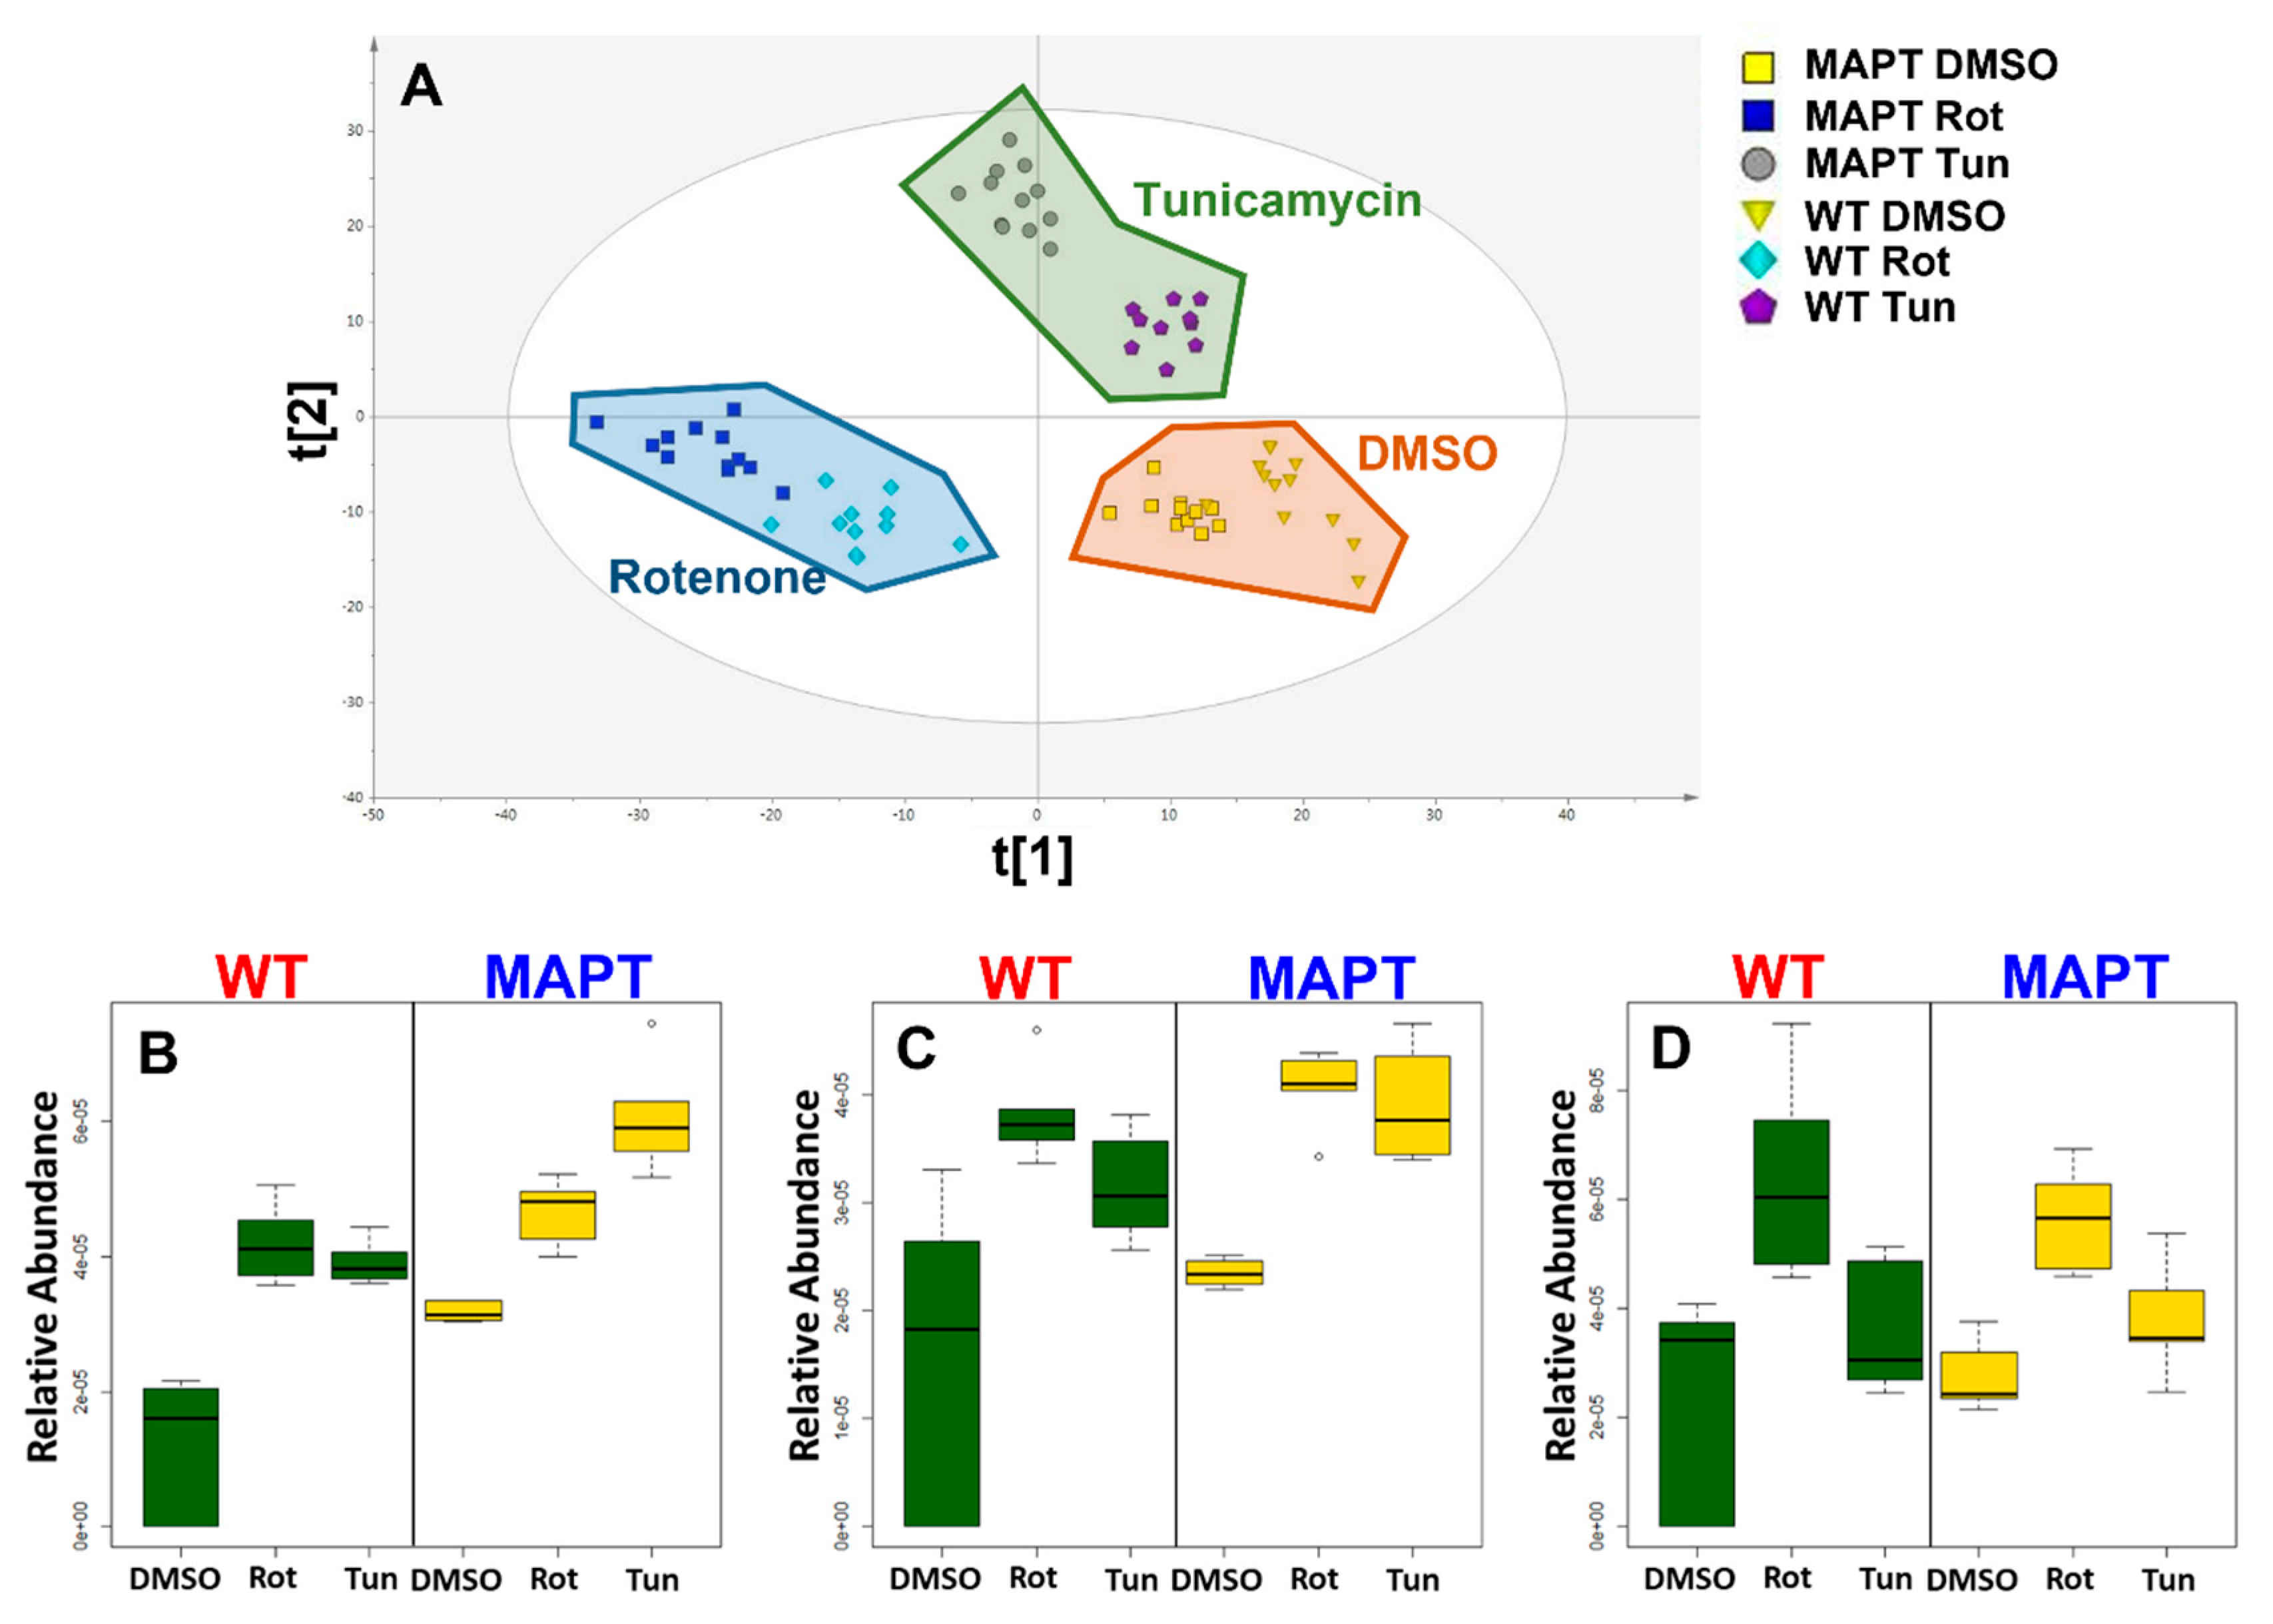
3. Results
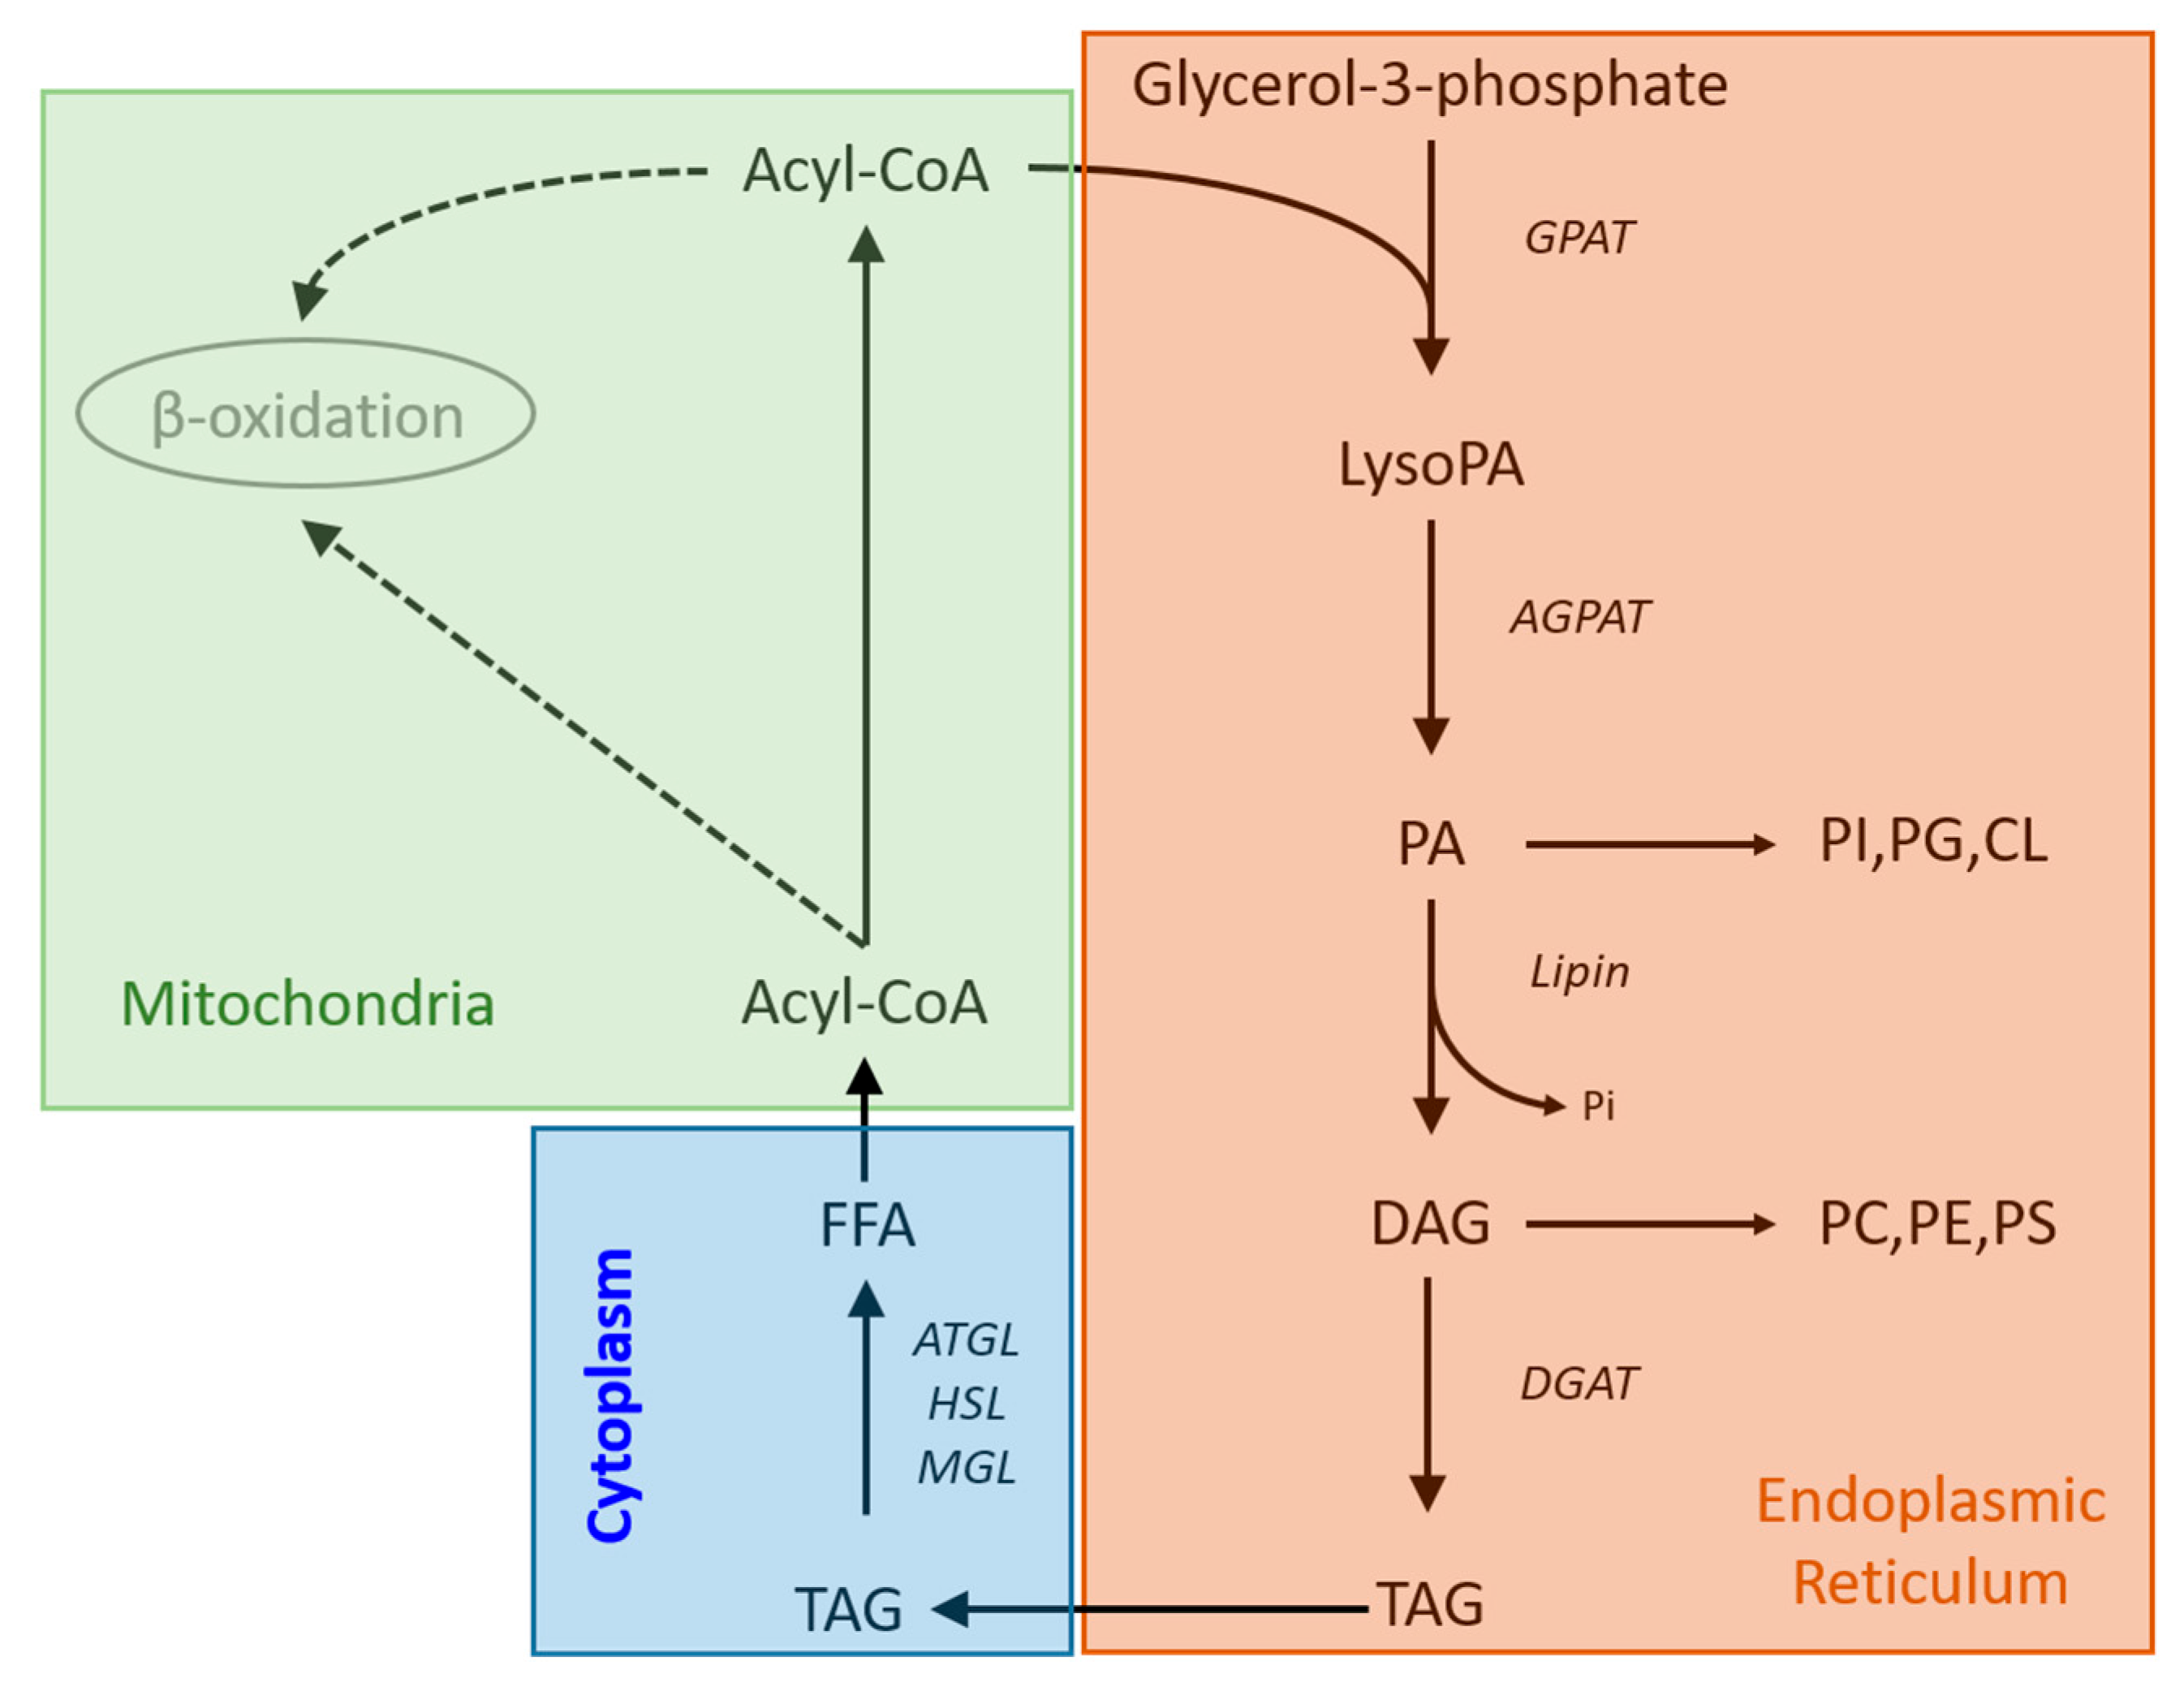
4. Discussion
5. Conclusions
Author Contributions
Funding
Institutional Review Board Statement
Informed Consent Statement
Data Availability Statement
Conflicts of Interest
References
- Parkinson’s Disease UK. The Incidence and Prevalence of Parkinson’s in the UK: Summary of Findings. 2018. Available online: https://www.parkinsons.org.uk/professionals/resources/incidence-and-prevalence-parkinsons-uk-report (accessed on 27 January 2021).
- Kalia, L.V.; Lang, A.E. Parkinson’s disease. Lancet 2015, 386, 896–912. [Google Scholar] [CrossRef] [PubMed]
- Warner, T.T.; Schapira, A.H.V. Genetic and environmental factors in the cause of Pakinson’s disease. Ann. Neurol. 2003, 53, S16–S25. [Google Scholar] [PubMed]
- McCulloch, C.C.; Kay, D.M.; Factor, S.A.; Samii, A.; Nutt, J.G.; Higgins, D.S.; Griffith, A.; Roberts, J.W.; Leis, B.C.; Montimurro, J.S.; et al. Exploring gene-environment interactions in Parkinson’s disease. Hum. Genet. 2008, 123, 257–265. [Google Scholar] [CrossRef]
- Villar-Pique, A.; Lopes da Fonseca, T.; Outeiro, T.F. Structure, function and toxicity of alpha-synuclein: The Bermuda triangle in synucleinopathies. J. Neurochem. 2016, 139, 240–255. [Google Scholar]
- Zambon, F.; Cherubini, M.; Fernandes, H.J.R.; Lang, C.; Ryan, B.J.; Volpato, V.; Bengoa-Vergniory, N.; Vingill, S.; Attar, M.; Booth, H.D.E.; et al. Cellular α-synuclein pathology is associated with bioenergetic dysfunction in Parkinson’s iPSC-derived dopamine neurons. Hum. Mol. Genet. 2019, 28, 2001–2013. [Google Scholar] [CrossRef]
- Fernandes, H.J.R.; Hartfiled, E.M.; Christian, H.C.; Emmanoulidou, E.; Zheng, Y.; Booth, H.; Bogetofte, H.; Lang, C.; Ryan, B.J.; Sardi, S.P.; et al. ER stress and autophagic perturbations lead to elevated extracellular α-synuclein in GBA-N370S Parkinson’s iPSC-derived dopamine neurons. Stem Cell Rep. 2016, 6, 342–356. [Google Scholar] [CrossRef]
- Marella, M.; Seo, B.B.; Yagi, T.; Matsuno-Yagi, A. Parkinson’s disease and mitochondrial complex 1: A perspective on the Ndi1therapy. J. Bioenerg. Biomembr. 2009, 41, 493–497. [Google Scholar]
- Schapira, A.H.; Cooper, J.M.; Dexter, D.; Clark, J.B.; Jenner, P.; Marsden, C.D. Mitochondrial complex 1 deficiency in Parkinson’s disease. J. Neurochem. 1990, 54, 823–827. [Google Scholar] [CrossRef]
- Colla, E. Linking the endoplasmic reticulum to Parkinson’s disease and alpha-synucleinopathy. Front. Neurosci. 2019, 13, 560. [Google Scholar] [CrossRef]
- Thayanidhi, N.; Helm, J.R.; Nycz, D.C.; Bentley, M.; Liang, Y.; Hay, J.C. Alpha-synuclein delays endoplasmic reticulum (ER)-to-Golgi transport in mammalian cells by antagonizing ER/Golgi SNAREs. Mol. Biol. Cell 2010, 21, 1850–1863. [Google Scholar] [CrossRef]
- Irwin, D.J.; White, M.T.; Toledo, J.B.; Xie, S.X.; Robinson, J.L.; Van Deerlin, V.; Lee, V.M.; Leverenz, J.B.; Montine, T.J.; Duda, J.E.; et al. Neuropathologic substrates of Parkinson disease dementia. Ann. Neurol. 2012, 72, 587–598. [Google Scholar] [CrossRef]
- Geut, H.; Hepp, D.H.; Foncke, E.; Berendse, H.W.; Rozemuller, J.M.; Huitinga, I.; Van de Berg, W.D.J. Neuropathological correlates of parkinsonian disorders in large Dutch autopsy series. Acta Neuropath. Commun. 2020, 8, 39. [Google Scholar] [CrossRef]
- Williams-Gray, C.H.; Evans, J.R.; Goris, A.; Foltynie, T.; Ban, M.; Robbins, T.W.; Brayne, C.; Kolachana, B.S.; Weinberger, D.R.; Sawcer, S.J.; et al. The distinct cognitive syndromes of Parkinson’s disease: 5 year follow-up of the CamPaIGN cohort. Brain 2009, 132, 2958–2969. [Google Scholar] [CrossRef] [PubMed]
- Goris, A.; Williams-Gray, C.H.; Clark, G.R.; Foltynie, T.; Lewis, S.J.; Brown, J.; Ban, M.; Spillantini, M.G.; Compston, A.; Burn, D.J.; et al. Tau and alpha-synuclein in susceptibility to, and dementia in, Parkinson’s disease. Ann. Neurol. 2007, 62, 145–153. [Google Scholar] [CrossRef] [PubMed]
- Williams-Gray, C.H.; Mason, S.L.; Evans, J.R.; Foltynie, T.; Brayne, C.; Robbins, T.W.; Barker, R.A. 2013. The CamPaIGN study of Parkinson’s disease: 10-year outlook in an incident population-based cohort. J. Neurol. Neurosurg. Psychiatry 2013, 84, 1258–1264. [Google Scholar] [CrossRef] [PubMed]
- Betarbet, R.; Sherer, T.B.; MacKenzie, G.; Garcia-Osuna, M.; Panov, A.V.; Greenamyre, J.T. Chronic systemic pesticide exposure reproduces features of Parkinsons disease. Nat. Neurosci. 2000, 3, 1301–1306. [Google Scholar] [CrossRef]
- Johnson, M.E.; Bobrovskaya, L. An update on the rotenone models of Parkinson’s disease: Their ability to reproduce the features of clinical disease and model gene-environment interactions. Neurotoxicology 2015, 46, 10116. [Google Scholar] [CrossRef]
- Hoozemans, J.J.; Van Haastert, E.S.; Eikelenboom, P.; De Vos, R.A.; Rozemuller, J.M.; Scheper, W. Activation of the unfolded protein response in Parkinson’s disease. Biochem. Biophys. Res. Commun. 2007, 354, 707–711. [Google Scholar] [CrossRef] [PubMed]
- Ryu, E.J.; Harding, H.P.; Angelastro, J.M.; Vitolo, O.V.; Ron, D.; Greene, L.A. Endoplasmic reticulum stress and the unfolded protein response in cellular models of Parkinson’s disease. J. Neurosci. 2002, 22, 10690–10698. [Google Scholar] [CrossRef]
- Holtz, W.A.; O’Malley, K.L. Parkinsonian mimetics induce aspects of unfolded protein response in death of dopaminergic neurons. J. Biol. Chem. 2003, 278, 19367–19377. [Google Scholar] [CrossRef]
- Cooper, A.A.; Gitler, A.D.; Cashikar, A.; Haynes, C.M.; Hill, K.J.; Bhullar, B. Alpha-synuclein blocks ER-Golgi traffic and Rab1 rescues neuron loss in Parkinson’s models. Science 2006, 313, 324–328. [Google Scholar] [CrossRef] [PubMed]
- Colla, E.; Coune, P.; Liu, Y.; Pletnikova, O.; Troncoso, J.C.; Iwatsubo, T. Endoplasmic reticulum stress is important for the manifestations of α-synucleinopathy in vivo. J. Neurosci. 2012, 32, 3306–3320. [Google Scholar] [CrossRef] [PubMed]
- Siddiqi, F.H.; Menzies, F.M.; Lopez, A.; Stamatakou, E.; Karabiyik, C.; Ureshino, R.; Ricketts, T.; Jimenez-Sanchez, M.; Esteban, M.A.; Lai, L.; et al. Felodipine induces autophagy in mouse brains with pharmacokinetics amenable to repurposing. Nat. Commun. 2019, 10, 1817. [Google Scholar] [CrossRef] [PubMed]
- Kriks, S.; Shim, J.; Piao, J.; Ganat, Y.M.; Wakeman, D.R.; Xie, Z.; Carillo-Reid, L.; Auyeung, G.; Antonacci, C.; Buch, A.; et al. Dopamine Neurons Derived From Human ES Cells Efficiently Engraft in Animal Models of Parkinson’s Disease. Nature 2011, 480, 547–551. [Google Scholar] [CrossRef] [PubMed]
- Fernandes, H.J.R.; Patikas, N.; Foskolou, S.; Field, S.F.; Park, J.E.; Byrne, M.L.; Bassett, A.R.; Metzakopian, E. Single cell transcriptomics of Parkinson’s disease human in vitro models reveals Dopamine neuron-specific stress response. Cell Rep. 2020, 33, 108263. [Google Scholar] [CrossRef]
- Bruntraeger, M.; Byrne, M.; Long, K.; Bassett, A.R. Editing the genome of human induced pluripotent stem cells using CRISPR/Cas9 ribonucleoprotein complex. CRISPR Gene Editing. Methods Mol. Biol. 2019, 1961, 153–183. [Google Scholar]
- Ebshiana, A.A.; Snowden, S.G.; Thambisetty, M.; Parsons, R.; Hye, A.; Legido-Quigley, C. Metabolomic Method: UPLC-q-ToF Polar and NonPolar Metabolites in the Healthy Rat Cerebellum Using an In-Vial Dual Extraction. PLoS ONE 2015, 10, e0122883. [Google Scholar] [CrossRef]
- Chambers, M.C.; Maclean, B.; Burke, R.; Amodei, D.; Ruderman, D.L.; Neumann, S.; Gatto, L.; Fischer, B.; Pratt, B.; Egertson, J.; et al. A cross-platform toolkit for mass spectrometry and proteomics. Nat. Biotechnol. 2012, 30, 918–920. [Google Scholar] [CrossRef]
- Kuhl, C.; Tautenhahn, R.; Bottcher, C.; Larson, T.R.; Neumann, S. CAMERA: An integrated strategy for compound spectra extraction and annotation of liquid chromatography/mass spectrometry datasets. Anal. Chem. 2012, 84, 283–289. [Google Scholar] [CrossRef]
- Fuchs, C.D.; Claudel, T.; Kumari, P.; Haemmerle, G.; Pollheimer, M.J.; Stojakovic, T.; Scharnagl, H.; Halilbasic, E.; Gumhold, J.; Silbert, D.; et al. Absence of adipose triglyceride lipase protects from hepatic endoplasmic reticulum stress in mice. Hepatology 2012, 56, 270–280. [Google Scholar] [CrossRef]
- He, Q.; Wang, M.; Petucci, C.; Gardell, S.J.; Han, X. Rotenone induces reductive stress and triacylglycerol deposition in C2C12 cells. Int. J. Biochem. Cell Biol. 2013, 45, 2749–2755. [Google Scholar] [CrossRef] [PubMed]
- Bosma, M.; Dapito, D.H.; Drosatos-Tampakaki, Z.; Huiping-Son, N.; Huang, L.; Kersten, S.; Drosatos, K.; Goldberg, I.J. Sequestration of fatty acids in triglycerides prevents endoplasmic reticulum stress in an in vitro model of cardiomyocyte lipotoxicity. Biochim. Biophys. Acta 2014, 1841, 1648–1655. [Google Scholar] [CrossRef]
- Vankoningsloo, S.; De Pauw, A.; Houbion, A.; Tejerina, S.; Demazy, C.; De Longueville, F.; Bertholet, V.; Renard, P.; Remacle, J.; Holvoet, P.; et al. CREB activation induced by mitochondrial dysfunction triggers triglyceride accumulation in 3T3-L1 preadipocytes. J. Cell Sci. 2006, 119, 1266–1282. [Google Scholar] [CrossRef] [PubMed]
- Vankoningsloo, S.; Piens, M.; Lecocq, C.; Gilson, A.; De Pauw, A.; Renard, P.; Demazy, C.; Houbion, A.; Raes, M.; Arnould, T. Mitochondrial dysfunction induces triglyceride accumulation in 3T3-L1 cells: Role of fatty acid beta-oxidation and glucose. J. Lipid Res. 2005, 46, 1133–1149. [Google Scholar] [CrossRef]
- Luz, A.L.; Kassotis, C.D.; Stapleton, H.M.; Meyer, J.N. The high-production volume fungicide pyroclostrobin induces triglyceride accumulation associated with mitochondrial dysfunction, and promotes adipocyte differentiation independent of PPARγ activation, in 3T3-L1 cells. Toxicology 2018, 15, 150–159. [Google Scholar] [CrossRef]
- Dienel, G.A. Brain lactate metabolism: The discoveries and the controversies. J. Cereb. Blood Flow Metab. 2012, 32, 1107–1138. [Google Scholar] [CrossRef]
- Pellerin, L.; Magistretti, P.J. Sweet sixteen for ANLS. J. Cereb. Blood Flow Metab. 2012, 32, 1152–1166. [Google Scholar] [CrossRef]
- Schonfeld, P.; Reiser, G. Why does brain metabolism not favour burning of fatty acids to provide energy?—Reflections on disadvantages of the use of free fatty acids as fuel for brain. J. Cereb. Blood Flow Metab. 2013, 33, 1493–1499. [Google Scholar] [CrossRef]
- Coleman, R.A.; Lee, D.P. Enzymes of triacylglycerol synthesis and their regulation. Prog. Lipid Res. 2004, 43, 134–176. [Google Scholar] [CrossRef]
- Fu, S.; Yang, L.; Li, P.; Hofmann, O.; Dicker, L.; Hide, W.; Lin, X.; Watkins, S.M.; Ivanov, A.R.; Hotamisligil, G.S. Aberrant lipid metabolism disrupts calcium homeostasis causing liver endoplasmic reticulum stress in obesity. Nature 2011, 473, 528–531. [Google Scholar] [CrossRef]
- Gentile, C.L.; Frye, M.A.; Pagliassotti, M.J. Fatty acids and the endoplasmic reticulum in nonalcoholic fatty liver disease. BioFactors 2011, 37, 8–16. [Google Scholar] [CrossRef] [PubMed]
- Guo, W.; Wong, S.; Xie, W.; Lei, T.; Luo, Z. Palmitate modulates intracellular signaling, induces endoplasmic reticulum 12 Biochemistry Research International stress, and causes apoptosis in mouse 3T3-L1 and rat primary preadipocytes. Am. J. Physiol. 2007, 293, E576–E586. [Google Scholar]
- Wei, Y.; Wang, D.; Topczewski, F.; Pagliassotti, M.J. Saturated fatty acids induce endoplasmic reticulum stress and apoptosis independently of ceramide in liver cells. Am. J. Physiol. 2006, 291, E275–E281. [Google Scholar] [CrossRef]
- Snowden, S.G.; Fernandes, F.J.R.; Kent, J.; Foskolou, S.; Tate, P.; Field, S.F.; Metzakopian, E.; Koulman, A. Development and application of high-throughput single cell lipid profiling: A study of SNCA-A53T human dopamine neurons. iScience 2020, 23, 101703. [Google Scholar] [CrossRef] [PubMed]
- Liu, L.; Shi, X.; Bharadwaj, X.G.; Ikeda, S.; Yamashita, H.; Yagyu, H.; Schaffer, J.E.; Yu, Y.H.; Goldberg, I.J. DGAT1 expression increases heart triglyceride content but ameliorates lipotoxicity. J. Biol. Chem. 2009, 284, 36312–36323. [Google Scholar] [CrossRef] [PubMed]
- Aurich, A.C.; Niemann, B.; Pan, R.; Gruenler, S.; Issa, H.; Silber, R.E.; Rohrbach, S. Age-dependent effects of high fat-diet on murine left ventricles: Role of palmitate. Basic Res. Cardiol. 2013, 108, 369. [Google Scholar] [CrossRef]
- Chokshi, A.; Drosatos, K.; Cheema, F.H.; Ji, R.; Khawaja, S.; Yu, S.; Kato, T.; Khan, R.; Takayama, H.; Knoll, R.; et al. Ventricular assist device implantation corrects myocardial lipotoxicity, reverses insulin resistance, and normalizes cardiac metabolism in patients with advanced heart failure. Circulation 2012, 125, 2844–2853. [Google Scholar] [CrossRef]
- Deng, J.; Liu, S.; Zou, L.; Xu, C.; Geng, B.; Xu, G. Lipolysis response to endoplasmic reticulum stress in adipose cells. J. Biol. Chem. 2012, 287, 6240–6249. [Google Scholar] [CrossRef]
- Song, Y.; Hogstrand, C.; Wei, C.C.; Wu, K.; Pan, Y.X.; Luo, Z. Endoplasmic reticulum (ER) stress and cAMP/PKA pathway mediated Zn-induced hepatic lipolysis. Environ. Pollut. 2017, 228, 252–264. [Google Scholar] [CrossRef]
- Lam, M.; Marsters, S.A.; Ashkenazi, A.; Walter, P. Misfloded proteins bind and activate death receptor 5 to trigger apoptosis during unresolved endoplasmic reticulum stress. eLife 2020, 9, e52291. [Google Scholar] [CrossRef]
- Thies, E.; Mandelkow, E.M. Missorting of tau in neurons causes degeneration of synapses that can be rescued by the kinase MARK2/Par-1. J. Neurosci. 2007, 27, 2896–2907. [Google Scholar] [CrossRef] [PubMed]
- Zempel, H.; Mandelkow, E.M. Tau missorting and spastin-induced microtubule disruption in neurodegeneration: Alzheimer disease and hereditary spastic paraplegia. Mol. Neurodegener. 2015, 10, 68. [Google Scholar] [CrossRef] [PubMed]
- Hu, Y.; Li, X.C.; Wang, Z.H.; Luo, Y.; Zhang, X.; Liu, X.P. Tau accumulation impairs mitophagy via increasing mitochondrial membrane potential and reducing mitochondrial Parkin. Oncotarget 2016, 7, 17356–17368. [Google Scholar] [CrossRef] [PubMed]
- Fang, E.F.; Hou, Y.; Palikaras, K.; Adriaanse, B.A.; Kerr, J.S.; Yang, B. Mitophagy inhibits amyloid-beta and tau pathology and reverses cognitive deficits in models of Alzheimer’s disease. Nat. Neurosci. 2019, 22, 401–412. [Google Scholar] [CrossRef]
- Cummins, N.; Tweedie, A.; Zuryn, S.; Bertran-Gonzalez, J.; Gotz, J. Disease-associated tau impairs mitophagy by inhibiting Parkin translocation to mitochondria. EMBO J. 2019, 38, e99360. [Google Scholar] [CrossRef] [PubMed]


| Wild Type | MAPT | |||||
|---|---|---|---|---|---|---|
| p-Value | q-Value | FC+ | p-Value | q-Value | FC+ | |
| Hydroxybutyrylcarnitine | 5.84 × 10⁻⁹ | 1.86 × 10⁻⁵ | 10.37 | 6.59 × 10⁻⁵ | 0.0029 | 7.00 |
| TG(54:7) | 5.86 × 10⁻⁷ | 0.0009 | 2.45 | 2.57 × 10⁻⁸ | 8.6 × 10⁻⁶ | 2.36 |
| TG(56:6) | 3.42 × 10⁻⁶ | 0.0025 | 6.04 | 4.36 × 10⁻⁵ | 0.0021 | 7.53 |
| TG(58:7) | 3.48 × 10⁻⁶ | 0.0025 | 2.17 | 0.0004 | 0.012 | 1.99 |
| TG(54:2) | 4.37 × 10⁻⁶ | 0.0027 | 1.97 | 6.84 × 10⁻⁵ | 0.0029 | 2.65 |
| PE(36:0) | 6.60 × 10⁻⁶ | 0.0034 | 1.07 | 0.381 | 0.799 | 1.23 |
| PC(34:6) | 6.86 × 10⁻⁶ | 0.0034 | 0.91 | 0.689 | 0.845 | 1.52 |
| PE(38:2) | 8.36 × 10⁻⁶ | 0.0035 | 2.35 | 7.12 × 10⁻¹³ | 1.94 × 10⁻⁹ | 2.48 |
| TG(61:7) | 9.61 × 10⁻⁶ | 0.0036 | 3.82 | 1.21 × 10⁻⁷ | 2.41 × 10⁻⁵ | 5.44 |
| TG(52:2) | 9.62 × 10⁻⁶ | 0.0036 | 3.05 | 0.0002 | 0.0078 | 4.20 |
| LysoPC(18:2) | 1.85 × 10⁻⁵ | 0.0049 | 1.28 | 4.40 × 10⁻⁵ | 0.0021 | 1.44 |
| TG(58:5) | 1.85 × 10⁻⁵ | 0.0049 | 1.82 | 7.32 × 10⁻⁶ | 0.0005 | 2.11 |
| SM(38:6) | 1.92 × 10⁻⁵ | 0.0049 | 2.12 | 0.011 | 0.151 | 2.70 |
| DG(38:5) | 2.26 × 10⁻⁵ | 0.0053 | 3.34 | 6.56 × 10⁻⁷ | 9.07 × 10⁻⁵ | 3.28 |
| TG(60:9) | 3.05 × 10⁻⁵ | 0.0065 | 3.01 | 5.59 × 10⁻⁷ | 8.01 × 10⁻⁵ | 3.97 |
| TG(61:6) | 3.77 × 10⁻⁵ | 0.0074 | 4.40 | 1.48 × 10⁻⁹ | 1.08 × 10⁻⁶ | 4.04 |
| TG(59:5) | 4.93 × 10⁻⁵ | 0.0085 | 4.09 | 9.53 × 10⁻⁷ | 0.0001 | 3.36 |
| TG(58:3) | 5.08 × 10⁻⁵ | 0.0085 | 1.57 | 0.164 | 0.605 | 3.99 |
| Pantothenamide | 6.21 × 10⁻⁵ | 0.0096 | 0.02 | 4.82 × 10⁻⁷ | 7.3 × 10⁻⁵ | 0.02 |
| TG(57:4) | 6.45 × 10⁻⁵ | 0.0098 | 2.63 | 9.68 × 10⁻⁷ | 0.000118 | 3.14 |
| TG(51:2) | 6.81 × 10⁻⁵ | 0.0099 | 2.14 | 0.0035 | 0.064 | 3.78 |
| PC(40:8) | 8.5 × 10⁻⁵ | 0.011 | 2.02 | 3.73 × 10⁻⁵ | 0.0018 | 2.19 |
| TG(62:10) | 8.63 × 10⁻⁵ | 0.011 | 3.19 | 0.0002 | 0.0073 | 3.32 |
| Tocotrienol | 0.0002 | 0.019 | 1.13 | 0.464 | 0.564 | 2.18 |
| TG(61:5) | 0.0002 | 0.020 | 2.86 | 2.85 × 10⁻⁸ | 9.05 × 10⁻⁶ | 2.88 |
| TG(52:7) | 0.0003 | 0.022 | 2.16 | 0.0015 | 0.033 | 2.30 |
| Triglylcarnitine | 0.0003 | 0.023 | 0.00 | 2.21 × 10⁻⁵ | 0.0012 | 0.01 |
| LysoPC(18:3) | 0.0003 | 0.024 | 1.23 | 0.0012 | 0.028 | 1.35 |
| Hexadecenoylcarnitine | 0.0004 | 0.024 | 0.90 | 0.410 | 0.812 | 1.57 |
| Cer(40:2) | 0.0004 | 0.025 | 1.26 | 0.148 | 0.579 | 1.82 |
| Acetylputrescine | 0.0006 | 0.035 | 0.42 | 2.25 × 10⁻⁵ | 0.0012 | 0.42 |
| TG(54:3) | 0.0007 | 0.037 | 4.10 | 2.10 × 10⁻⁸ | 7.41 × 10⁻⁶ | 3.93 |
| Propionylcarnitine | 0.0008 | 0.039 | 0.05 | 3.94 × 10⁻⁶ | 0.0003 | 0.04 |
| Tetrahydropterin | 0.0008 | 0.039 | 0.67 | 0.034 | 0.297 | 1.85 |
| Leucine/Isoleucine | 0.0010 | 0.047 | 0.20 | 0.0024 | 0.049 | 0.02 |
| DG(38:4) | 0.0011 | 0.049 | 0.78 | 0.910 | 0.954 | 1.52 |
| Wild Type | MAPT | |||||
|---|---|---|---|---|---|---|
| p-Value | q-Value | FC+ | p-Value | q-Value | FC+ | |
| PC-O(38:3) | 1.42 × 10⁻⁷ | 0.0003 | 1.41 | 0.016 | 0.306 | 1.32 |
| TG(58:3) | 1.21 × 10⁻⁶ | 0.0019 | 2.07 | 0.0030 | 0.117 | 4.11 |
| TG(54:2) | 2.91 × 10⁻⁵ | 0.0021 | 2.24 | 0.0001 | 0.018 | 2.46 |
| CE(20:4) | 4.50 × 10⁻⁵ | 0.0030 | 3.02 | 0.0010 | 0.056 | 3.45 |
| PIP(34:1) | 6.86 × 10⁻⁵ | 0.0050 | 1.12 | 0.207 | 0.748 | 1.45 |
| PI(40:6) | 0.0001 | 0.0050 | 1.08 | 0.125 | 0.666 | 1.25 |
| PE(36:0) | 0.0002 | 0.0074 | 1.04 | 0.660 | 0.726 | 1.13 |
| PI(34:2) | 0.0002 | 0.0082 | 0.45 | 0.0006 | 0.039 | 0.58 |
| DG(46:7) | 0.0002 | 0.0097 | 1.17 | 0.044 | 0.619 | 1.22 |
| TG(52:2) | 0.0003 | 0.013 | 2.15 | 0.033 | 0.438 | 2.84 |
| PE(40:4) | 0.0003 | 0.013 | 1.04 | 0.109 | 0.646 | 1.10 |
| PS(42:6) | 0.0004 | 0.013 | 1.09 | 0.085 | 0.605 | 1.23 |
| TG(54:3) | 0.0006 | 0.019 | 2.74 | 0.0056 | 0.164 | 2.99 |
| IMP | 0.0010 | 0.019 | 0.84 | 0.818 | 0.916 | 0.09 |
| TG(58:5) | 0.0010 | 0.019 | 1.69 | 0.0001 | 0.020 | 1.68 |
| TG(58:8) | 0.0011 | 0.021 | 1.39 | 0.303 | 0.819 | 2.49 |
| TG(56:6) | 0.0022 | 0.022 | 2.82 | 0.0015 | 0.076 | 2.55 |
| TG(58:7) | 0.0042 | 0.022 | 1.59 | 0.021 | 0.351 | 1.51 |
| DMSO vs. Rotenone | DMSO vs. Tunicamycin | |||||||
|---|---|---|---|---|---|---|---|---|
| Wild Type | MAPT | Wild Type | MAPT | |||||
| p-Value | FC+ | p-Value | FC+ | p-Value | FC+ | p-Value | FC+ | |
| TG(61:6) | 1.48 × 10⁻⁹ | 4.44 | 3.77 × 10⁻⁵ | 4.04 | 0.0085 | 1.87 | 0.035 | 4.04 |
| TG(54:3) | 2.10 × 10⁻⁸ | 4.09 | 0.0007 | 3.93 | 0.0056 | 2.74 | 0.0006 | 3.93 |
| TG(54:7) | 2.57 × 10⁻⁸ | 2.45 | 5.86 × 10⁻⁷ | 2.36 | 0.497 | 1.14 | 0.012 | 2.36 |
| TG(61:5) | 2.85 × 10⁻⁸ | 2.86 | 0.0002 | 2.88 | 0.0009 | 1.88 | 0.0095 | 2.88 |
| TG(61:7) | 1.21 × 10⁻⁷ | 3.82 | 9.61 × 10⁻⁶ | 5.44 | 0.207 | 1.33 | 0.032 | 5.44 |
| TG(59:3) | 3.74 × 10⁻⁷ | 1.96 | 0.0008 | 2.74 | 0.0022 | 1.55 | 0.0067 | 2.74 |
| TG(59:4) | 5.56 × 10⁻⁷ | 2.68 | 0.0003 | 3.09 | 0.0002 | 1.49 | 0.019 | 3.09 |
| TG(60:9) | 5.59 × 10⁻⁷ | 3.01 | 3.05 × 10⁻⁵ | 3.97 | 0.159 | 1.20 | 0.018 | 3.97 |
| TG(59:5) | 9.53 × 10⁻⁷ | 4.09 | 4.93 × 10⁻⁵ | 3.36 | 0.014 | 1.63 | 0.866 | 3.36 |
| TG(57:4) | 9.68 × 10⁻⁷ | 2.63 | 6.45 × 10⁻⁵ | 3.14 | 0.029 | 1.34 | 0.922 | 3.14 |
| TG(57:3) | 1.56 × 10⁻⁶ | 2.17 | 0.0004 | 2.40 | 0.0059 | 1.41 | 0.294 | 2.4 |
| TG(58:5) | 7.32 × 10⁻⁶ | 1.82 | 1.85 × 10⁻⁵ | 2.11 | 0.0001 | 1.69 | 0.001 | 2.11 |
| TG(60:6) | 7.40 × 10⁻⁶ | 2.49 | 0.0006 | 2.69 | 0.094 | 1.44 | 0.038 | 2.69 |
| TG(56:6) | 4.36 × 10⁻⁵ | 6.04 | 3.42 × 10⁻⁶ | 7.53 | 0.0015 | 2.82 | 0.0023 | 7.53 |
| TG(54:2) | 6.84 × 10⁻⁵ | 1.97 | 4.37 × 10⁻⁶ | 2.65 | 0.0001 | 2.24 | 2.91 × 10⁻⁵ | 2.65 |
| TG(62:10) | 0.0002 | 3.19 | 8.63 × 10⁻⁵ | 3.32 | 0.519 | 1.35 | 0.339 | 3.32 |
| TG(52:2) | 0.0002 | 3.05 | 9.62 × 10⁻⁶ | 4.20 | 0.033 | 2.15 | 0.0003 | 4.2 |
| TG(58:7) | 0.0004 | 2.17 | 3.48 × 10⁻⁶ | 1.99 | 0.021 | 1.59 | 0.0042 | 1.99 |
| TG(52:7) | 0.0015 | 2.16 | 0.0003 | 2.30 | 0.105 | 0.80 | 0.196 | 2.3 |
| TG(51:2) | 0.0035 | 2.14 | 6.81 × 10⁻⁵ | 3.78 | 0.485 | 1.15 | 0.089 | 3.78 |
| TG(58:3) | 0.164 | 1.57 | 5.08 × 10⁻⁵ | 3.99 | 0.0030 | 2.07 | 1.21 × 10⁻⁶ | 3.99 |
Disclaimer/Publisher’s Note: The statements, opinions and data contained in all publications are solely those of the individual author(s) and contributor(s) and not of MDPI and/or the editor(s). MDPI and/or the editor(s) disclaim responsibility for any injury to people or property resulting from any ideas, methods, instructions or products referred to in the content. |
© 2023 by the authors. Licensee MDPI, Basel, Switzerland. This article is an open access article distributed under the terms and conditions of the Creative Commons Attribution (CC BY) license (https://creativecommons.org/licenses/by/4.0/).
Share and Cite
Fernandes, H.J.R.; Kent, J.P.; Bruntraeger, M.; Bassett, A.R.; Koulman, A.; Metzakopian, E.; Snowden, S.G. Mitochondrial and Endoplasmic Reticulum Stress Trigger Triglyceride Accumulation in Models of Parkinson’s Disease Independent of Mutations in MAPT. Metabolites 2023, 13, 112. https://doi.org/10.3390/metabo13010112
Fernandes HJR, Kent JP, Bruntraeger M, Bassett AR, Koulman A, Metzakopian E, Snowden SG. Mitochondrial and Endoplasmic Reticulum Stress Trigger Triglyceride Accumulation in Models of Parkinson’s Disease Independent of Mutations in MAPT. Metabolites. 2023; 13(1):112. https://doi.org/10.3390/metabo13010112
Chicago/Turabian StyleFernandes, Hugo J. R., Josh P. Kent, Michaela Bruntraeger, Andrew R. Bassett, Albert Koulman, Emmanouil Metzakopian, and Stuart G. Snowden. 2023. "Mitochondrial and Endoplasmic Reticulum Stress Trigger Triglyceride Accumulation in Models of Parkinson’s Disease Independent of Mutations in MAPT" Metabolites 13, no. 1: 112. https://doi.org/10.3390/metabo13010112
APA StyleFernandes, H. J. R., Kent, J. P., Bruntraeger, M., Bassett, A. R., Koulman, A., Metzakopian, E., & Snowden, S. G. (2023). Mitochondrial and Endoplasmic Reticulum Stress Trigger Triglyceride Accumulation in Models of Parkinson’s Disease Independent of Mutations in MAPT. Metabolites, 13(1), 112. https://doi.org/10.3390/metabo13010112