
Lipidomic Profiling Identifies a Novel Lipid Signature Associated with Ethnicity-Specific Disparity of Bladder Cancer

 , , and
Abstract
:
1. Introduction
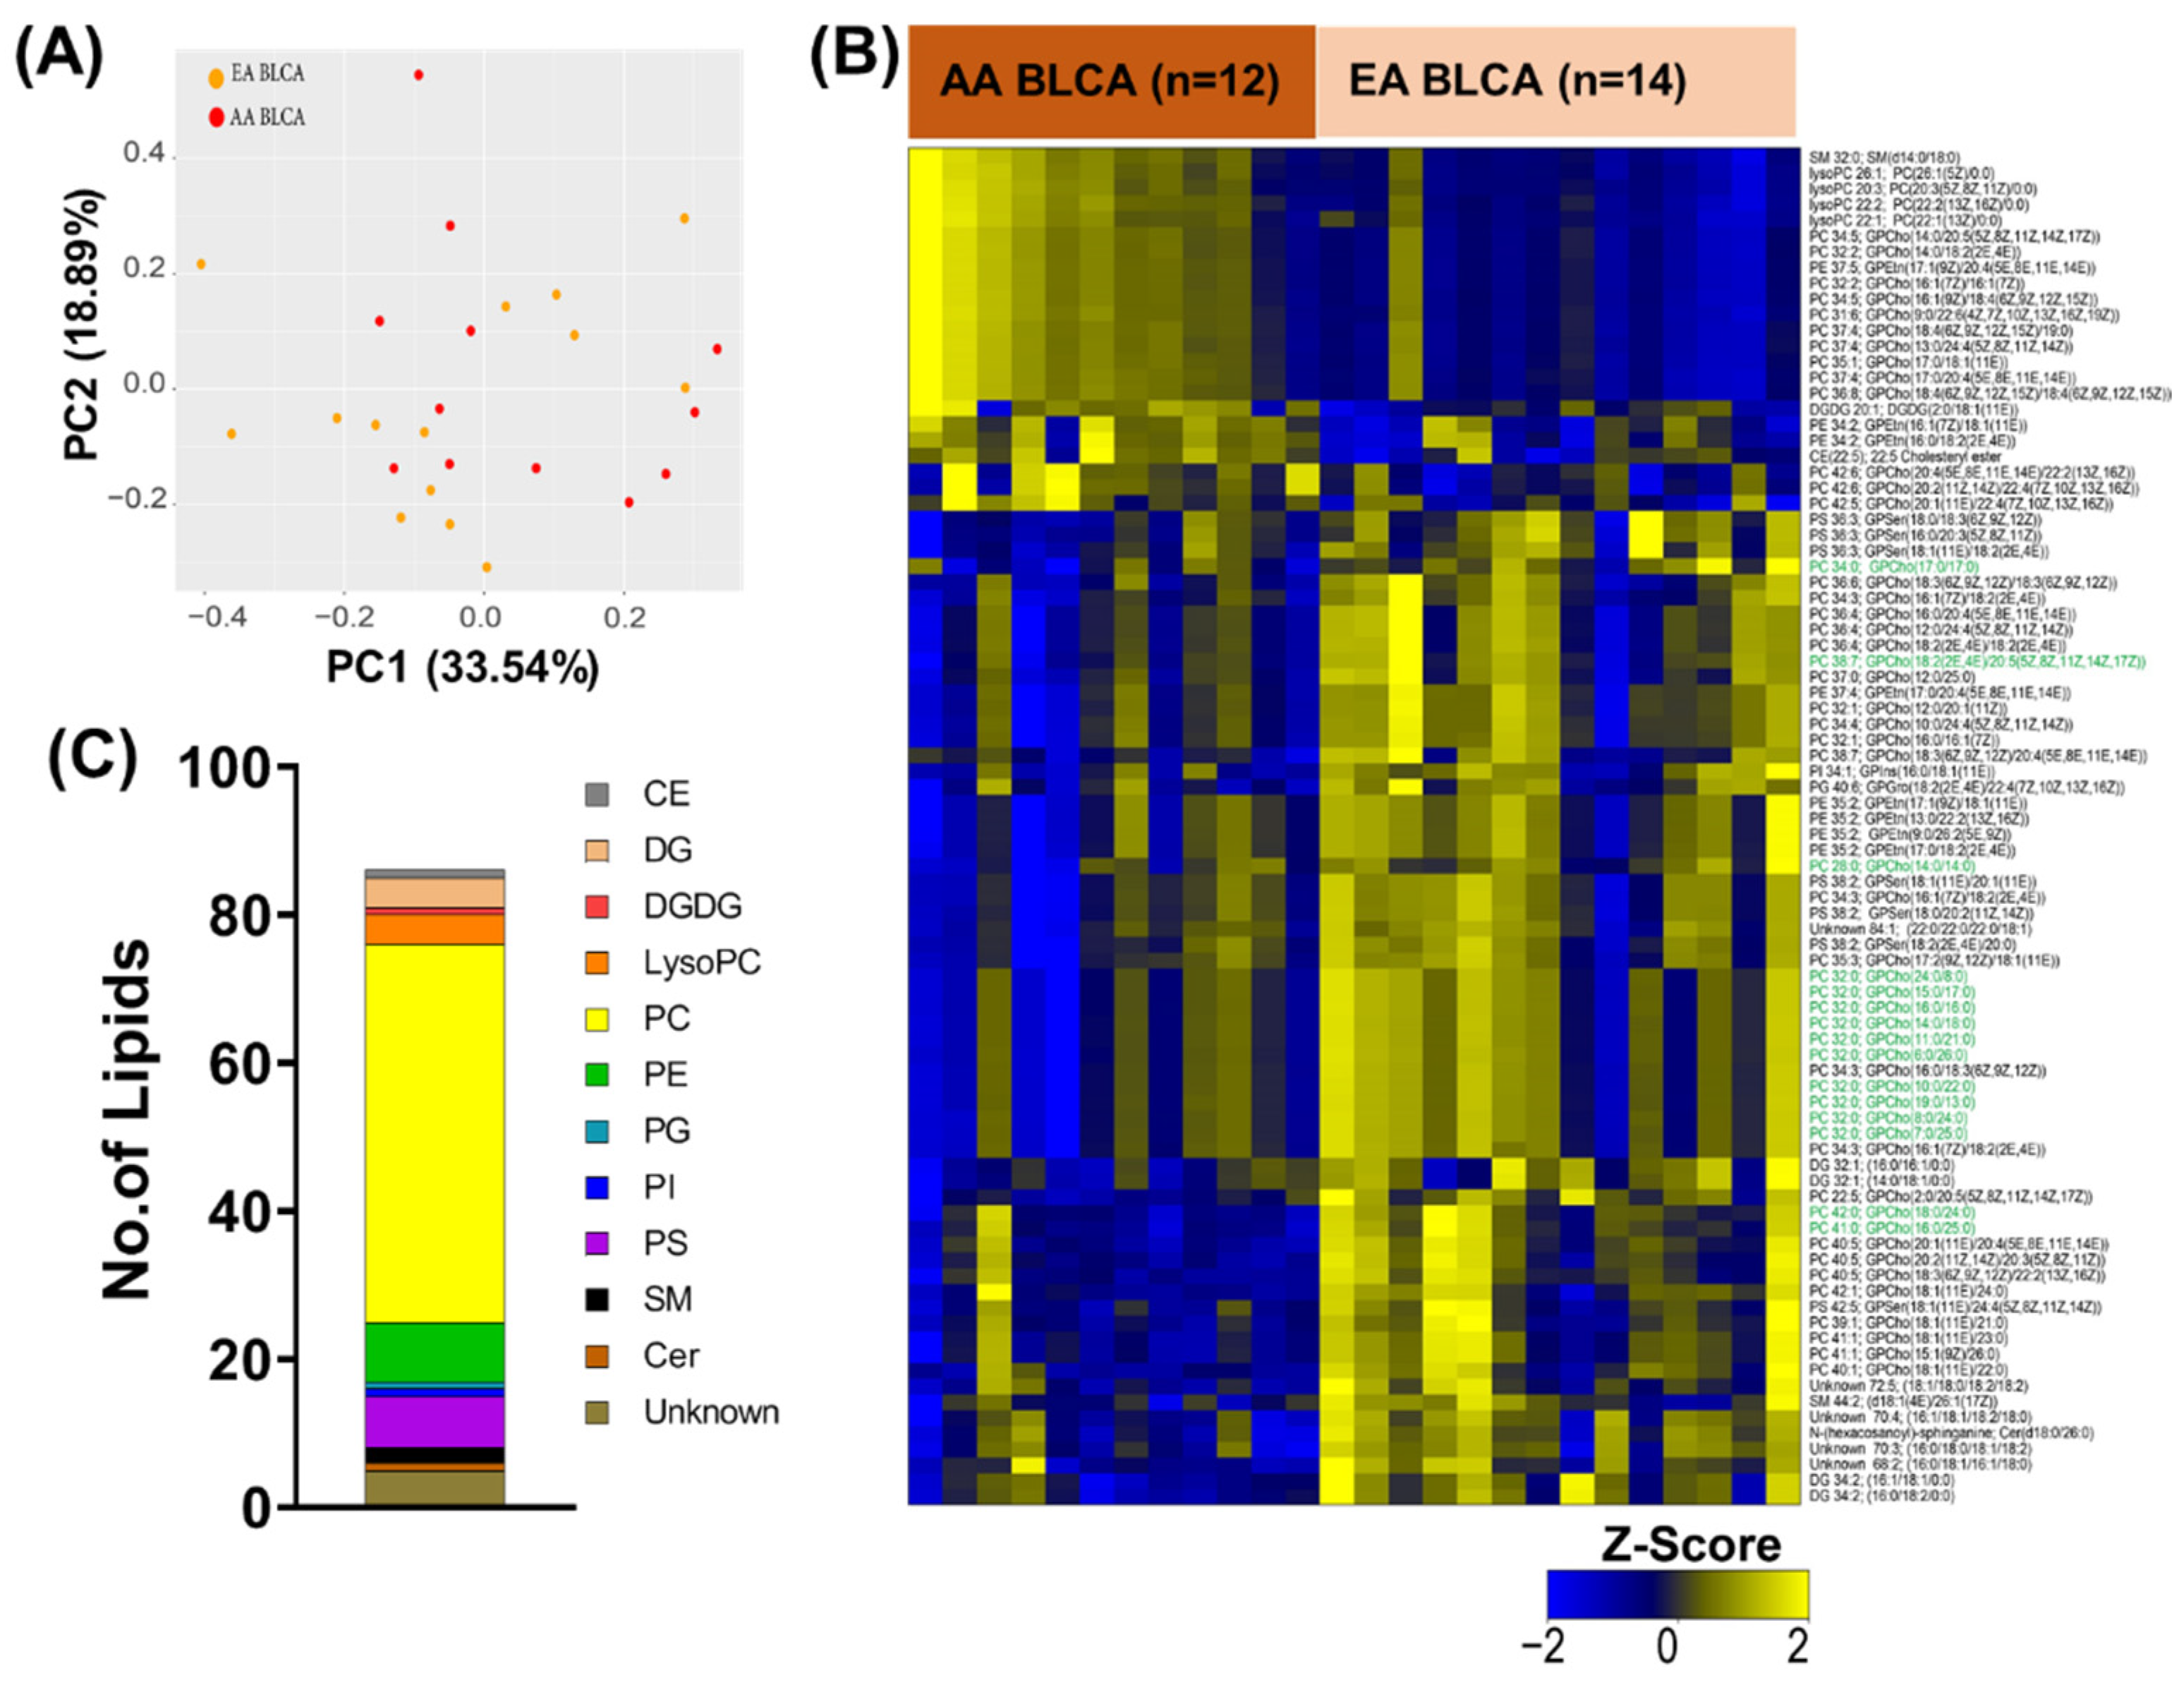
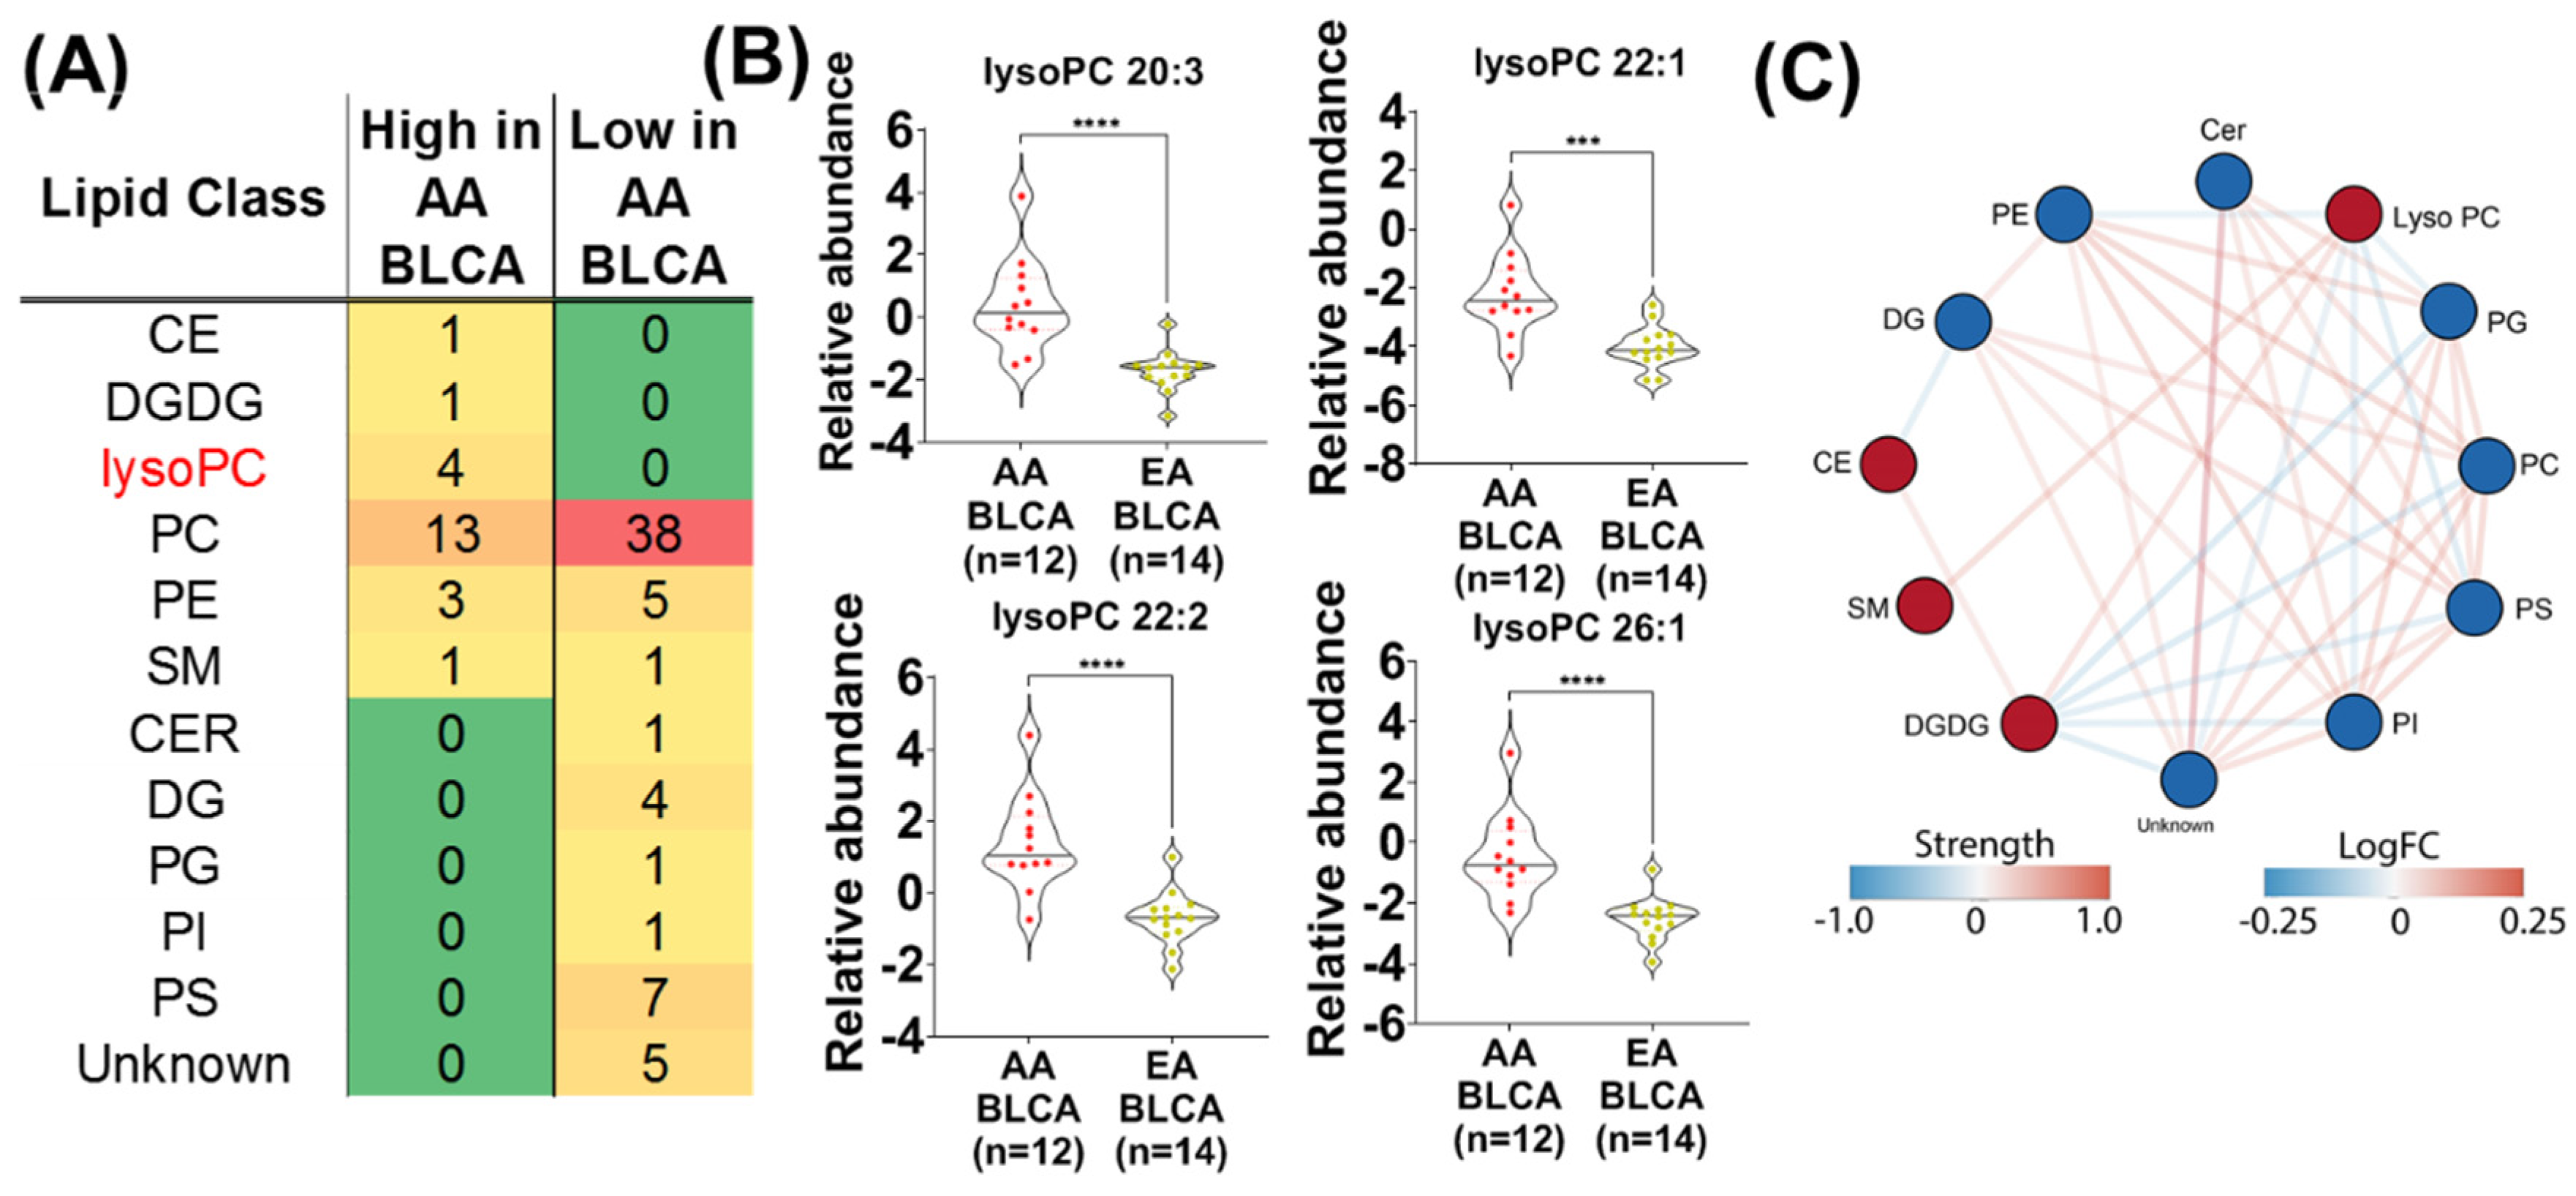
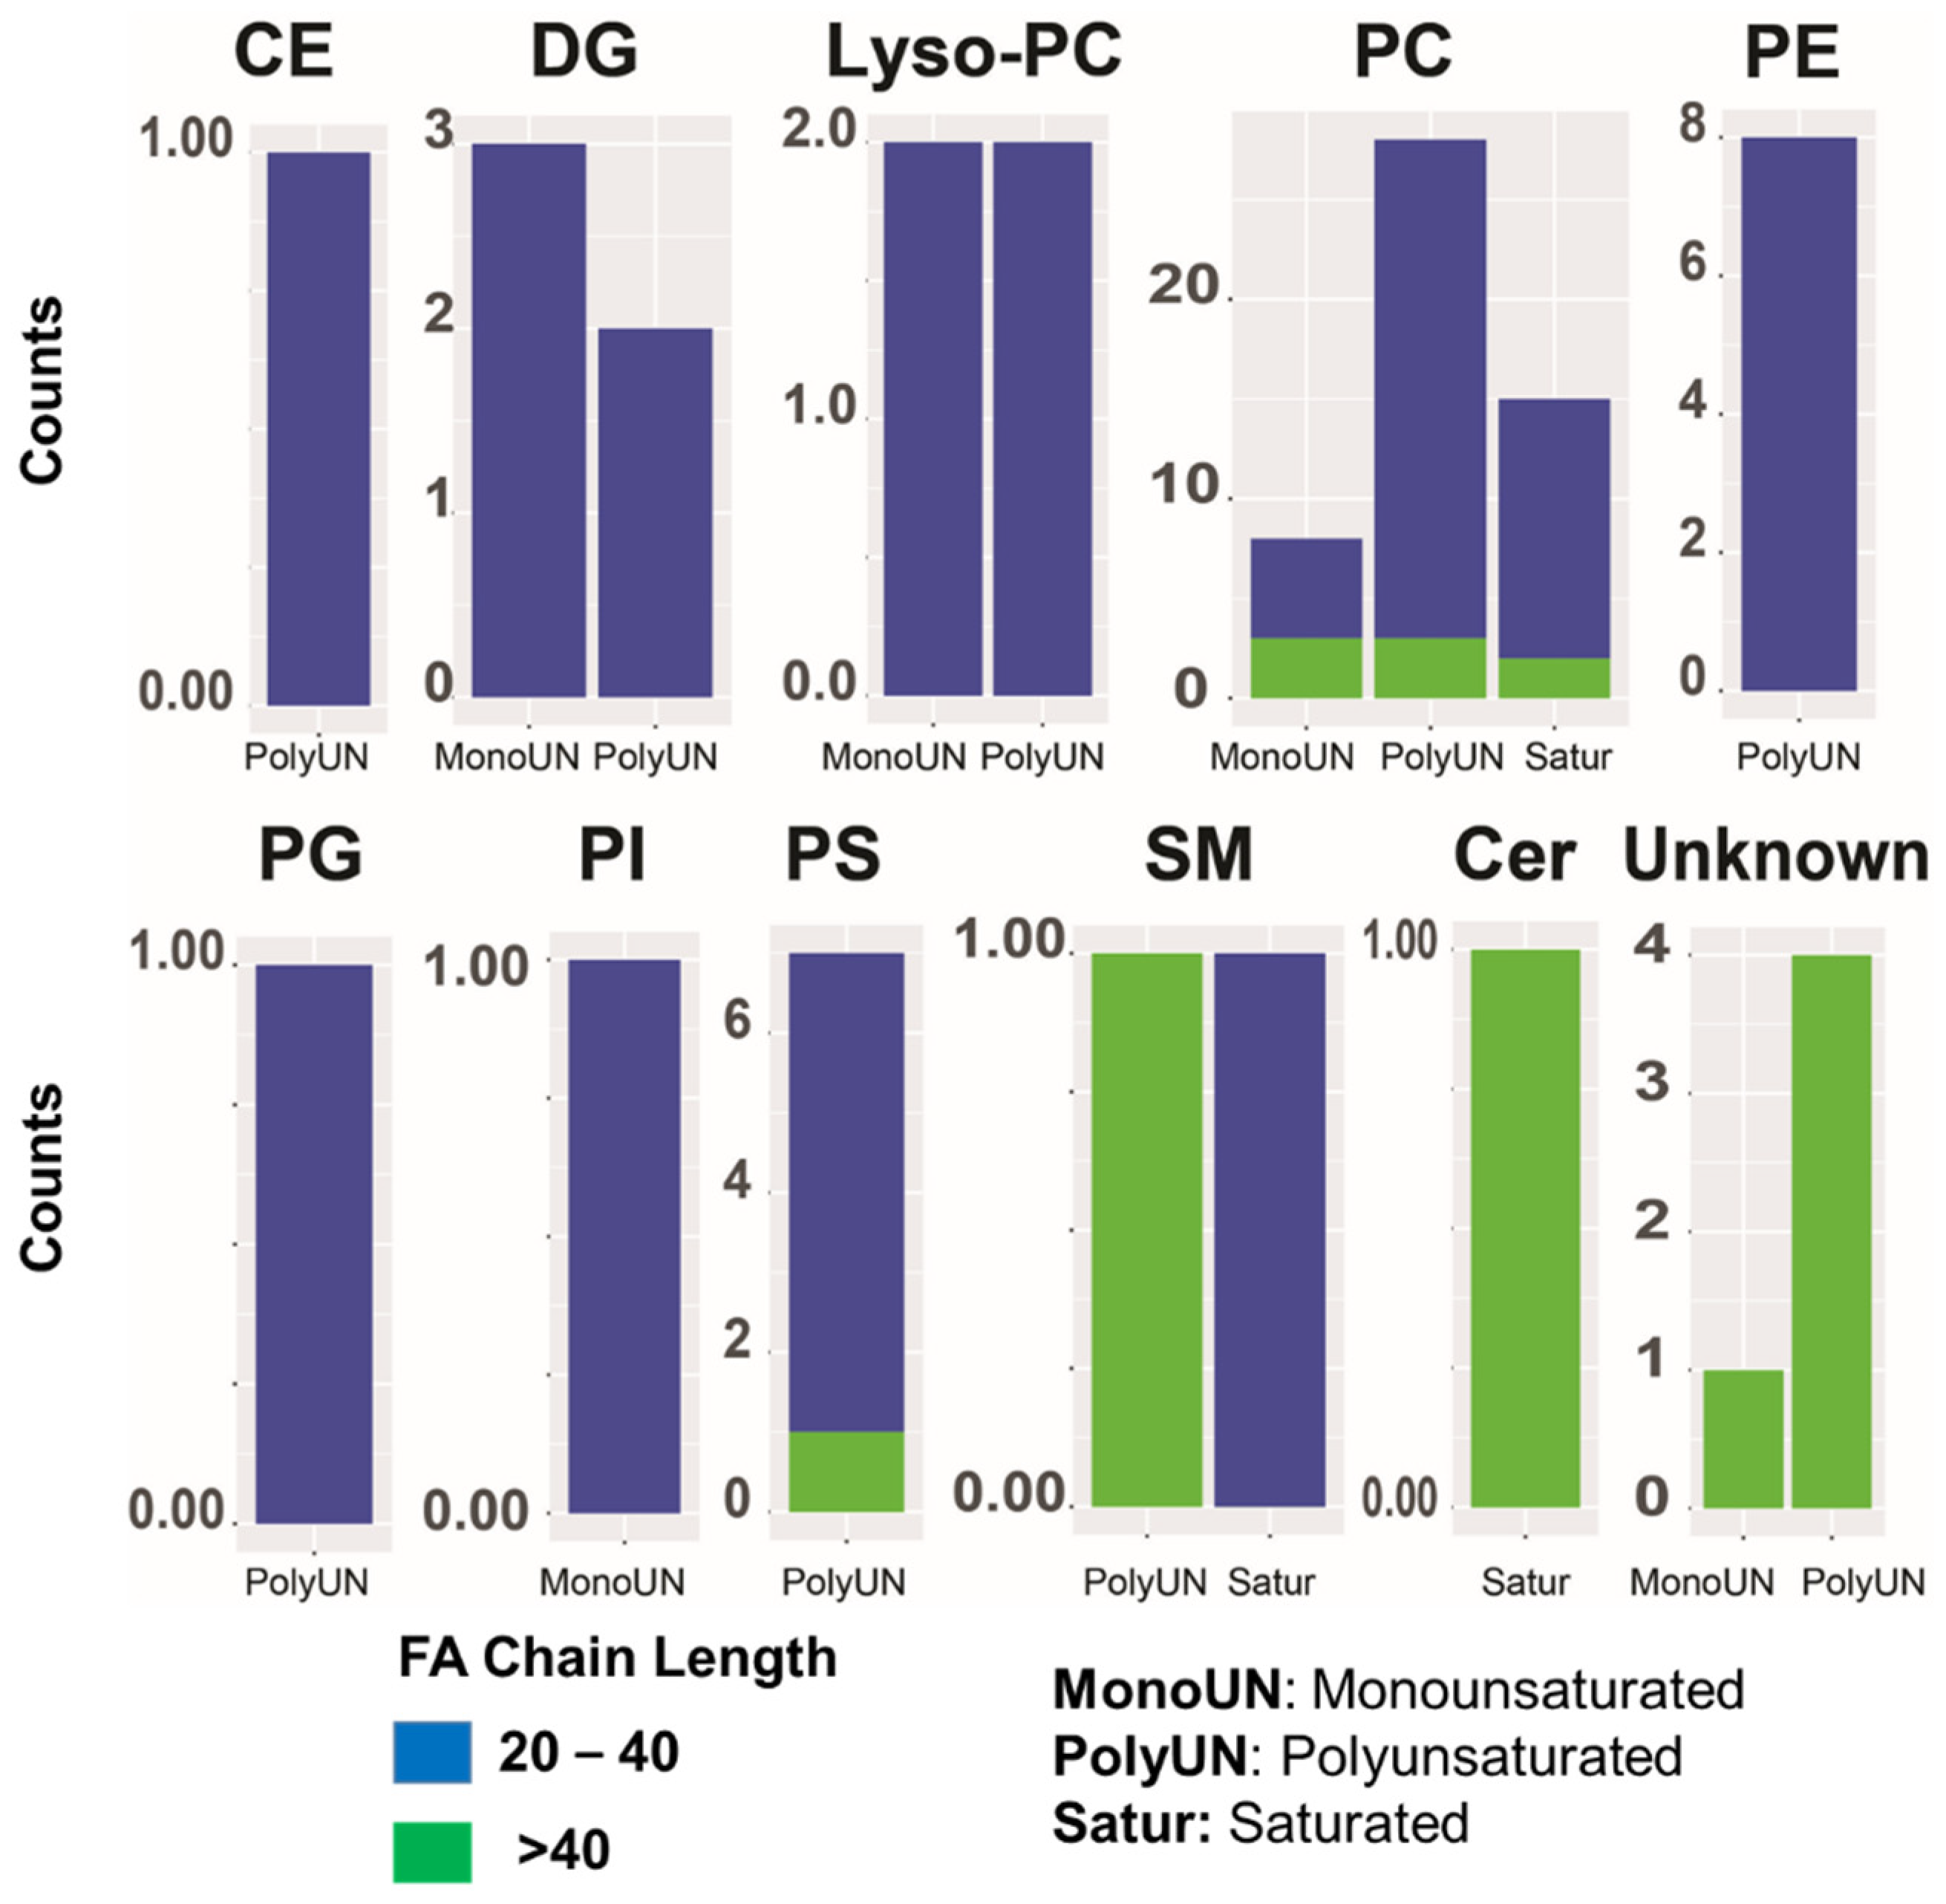
2. Results
3. Discussion
4. Materials and Methods
4.1. Patient Sample Information
4.2. Extraction of Lipids
4.3. Statistical Analysis for Unbiased Lipidomics
5. Conclusions
6. Limitation of Study
Supplementary Materials
Author Contributions
Funding
Institutional Review Board Statement
Informed Consent Statement
Data Availability Statement
Acknowledgments
Conflicts of Interest
References
- Australian Institute of Health and Welfare. Cancer survival and prevalence in Australia: Period estimates from 1982 to 2010. Asia-Pac. J. Clin. Oncol. 2013, 9, 29–39. [Google Scholar] [CrossRef] [PubMed]
- Morita, I.; Murota, S. Role of 12-lipoxygenase products of arachidonic acid on platelet aggregation. Adv. Prostaglandin Thromboxane Leukot. Res. 1987, 17A, 219–223. [Google Scholar] [PubMed]
- Lenis, A.T.; Lec, P.M.; Chamie, K.; Mshs, M.D. Bladder Cancer: A Review. Jama 2020, 324, 1980–1991. [Google Scholar] [CrossRef] [PubMed]
- Rushton, L.; Bagga, S.; Bevan, R.; Brown, T.P.; Cherrie, J.W.; Holmes, P.; Fortunato, L.; Slack, R.; Van Tongeren, M.; Young, C.; et al. Occupation and cancer in Britain. Br. J. Cancer 2010, 102, 1428–1437. [Google Scholar] [CrossRef] [PubMed]
- Underwood, W., 3rd; Dunn, R.L.; Williams, C.; Lee, C.T. Gender and geographic influence on the racial disparity in bladder cancer mortality in the US. J. Am. Coll. Surg. 2006, 202, 284–290. [Google Scholar] [CrossRef]
- Prout, G.R., Jr.; Wesley, M.N.; McCarron, P.G.; Chen, V.W.; Greenberg, R.S.; Mayberry, R.M.; Edwards, B.K. Survival experience of black patients and white patients with bladder carcinoma. Cancer 2004, 100, 621–630. [Google Scholar] [CrossRef]
- Yee, D.S.; Ishill, N.M.; Lowrance, W.T.; Herr, H.W.; Elkin, E.B. Ethnic differences in bladder cancer survival. Urology 2011, 78, 544–549. [Google Scholar] [CrossRef]
- Mallin, K.; David, K.A.; Carroll, P.R.; Milowsky, M.I.; Nanus, D.M. Transitional cell carcinoma of the bladder: Racial and gender disparities in survival (1993 to 2002), stage and grade (1993 to 2007). J. Urol. 2011, 185, 1631–1636. [Google Scholar] [CrossRef]
- Gild, P.; Wankowicz, S.A.; Sood, A.; von Landenberg, N.; Friedlander, D.F.; Alanee, S.; Chun, F.K.H.; Fisch, M.; Menon, M.; Trinh, Q.D.; et al. Racial disparity in quality of care and overall survival among black vs. white patients with muscle-invasive bladder cancer treated with radical cystectomy: A national cancer database analysis. Urol. Oncol. 2018, 36, 469.e1–469.e11. [Google Scholar] [CrossRef]
- Sung, J.M.; Martin, J.W.; Jefferson, F.A.; Sidhom, D.A.; Piranviseh, K.; Huang, M.; Nguyen, N.; Chang, J.; Ziogas, A.; Anton-Culver, H.; et al. Racial and Socioeconomic Disparities in Bladder Cancer Survival: Analysis of the California Cancer Registry. Clin. Genitourin. Cancer 2019, 17, e995–e1002. [Google Scholar] [CrossRef]
- Vantaku, V.; Donepudi, S.R.; Piyarathna, D.W.B.; Amara, C.S.; Ambati, C.R.; Tang, W.; Putluri, V.; Chandrashekar, D.S.; Varambally, S.; Terris, M.K.; et al. Large-scale profiling of serum metabolites in African American and European American patients with bladder cancer reveals metabolic pathways associated with patient survival. Cancer 2019, 125, 921–932. [Google Scholar] [CrossRef] [PubMed]
- Howlader, N.; Noone, A.; Krapcho, M.; Miller, D.; Brest, A.; Yu, M.; Ruhl, J.; Tatalovich, Z.; Mariotto, A.; Lewis, D.; et al. SEER Cancer Statistics Review, 1975–2018. Available online: https://seer.cancer.gov/csr/1975_2018/ (accessed on 15 April 2021).
- Bach, P.B.; Schrag, D.; Brawley, O.W.; Galaznik, A.; Yakren, S.; Begg, C.B. Survival of blacks and whites after a cancer diagnosis. JAMA 2002, 287, 2106–2113. [Google Scholar] [CrossRef]
- Taub, D.A.; Hollenbeck, B.K.; Cooper, K.L.; Dunn, R.L.; Miller, D.C.; Taylor, J.M.; Wei, J.T. Racial disparities in resource utilization for cystectomy. Urology 2006, 67, 288–293. [Google Scholar] [CrossRef] [PubMed]
- Lee, C.T.; Dunn, R.L.; Williams, C.; Underwood, W. Racial disparity in bladder cancer: Trends in tumor presentation at diagnosis. J. Urol. 2006, 176, 927–934. [Google Scholar] [CrossRef] [PubMed]
- Ravindran, A.; Piyarathna, D.W.B.; Gohlke, J.; Putluri, V.; Soni, T.; Lloyd, S.; Castro, P.; Pennathur, S.; Jones, J.A.; Ittmann, M.; et al. Lipid Alterations in African American Men with Prostate Cancer. Metabolites 2021, 12, 8. [Google Scholar] [CrossRef]
- Hanahan, D.; Weinberg, R.A. Hallmarks of cancer: The next generation. Cell 2011, 144, 646–674. [Google Scholar] [CrossRef]
- Piyarathna, D.W.B.; Rajendiran, T.M.; Putluri, V.; Vantaku, V.; Soni, T.; von Rundstedt, F.C.; Donepudi, S.R.; Jin, F.; Maity, S.; Ambati, C.R.; et al. Distinct Lipidomic Landscapes Associated with Clinical Stages of Urothelial Cancer of the Bladder. Eur. Urol. Focus 2018, 4, 907–915. [Google Scholar] [CrossRef]
- Koundouros, N.; Poulogiannis, G. Reprogramming of fatty acid metabolism in cancer. Br. J. Cancer 2020, 122, 4–22. [Google Scholar] [CrossRef]
- Vantaku, V.; Dong, J.; Ambati, C.R.; Perera, D.; Donepudi, S.R.; Amara, C.S.; Putluri, V.; Ravi, S.S.; Robertson, M.J.; Piyarathna, D.W.B.; et al. Multi-omics Integration Analysis Robustly Predicts High-Grade Patient Survival and Identifies CPT1B Effect on Fatty Acid Metabolism in Bladder Cancer. Clin. Cancer Res. 2019, 25, 3689–3701. [Google Scholar] [CrossRef]
- Park, J.H.; Vithayathil, S.; Kumar, S.; Sung, P.L.; Dobrolecki, L.E.; Putluri, V.; Bhat, V.B.; Bhowmik, S.K.; Gupta, V.; Arora, K.; et al. Fatty Acid Oxidation-Driven Src Links Mitochondrial Energy Reprogramming and Oncogenic Properties in Triple-Negative Breast Cancer. Cell Rep. 2016, 14, 2154–2165. [Google Scholar] [CrossRef]
- Zhang, L.; Wang, J.; Wang, Y.; Zhang, Y.; Castro, P.; Shao, L.; Sreekumar, A.; Putluri, N.; Guha, N.; Deepak, S.; et al. MNX1 Is Oncogenically Upregulated in African-American Prostate Cancer. Cancer Res. 2016, 76, 6290–6298. [Google Scholar] [CrossRef] [PubMed]
- Fernandez, L.P.; Gomez de Cedron, M.; Ramirez de Molina, A. Alterations of Lipid Metabolism in Cancer: Implications in Prognosis and Treatment. Front. Oncol. 2020, 10, 577420. [Google Scholar] [CrossRef] [PubMed]
- Pisarska, A.; Wasowicz, W.; Gromadzinska, J. Lipidomic profiles as a tool to search for new biomarkers. Int. J. Occup. Med. Environ. Health 2022, 35, 111–126. [Google Scholar] [CrossRef] [PubMed]
- Afshinnia, F.; Rajendiran, T.M.; Karnovsky, A.; Soni, T.; Wang, X.; Xie, D.; Yang, W.; Shafi, T.; Weir, M.R.; He, J.; et al. Lipidomic Signature of Progression of Chronic Kidney Disease in the Chronic Renal Insufficiency Cohort. Kidney Int. Rep. 2016, 1, 256–268. [Google Scholar] [CrossRef] [PubMed]
- Afshinnia, F.; Rajendiran, T.M.; He, C.; Byun, J.; Montemayor, D.; Darshi, M.; Tumova, J.; Kim, J.; Limonte, C.P.; Miller, R.G.; et al. Circulating Free Fatty Acid and Phospholipid Signature Predicts Early Rapid Kidney Function Decline in Patients With Type 1 Diabetes. Diabetes Care 2021, 44, 2098–2106. [Google Scholar] [CrossRef]
- Slebe, F.; Rojo, F.; Vinaixa, M.; Garcia-Rocha, M.; Testoni, G.; Guiu, M.; Planet, E.; Samino, S.; Arenas, E.J.; Beltran, A.; et al. FoxA and LIPG endothelial lipase control the uptake of extracellular lipids for breast cancer growth. Nat. Commun. 2016, 7, 11199. [Google Scholar] [CrossRef]
- Trousil, S.; Lee, P.; Pinato, D.J.; Ellis, J.K.; Dina, R.; Aboagye, E.O.; Keun, H.C.; Sharma, R. Alterations of choline phospholipid metabolism in endometrial cancer are caused by choline kinase alpha overexpression and a hyperactivated deacylation pathway. Cancer Res. 2014, 74, 6867–6877. [Google Scholar] [CrossRef]
- Swinnen, J.V.; Roskams, T.; Joniau, S.; Van Poppel, H.; Oyen, R.; Baert, L.; Heyns, W.; Verhoeven, G. Overexpression of fatty acid synthase is an early and common event in the development of prostate cancer. Int. J. Cancer 2002, 98, 19–22. [Google Scholar] [CrossRef]
- Menendez, J.A.; Lupu, R. Fatty acid synthase and the lipogenic phenotype in cancer pathogenesis. Nat. Rev. Cancer 2007, 7, 763–777. [Google Scholar] [CrossRef]
- Guo, S.; Wang, Y.; Zhou, D.; Li, Z. Significantly increased monounsaturated lipids relative to polyunsaturated lipids in six types of cancer microenvironment are observed by mass spectrometry imaging. Sci. Rep. 2014, 4, 5959. [Google Scholar] [CrossRef]
- Tan, L.T.; Chan, K.G.; Pusparajah, P.; Lee, W.L.; Chuah, L.H.; Khan, T.M.; Lee, L.H.; Goh, B.H. Targeting Membrane Lipid a Potential Cancer Cure? Front. Pharmacol. 2017, 8, 12. [Google Scholar] [CrossRef] [PubMed]
- Zinrajh, D.; Horl, G.; Jurgens, G.; Marc, J.; Sok, M.; Cerne, D. Increased phosphatidylethanolamine N-methyltransferase gene expression in non-small-cell lung cancer tissue predicts shorter patient survival. Oncol. Lett. 2014, 7, 2175–2179. [Google Scholar] [CrossRef] [PubMed]
- Zhou, D.; Mu, D.; Cheng, M.; Dou, Y.; Zhang, X.; Feng, Z.; Qiu, G.; Yu, H.; Chen, Y.; Xu, H.; et al. Differences in lipidomics may be potential biomarkers for early diagnosis of pancreatic cancer. Acta Cir. Bras. 2020, 35, e202000508. [Google Scholar] [CrossRef] [PubMed]
- Cheng, M.; Bhujwalla, Z.M.; Glunde, K. Targeting Phospholipid Metabolism in Cancer. Front. Oncol. 2016, 6, 266. [Google Scholar] [CrossRef]
- Azrad, M.; Turgeon, C.; Demark-Wahnefried, W. Current evidence linking polyunsaturated Fatty acids with cancer risk and progression. Front. Oncol. 2013, 3, 224. [Google Scholar] [CrossRef]
- Gohlke, J.H.; Lloyd, S.M.; Basu, S.; Putluri, V.; Vareed, S.K.; Rasaily, U.; Piyarathna, D.W.B.; Fuentes, H.; Rajendiran, T.M.; Dorsey, T.H.; et al. Methionine-Homocysteine Pathway in African-American Prostate Cancer. JNCI Cancer Spectr. 2019, 3, pkz019. [Google Scholar] [CrossRef]
- Rolin, J.; Maghazachi, A.A. Effects of lysophospholipids on tumor microenvironment. Cancer Microenviron 2011, 4, 393–403. [Google Scholar] [CrossRef]
- Ross, T.; Jakubzig, B.; Grundmann, M.; Massing, U.; Kostenis, E.; Schlesinger, M.; Bendas, G. The molecular mechanism by which saturated lysophosphatidylcholine attenuates the metastatic capacity of melanoma cells. FEBS Open Bio 2016, 6, 1297–1309. [Google Scholar] [CrossRef]
- Silvente-Poirot, S.; Poirot, M. Cancer. Cholesterol and cancer, in the balance. Science 2014, 343, 1445–1446. [Google Scholar] [CrossRef]
- Li, J.; Gu, D.; Lee, S.S.; Song, B.; Bandyopadhyay, S.; Chen, S.; Konieczny, S.F.; Ratliff, T.L.; Liu, X.; Xie, J.; et al. Abrogating cholesterol esterification suppresses growth and metastasis of pancreatic cancer. Oncogene 2016, 35, 6378–6388. [Google Scholar] [CrossRef]
- Purwaha, P.; Gu, F.; Piyarathna, D.W.B.; Rajendiran, T.; Ravindran, A.; Omilian, A.R.; Jiralerspong, S.; Das, G.; Morrison, C.; Ambrosone, C.; et al. Unbiased Lipidomic Profiling of Triple-Negative Breast Cancer Tissues Reveals the Association of Sphingomyelin Levels with Patient Disease-Free Survival. Metabolites 2018, 8, 41. [Google Scholar] [CrossRef] [PubMed]
- Breil, C.; Abert Vian, M.; Zemb, T.; Kunz, W.; Chemat, F. “Bligh and Dyer” and Folch Methods for Solid-Liquid-Liquid Extraction of Lipids from Microorganisms. Comprehension of Solvatation Mechanisms and towards Substitution with Alternative Solvents. Int. J. Mol. Sci. 2017, 18, 708. [Google Scholar] [CrossRef] [PubMed]
Publisher’s Note: MDPI stays neutral with regard to jurisdictional claims in published maps and institutional affiliations. |
© 2022 by the authors. Licensee MDPI, Basel, Switzerland. This article is an open access article distributed under the terms and conditions of the Creative Commons Attribution (CC BY) license (https://creativecommons.org/licenses/by/4.0/).
Share and Cite
Kami Reddy, K.R.; Piyarathna, D.W.B.; Kamal, A.H.M.; Putluri, V.; Ravi, S.S.; Bollag, R.J.; Terris, M.K.; Lotan, Y.; Putluri, N. Lipidomic Profiling Identifies a Novel Lipid Signature Associated with Ethnicity-Specific Disparity of Bladder Cancer. Metabolites 2022, 12, 544. https://doi.org/10.3390/metabo12060544
Kami Reddy KR, Piyarathna DWB, Kamal AHM, Putluri V, Ravi SS, Bollag RJ, Terris MK, Lotan Y, Putluri N. Lipidomic Profiling Identifies a Novel Lipid Signature Associated with Ethnicity-Specific Disparity of Bladder Cancer. Metabolites. 2022; 12(6):544. https://doi.org/10.3390/metabo12060544
Chicago/Turabian StyleKami Reddy, Karthik Reddy, Danthasinghe Waduge Badrajee Piyarathna, Abu Hena Mostafa Kamal, Vasanta Putluri, Shiva Shankar Ravi, Roni J. Bollag, Martha K. Terris, Yair Lotan, and Nagireddy Putluri. 2022. "Lipidomic Profiling Identifies a Novel Lipid Signature Associated with Ethnicity-Specific Disparity of Bladder Cancer" Metabolites 12, no. 6: 544. https://doi.org/10.3390/metabo12060544
APA StyleKami Reddy, K. R., Piyarathna, D. W. B., Kamal, A. H. M., Putluri, V., Ravi, S. S., Bollag, R. J., Terris, M. K., Lotan, Y., & Putluri, N. (2022). Lipidomic Profiling Identifies a Novel Lipid Signature Associated with Ethnicity-Specific Disparity of Bladder Cancer. Metabolites, 12(6), 544. https://doi.org/10.3390/metabo12060544