
Emerging Role for 7T MRI and Metabolic Imaging for Pancreatic and Liver Cancer

Abstract
1. Introduction
2. Prior to Treatment
2.1. Detection and Staging
2.1.1. Imaging
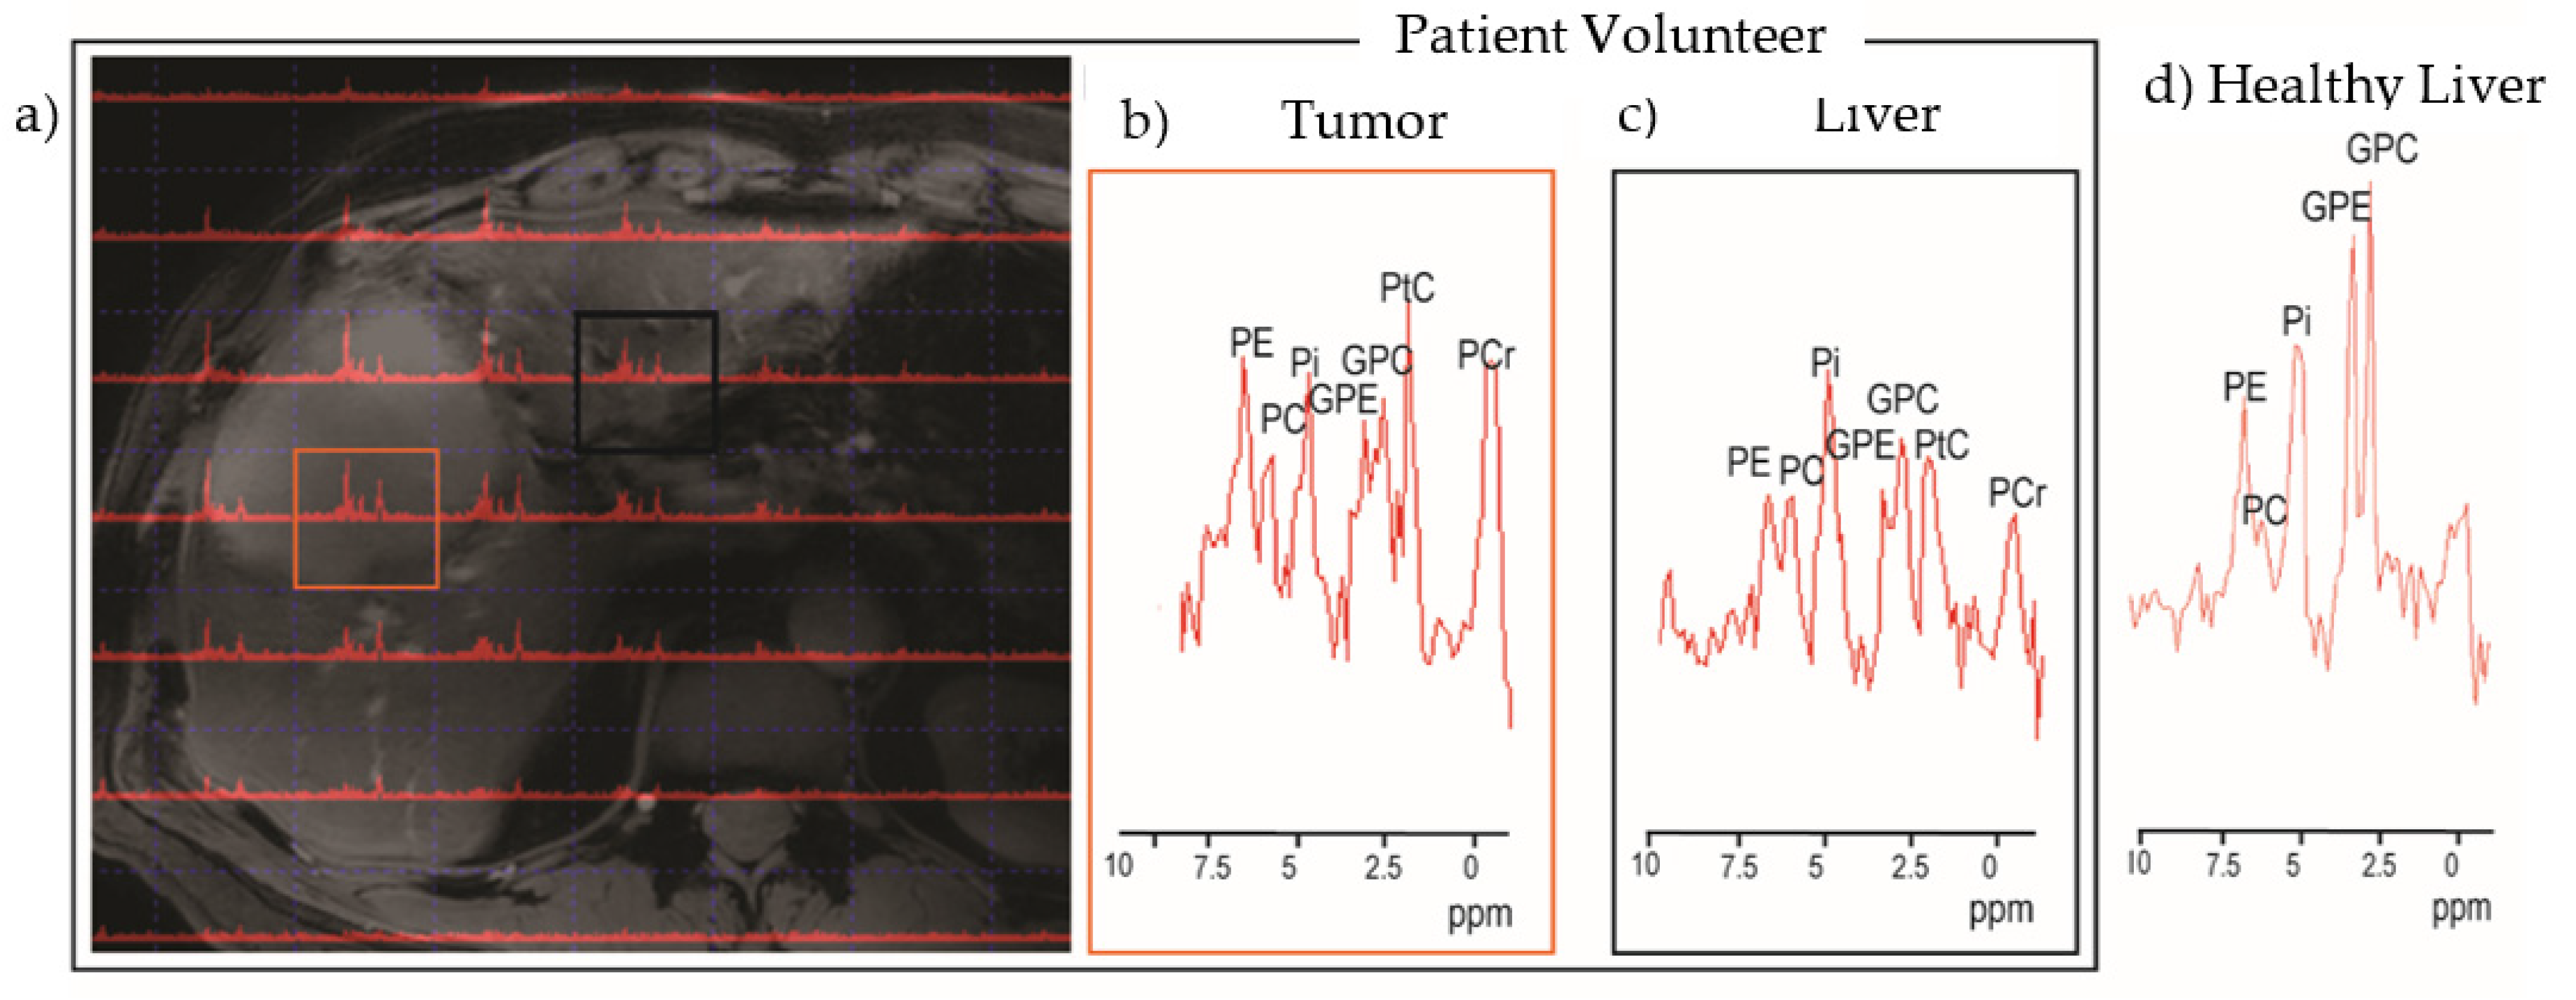
2.1.2. Spectroscopy
2.2. Lymph Node Imaging and Virtual Biopsy
2.3. Aggressiveness and Tumor Sub-Typing
3. Treatment Response
3.1. Need and State-of-Art
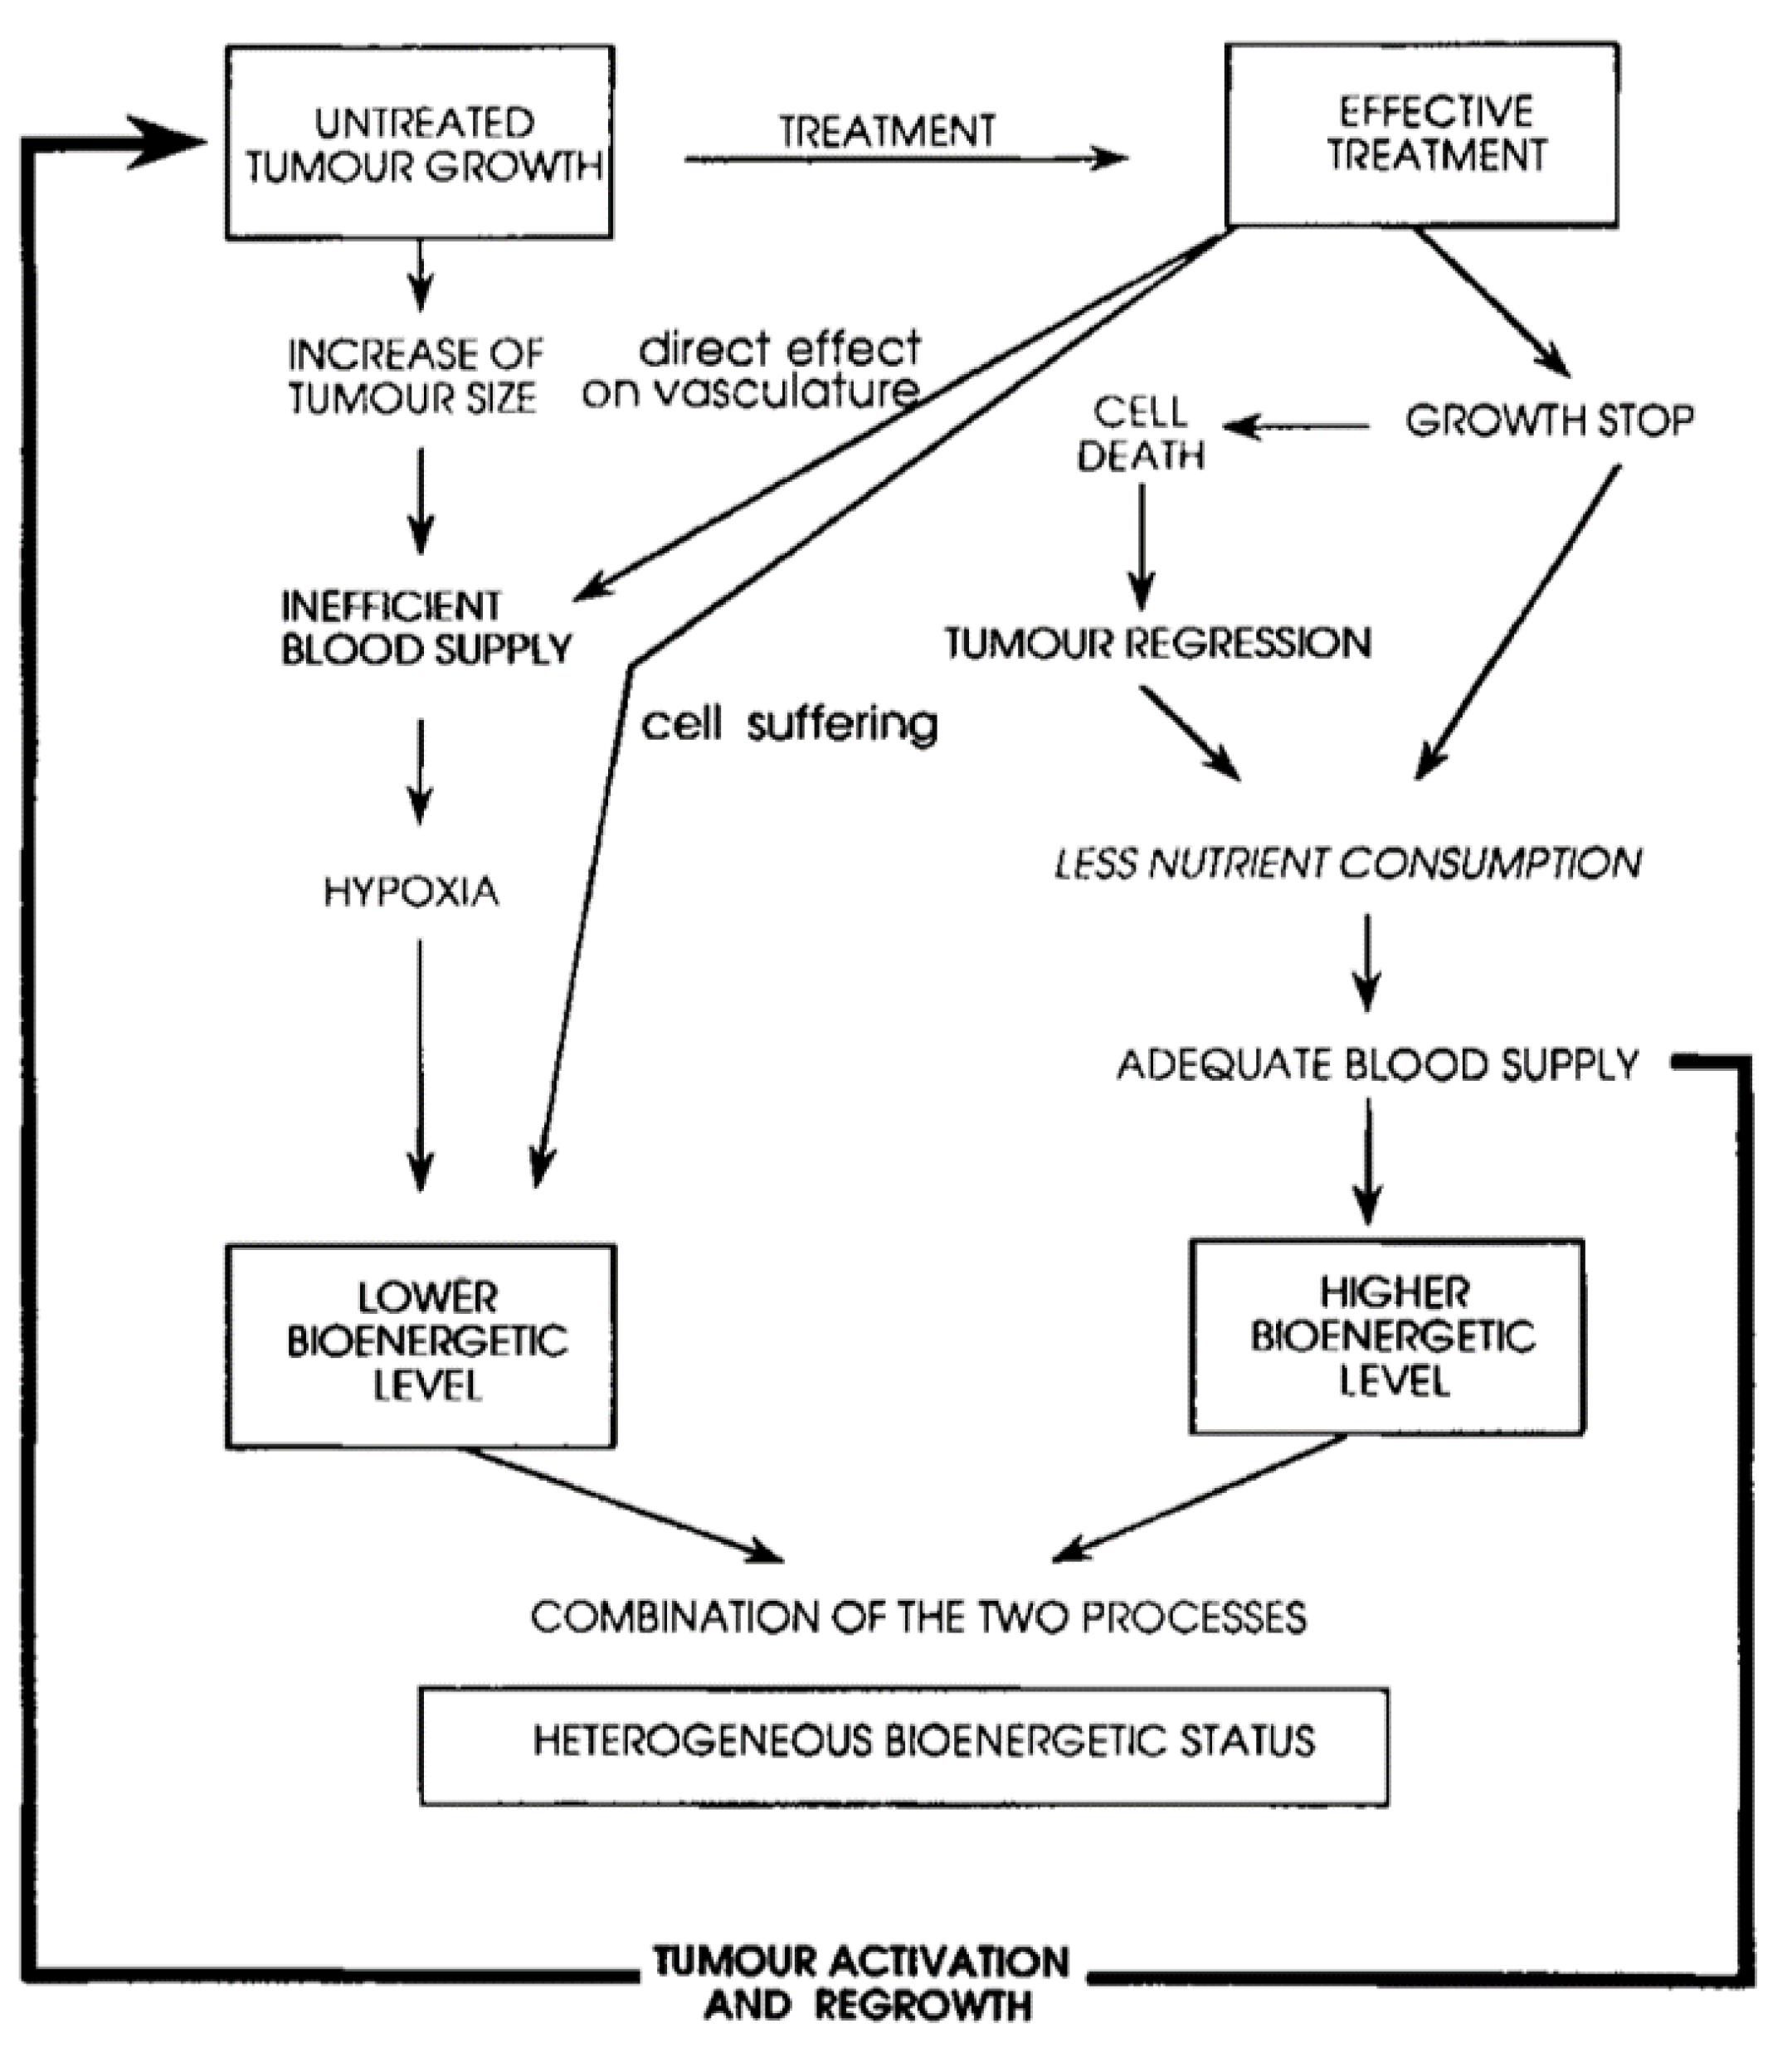
3.2. Evidence Suggesting the Potential of Phosphorus Spectroscopy for Treatment Monitoring
4. Dosimetry and Treatment Development
5. Perspective
- Step (1) Evaluate what percentage of patients deemed in surgery to be non-operable can be identified preoperatively using 7T spectroscopy and imaging.
- Step (2) Reduce unwanted surgeries by informing infiltrating/non-infiltrating, liver status, and LN ratio. Use tumor microenvironment metric of pH to aid decision for identifying hypoxic tumors that are at high risk for recurrence. Test a subset of patients that are not surgical candidates post-therapy to see if treatment response is reliably measured by phosphorus spectra.
- Step (3) Evaluate phosphorus spectroscopy for guiding and adapting treatment in an individual.
- Step (4) Collect database for pairing metabolic subtypes with successful treatments, ensuring that heterogeneity within tumors is a guiding factor and not a confounding one (identifying proportion of population of healthy and malignant cell types based on metabolomics).
- Step (5) Search for low-cost biomarkers that are effective and can be collected non-invasively.
6. Conclusions
Funding
Acknowledgments
Conflicts of Interest
References
- Warburg, O. On the origin of cancer cells. Science 1956, 123, 309–314. [Google Scholar] [CrossRef] [PubMed]
- Griffin, J.L.; Shockcor, J.P. Metabolic profiles of cancer cells. Nat. Rev. Cancer 2004, 4, 551–561. [Google Scholar] [CrossRef] [PubMed]
- Ling, S.; Hu, Z.; Yang, Z.; Yang, F.; Li, Y.; Lin, P.; Chen, K.; Dong, L.; Cao, L.; Tao, Y.; et al. Extremely high genetic diversity in a single tumor points to prevalence of non-Darwinian cell evolution. Proc. Natl. Acad. Sci. USA 2015, 112, E6496–E6505. [Google Scholar] [CrossRef] [PubMed]
- Collisson, E.A.; Bailey, P.; Chang, D.K.; Biankin, A.V. Molecular subtypes of pancreatic cancer. Nat. Rev. Gastroenterol. Hepatol. 2019, 16, 207–220. [Google Scholar] [CrossRef] [PubMed]
- Campbell, P.J.; Yachida, S.; Mudie, L.J.; Stephens, P.J.; Pleasance, E.D.; Stebbings, L.A.; Morsberger, L.A.; Latimer, C.; McLaren, S.; Lin, M.-L.; et al. The patterns and dynamics of genomic instability in metastatic pancreatic cancer. Nature 2010, 467, 1109–1113. [Google Scholar] [CrossRef] [PubMed]
- Ritch, E.; Fu, S.Y.F.; Herberts, C.; Wang, G.; Warner, E.W.; Schönlau, E.; Taavitsainen, S.; Murtha, A.J.; Vandekerkhove, G.; Beja, K.; et al. Identification of Hypermutation and Defective Mismatch Repair in ctDNA from Metastatic Prostate Cancer. Clin. Cancer Res. Off. J. Am. Assoc. Cancer Res. 2020, 26, 1114–1125. [Google Scholar] [CrossRef]
- Barroso-Sousa, R.; Jain, E.; Cohen, O.; Kim, D.; Buendia-Buendia, J.; Winer, E.; Lin, N.; Tolaney, S.M.; Wagle, N. Prevalence and mutational determinants of high tumor mutation burden in breast cancer. Ann. Oncol. Off. J. Eur. Soc. Med. Oncol. 2020, 31, 387–394. [Google Scholar] [CrossRef]
- Hanna-Sawires, R.G.; Schiphuis, J.H.; Wuhrer, M.; Vasen, H.F.A.; van Leerdam, M.E.; Bonsing, B.A.; Mesker, W.E.; van der Burgt, Y.E.M.; Tollenaar, R.A.E.M. Clinical Perspective on Proteomic and Glycomic Biomarkers for Diagnosis, Prognosis, and Prediction of Pancreatic Cancer. Int. J. Mol. Sci. 2021, 22, 2655. [Google Scholar] [CrossRef]
- McConnell, Y.J.; Farshidfar, F.; Weljie, A.M.; Kopciuk, K.A.; Dixon, E.; Ball, C.G.; Sutherland, F.R.; Vogel, H.J.; Bathe, O.F. Distinguishing Benign from Malignant Pancreatic and Periampullary Lesions Using Combined Use of 1H-NMR Spectroscopy and Gas Chromatography-Mass Spectrometry. Metabolites 2017, 7, 3. [Google Scholar] [CrossRef]
- Wishart, G.; Gupta, P.; Schettino, G.; Nisbet, A.; Velliou, E. 3d tissue models as tools for radiotherapy screening for pancreatic cancer. Br. J. Radiol. 2021, 94, 20201397. [Google Scholar] [CrossRef]
- Bedard, P.L.; Hansen, A.R.; Ratain, M.J.; Siu, L.L. Tumour heterogeneity in the clinic. Nature 2013, 501, 355–364. [Google Scholar] [CrossRef] [PubMed]
- Grossberg, A.J.; Chu, L.C.; Deig, C.R.; Fishman, E.K.; Hwang, W.L.; Maitra, A.; Marks, D.L.; Mehta, A.; Nabavizadeh, N.; Simeone, D.M.; et al. Multidisciplinary standards of care and recent progress in pancreatic ductal adenocarcinoma. CA. Cancer J. Clin. 2020, 70, 375–403. [Google Scholar] [CrossRef] [PubMed]
- Wakabayashi, T.; Ouhmich, F.; Gonzalez-Cabrera, C.; Felli, E.; Saviano, A.; Agnus, V.; Savadjiev, P.; Baumert, T.F.; Pessaux, P.; Marescaux, J.; et al. Radiomics in hepatocellular carcinoma: A quantitative review. Hepatol. Int. 2019, 13, 546–559. [Google Scholar] [CrossRef]
- Ikemoto, J.; Serikawa, M.; Hanada, K.; Eguchi, N.; Sasaki, T.; Fujimoto, Y.; Sugiyama, S.; Yamaguchi, A.; Noma, B.; Kamigaki, M.; et al. Clinical Analysis of Early-Stage Pancreatic Cancer and Proposal for a New Diagnostic Algorithm: A Multicenter Observational Study. Diagn. Basel Switz. 2021, 11, 287. [Google Scholar] [CrossRef] [PubMed]
- Toft, J.; Hadden, W.J.; Laurence, J.M.; Lam, V.; Yuen, L.; Janssen, A.; Pleass, H. Imaging modalities in the diagnosis of pancreatic adenocarcinoma: A systematic review and meta-analysis of sensitivity, specificity and diagnostic accuracy. Eur. J. Radiol. 2017, 92, 17–23. [Google Scholar] [CrossRef]
- Pecorelli, N.; Licinio, A.W.; Guarneri, G.; Aleotti, F.; Crippa, S.; Reni, M.; Falconi, M.; Balzano, G. Prognosis of Upfront Surgery for Pancreatic Cancer: A Systematic Review and Meta-Analysis of Prospective Studies. Front. Oncol. 2021, 11, 812102. [Google Scholar] [CrossRef]
- Kachare, S.D.; Liner, K.R.; Vohra, N.A.; Zervos, E.E.; Hickey, T.; Fitzgerald, T.L. Assessment of health care cost for complex surgical patients: Review of cost, re-imbursement and revenue involved in pancreatic surgery at a high-volume academic medical centre. HPB 2015, 17, 311–317. [Google Scholar] [CrossRef]
- Prenzel, K.L.; Hölscher, A.H.; Vallböhmer, D.; Drebber, U.; Gutschow, C.A.; Mönig, S.P.; Stippel, D.L. Lymph node size and metastatic infiltration in adenocarcinoma of the pancreatic head. Eur. J. Surg. Oncol. J. Eur. Soc. Surg. Oncol. Br. Assoc. Surg. Oncol. 2010, 36, 993–996. [Google Scholar] [CrossRef]
- Vernuccio, F.; Messina, C.; Merz, V.; Cannella, R.; Midiri, M. Resectable and Borderline Resectable Pancreatic Ductal Adenocarcinoma: Role of the Radiologist and Oncologist in the Era of Precision Medicine. Diagn. Basel Switz. 2021, 11, 2166. [Google Scholar] [CrossRef]
- Shrikhande, S.V.; Barreto, S.G.; Goel, M.; Arya, S. Multimodality imaging of pancreatic ductal adenocarcinoma: A review of the literature. HPB 2012, 14, 658–668. [Google Scholar] [CrossRef]
- Costache, M.I.; Costache, C.A.; Dumitrescu, C.I.; Tica, A.A.; Popescu, M.; Baluta, E.A.; Anghel, A.C.; Saftoiu, A.; Dumitrescu, D. Which is the Best Imaging Method in Pancreatic Adenocarcinoma Diagnosis and Staging-CT, MRI or EUS? Curr. Health Sci. J. 2017, 43, 132–136. [Google Scholar] [CrossRef] [PubMed]
- Kim, D.W.; Choi, S.H.; Kim, S.Y.; Byun, J.H.; Lee, S.S.; Park, S.H.; Kim, K.W. Diagnostic performance of MRI for HCC according to contrast agent type: A systematic review and meta-analysis. Hepatol. Int. 2020, 14, 1009–1022. [Google Scholar] [CrossRef] [PubMed]
- Schmitz, A.M.T.; Veldhuis, W.B.; Menke-Pluijmers, M.B.E.; van der Kemp, W.J.M.; van der Velden, T.A.; Viergever, M.A.; Mali, W.P.T.M.; Kock, M.C.J.M.; Westenend, P.J.; Klomp, D.W.J.; et al. Preoperative indication for systemic therapy extended to patients with early-stage breast cancer using multiparametric 7-tesla breast MRI. PLoS ONE 2017, 12, e0183855. [Google Scholar] [CrossRef] [PubMed]
- Rivera, D.; Kalleveen, I.; de Castro, C.A.; van Laarhoven, H.; Klomp, D.; van der Kemp, W.; Stoker, J.; Nederveen, A. Inherently decoupled 1 H antennas and 31 P loops for metabolic imaging of liver metastasis at 7T. NMR Biomed. 2020, 33, e4221. [Google Scholar] [CrossRef] [PubMed]
- Mann, D.V.; Lam, W.W.M.; Magnus Hjelm, N.; So, N.M.C.; Yeung, D.K.W.; Metreweli, C.; Lau, W.Y. Biliary drainage for obstructive jaundice enhances hepatic energy status in humans: A 31-phosphorus magnetic resonance spectroscopy study. Gut 2002, 50, 118–122. [Google Scholar] [CrossRef][Green Version]
- Pinker, K.; Baltzer, P.; Bogner, W.; Leithner, D.; Trattnig, S.; Zaric, O.; Dubsky, P.; Bago-Horvath, Z.; Rudas, M.; Gruber, S.; et al. Multiparametric MR Imaging with High-Resolution Dynamic Contrast-enhanced and Diffusion-weighted Imaging at 7T Improves the Assessment of Breast Tumors: A Feasibility Study. Radiology 2015, 276, 360–370. [Google Scholar] [CrossRef]
- Pinker, K.; Moy, L.; Sutton, E.J.; Mann, R.M.; Weber, M.; Thakur, S.B.; Jochelson, M.S.; Bago-Horvath, Z.; Morris, E.A.; Baltzer, P.A.; et al. Diffusion-Weighted Imaging With Apparent Diffusion Coefficient Mapping for Breast Cancer Detection as a Stand-Alone Parameter: Comparison With Dynamic Contrast-Enhanced and Multiparametric Magnetic Resonance Imaging. Investig. Radiol. 2018, 53, 587–595. [Google Scholar] [CrossRef]
- Metzger, G.J.; Snyder, C.; Akgun, C.; Vaughan, T.; Ugurbil, K.; Van de Moortele, P.-F. Local B1+ shimming for prostate imaging with transceiver arrays at 7T based on subject-dependent transmit phase measurements. Magn. Reson. Med. 2008, 59, 396–409. [Google Scholar] [CrossRef]
- Valkovič, L.; Dragonu, I.; Almujayyaz, S.; Batzakis, A.; Young, L.A.J.; Purvis, L.A.B.; Clarke, W.T.; Wichmann, T.; Lanz, T.; Neubauer, S.; et al. Using a whole-body 31P birdcage transmit coil and 16-element receive array for human cardiac metabolic imaging at 7T. PLoS ONE 2017, 12, e0187153. [Google Scholar] [CrossRef]
- van Houtum, Q.; Welting, D.; Gosselink, W.J.M.; Klomp, D.W.J.; Arteaga de Castro, C.S.; van der Kemp, W.J.M. Low SAR 31 P (multi-echo) spectroscopic imaging using an integrated whole-body transmit coil at 7T. NMR Biomed. 2019, 32, e4178. [Google Scholar] [CrossRef]
- Steen, R.G. Response of solid tumors to chemotherapy monitored by in vivo 31P nuclear magnetic resonance spectroscopy: A review. Cancer Res. 1989, 49, 4075–4085. [Google Scholar] [PubMed]
- Kwee, S.A.; Sato, M.M.; Kuang, Y.; Franke, A.; Custer, L.; Miyazaki, K.; Wong, L.L. [18F]Fluorocholine PET/CT Imaging of Liver Cancer: Radiopathologic Correlation with Tissue Phospholipid Profiling. Mol. Imaging Biol. 2017, 19, 446–455. [Google Scholar] [CrossRef] [PubMed]
- Cox, I.J.; Bell, J.D.; Peden, C.J.; Iles, R.A.; Foster, C.S.; Watanapa, P.; Williamson, R.C. In vivo and in vitro 31P magnetic resonance spectroscopy of focal hepatic malignancies. NMR Biomed. 1992, 5, 114–120. [Google Scholar] [CrossRef] [PubMed]
- Brinkmann, G.; Melchert, U.H.; Emde, L.; Wolf, H.; Muhle, C.; Brossmann, J.; Reuter, M.; Heller, M. In vivo P-31-MR-spectroscopy of focal hepatic lesions. Effectiveness of tumor detection in clinical practice and experimental studies of surface coil characteristics and localization technique. Investig. Radiol. 1995, 30, 56–63. [Google Scholar] [CrossRef] [PubMed]
- Glunde, K.; Jiang, L.; Moestue, S.A.; Gribbestad, I.S. MRS and MRSI guidance in molecular medicine: Targeting and monitoring of choline and glucose metabolism in cancer. NMR Biomed. 2011, 24, 673–690. [Google Scholar] [CrossRef] [PubMed]
- Chen, B.-B.; Tien, Y.-W.; Chang, M.-C.; Cheng, M.-F.; Chang, Y.-T.; Wu, C.-H.; Chen, X.-J.; Kuo, T.-C.; Yang, S.-H.; Shih, I.-L.; et al. PET/MRI in pancreatic and periampullary cancer: Correlating diffusion-weighted imaging, MR spectroscopy and glucose metabolic activity with clinical stage and prognosis. Eur. J. Nucl. Med. Mol. Imaging 2016, 43, 1753–1764. [Google Scholar] [CrossRef] [PubMed]
- Yao, X.; Zeng, M.; Wang, H.; Fei, S.; Rao, S.; Ji, Y. Metabolite detection of pancreatic carcinoma by in vivo proton MR spectroscopy at 3T: Initial results. Radiol. Med. 2012, 117, 780–788. [Google Scholar] [CrossRef]
- Kaplan, O.; Kushnir, T.; Askenazy, N.; Knubovets, T.; Navon, G. Role of nuclear magnetic resonance spectroscopy (MRS) in cancer diagnosis and treatment: 31P, 23Na, and 1H MRS studies of three models of pancreatic cancer. Cancer Res. 1997, 57, 1452–1459. [Google Scholar]
- Shah, T.; Krishnamachary, B.; Wildes, F.; Wijnen, J.P.; Glunde, K.; Bhujwalla, Z.M. Molecular causes of elevated phosphoethanolamine in breast and pancreatic cancer cells. NMR Biomed. 2018, 31, e3936. [Google Scholar] [CrossRef]
- Battini, S.; Faitot, F.; Imperiale, A.; Cicek, A.E.; Heimburger, C.; Averous, G.; Bachellier, P.; Namer, I.J. Metabolomics approaches in pancreatic adenocarcinoma: Tumor metabolism profiling predicts clinical outcome of patients. BMC Med. 2017, 15, 56. [Google Scholar] [CrossRef]
- Penet, M.-F.; Shah, T.; Bharti, S.; Krishnamachary, B.; Artemov, D.; Mironchik, Y.; Wildes, F.; Maitra, A.; Bhujwalla, Z.M. Metabolic imaging of pancreatic ductal adenocarcinoma detects altered choline metabolism. Clin. Cancer Res. Off. J. Am. Assoc. Cancer Res. 2015, 21, 386–395. [Google Scholar] [CrossRef] [PubMed]
- Gallego-Ortega, D.; Ramirez de Molina, A.; Ramos, M.A.; Valdes-Mora, F.; Barderas, M.G.; Sarmentero-Estrada, J.; Lacal, J.C. Differential role of human choline kinase alpha and beta enzymes in lipid metabolism: Implications in cancer onset and treatment. PLoS ONE 2009, 4, e7819. [Google Scholar] [CrossRef] [PubMed]
- Wijnen, J.P.; van der Kemp, W.J.M.; Luttje, M.P.; Korteweg, M.A.; Luijten, P.R.; Klomp, D.W.J. Quantitative 31P magnetic resonance spectroscopy of the human breast at 7T. Magn. Reson. Med. 2012, 68, 339–348. [Google Scholar] [CrossRef]
- Bolan, P.J.; Meisamy, S.; Baker, E.H.; Lin, J.; Emory, T.; Nelson, M.; Everson, L.I.; Yee, D.; Garwood, M. In vivo quantification of choline compounds in the breast with 1H MR spectroscopy. Magn. Reson. Med. 2003, 50, 1134–1143. [Google Scholar] [CrossRef]
- Rivera, D.S.; Wijnen, J.P.; van der Kemp, W.J.M.; Raaijmakers, A.J.; Luijten, P.R.; Klomp, D.W.J. MRI and (31)P magnetic resonance spectroscopy hardware for axillary lymph node investigation at 7T. Magn. Reson. Med. 2015, 73, 2038–2046. [Google Scholar] [CrossRef]
- Basturk, O.; Saka, B.; Balci, S.; Postlewait, L.M.; Knight, J.; Goodman, M.; Kooby, D.; Sarmiento, J.M.; El-Rayes, B.; Choi, H.; et al. Substaging of Lymph Node Status in Resected Pancreatic Ductal Adenocarcinoma Has Strong Prognostic Correlations: Proposal for a Revised N Classification for TNM Staging. Ann. Surg. Oncol. 2015, 22 (Suppl. S3), S1187–S1195. [Google Scholar] [CrossRef]
- Fukuda, Y.; Asaoka, T.; Maeda, S.; Hama, N.; Miyamoto, A.; Mori, M.; Doki, Y.; Nakamori, S. Prognostic impact of nodal statuses in patients with pancreatic ductal adenocarcinoma. Pancreatology 2017, 17, 279–284. [Google Scholar] [CrossRef]
- Showalter, T.N.; Winter, K.A.; Berger, A.C.; Regine, W.F.; Abrams, R.A.; Safran, H.; Hoffman, J.P.; Benson, A.B.; MacDonald, J.S.; Willett, C.G. The influence of total nodes examined, number of positive nodes, and lymph node ratio on survival after surgical resection and adjuvant chemoradiation for pancreatic cancer: A secondary analysis of RTOG 9704. Int. J. Radiat. Oncol. Biol. Phys. 2011, 81, 1328–1335. [Google Scholar] [CrossRef]
- Calabrese, A.; Santucci, D.; Landi, R.; Beomonte Zobel, B.; Faiella, E.; de Felice, C. Radiomics MRI for lymph node status prediction in breast cancer patients: The state of art. J. Cancer Res. Clin. Oncol. 2021, 147, 1587–1597. [Google Scholar] [CrossRef]
- McIntyre, C.A.; Winter, J.M. Diagnostic evaluation and staging of pancreatic ductal adenocarcinoma. Semin. Oncol. 2015, 42, 19–27. [Google Scholar] [CrossRef]
- Sonkar, K.; Ayyappan, V.; Tressler, C.M.; Adelaja, O.; Cai, R.; Cheng, M.; Glunde, K. Focus on the glycerophosphocholine pathway in choline phospholipid metabolism of cancer. NMR Biomed. 2019, 32, e4112. [Google Scholar] [CrossRef] [PubMed]
- Sterin, M.; Cohen, J.S.; Mardor, Y.; Berman, E.; Ringel, I. Levels of phospholipid metabolites in breast cancer cells treated with antimitotic drugs: A 31P-magnetic resonance spectroscopy study. Cancer Res. 2001, 61, 7536–7543. [Google Scholar] [PubMed]
- Graham, R.A.; Brown, T.R.; Meyer, R.A. An ex vivo model for the study of tumor metabolism by nuclear magnetic resonance: Characterization of the phosphorus-31 spectrum of the isolated perfused Morris hepatoma 7777. Cancer Res. 1991, 51, 841–849. [Google Scholar] [PubMed]
- Spees, W.M.; Evelhoch, J.L.; Thompson, P.A.; Sloop, D.J.; Ackerman, J.J.H. Defining the pHi-hyperthermia sensitivity relationship for the RIF-1 tumor in vivo: A 31P MR spectroscopy study. Radiat. Res. 2005, 164, 86–99. [Google Scholar] [CrossRef]
- Dewhirst, M.W.; Poulson, J.M.; Yu, D.; Sanders, L.; Lora-Michiels, M.; Vujaskovic, Z.; Jones, E.L.; Samulski, T.V.; Powers, B.E.; Brizel, D.M.; et al. Relation between pO2, 31P magnetic resonance spectroscopy parameters and treatment outcome in patients with high-grade soft tissue sarcomas treated with thermoradiotherapy. Int. J. Radiat. Oncol. Biol. Phys. 2005, 61, 480–491. [Google Scholar] [CrossRef]
- Tan, Z.; Xu, J.; Zhang, B.; Shi, S.; Yu, X.; Liang, C. Hypoxia: A barricade to conquer the pancreatic cancer. Cell. Mol. Life Sci. CMLS 2020, 77, 3077–3083. [Google Scholar] [CrossRef]
- de Certaines, J.D.; Larsen, V.A.; Podo, F.; Carpinelli, G.; Briot, O.; Henriksen, O. In vivo 31P MRS of experimental tumours. NMR Biomed. 1993, 6, 345–365. [Google Scholar] [CrossRef]
- Tiriac, H.; Belleau, P.; Engle, D.D.; Plenker, D.; Deschênes, A.; Somerville, T.D.D.; Froeling, F.E.M.; Burkhart, R.A.; Denroche, R.E.; Jang, G.-H.; et al. Organoid Profiling Identifies Common Responders to Chemotherapy in Pancreatic Cancer. Cancer Discov. 2018, 8, 1112–1129. [Google Scholar] [CrossRef]
- Trajkovic-Arsic, M.; Heid, I.; Steiger, K.; Gupta, A.; Fingerle, A.; Wörner, C.; Teichmann, N.; Sengkwawoh-Lueong, S.; Wenzel, P.; Beer, A.J.; et al. Apparent Diffusion Coefficient (ADC) predicts therapy response in pancreatic ductal adenocarcinoma. Sci. Rep. 2017, 7, 17038. [Google Scholar] [CrossRef]
- Ko, C.-C.; Yeh, L.-R.; Kuo, Y.-T.; Chen, J.-H. Imaging biomarkers for evaluating tumor response: RECIST and beyond. Biomark. Res. 2021, 9, 52. [Google Scholar] [CrossRef]
- Baliyan, V.; Kordbacheh, H.; Parakh, A.; Kambadakone, A. Response assessment in pancreatic ductal adenocarcinoma: Role of imaging. Abdom. Radiol. N. Y. 2018, 43, 435–444. [Google Scholar] [CrossRef] [PubMed]
- Versteijne, E.; Suker, M.; Groothuis, K.; Akkermans-Vogelaar, J.M.; Besselink, M.G.; Bonsing, B.A.; Buijsen, J.; Busch, O.R.; Creemers, G.-J.M.; van Dam, R.M.; et al. Preoperative Chemoradiotherapy Versus Immediate Surgery for Resectable and Borderline Resectable Pancreatic Cancer: Results of the Dutch Randomized Phase III PREOPANC Trial. J. Clin. Oncol. Off. J. Am. Soc. Clin. Oncol. 2020, 38, 1763–1773. [Google Scholar] [CrossRef] [PubMed]
- Benz, C.; Hollander, C.; Keniry, M.; James, T.L.; Mitchell, M. Lactic dehydrogenase isozymes, 31P magnetic resonance spectroscopy, and in vitro antimitochondrial tumor toxicity with gossypol and rhodamine-123. J. Clin. Investg. 1987, 79, 517–523. [Google Scholar] [CrossRef] [PubMed]
- Meyerhoff, D.J.; Karczmar, G.S.; Valone, F.; Venook, A.; Matson, G.B.; Weiner, M.W. Hepatic cancers and their response to chemoembolization therapy. Quantitative image-guided 31P magnetic resonance spectroscopy. Investig. Radiol. 1992, 27, 456–464. [Google Scholar] [CrossRef]
- Hattingen, E.; Jurcoane, A.; Bähr, O.; Rieger, J.; Magerkurth, J.; Anti, S.; Steinbach, J.P.; Pilatus, U. Bevacizumab impairs oxidative energy metabolism and shows antitumoral effects in recurrent glioblastomas: A 31P/1H MRSI and quantitative magnetic resonance imaging study. Neuro-Oncol. 2011, 13, 1349–1363. [Google Scholar] [CrossRef] [PubMed]
- Klomp, D.W.J.; van de Bank, B.L.; Raaijmakers, A.; Korteweg, M.A.; Possanzini, C.; Boer, V.O.; van de Berg, C.A.T.; van de Bosch, M.A.A.J.; Luijten, P.R. 31P MRSI and 1H MRS at 7T: Initial results in human breast cancer. NMR Biomed. 2011, 24, 1337–1342. [Google Scholar] [CrossRef] [PubMed]
- Krikken, E.; van der Kemp, W.J.M.; van Diest, P.J.; van Dalen, T.; van Laarhoven, H.W.M.; Luijten, P.R.; Klomp, D.W.J.; Wijnen, J.P. Early detection of changes in phospholipid metabolism during neoadjuvant chemotherapy in breast cancer patients using phosphorus magnetic resonance spectroscopy at 7T. NMR Biomed. 2019, 32, e4086. [Google Scholar] [CrossRef]
- Jayasundar, R.; Honess, D.; Hall, L.D.; Bleehen, N.M. Simultaneous evaluation of the effects of RF hyperthermia on the intra- and extracellular tumor pH. Magn. Reson. Med. 2000, 43, 1–8. [Google Scholar] [CrossRef]
- Redmond, O.M.; Stack, J.P.; O’Connor, N.G.; Carney, D.N.; Dervan, P.A.; Hurson, B.J.; Ennis, J.T. 31P MRS as an early prognostic indicator of patient response to chemotherapy. Magn. Reson. Med. 1992, 25, 30–44. [Google Scholar] [CrossRef]
- Naruse, S.; Higuchi, T.; Horikawa, Y.; Tanaka, C.; Nakamura, K.; Hirakawa, K. Radiofrequency hyperthermia with successive monitoring of its effects on tumors using NMR spectroscopy. Proc. Natl. Acad. Sci. USA 1986, 83, 8343–8347. [Google Scholar] [CrossRef]
- James, J.R.; Gao, Y.; Soon, V.C.; Topper, S.M.; Babsky, A.; Bansal, N. Controlled radio-frequency hyperthermia using an MR scanner and simultaneous monitoring of temperature and therapy response by (1)H, (23)Na and (31)P magnetic resonance spectroscopy in subcutaneously implanted 9L-gliosarcoma. Int. J. Hyperth. Off. J. Eur. Soc. Hyperth. Oncol. N. Am. Hyperth. Group 2010, 26, 79–90. [Google Scholar] [CrossRef] [PubMed]
- Sijens, P.E.; Bovée, W.M.; Seijkens, D.; Koole, P.; Los, G.; van Rijssel, R.H. Murine mammary tumor response to hyperthermia and radiotherapy evaluated by in vivo 31P-nuclear magnetic resonance spectroscopy. Cancer Res. 1987, 47, 6467–6473. [Google Scholar] [PubMed]
- Kristjansen, P.E.; Pedersen, E.J.; Quistorff, B.; Elling, F.; Spang-Thomsen, M. Early effects of radiotherapy in small cell lung cancer xenografts monitored by 31P magnetic resonance spectroscopy and biochemical analysis. Cancer Res. 1990, 50, 4880–4884. [Google Scholar] [PubMed]
- Kristjansen, P.E.; Pedersen, A.G.; Quistorff, B.; Spang-Thomsen, M. Different early effect of irradiation in brain and small cell lung cancer examined by in vivo 31P-magnetic resonance spectroscopy. Radiother. Oncol. J. Eur. Soc. Ther. Radiol. Oncol. 1992, 24, 186–190. [Google Scholar] [CrossRef]
- Murata, O.; Sakurai, H.; Mitsuhashi, N.; Hasegawa, M.; Yamakawa, M.; Kurosaki, H.; Hayakawa, K.; Niibe, H. 31P NMR spectroscopy can predict the optimum interval between fractionated irradiation doses. Anticancer Res. 1998, 18, 4297–4301. [Google Scholar]
- Glunde, K.; Serkova, N.J. Therapeutic targets and biomarkers identified in cancer choline phospholipid metabolism. Pharmacogenomics 2006, 7, 1109–1123. [Google Scholar] [CrossRef]
- Mazarico, J.M.; Sánchez-Arévalo Lobo, V.J.; Favicchio, R.; Greenhalf, W.; Costello, E.; Carrillo-de Santa Pau, E.; Marqués, M.; Lacal, J.C.; Aboagye, E.; Real, F.X. Choline Kinase Alpha (CHKα) as a Therapeutic Target in Pancreatic Ductal Adenocarcinoma: Expression, Predictive Value, and Sensitivity to Inhibitors. Mol. Cancer Ther. 2016, 15, 323–333. [Google Scholar] [CrossRef]
- Bell, J.D.; Bhakoo, K.K. Metabolic changes underlying 31P MR spectral alterations in human hepatic tumours. NMR Biomed. 1998, 11, 354–359. [Google Scholar] [CrossRef]
- Wishart, D.S.; Mandal, R.; Stanislaus, A.; Ramirez-Gaona, M. Cancer Metabolomics and the Human Metabolome Database. Metabolites 2016, 6, 10. [Google Scholar] [CrossRef]
- Turco, S.; Frinking, P.; Wildeboer, R.; Arditi, M.; Wijkstra, H.; Lindner, J.R.; Mischi, M. Contrast-Enhanced Ultrasound Quantification: From Kinetic Modeling to Machine Learning. Ultrasound Med. Biol. 2020, 46, 518–543. [Google Scholar] [CrossRef]
- Wildeboer, R.R.; Mannaerts, C.K.; van Sloun, R.J.G.; Budäus, L.; Tilki, D.; Wijkstra, H.; Salomon, G.; Mischi, M. Automated multiparametric localization of prostate cancer based on B-mode, shear-wave elastography, and contrast-enhanced ultrasound radiomics. Eur. Radiol. 2020, 30, 806–815. [Google Scholar] [CrossRef] [PubMed]
- Zhang, Y.; Yap, P.-T.; Qu, L.; Cheng, J.-Z.; Shen, D. Dual-domain convolutional neural networks for improving structural information in 3 T MRI. Magn. Reson. Imaging 2019, 64, 90–100. [Google Scholar] [CrossRef] [PubMed]


| Author | Year | Factor Analyzed | Modality | Sensitivity | Specificity | Accuracy | Comments |
|---|---|---|---|---|---|---|---|
| Costache et al. | 2017 | Diagnosis | Helical CT | 81% | 43% | 83% | EUS for detection; CT for determining resectability |
| EUS | 97% | 90% | 93% | ||||
| MRI | 88% | 63% | 89% | ||||
| Soriano et al. | 2004 | Locoregional extension | Helical CT | 66% | 100% | 74% | Helical CT and EUS—most useful individual imaging techniques in the staging of pancreatic cancer |
| EUS | 44% | 100% | 62% | ||||
| MRI | 53% | 100% | 68% | ||||
| Nodal staging | Helical CT | 37% | 79% | 62% | |||
| EUS | 36% | 87% | 65% | ||||
| MRI | 15% | 93% | 61% | ||||
| Vascular invasion | Helical CT | 67% | 94% | 83% | In potentially resectable tumors—sequential approach: initially helical CT followed by confirmatory EUS—most reliable and cost effective | ||
| EUS | 42% | 97% | 76% | ||||
| MRI | 59% | 84% | 74% | ||||
| Distant metastases | Helical CT | 55% | 96% | 88% | |||
| EUS | 0% | 100% | 85% | ||||
| MRI | 30% | 95% | 83% |
Publisher’s Note: MDPI stays neutral with regard to jurisdictional claims in published maps and institutional affiliations. |
© 2022 by the author. Licensee MDPI, Basel, Switzerland. This article is an open access article distributed under the terms and conditions of the Creative Commons Attribution (CC BY) license (https://creativecommons.org/licenses/by/4.0/).
Share and Cite
Rivera, D. Emerging Role for 7T MRI and Metabolic Imaging for Pancreatic and Liver Cancer. Metabolites 2022, 12, 409. https://doi.org/10.3390/metabo12050409
Rivera D. Emerging Role for 7T MRI and Metabolic Imaging for Pancreatic and Liver Cancer. Metabolites. 2022; 12(5):409. https://doi.org/10.3390/metabo12050409
Chicago/Turabian StyleRivera, Debra. 2022. "Emerging Role for 7T MRI and Metabolic Imaging for Pancreatic and Liver Cancer" Metabolites 12, no. 5: 409. https://doi.org/10.3390/metabo12050409
APA StyleRivera, D. (2022). Emerging Role for 7T MRI and Metabolic Imaging for Pancreatic and Liver Cancer. Metabolites, 12(5), 409. https://doi.org/10.3390/metabo12050409