
Observable Metabolites and Metabolomic Sampling Protocols for Managed African Savanna Elephant (Loxodonta africana) Whole Blood Using H-NMR Spectroscopy

 ,
,  ,
,  , and
, and 
Abstract
1. Introduction
2. Results
3. Discussion
4. Materials and Methods
4.1. Animals and Sample Collection
4.2. Sample Preparation
4.3. NMR Data Collection
4.4. Data Analysis
Supplementary Materials
Author Contributions
Funding
Institutional Review Board Statement
Informed Consent Statement
Data Availability Statement
Acknowledgments
Conflicts of Interest
References
- Poole, J. The African elephant. Stud. Elephants 1996, 1–8. [Google Scholar]
- Fritz, H. Long-term field studies of elephants: Understanding the ecology and conservation of a long-lived ecosystem engineer. J. Mammal. 2017, 98, 603–611. [Google Scholar] [CrossRef]
- Evans, L.A.; Adams, W.M. Elephants as actors in the political ecology of human–elephant conflict. Trans. Inst. Br. Geogr. 2018, 43, 630–645. [Google Scholar] [CrossRef]
- Osipova, L.; Okello, M.M.; Njumbi, S.J.; Ngene, S.; Western, D.; Hayward, M.W.; Balkenhol, N. Fencing solves human-wildlife conflict locally but shifts problems elsewhere: A case study using functional connectivity modelling of the African elephant. J. Appl. Ecol. 2018, 55, 2673–2684. [Google Scholar] [CrossRef]
- Ogunjobi, J.A.; Halidu, S.K.; Odebiyi, B.R.; Fxentirimam, I.J. Crop raiding pattern of the African elephant (Loxodonta africana) in farms around Kamuku National Park, Nigeria. Afr. J. Agric. Technol. Environ. 2018, 7, 174–187. [Google Scholar]
- Blackie, I.R.; Sowa, J. Dynamics of social ecology of elephant conservation in Botswana and implications on environmental development. J. Afr. Interdiscip. Stud. 2019, 3, 4–25. [Google Scholar]
- De Sales, A.R.; Anastácio, R.S.S.; Pereira, M.J. The African elephant (Loxodonta africana): Mini-review of an endangered species. Nat. Resour. 2020, 11, 317–350. [Google Scholar]
- Mpakairi, K.S.; Ndaimani, H.; Tagwireyi, P.; Zvidzai, M.; Madiri, T.H. Futuristic climate change scenario predicts a shrinking habitat for the African elephant (Loxodonta africana): Evidence from Hwange National Park, Zimbabwe. Eur. J. Wildl. Res. 2020, 66, 1–10. [Google Scholar] [CrossRef]
- Webber, J.T.; Henley, M.D.; Pretorius, Y.; Somers, M.J.; Ganswindt, A. Changes in African elephant (Loxodonta africana) faecal steroid concentrations post-defaecation. Bothalia-Afr. Biodivers. Conserv. 2018, 48, 1–8. [Google Scholar]
- Oduor, S.; Brown, J.; Macharia, G.M.; Boisseau, N.; Murray, S.; Obade, P. Differing physiological and behavioral responses to anthropogenic factors between resident and non-resident African elephants at Mpala Ranch, Laikipia County, Kenya. PeerJ 2020, 8, e10010. [Google Scholar] [CrossRef]
- Carlin, E.; Teren, G.; Ganswindt, A. Non-invasive assessment of body condition and stress-related fecal glucocorticoid metabolite concentrations in African elephants (Loxodonta africana) roaming in Fynbos vegetation. Animals 2020, 10, 814. [Google Scholar] [CrossRef] [PubMed]
- Ganswindt, A.; Munscher, S.; Henley, M.; Palme, R.; Thompson, P.; Bertschinger, H. Concentrations of faecal glucocorticoid metabolites in physically injured free-ranging African elephants Loxodonta africana. Wildl. Biol. 2010, 16, 323–332. [Google Scholar] [CrossRef]
- Illera, J.-C.; Silvan, G.; Caceres, S.; Carbonell, M.-D.; Gerique, C.; Martinez-Fernandez, L.; Munro, C.; Casares, M. Assessment of ovarian cycles in the African elephant (Loxodonta africana) by measurement of salivary progesterone metabolites. Zoo Biol. 2014, 33, 245–249. [Google Scholar] [CrossRef] [PubMed]
- Steyrer, C.; Miller, M.; Hewlett, J.; Buss, P.; Hooijberg, E.H. Reference intervals for hematology and clinical chemistry for the African elephant (Loxodonta africana). Front. Vet. Sci. 2021, 8, 136. [Google Scholar] [CrossRef]
- Edwards, K.L.; Miller, M.A.; Siegal-Willott, J.; Brown, J.L. Serum health biomarkers in African and Asian elephants: Value ranges and clinical values indicative of the immune response. Animals 2020, 10, 1756. [Google Scholar] [CrossRef]
- Nagana Gowda, G.A.; Raftery, D. Analysis of plasma, serum, and whole blood metabolites using 1H NMR spectroscopy. In NMR-Based Metabolomics. Methods in Molecular Biology; Gowda, G., Raftery, D., Eds.; Humana: New York, NY, USA, 2019; p. 2037. [Google Scholar]
- Peng, J.-B.; Jia, H.-M.; Xu, T.; Liu, Y.-T.; Zhang, H.-W.; Yu, L.-L.; Cai, D.-Y.; Zou, Z.-M. A 1H NMR based metabonomics approach to progression of coronary atherosclerosis in a rabbit model. Process Biochem. 2011, 46, 2240–2247. [Google Scholar] [CrossRef]
- Hooper, L.V.; Bry, L.; Falk, P.G.; Gordon, J.I. Host-microbial symbiosis in the mammalian intestine: Exploring an internal ecosystem. Bioessays 1998, 20, 336–343. [Google Scholar] [CrossRef]
- Saric, J.; Wang, Y.; Li, J.; Coen, M.; Utzinger, J.; Marchesi, J.R.; Keiser, J.; Veselkov, K.; Lindon, J.C.; Nicholson, J.K.; et al. Species variation in the fecal metabolome gives insight into differential gastrointestinal function. J. Proteome Res. 2008, 7, 352–360. [Google Scholar] [CrossRef]
- Merrifield, C.A.; Lewis, M.; Claus, S.P.; Beckonert, O.P.; Dumas, M.-E.; Duncker, S.; Kochhar, S.; Rezzi, S.; Lindon, J.C.; Bailey, M.; et al. A metabolic system-wide characterization of the pig: A model for human physiology. Mol. Omics 2011, 7, 2577–2588. [Google Scholar]
- He, Q.; Ren, P.; Kong, X.; Wu, Y.; Wu, G.; Li, P.; Hao, F.; Tang, H.; Blachier, F.; Yin, Y. Comparison of serum metabolite compositions between obese and lean growing pigs using an NMR-based metabonomic approach. J. Nutr. Biochem. 2012, 23, 133–139. [Google Scholar] [CrossRef]
- Nagana Gowda, G.A.; Raftery, D. Whole blood metabolomics by 1H NMR spectroscopy provides a new opportunity to evaluate coenzymes and antioxidants. Anal. Chem. 2017, 89, 4620–4627. [Google Scholar] [CrossRef] [PubMed]
- Nicholson, J.K.; Gartland, K.P. 1H NMR studies on protein binding of histidine, tyrosine and phenylalanine in blood plasma. NMR Biomed. 1989, 2, 77–82. [Google Scholar] [CrossRef] [PubMed]
- Beckonert, O.; Keun, H.C.; Ebbels, T.M.; Bundy, J.; Holmes, E.; Lindon, J.C.; Nicholson, J.K. Metabolic profiling, metabolomic and metabonomic procedures for NMR spectroscopy of urine, plasma, serum, and tissue extracts. Nat. Protoc. 2007, 2, 2692–2703. [Google Scholar] [CrossRef]
- Lewis, J.H. Comparative hematology: Studies on elephants, Elephas maximus. Comp. Biochem. Physiol. 1974, 49A, 175–181. [Google Scholar] [CrossRef]
- Gentry, P.A.; Ross, M.L.; Yamada, M. Blood coagulation profile of the Asian elephant (Elephas maximus). Zoo Biol. 1996, 15, 413–423. [Google Scholar] [CrossRef]
- Niemuth, J.; Stoskopf, M. Hepatic metabolomic investigation of the North American black bear (Ursus americanus) using 1H-NMR spectroscopy. Wildl. Biol. Pract. 2014, 10, 14–23. [Google Scholar] [CrossRef][Green Version]
- Wood, J.; Koutsos, E.; Kendall, C.J.; Minter, L.J.; Tollefson, T.N.; van Heugten, K.A. Analyses of African elephant (Loxodonta africana) diet with various browse and pellet inclusion levels. Zoo Biol. 2020, 39, 37–50. [Google Scholar] [CrossRef]


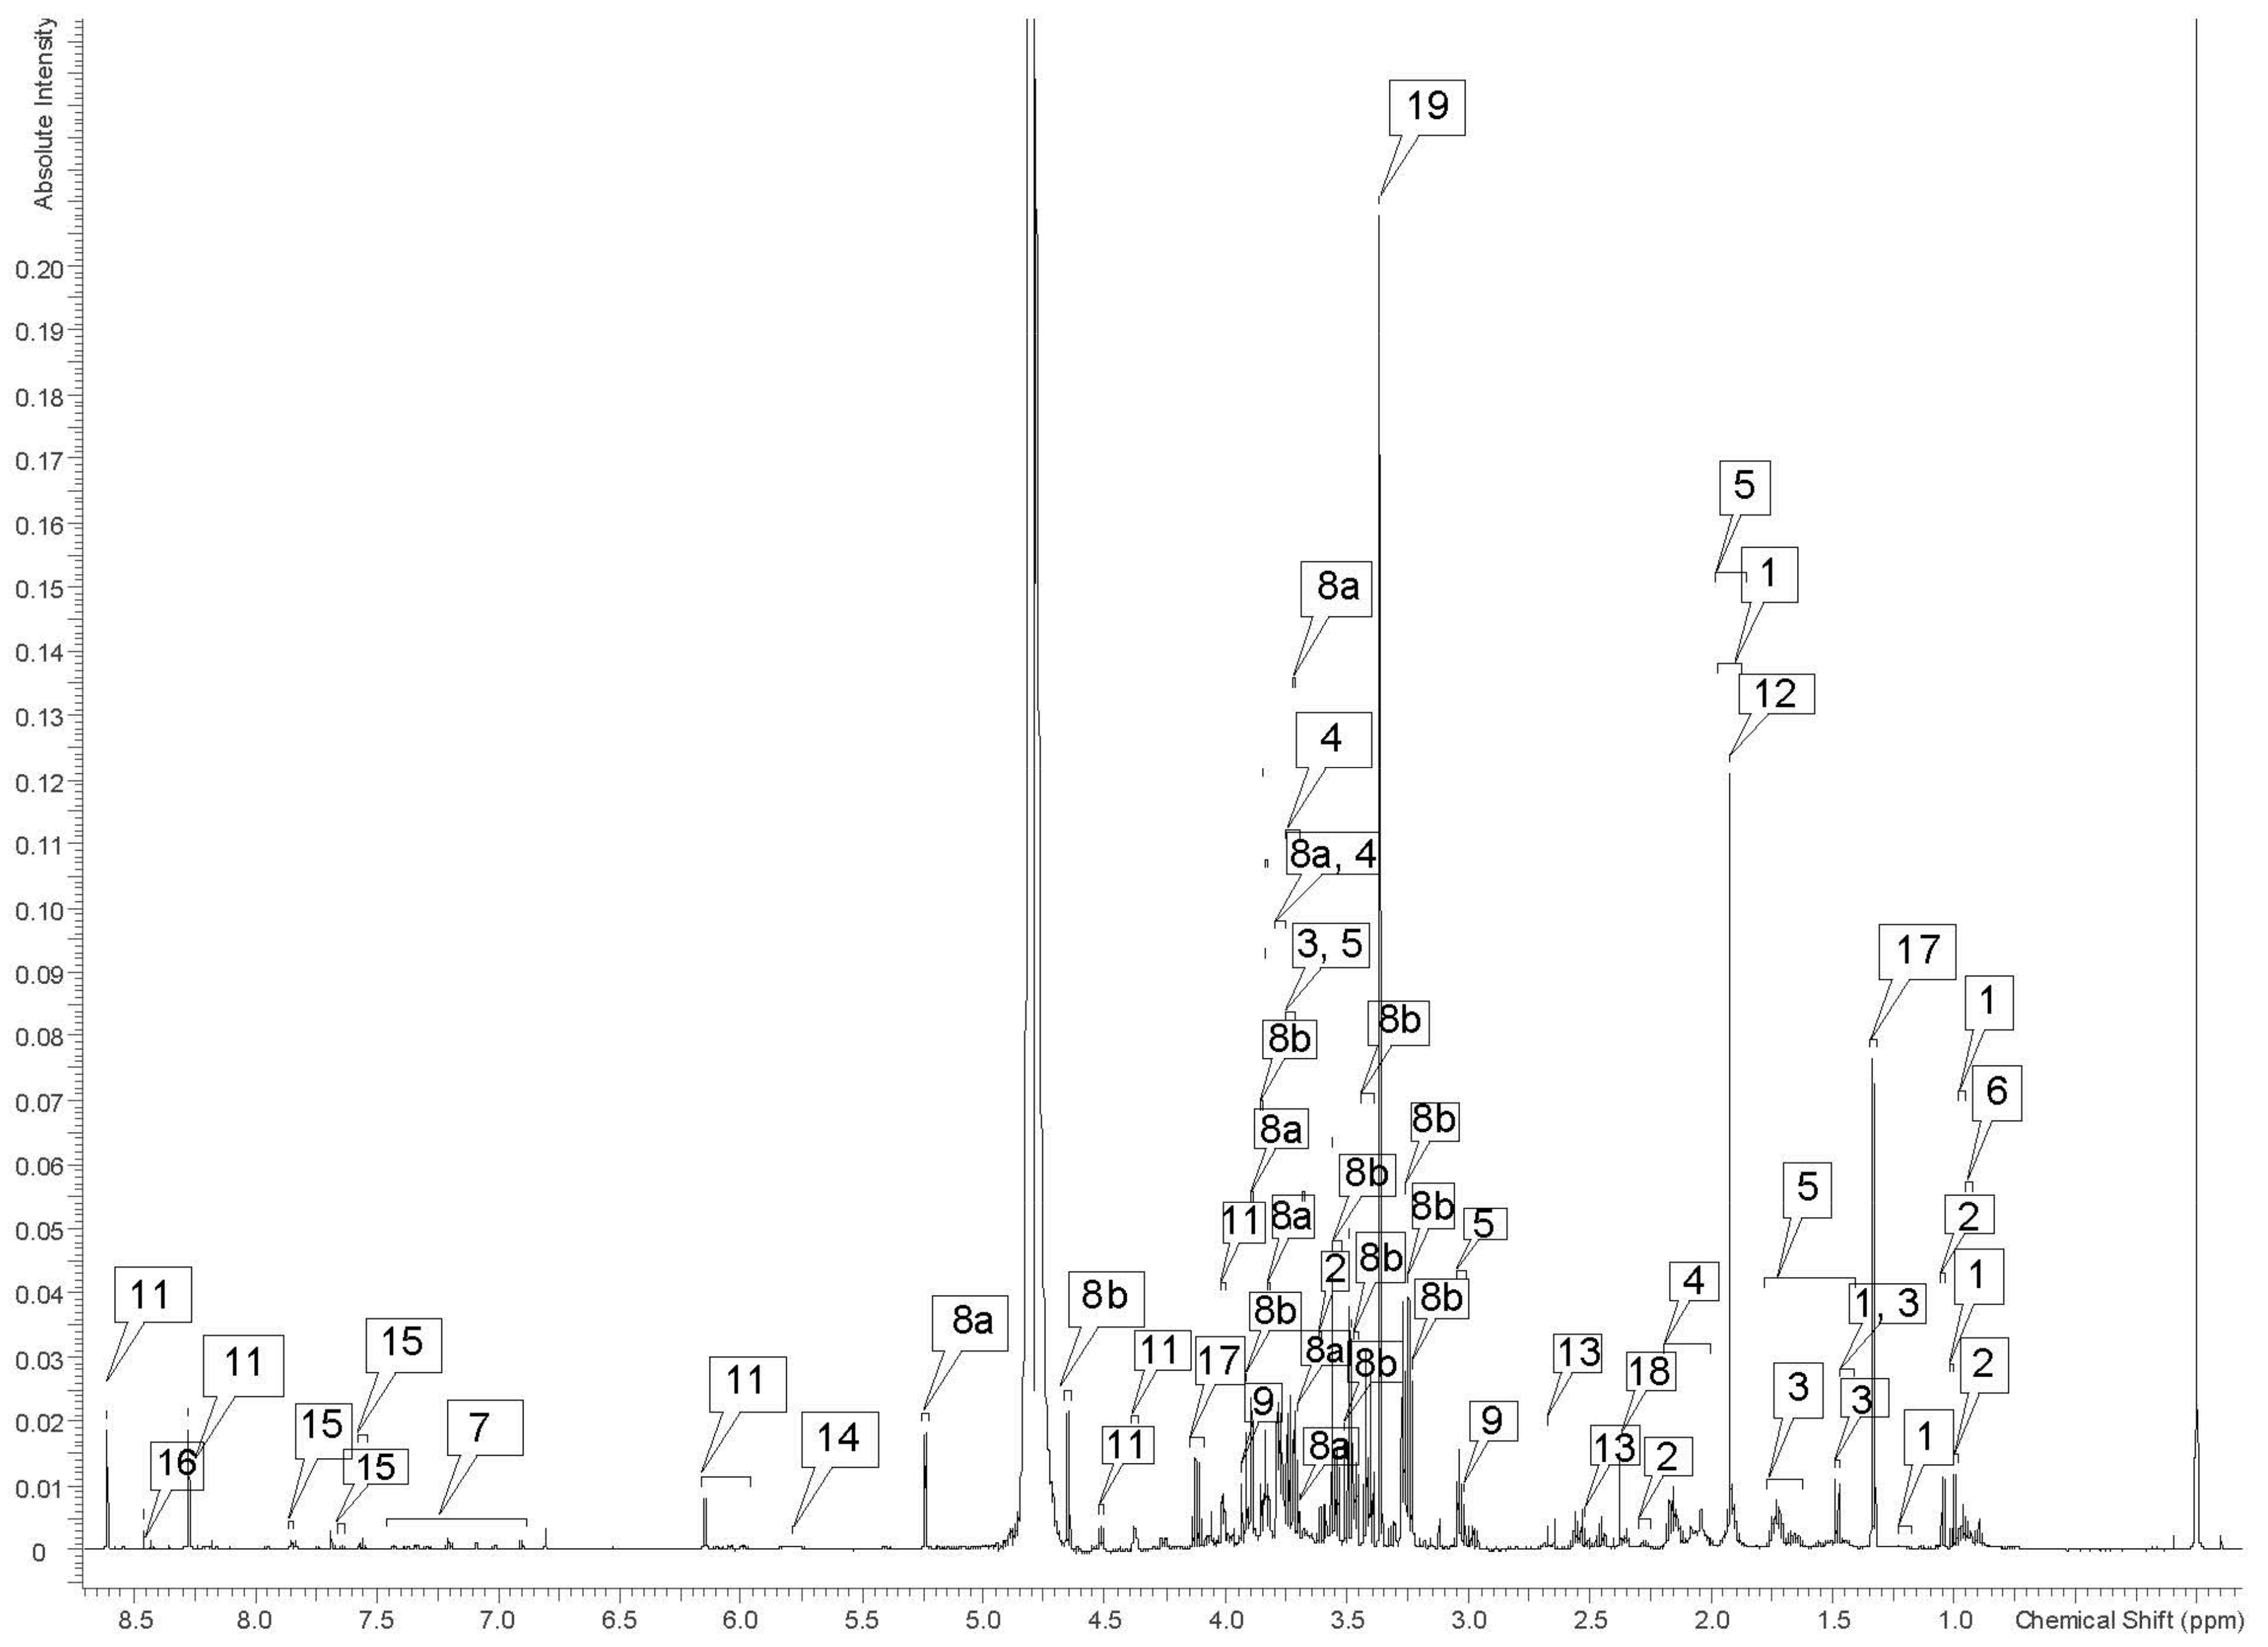
| Label on Figure 1 | Metabolite | 1H Chemical Shifts (ppm) |
|---|---|---|
| Amino Acids | ||
| 1 | Isoleucine | 0.95 (t), 1.01 (d), 1.46 (u), 1.95 (u), 3.68 (u) |
| 2 | Valine | 0.99 (d), 1.05 (d), 2.27 (u), 3.61 (d) |
| 3 | Alanine | 1.47 (d, u), 3.79 (u) |
| 4 | Leucine | 0.96 (d), 1.71 (s), 3.74 (u) |
| 5 | Lysine | 1.45 (u), 1.50 (u), 1,72 (u), 1.93 (u), 3.03 (u), 3.73 (u) |
| 6 | Glycine | 3.56 (s) |
| 7 | Tyrosine | 6.90 (d), 7.20 (t, d) |
| Energy Compounds | ||
| 8α | α-glucose | 3.70 (s), 3.71 (s), 3.73 (s), 3.74 (s), 3.75 (s), 3.78 (u), 3.82 (d), 3.84 (s), 3.89 (d), 5.24 (d) |
| 8β | β-glucose | 3.24 (s), 3.25 (s), 3.27 (s), 3.42 (m), 3.47 (m), 3.48 (s), 3.50 (s), 3.51 (s), 3.54 (dd), 3.85 (s), 3.86 (d), 3.91 (d), 4.65 (d) |
| 9 | Creatine | 3.02 (s), 3.93 (s) |
| 10 | Creatinine | 3.03 (s), 4.06 (s) |
| 11 | Adenosine triphosphate | 4.02 (dd), 4.37 (u), 4.51 (dd), 6.15 (d, d, u), 8.27 (s), 8.61 (s) |
| Organic Acids | ||
| 12 | Acetate | 1.92 (s) |
| 13 | Citrate | 2.55 (d), 2.66 (d) |
| 14 | Urea | 5.79 (broad) |
| 15 | Benzoate | 7.56 (t), 7.64 (t), 7.85 (d) |
| 16 | Formate | 8.46 (s) |
| 17 | Lactate | 1.33 (d), 4.12 (q) |
| 18 | Succinate | 2.38 (s) |
| Other | ||
| 19 | Methanol (residual) | 3.36 (s) |
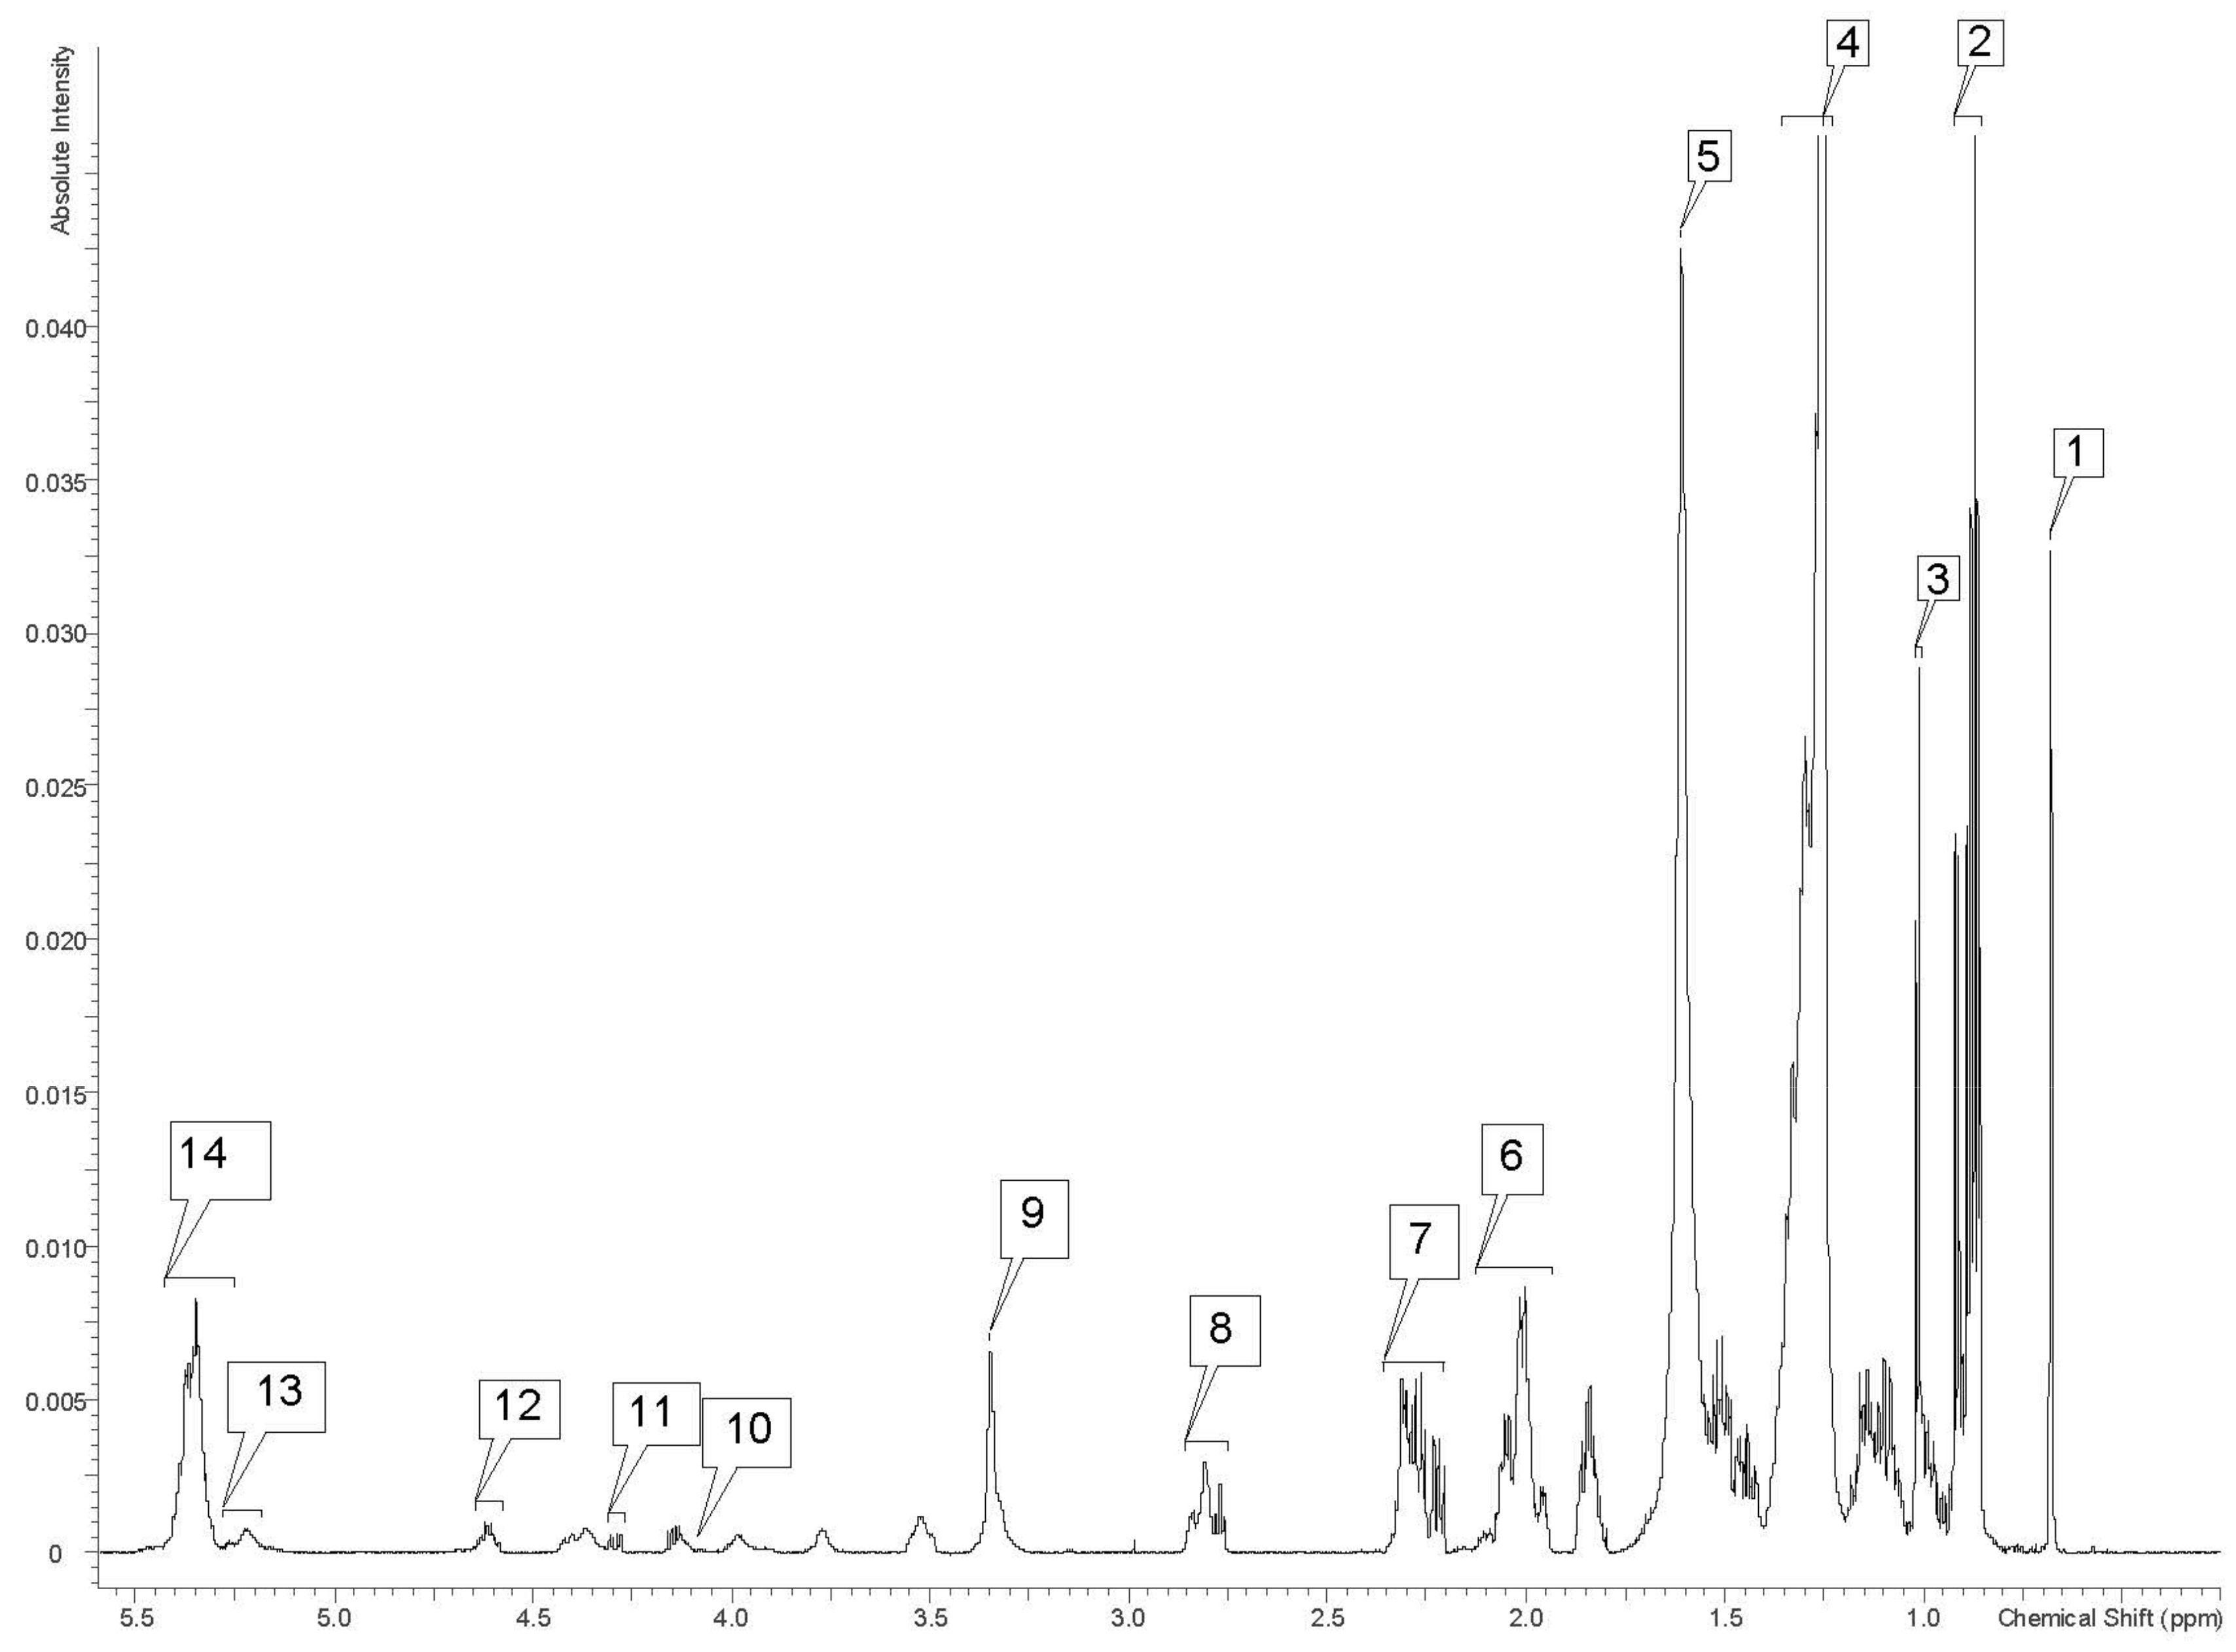
| Label on Figure 3 | Lipid Metabolite Fraction | 1H Chemical Shifts (ppm) |
|---|---|---|
| 1 | Cholesterol -CH3 C18 | 0.68 |
| 2 | -CH3 (saturates, monosaturates w-9 and/or w-7, unsaturates w-6 acyl groups) | 0.86–0.92 |
| 3 | C19 -CH3 in free cholesterol | 1.00–1.02 |
| 4 | -(CH2)n fatty acyl group | 1.23–1.36 |
| 5 | -CO-CH2CH2 in fatty acyl chain | 1.61 |
| 6 | -CH2-CH=CH- (acyl group except for -CH2- of doxosahexaenoic acid (DHA) in β position related to carbonyl group) -CH2HC= in fatty acid acyl chain: 18:1, 18:2/20:4 | 1.94–2.13 |
| 7 | -OCO-CH2- (acyl group except for DHA acyl group) -CO-CH2- in fatty acyl chain | 2.20–2.35 |
| 8 | -CHCH2CH= in fatty acyl chain: 18:2, 20:4/22:6 | 2.75–2.86 |
| 9 | -N(CH3)3 (phosphatidylcholine) | 3.35 |
| 10 | >C1H2/C2H2 in glycerol backbone of triglyceride (TG) and phospholipids (PL) | 4.12–4.17 |
| 11 | >C1H2/C3H2 in glycerol backbone of TG | 4.27–4.31 |
| 12 | −3CH esterified cholesterol | 4.58–4.65 |
| 13 | -CHOCOR (glycerol group) -C2H in glycerol backbone of PL and TG | 5.19–5.2 |
| 14 | -CH=CH- in fatty acyl chain | 5.25–5.43 |
| Browse Species | Relative Frequency Fed (per 100 Feedings) |
|---|---|
| Sweet Gum (Liquidambar styractiflua) | 100 |
| Wax Myrtle (Morella cerifera) | 83 |
| Mixed sp. Bamboo (Phyllostachys sp.) | 81 |
| Tulip Poplar (Linodendron tulipifera) | 72 |
| Thorny Elaegnus (Elaeagnus pungens) | 70 |
| Arundo (Arundo donax) | 50 |
| Willow Oak (Quercus phellos) | 46 |
| Pine (Pinus sp.) | 41 |
| Russian Olive (Eleagnus angustifolia) | 36 |
| Mimosa (Albizia julibrissin) | 33 |
| Dogwood (Corus florida) | 26 |
| Sugar Maple (Acer saccharum) | 25 |
| Contorted Mulberry (Morus bornbycis) | 23 |
| Pignut Hickory (Carya glabra) | 20 |
| Grapevine (Vitis sp.) | 20 |
| Chestnut Oak (Quercus montana) | 18 |
Publisher’s Note: MDPI stays neutral with regard to jurisdictional claims in published maps and institutional affiliations. |
© 2022 by the authors. Licensee MDPI, Basel, Switzerland. This article is an open access article distributed under the terms and conditions of the Creative Commons Attribution (CC BY) license (https://creativecommons.org/licenses/by/4.0/).
Share and Cite
Wood, J.; Morgan, D.R.; Ange-van Heugten, K.; Serrano, M.; Minter, L.J.; Fellner, V.; Stoskopf, M.K. Observable Metabolites and Metabolomic Sampling Protocols for Managed African Savanna Elephant (Loxodonta africana) Whole Blood Using H-NMR Spectroscopy. Metabolites 2022, 12, 400. https://doi.org/10.3390/metabo12050400
Wood J, Morgan DR, Ange-van Heugten K, Serrano M, Minter LJ, Fellner V, Stoskopf MK. Observable Metabolites and Metabolomic Sampling Protocols for Managed African Savanna Elephant (Loxodonta africana) Whole Blood Using H-NMR Spectroscopy. Metabolites. 2022; 12(5):400. https://doi.org/10.3390/metabo12050400
Chicago/Turabian StyleWood, Jordan, David R. Morgan, Kimberly Ange-van Heugten, Maria Serrano, Larry J. Minter, Vivek Fellner, and Michael K. Stoskopf. 2022. "Observable Metabolites and Metabolomic Sampling Protocols for Managed African Savanna Elephant (Loxodonta africana) Whole Blood Using H-NMR Spectroscopy" Metabolites 12, no. 5: 400. https://doi.org/10.3390/metabo12050400
APA StyleWood, J., Morgan, D. R., Ange-van Heugten, K., Serrano, M., Minter, L. J., Fellner, V., & Stoskopf, M. K. (2022). Observable Metabolites and Metabolomic Sampling Protocols for Managed African Savanna Elephant (Loxodonta africana) Whole Blood Using H-NMR Spectroscopy. Metabolites, 12(5), 400. https://doi.org/10.3390/metabo12050400