Article

Flavin-Containing Monooxygenase 3 (FMO3) Is Critical for Dioxin-Induced Reorganization of the Gut Microbiome and Host Insulin Sensitivity

1
Department of Cardiovascular and Metabolic Sciences, Cleveland Clinic, Lerner Research Institute, Cleveland, OH 44195, USA
2
Center for Microbiome & Human Health, Cleveland Clinic, Lerner Research Institute, Cleveland, OH 44195, USA
3
Department of Molecular Medicine, Case Western Reserve University, Cleveland, OH 44106, USA
4
Department of General Surgery, Cleveland Clinic, Cleveland, OH 44195, USA
5
Institute for Computational Biology, Case Western Reserve University, Cleveland, OH 44106, USA
6
Microbial Sequencing & Analytics Core Facility, Cleveland Clinic, Lerner Research Institute, Cleveland, OH 44195, USA
*
Author to whom correspondence should be addressed.
Metabolites 2022, 12(4), 364; https://doi.org/10.3390/metabo12040364
Submission received: 1 March 2022 / Revised: 18 March 2022 / Accepted: 7 April 2022 / Published: 18 April 2022

Abstract

:
Exposure to some environmental pollutants can have potent endocrine-disrupting effects, thereby promoting hormone imbalance and cardiometabolic diseases such as non-alcoholic fatty liver disease (NAFLD), diabetes, and cardiorenal diseases. Recent evidence also suggests that many environmental pollutants can reorganize the gut microbiome to potentially impact these diverse human diseases. 2,3,7,8-Tetrachlorodibenzo-p-dioxin (TCDD) is among the most potent endocrine-disrupting dioxin pollutants, yet our understanding of how TCDD impacts the gut microbiome and systemic metabolism is incompletely understood. Here, we show that TCDD exposure in mice profoundly stimulates the hepatic expression of flavin-containing monooxygenase 3 (Fmo3), which is a hepatic xenobiotic metabolizing enzyme that is also responsible for the production of the gut microbiome-associated metabolite trimethylamine N-oxide (TMAO). Interestingly, an enzymatic product of FMO3 (TMAO) has been associated with the same cardiometabolic diseases that these environmental pollutants promote. Therefore, here, we examined TCDD-induced alterations in the gut microbiome, host liver transcriptome, and glucose tolerance in Fmo3+/+ and Fmo3−/− mice. Our results show that Fmo3 is a critical component of the transcriptional response to TCDD, impacting the gut microbiome, host liver transcriptome, and systemic glucose tolerance. Collectively, this work uncovers a previously underappreciated role for Fmo3 in integrating diet–pollutant–microbe–host interactions.

1. Introduction

Continuous technological advancement since the industrial revolution has brought an overall improved quality of life for modern society. However, many industrial processes often have unintended environmental consequences that negatively impact human health. Epidemiological and experimental studies of known environmental pollutants can play causal roles in various diseases including obesity and diabetes [1,2,3,4], atherosclerosis [5,6], diverse cancers [7,8,9,10], and kidney disease [11,12,13]. Many environmental pollutants can accumulate in biological systems due to inefficient turnover or breakdown of these synthetic chemicals. Upon extended exposure, environmental pollutants are sensed by diverse mammalian receptors that coordinate programs of drug detoxification or excretion. Many environmental pollutants can activate the aryl hydrocarbon receptor (AhR), which is a xenobiotic-sensing nuclear hormone receptor that initiates transcriptional programs involved in epithelial barrier function, drug detoxification, and systemic metabolic control [14,15]. The most well-known AhR response genes encode cytochrome P450 enzymes, Cyp1a1, Cyp1a2, and Cyp1b1. These enzymes are heme-dependent monooxygenases that participate in phase I xenobiotic metabolism, making hydrophobic compounds more soluble or better able to be conjugated by phase II metabolic processes for excretion [16]. The dioxin pollutant 2,3,7,8-Tetrachlorodibenzo-p-dioxin (TCDD) is among the most potent AhR ligand known and has been shown to bioaccumulate and exhibit endocrine-disrupting properties. In fact, TCDD-mediated activation of AhR has been linked to dioxin-driven diseases such as obesity and diabetes [1,2,3,4], atherosclerosis [5,6], diverse cancers [7,8,9,10], and kidney disease [11,12,13]. In the case of TCDD and other polycyclic aromatic hydrocarbons (PAHs), the xenobiotic metabolism process is somewhat futile in that, despite these responses, excretion is limited, and the compounds accumulate in tissue, having a half-life of up to 10 years in humans [9,17].
In addition to the well-characterized enhanced expression of cytochrome P450 enzymes in response to the TCDD–AhR signaling axis, there have been multiple reports demonstrating the transcriptional upregulation of flavin-containing monooxygenase 3 (FMO3) upon dioxin exposure [14,18]. Although FMO3 is generally upregulated upon xenobiotic exposure and plays a role in certain xenobiotic metabolic pathways and protein folding [19], it is also the enzyme responsible for the production of a gut microbe-associated metabolite called trimethylamine N-oxide (TMAO) [20,21,22,23,24]. Much like the potent AhR ligand TCDD, other PAHs such as polychlorinated biphenyl (PCB)126 and PCB77 have been shown to induce FMO3 and secondarily increase plasma TMAO [5,24]. It is interesting to note that similar to environmental pollutant exposure, the expression of FMO3 and its gut microbiome-associated enzymatic product TMAO have been associated with a wide variety of human diseases, including atherosclerosis [20,22,25], diabetes and obesity [20,21,26], kidney disease [27,28,29,30,31], and neurodegenerative disease [32,33,34,35,36]. Given the fact that FMO3 expression can be stimulated by AhR ligands and environmental pollutants [14,18,24], and the fact that the TMAO pathway has also been linked to cardiometabolic disease [20,21,22,23], we hypothesized that FMO3 may contribute to TCDD-mediated toxicity and metabolic reorganization. To investigate this hypothesis, we examined the effects of TCDD on the gut microbiome, host transcriptome, and glucose tolerance in wild-type (Fmo3+/+) or global Fmo3 knockout (Fmo3−/−) mice. Our results demonstrate that TCDD-induced alterations in the gut microbiome, host liver transcriptome, and systemic glucose tolerance are powerfully shaped by the xenobiotic-metabolizing enzyme FMO3.

2. Results

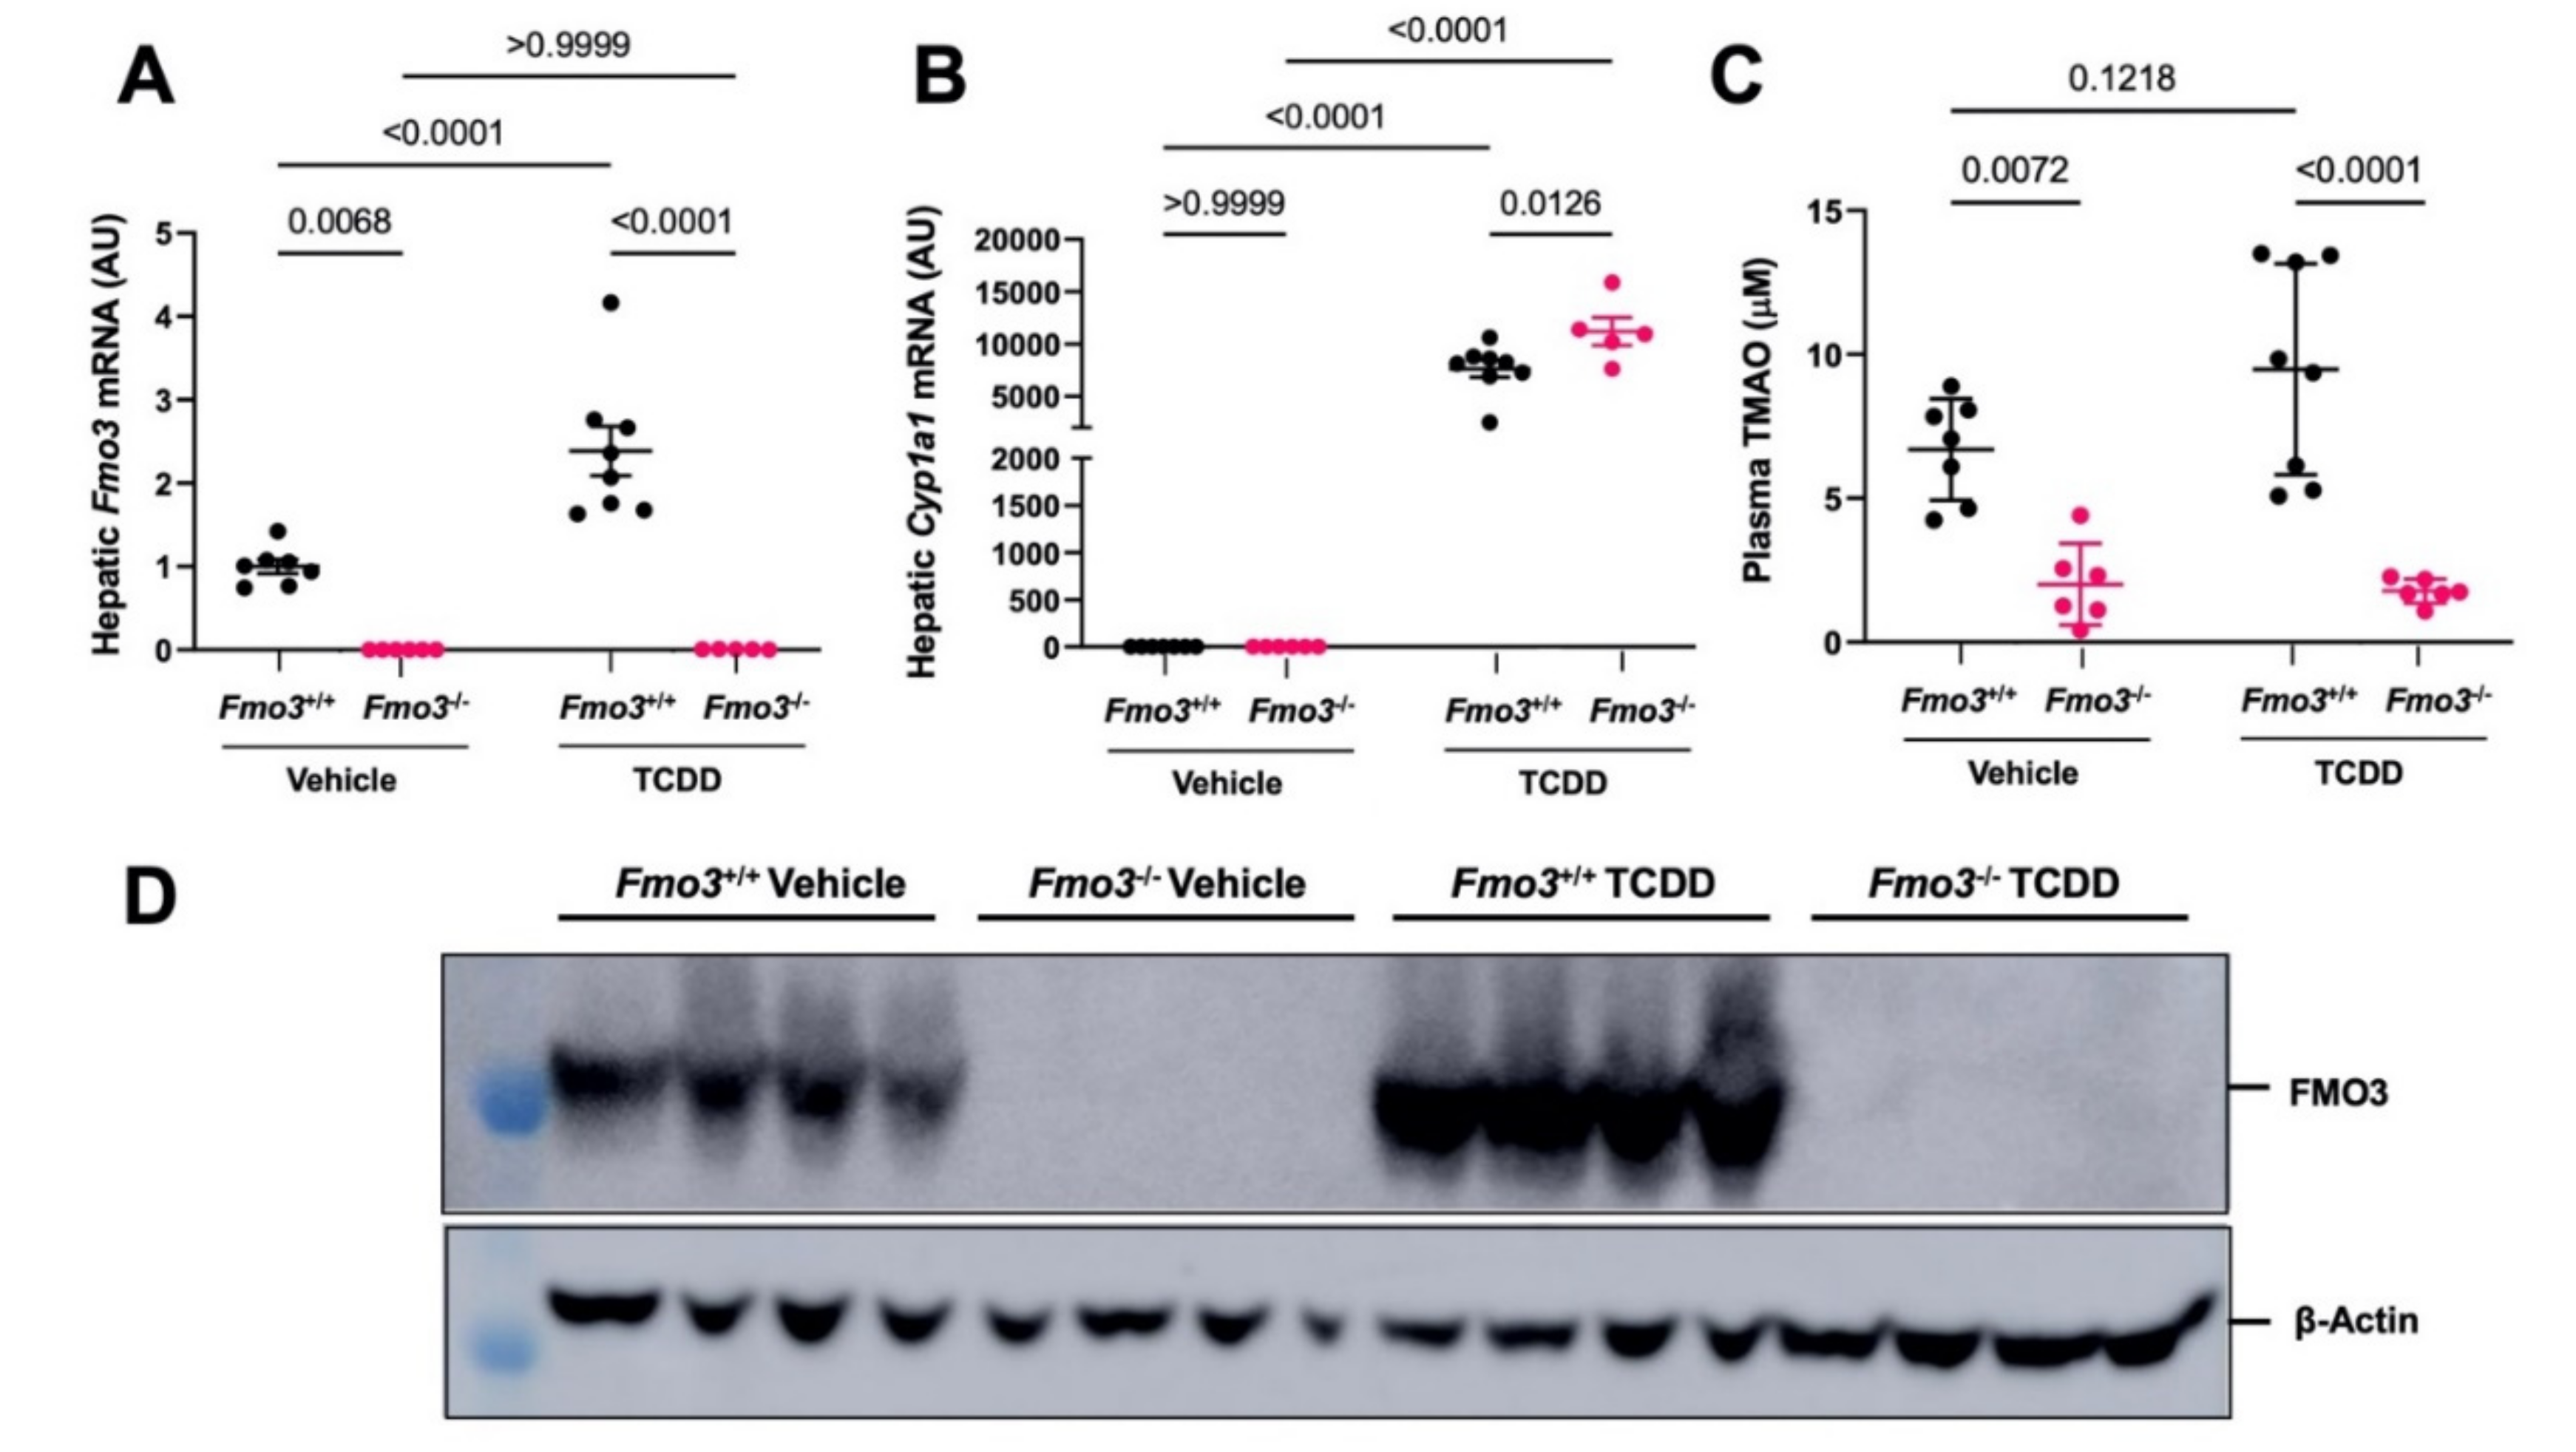
2.1. TCDD Exposure Stimulates the Expression and TMAO-Producing Function of FMO3

It has previously been reported that exposure to dioxin-like pollutants can induce the expression of FMO3 [5,15]. However, it is not known whether FMO3 upregulation is required for the endocrine-disrupting properties of the potent dioxin TCDD. To test this, we first treated male Fmo3 wild-type (Fmo3+/+) or knockout (Fmo3−/−) mice with weekly injections of either corn oil vehicle or TCDD (25 µg/kg) for 6 weeks (Figure 1A). After six weeks, we found that FMO3, which is not usually expressed in male mice during the light cycle [37,38], is strikingly upregulated at the mRNA (p < 0.0001) and protein level by TCDD treatment in wild-type mice (Figure 1B,C). Further, using plasma TMAO as a readout of FMO3 enzymatic activity, we confirmed that plasma TMAO is increased with TCDD treatment in Fmo3+/+ mice (p < 0.0001), and TCDD-induced increases in plasma TMAO are prevented in Fmo3−/− mice (Figure 1D). When we examined the hepatic expression of the well-known AhR target gene Cytochrome P450 family 1 subfamily A member 1 (Cyp1a1), TCDD treatment caused an expected ≈2000-fold induction (p = 0.4697) in Fmo3+/+ mice compared to vehicle-treated mice (Figure 1B). However, TCDD treatment resulted in a ≈4000-fold induction of Cyp1a1 in Fmo3−/− mice (p = 0.0014), which was significantly increased compared to the response in Fmo3+/+ mice (p = 0.0432) (Figure 1B). Collectively, these results demonstrate that the hepatic expression and TMAO-producing function of FMO3 is induced by TCDD exposure, and TCDD-driven increases in hepatic AhR-target gene expression are altered in Fmo3−/− mice (Figure 1).

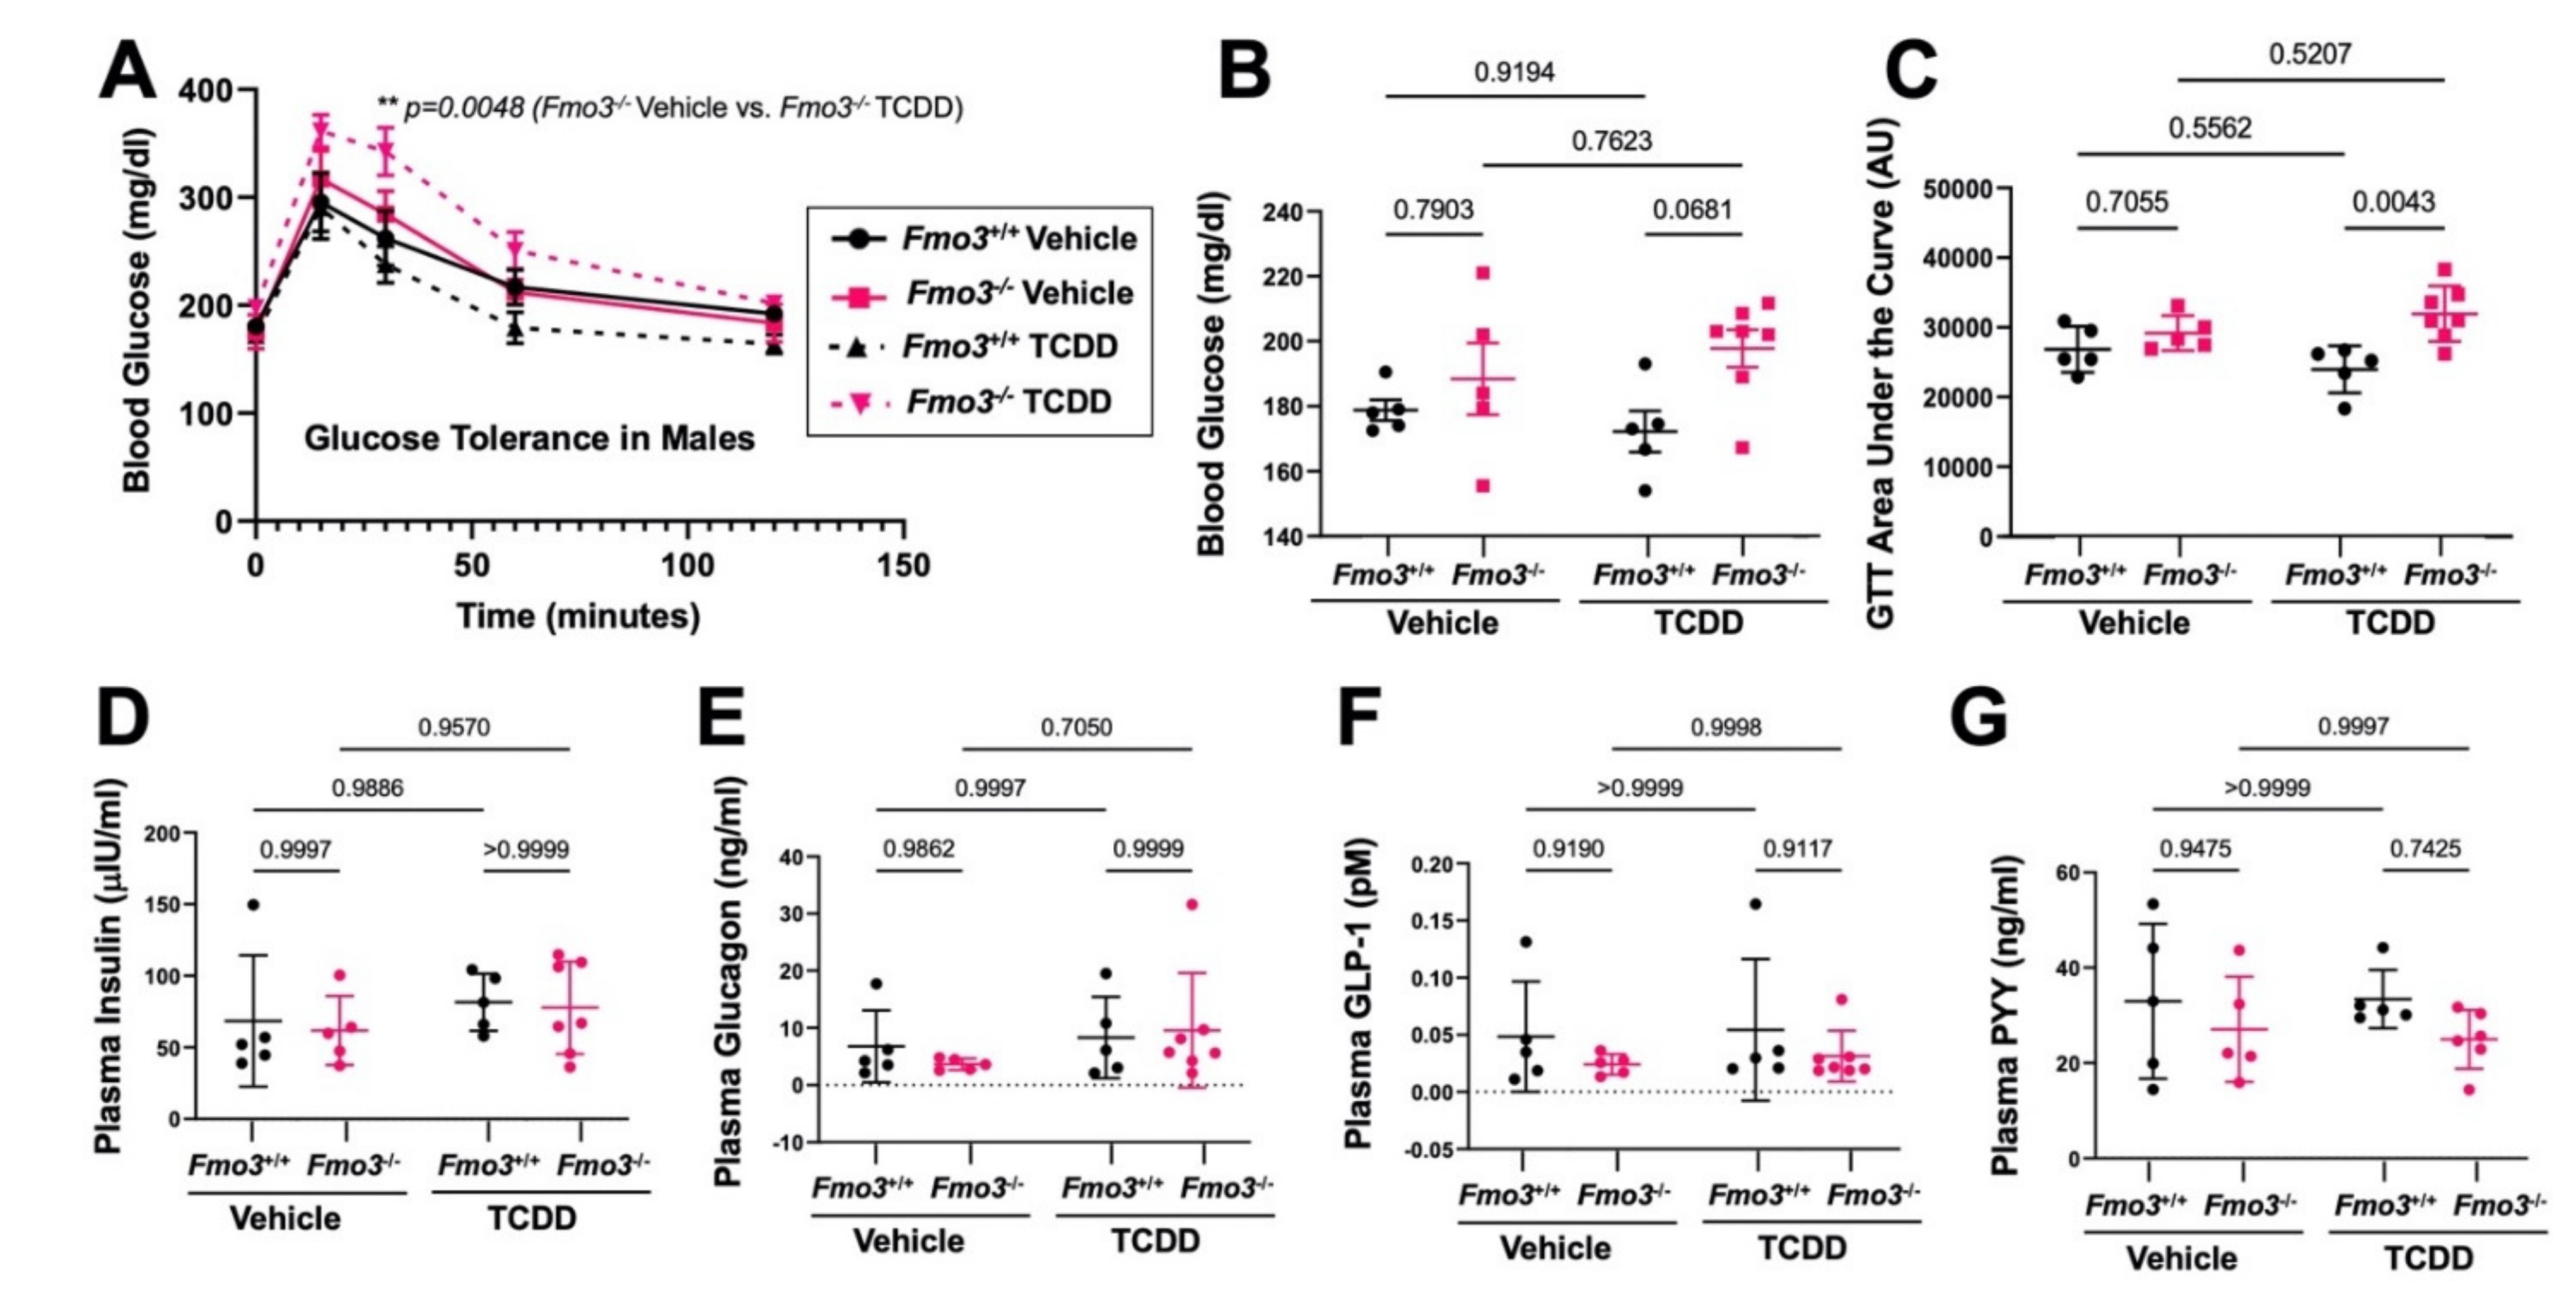
2.2. Genetic Deficiency of Fmo3 Results in Glucose Intolerance in TCDD-Treated Mice

There is an abundance of evidence that exposure to dioxin-like chemicals can result in glucose intolerance and other related metabolic disturbances [1,2,3,4,5]. Given that human epidemiological and rodent studies have demonstrated that both TCDD exposure [1,2,3,4] and alterations in the FMO3–TMAO pathway [20,21,26] are associated with glucose intolerance, we subjected our mice to an intraperitoneal glucose tolerance test (GTT) after 4 weeks of TCDD exposure. Interestingly, we found that TCDD-treated Fmo3−/− mice display clear glucose intolerance compared to TCDD-treated Fmo3+/+ mice (Figure 2A–C). Although fasting blood glucose levels were not significantly different in Fmo3−/− mice in both treatment groups (Figure 2B), the TCDD-treated Fmo3−/− mice have significantly higher blood glucose compared to the TCDD-treated Fmo3+/+ controls at the 30-min time point of GTT (p = 0.0048) (Figure 2A). Similarly, when comparing the area under the curve (AUC) during the GTT, TCDD-treated Fmo3−/− mice had significantly elevated (p = 0.0043) GTT AUC compared to TCDD-treated Fmo3+/+ mice (Figure 2C). Given the well-known endocrine-disrupting properties of dioxins, we next measured plasma hormone levels and found there was no significant differences in insulin, glucagon, glucagon-like peptide 1, or peptide YY at the time of necropsy (Figure 2D–G). Together, these data suggest that the genetic deficiency of Fmo3 does not significantly alter metabolic hormone levels, but when exposed to TCDD, male Fmo3−/− mice exhibit marked glucose intolerance compared to TCDD-treated Fmo3+/+ controls (Figure 2).

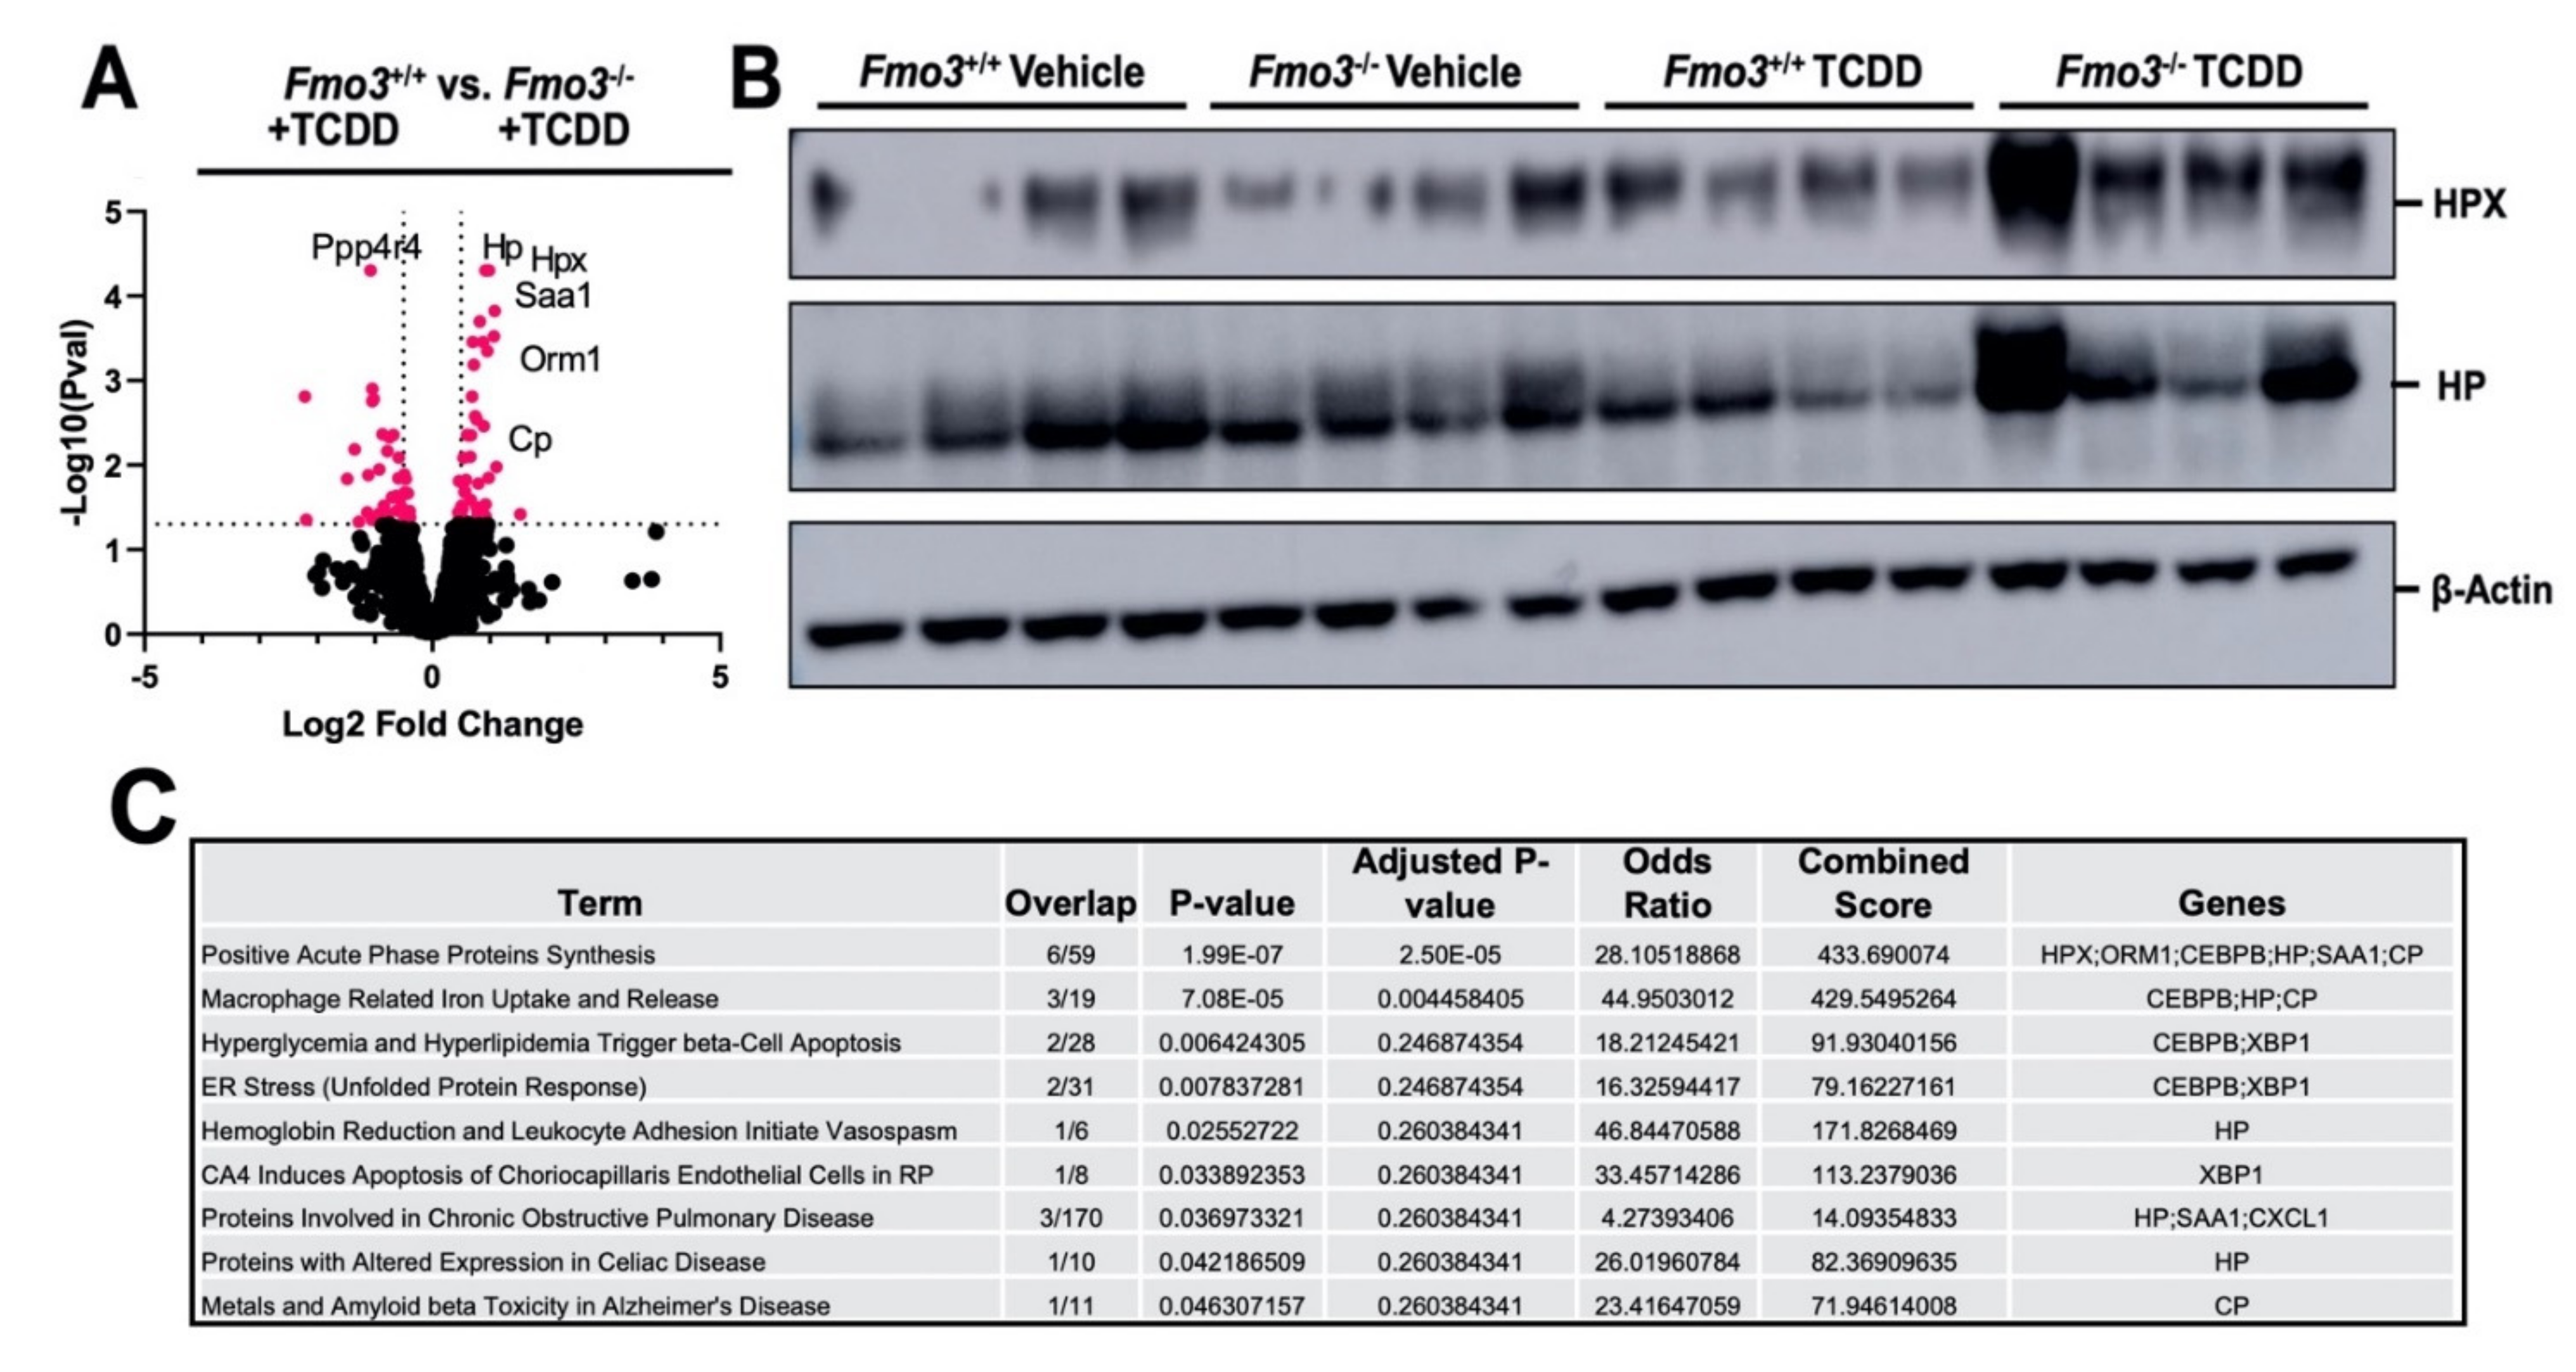
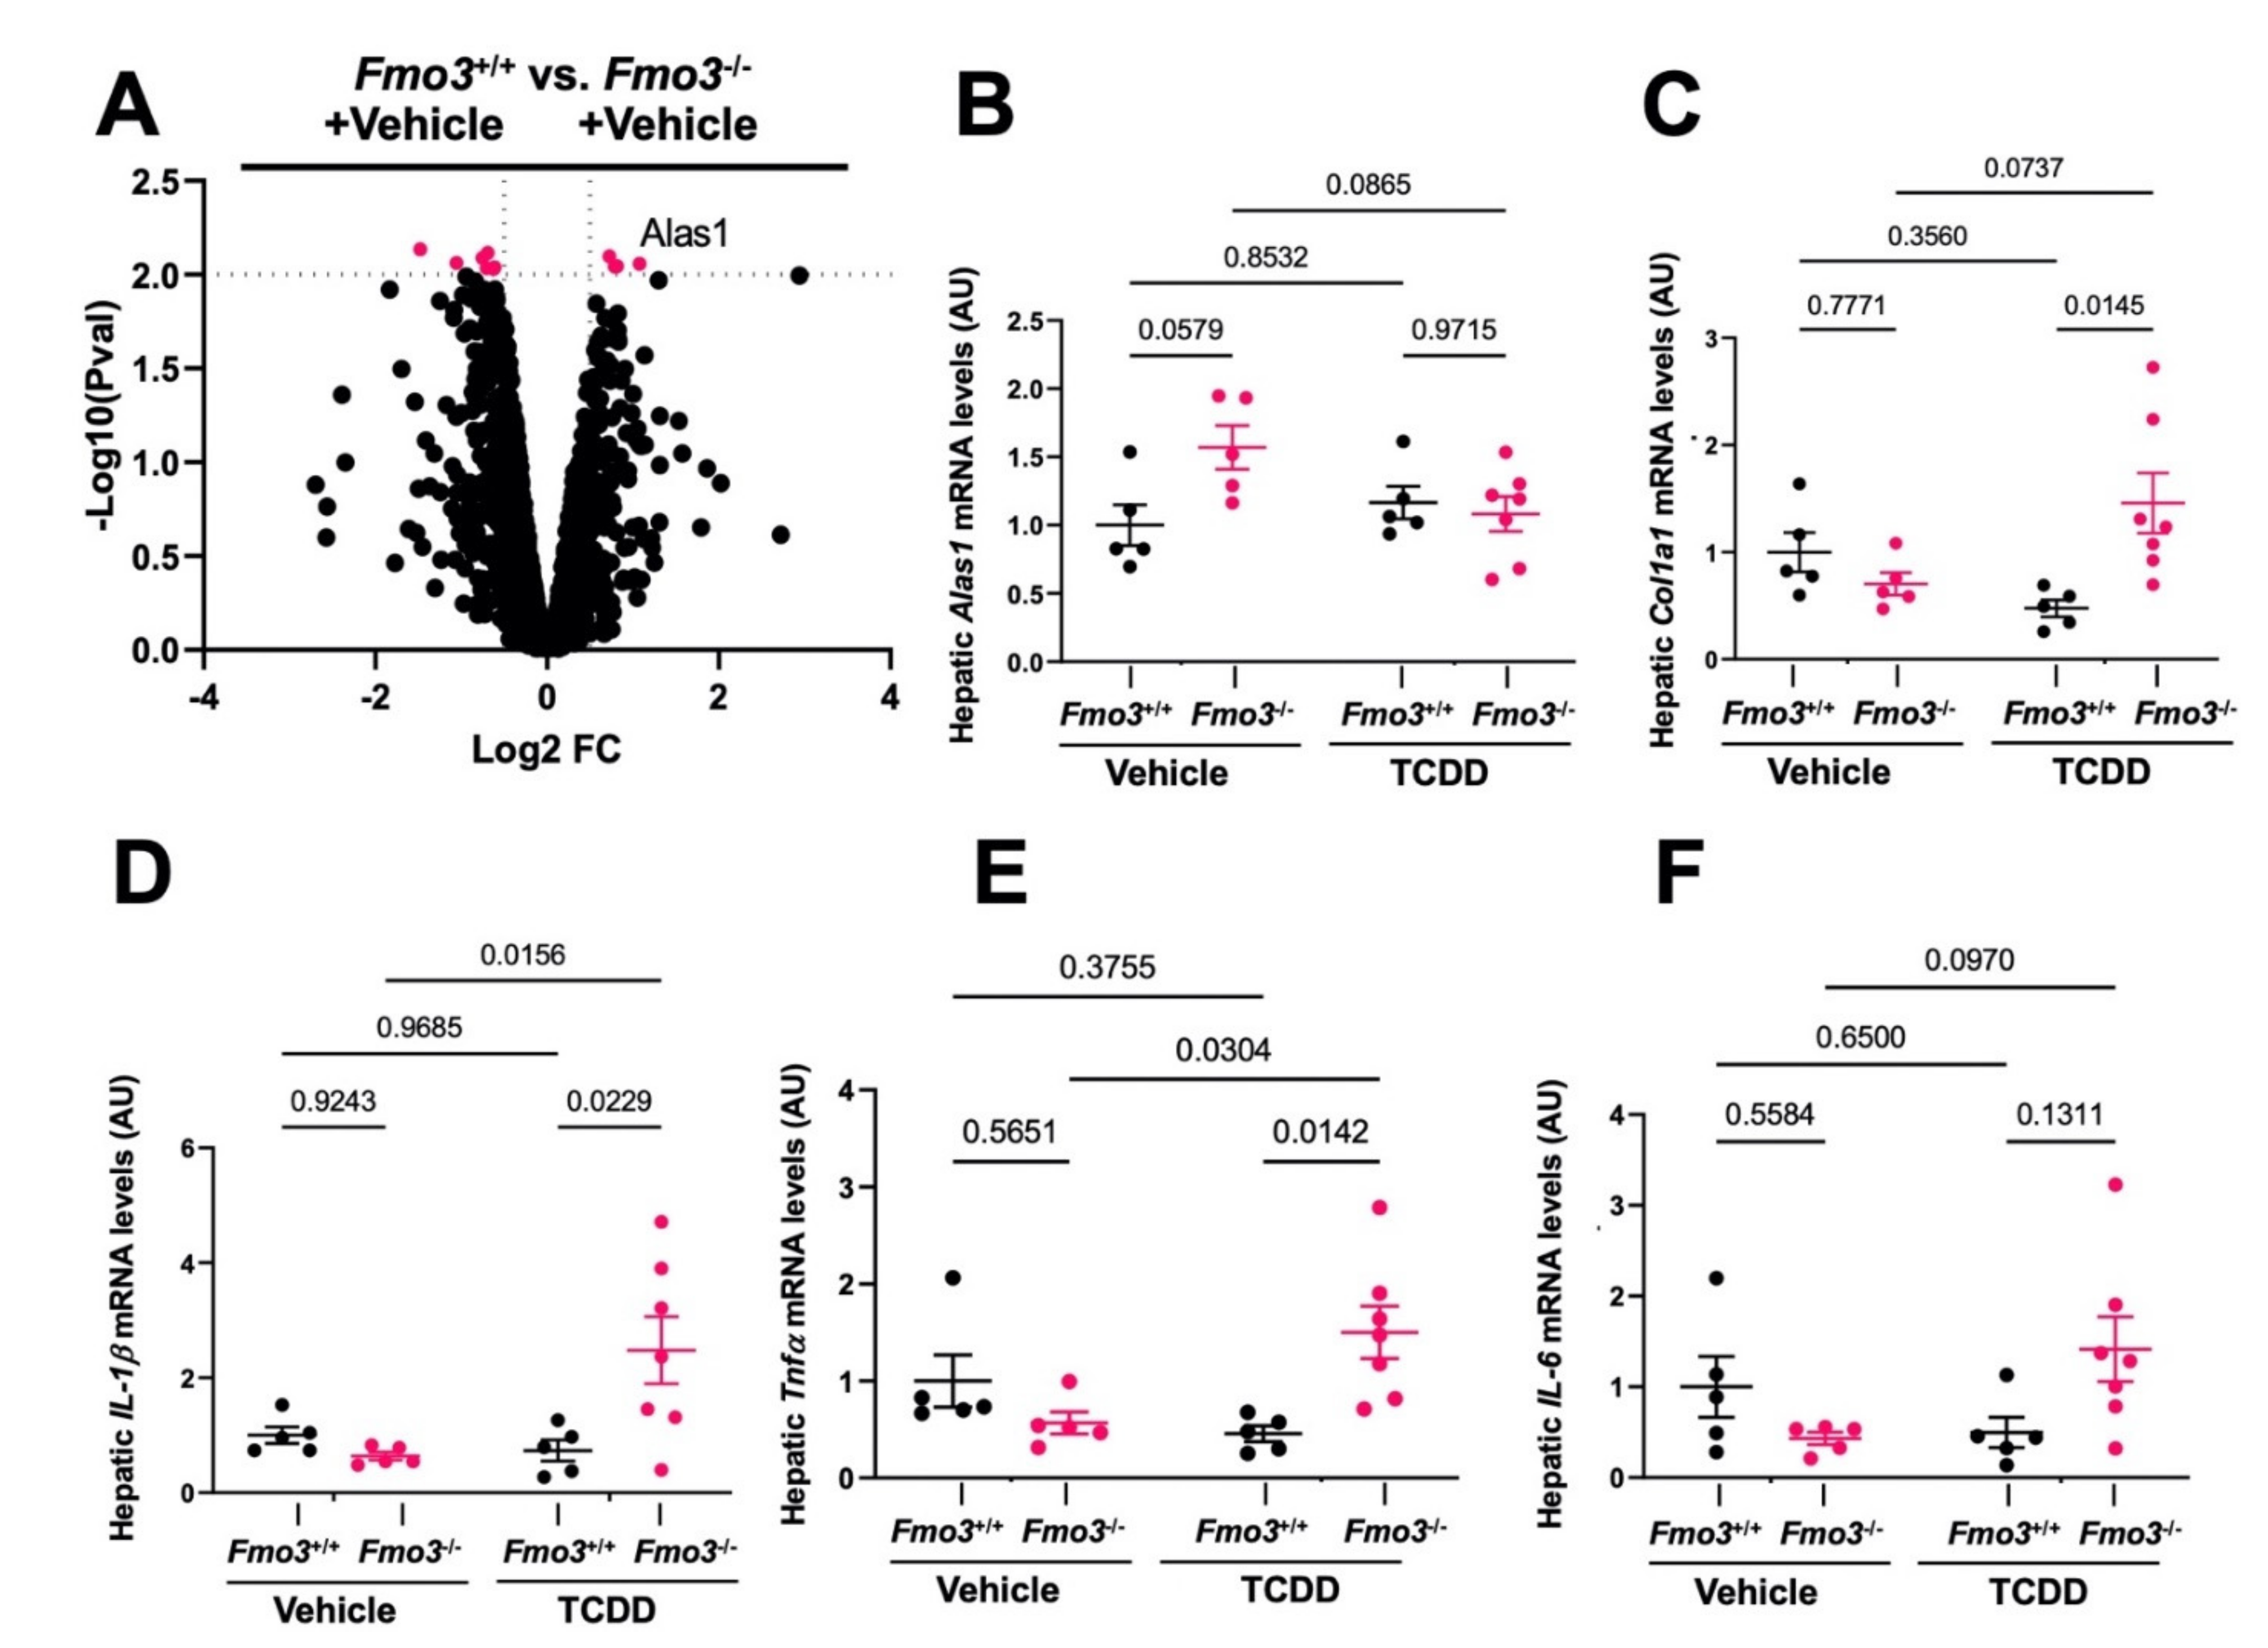
2.3. TCDD-Induced Gene Expression Is Significantly Altered in the Liver of Male Fmo3−/− Mice

TCDD exposure is well known to reorganize AhR target gene expression as well as other pro-inflammatory pathways in the liver to promote glucose intolerance and other related metabolic disturbances [15,39,40,41,42,43]. To better understand how Fmo3 shapes TCDD-induced gene expression in the liver, we performed unbiased bulk RNA sequencing (RNAseq) in TCDD-treated Fmo3+/+ and Fmo3−/− mice (Figure 3). Upon the most differentially expressed genes (DEGs) (available in Supplementary Materials), we found that Fmo3−/− mice exhibited altered heme metabolism and acute phase gene expression versus Fmo3+/+ mice (Figure 3). The heme metabolism genes upregulated in TCDD-treated Fmo3−/− mice were ceruloplasmin (Cp, p = 0.0044), hemopexin (Hpx, p = 5 × 10⁻⁵), and haptoglobin (Hp, p = 5 × 10⁻⁵). Cp is a copper containing oxidase that oxidizes iron and thus is critical for preventing oxidative damage caused by reduced iron [44]. Hp and Hpx are scavengers of hemoglobin and heme, which are also critical in the prevention of iron-related redox stress [45,46]. It is especially intriguing that these heme metabolism genes are upregulated given that the classical AhR taget gene and heme-dependent oxygenase, Cyp1a1, is increased in TCDD-treated Fmo3−/− mice relative to Fmo3+/+ mice (Figure 1B). In addition to these acute phase response genes that regulate heme metabolism, other pro-inflammatory acute phase genes including serum amyloid A 1 (Saa1, p = 1.5 × 10⁻⁴) and orosomucoid 1 (Orm1, p = 4.5 × 10⁻⁴) were upregulated in TCDD-treated Fmo3−/− mice (Figure 3). Saa1 and Orm1 have been implicated in altering metabolic pathways via insulin and leptin receptor signaling, respectively [47,48]. Interestingly, Orm1 also relates to heme metabolism too in that it interacts with the hemoglobin beta chain [49]. In addition to the dysregulation of acute phase heme related pathways, the protein phosphatase 4 regulatory subunit 4, Ppp4r4, was downregulated in TCDD-treated Fmo3−/− mice when compared to TCDD-treated Fmo3+/+ mice (p = 5 × 10⁻⁵). Ppp4r4 has been identified to complex with Protein Phosphatase 4 (PP4) independently of other regulatory subunits [50]. It is interesting to note that PP4 has been implicated in immune signaling and insulin resistance [51,52,53]. Under corn oil vehicle treatment, KO mice displayed slightly increased 5′-aminolevulinate synthase 1 (Alas1) expression (p = 0.0005 (RNAseq), p = 0.0579 (qPCR)) (Figure 4A,B), which was recently found to be required for the AhR-mediated induction of Cyp1a1 by PAHs and is part of the heme biosynthesis pathway [39]. Additionally, TCDD-treated Fmo3−/− mice had elevated expression of pro-inflammatory (TNFα p= 0.0142, IL-1 β (p = 0.0229)) and pro-fibrotic (Col1a1 (p = 0.0145)) genes compared to TCDD-treated Fmo3+/+ mice (Figure 4C–F).

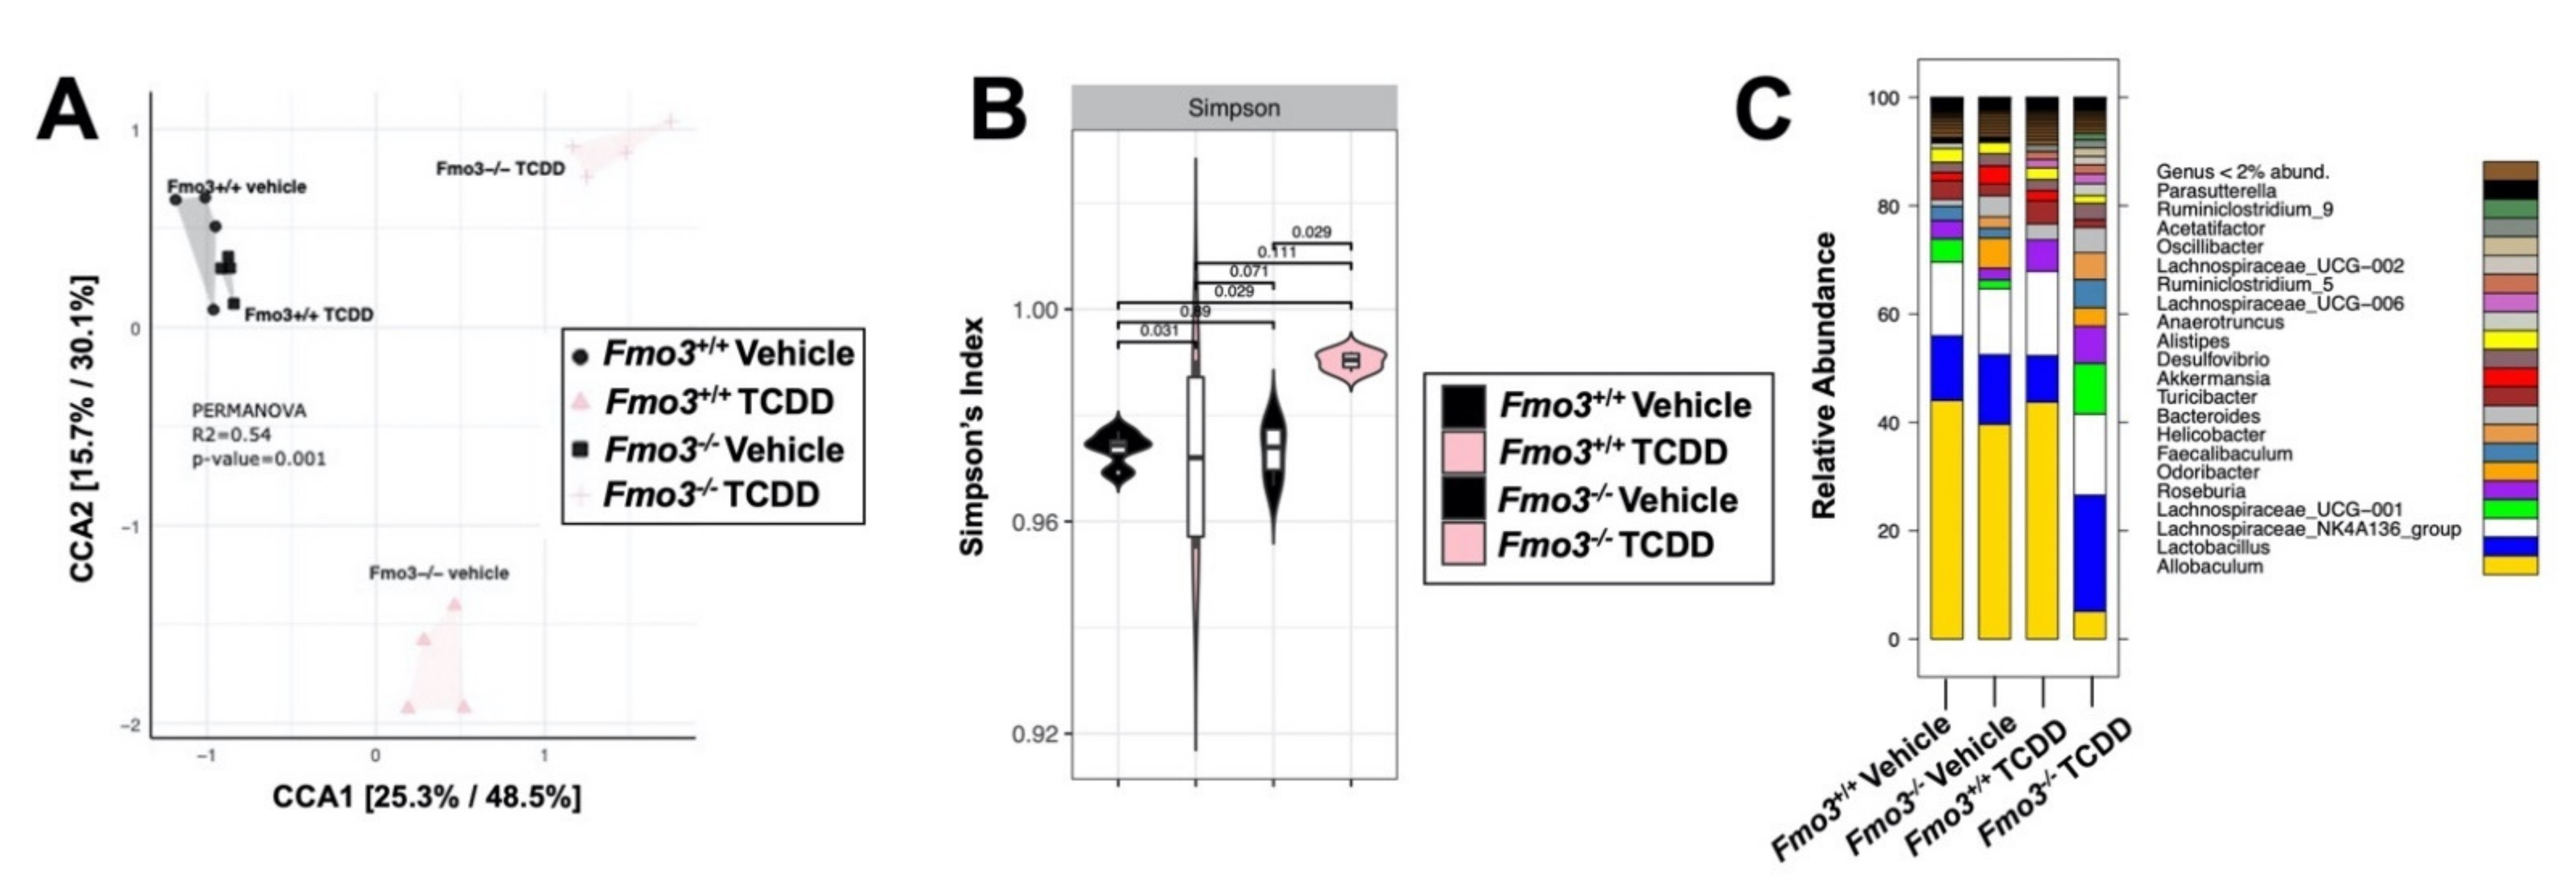
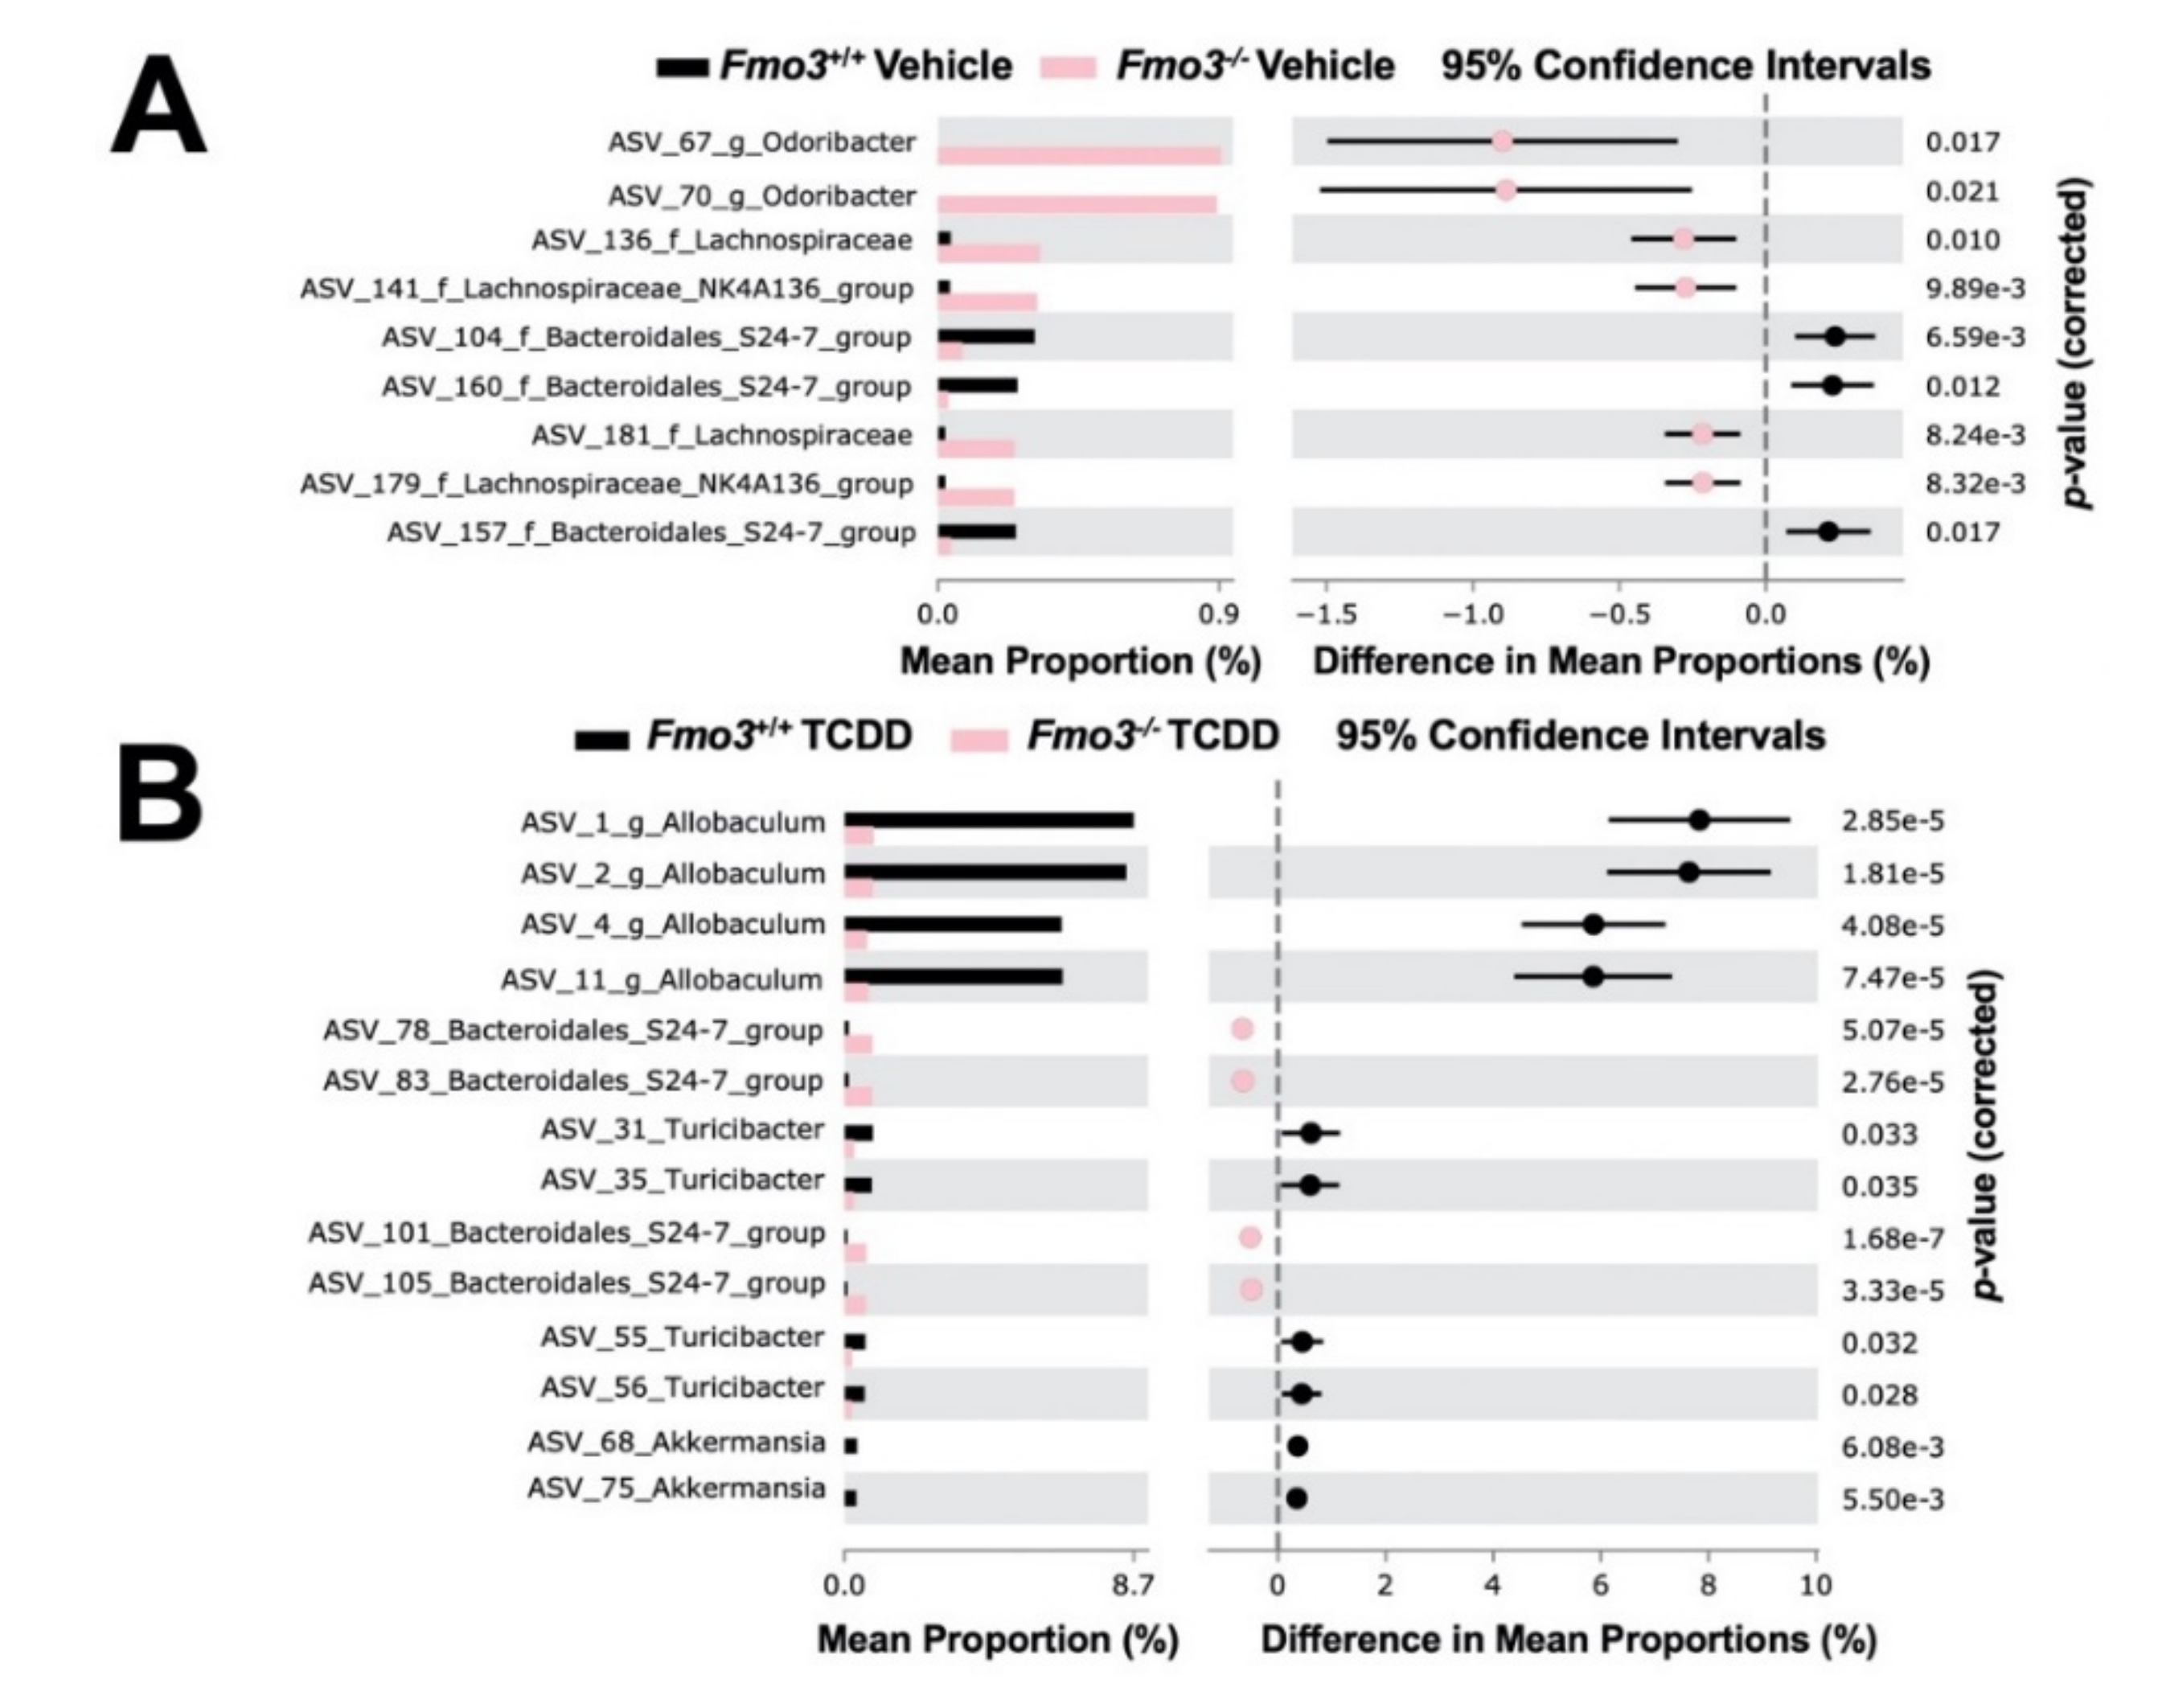
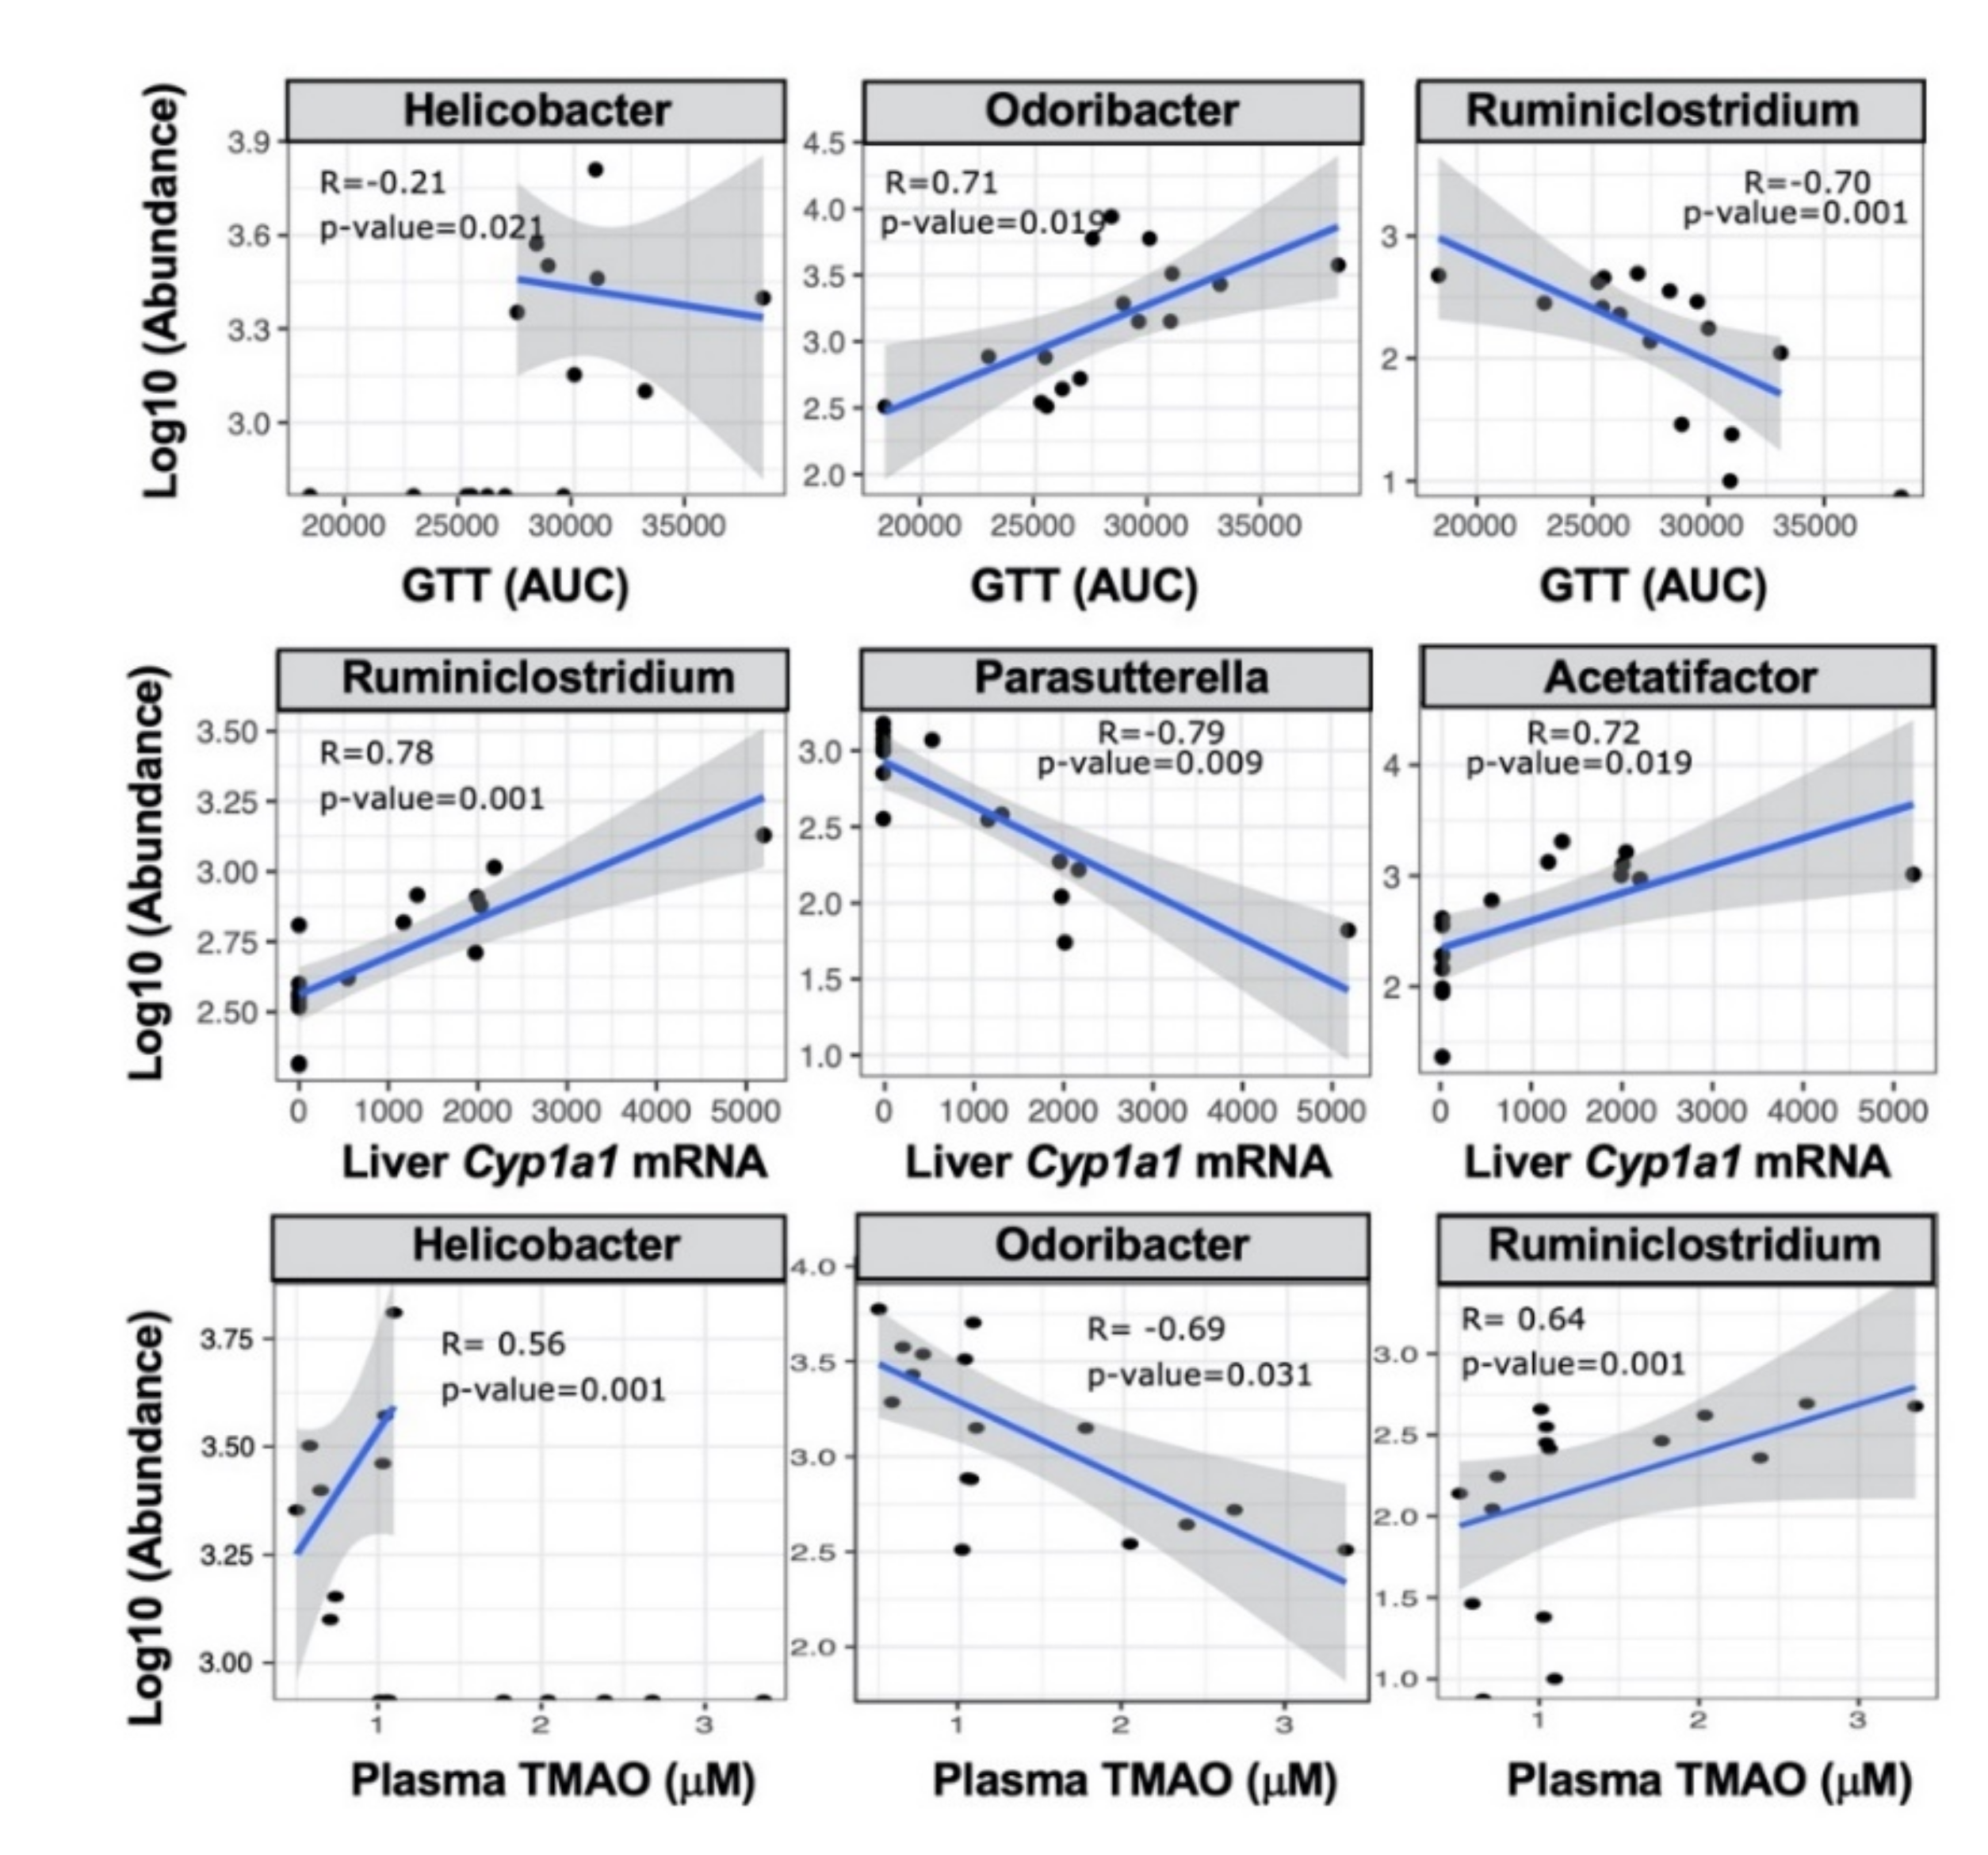
2.4. TCDD-Driven Reorganization of the Gut Microbiome Is Altered in Male Fmo3−/− Mice

Given the reported role of the microbiota in TCDD-induced toxicity and metabolic disturbance [54], we performed 16S rRNA gene sequencing in cecal samples from vehicle and TCDD-treated Fmo3+/+ and Fmo3−/− mice (Figure 5). We analyzed beta diversity by the Bray–Curtis dissimilarity index and observed distinct clusters of both genotype-specific and treatment-specific separations, indicating that there are significant changes in the gut microbial community with changes when comparing Fmo3 alterations driven by both FMO3 and TCDD treatment (Figure 5A). When analyzing alpha diversity by the Shannon index, it becomes apparent there is a significant increase in microbial diversity in the TCDD-treated Fmo3−/− mice specifically (Figure 5B), which has been controversially linked to both improved health [55,56,57] and worsened conditions [58,59]. TCDD-treated Fmo3−/− mice show near complete losses in Akkermansia and Allobaculum (Figure 5C). Of note, Akkermansia and Allobaculum have been reported as protective against glucose intolerance [38,60,61]. When comparing microbiomes in vehicle-treated Fmo3+/+ versus Fmo3−/− mice (Figure 6A), we found that a total of 9 amplicon sequence variants (ASVs) significantly differed in abundance (White’s non-parametric t-test with Benjamini–Hochberg FDR multiple test correction, adjust p ≤ 0.01). ASVs that decreased in abundance in vehicle-treated, Fmo3−/− mice compared to Fmo3+/+ mice were members of the Bacteroidales_S24-7 group, whereas genera that were inceased in Fmo3−/− mice included members of the Odoribacter and Lachnospiraceae groups. When comparing the cecal microbial community in TCDD-treated Fmo3+/+ versus Fmo3−/− mice (Figure 6B), we found that a total of 14 ASVs significantly differed in abundance. ASVs that decreased in the TCDD-treated Fmo3−/− mice compared to Fmo3+/+ mice were members of the genera Allobaculum, Turicibacter, and Akkermansia, whereas genera that were increaed in Fmo3−/− mice included members of Bacteroidales. We next analyzed how the alterations in cecal microbial relative abundance correlated with key phenotypes under investigation here including GTT AUC, liver Cyp1a1 mRNA expression, and plasma TMAO levels (Figure 7). These correlation analyses showed that the relative abundance of Odoribacter and Ruminoclostridium were most significantly correlated with both GTT AUC and plasma TMAO levels. Furthermore, the relative abundance of Ruminoclostridium, Parasutterella, and Acetatifactor were strongly correlated with the hepatic expression of the AhR target gene Cyp1a1 (Figure 7). Collectively, these results demonstrate that the ability of TCDD to shape the microbiome is dramatically altered in Fmo3−/− mice.

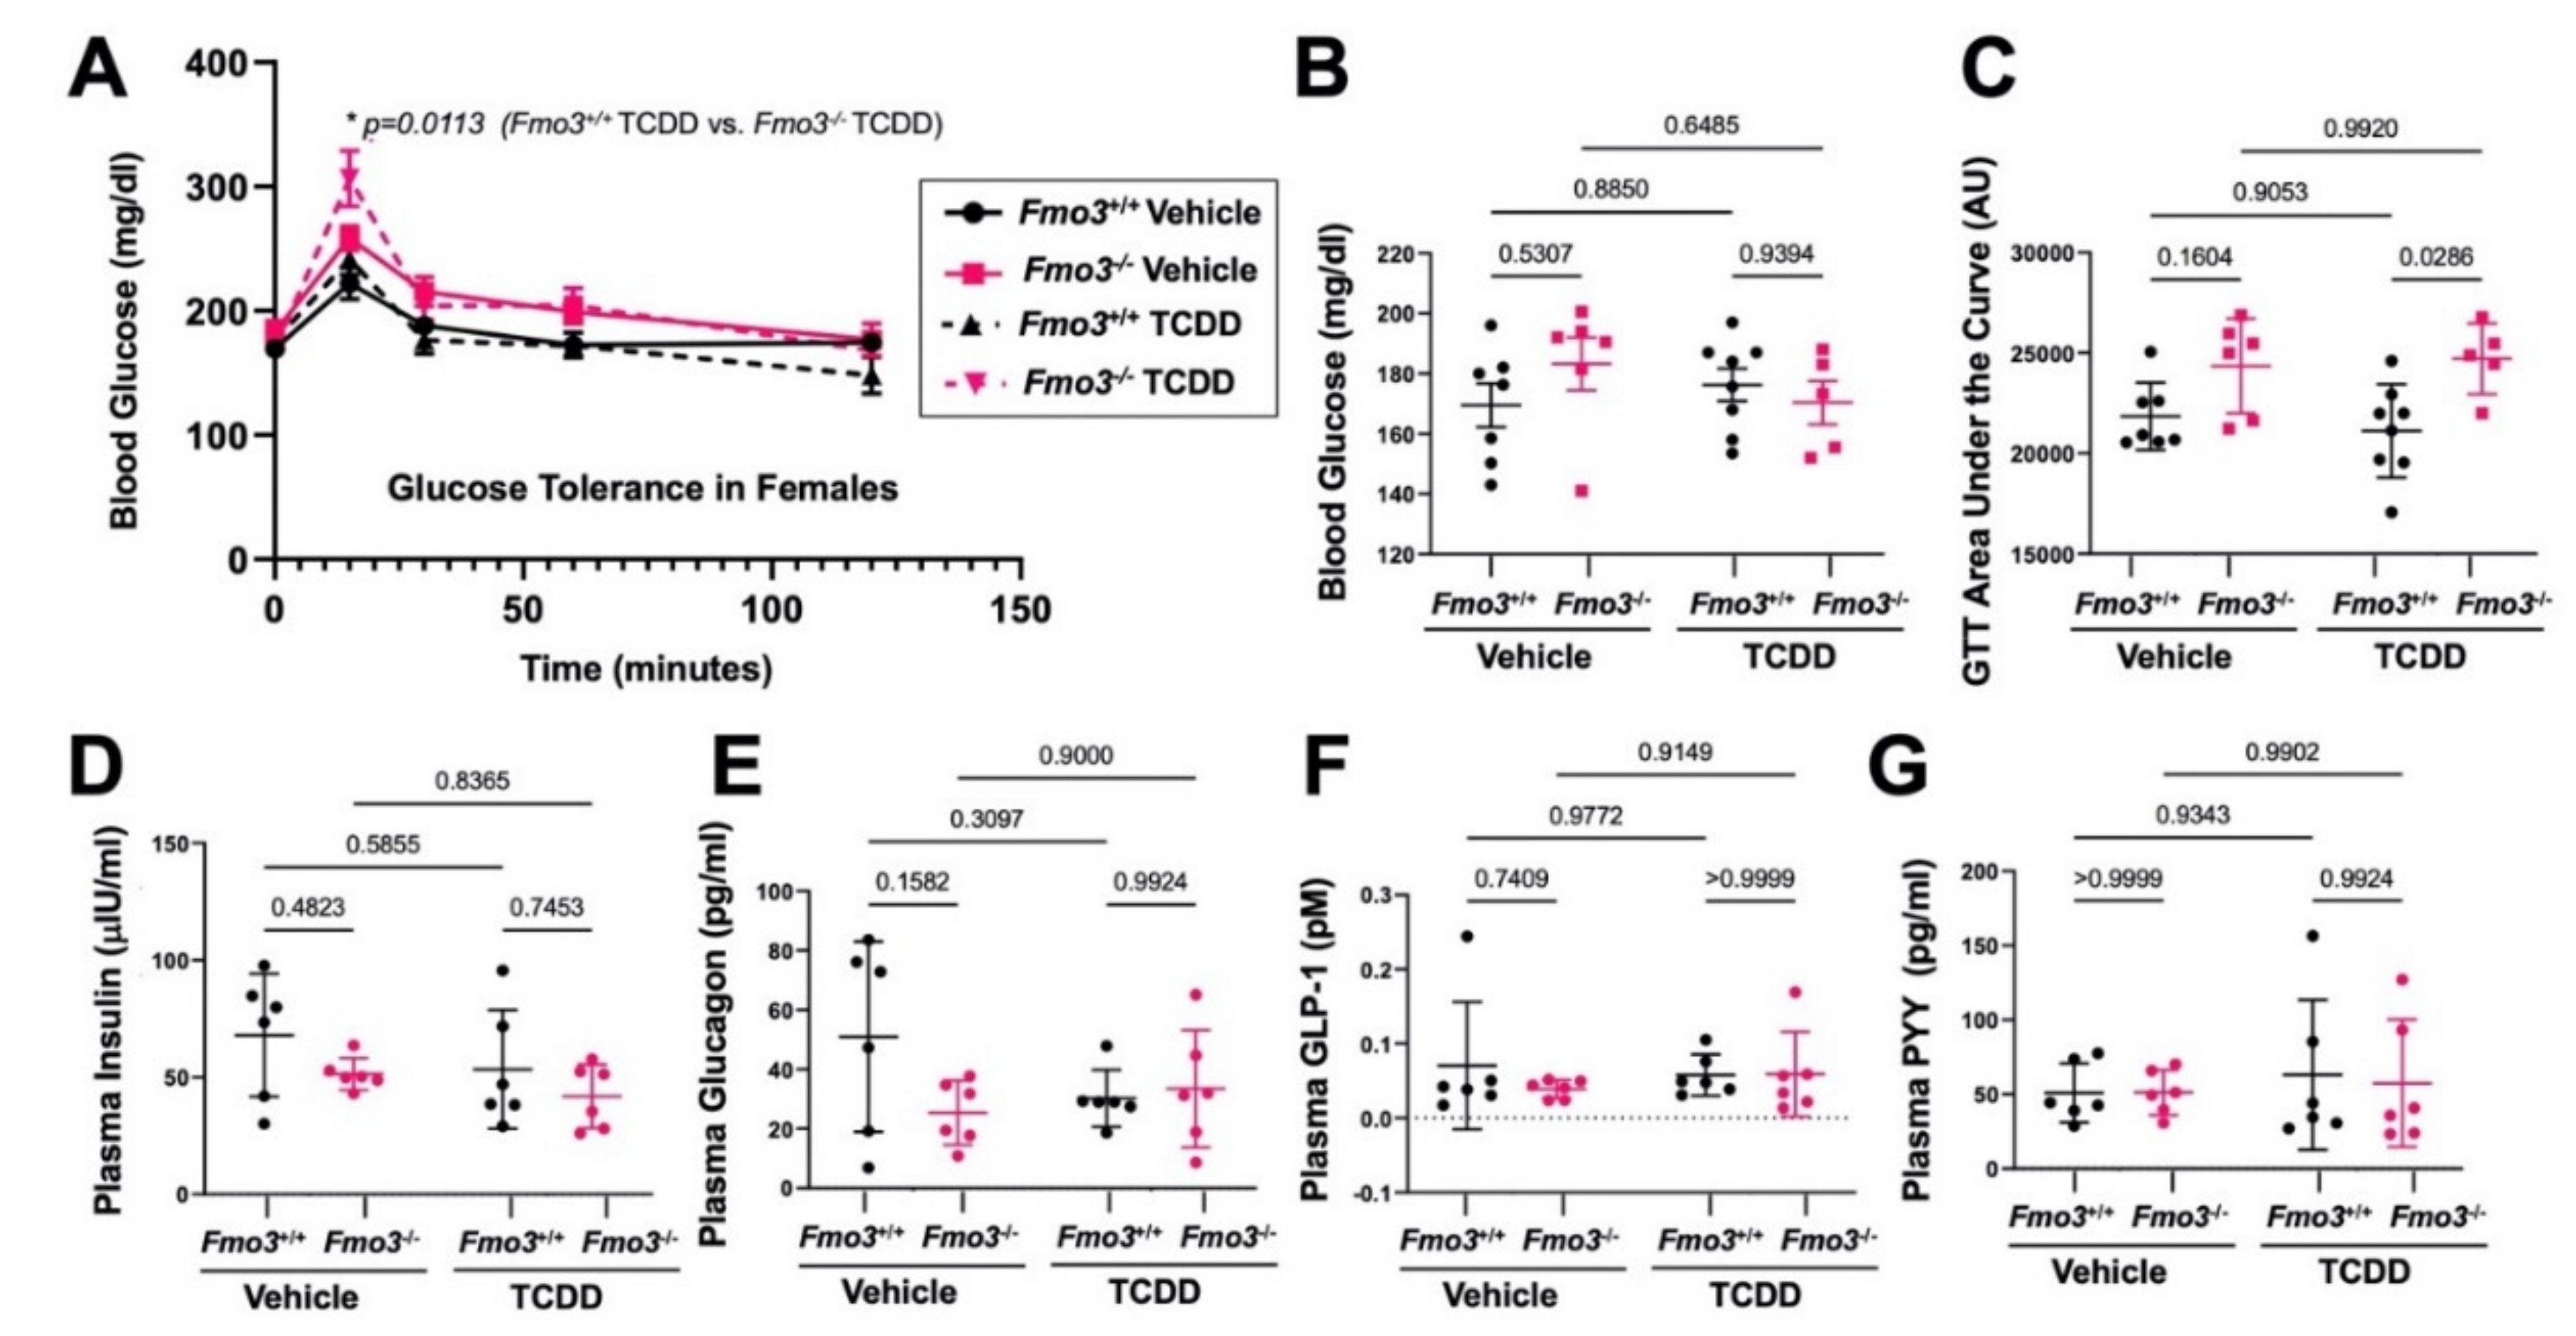
2.5. The Effects of TCDD Are Also Altered in Female Fmo3−/− Mice

It is well appreciated that in C57BL/6 mice, there is a striking sexual dimorphism in the hepatic expression of Fmo3, where females have much higher basal expression compared to males [37]. Given the clear differences in basal Fmo3 expression in male versus females, we also treated female Fmo3 wild-type (Fmo3+/+) or knockout (Fmo3−/−) mice with weekly injections of either corn oil vehicle or TCDD (25 µg/kg) for 6 weeks (Figure 8 and Figure 9). Much like we saw in male mice (Figure 1), we found that Fmo3 is upregulated at the mRNA and protein level by TCDD treatment in wild-type female mice (Figure 8A,D). However, unlike males, TCDD treatment in females did not result in a significant elevation in plasma TMAO in Fmo3+/+ mice (Figure 8C). However, female Fmo3−/− mice had much lower TMAO levels compared with Fmo3+/+ mice in both vehicle and TCDD treatment conditions (Figure 8C). When we examined the hepatic expression of Cyp1a1, we saw that when exposed to TCDD, Fmo3−/− mice showed a significantly increased level of Cyp1a1 expression compared to Fmo3+/+ mice, which is consistent with what we observed in male mice (Figure 1B). In female mice, we also found that glucose homeostasis was altered upon TCDD exposure in Fmo3−/− mice (Figure 9). Upon TCDD exposure, female Fmo3−/− mice did not have significantly elevated fasting blood glucose levels (Figure 9B). However, female Fmo3−/− mice treated with TCDD did have significantly higher blood glucose compared to the TCDD-treated Fmo3+/+ controls at the 15 min time point of GTT (Figure 9A) and a significantly higher GTT AUC response compared to Fmo3+/+ TCDD-treated mice (Figure 9C). We next measured plasma hormone levels and found there was no significant differences in insulin, glucagon, glucagon-like peptide 1, or peptide YY in female mice (Figure 9D–G). Together, these data suggest that the genetic deficiency of Fmo3 does not significantly alter metabolic hormone levels, but when exposed to TCDD, both male and female Fmo3−/− mice exhibit dysregulated glucose homeostasis.

3. Discussion

Here, we have investigated the role of FMO3 in TCDD-driven reorganization of the gut microbiome and host insulin sensitivity. The key findings of this study (Figure 10) are: (1) the mRNA, protein, and TMAO-producing function of FMO3 are potently stimulated by TCDD exposure in mice; (2) both male and female Fmo3−/− mice exhibit glucose intolerance when exposed to TCDD, despite normal fasting metabolic hormone levels; (3) TCDD exposure reorganizes the gut microbiome, and TCDD-driven microbiome reorganization is dramatically altered in Fmo3−/− mice; and (4) TCDD-driven expression of AhR target (i.e., Cyp1a1), heme metabolism, pro-inflammatory, and pro-fibrotic genes is dysregulated in Fmo3−/− mice. Interestingly, with respect to findings (3) and (4), recent studies have linked TCDD to profound effects on the microbial metabolome [62] and fibrotic responses in the liver as a result of perturbed iron homeostasis [63]. Collectively, this work demonstrates an underappreciated connection between environmental pollutants, the gut microbiome, and host glucose homeostasis. Given the fact that the gut microbial TMA–FMO3–TMAO pathway is initiated by ingestion of trimethylamine containing nutrients (i.e., choline, carnitine, γ-butyrobetaine, etc.), this work has important implications in our understanding of how dietary practices may converge with environmental exposures to impact cardiometabolic disease. Specifically, clinical prevention and treatment strategies for cardiometabolic disease may someday take into account patient history of environmental exposure, diet, microbial TMA production capacity, and FMO3 genotype. Indeed, there are ongoing studies to pharmacologically target FMO3 to reduce its ability to convert TMA to TMAO [64,65,66,67,68] as well as studies using non-lethal, microbe-targeting inhibitors that limit the production of TMA from dietary substrates [27,38,69,70,71,72].
AhR ligands such as TCDD have long been known to have endocrine-disrupting properties that can contribute to diverse human diseases including obesity and diabetes [1,2,3,4], atherosclerosis [5,6], various cancers [7,8,9,10], and kidney disease [11,12,13]. It is interesting to note that the TMA–FMO3–TMAO pathway has also been linked to these same diseases in humans [20,21,22,23,24,25]. This work bolsters the emerging concept that FMO3 may serve as a critical integrator of xenobiotic metabolism and cardiometabolic disease through the microbe-dependent production of TMAO. It is important to note that a recent cross-sectional study demonstrated a clear correlation between exposure to dioxin-like pollutant body levels and plasma TMAO levels in humans [24]. Furthermore, another recent study has shown that exposure to dioxin-like polychlorinated biphenyls (PCB 126 and PCB 77) can alter the expression and enzymatic activity of FMO3 in mice [5]. Independent work has also demonstrated that the hepatic expression of Fmo3 can be stimulated by activation of the AhR pathway [14]. Here, we have shown for the first time that the AhR-driven upregulation of FMO3 activity is a critical determinant of TCDD-induced reorganization of the gut microbiome and host insulin sensitivity.
Although this work has focused on one of the most potent AhR ligands known (TCDD), additional work will be needed to test whether the TMA–FMO3–TMAO pathway contributes to the endocrine-disrupting properties of other dioxin-like or other structurally distinct classes of environmental pollutants. In our study, we have chosen to take a hepato-centric view given the literature precedent of TCDD pathology and FMO3 function in the liver [5,12,20,22,24,41,43,73,74]. Despite this precedent and focus herein, we cannot rule out the importance of FMO3 knockout on extra-hepatic tissues, such as adipose tissue, the gastrointestinal tract, and pancreas in TCDD toxicity. Future studies may determine whether the loss of FMO3 results in hepatic injury that influences alterations in gut microbial communities or vice versa and delineate the role of hepatic versus extrahepatic FMO3 in TCDD-mediated toxicity. Continuing studies may also investigate the extent to which FMO3 is critical in response to other PAHs given that FMO3 upregulation has been described with PCB compounds [5,24].

4. Materials and Methods

4.1. Reagents

2,3,7,8-Tetrachlorodibenzo-p-dioxin (TCDD) was supplied by Agilent (RPE-029) and prepared in corn oil (Sigma, St. Louis, MO, USA, C8267) at 5 µg/mL. Primers for qRT-PCR were ordered from Sigma (see Table 1 for sequences). Antibodies were supplied by various vendors (see Table 2 for details).

4.2. Animals

To study the effects of TCDD under conditions of whole-body genetic deficiency, global Fmo3 knockout (Fmo3−/−) mice were generated using homologous recombination approaches in C57BL/6 C2 embryonic stem cells (ESCs) at the Case Western Reserve University mouse transgenic core. Initially, we purchased a knockout-first, reporter-tagged insertion with conditional potential (promoter-driven cassette) plasmid from the International Knockout Mouse Consortium (IKMC project 80017—targeting vector HTGR06012_12_A_7G09) and confirmed sequence fidelity. Then, this targeting vector was linearized and electroporated into C57BL/6 C2 ESCs. After positive and negative selection, clones were isolated and confirmed to have homologous recombination by complementary Southern blotting and quantitative polymerase chain reaction (qPCR) approaches. Then, several targeted clones were combined into albino blastocysts, and multiple blastocysts were injected into pseudopregnant recipient mice, resulting in several highly chimeric founder mice. These chimeras were backcrossed to C57BL/6J mice to confirm germ-line transmission of the targeted allele by PCR. Once the line was established, we further backcrossed founder mice > 10 generations into the C57BL/6J substrain before studies. FMO3 knockout and WT littermate mice were randomly assigned to either receive 25 µg/kg TCDD or volume-matched corn oil vehicle injections intraperitoneally weekly for 6 weeks.
After 4 weeks of injection with corn oil vehicle or TCDD, all mice were subject to glucose tolerance testing. For glucose tolerance testing, mice were fasted from 0900 to 1300 then injected intraperitoneally with 1 g/kg glucose. Blood glucose was measured immediately prior to injection as well as 15, 30, 60, and 120 min after injection using Accucheck glucometers.
At sacrifice, mice were fasted from 0900 to 1300 and injected with a lethal dose of Ketamine/Xylazine (150 mg/kg and 15 mg/kg, respectively). Tissues were excised and snap frozen in liquid nitrogen. Blood was collected via cardiac puncture into EDTA tubes (BD, #365974), and plasma was collected using the manufacturer’s protocol. All mice were maintained in an Association for the Assessment and Accreditation of Laboratory Animal Care, International-approved animal facility, and all experimental protocols were approved by the Institutional Animal Care and use Committee of the Cleveland Clinic.

4.3. RNA Isolation, RNA Sequencing, and Quantitative PCR (qPCR) Analyses

Liver tissue was homogenized in Trizol (Life Technologies, Waltham, MA, USA, 15596018), and RNA was extracted using chloroform extraction and an RNeasy Kit (Qiagen, Beverly, MA, USA). In brief, the aqueous layer from the Trizol/chloroform extraction was passed through a gDNA eliminator column and then combined with 1 volume of 70% ethanol before loading onto the RNeasy spin column (Qiagen), at which point the manufacturer’s protocol was followed. Following isolation, RNA samples were checked for quality and quantity using Nanodrop Spectrophotometry for qPCR and the Bio-analyzer for RNAseq (Agilent, Santa Clara, CA, USA). RNA-SEQ libraries were generated using the Illumina mRNA TruSEQ Directional library kit and sequenced using an Illumina HiSEQ4000 (both according to the Manufacturer’s instructions). RNA sequencing was performed by the University of Chicago Genomics Facility.
Raw sequencing data in the form of fastq files were transferred to and analyzed by the Bioinformatics Core at Case Western Reserve University. Fastq files were trimmed for quality and adapter sequences using TrimGalore! (Version 0.6.5 Babraham Institute, https://github.com/FelixKrueger/TrimGalore, accessed on 28 February 2022), which is a wrapper script for CutAdapt and FastQC. Reads passing quality control were aligned to the mm10 mouse reference genome using STARAligner [75] (version 2.5.3a) guided using the GENCODE gene annotation. Aligned reads were analyzed for differential gene expression using Cufflinks [76] (version 2.2.1), which reports the fragments per kilobase of exon per million fragments mapped (FPKM) for each gene. Significant genes were identified using a significance cutoff of p-value < 0.05 and used as input for pathway analysis in enrichR.
Qualitative Reverse Transcriptase Polymerase Chain Reaction (qPCR) cDNA was prepared using a qScript cDNA supermix (QuantaBio, Beverly MA, USA, 95048). qPCR was carried using SYBR Fast reagents (Applied Biosystems, Waltham, MA, USA, 4385618) out on an Applied Biosystems StepOne Plus machine. Data were analyzed using the ΔΔCT method, and expression was normalized such that the WT corn oil group’s expression equaled 1. Results were analyzed in Graphpad Prism 9, using two-way ANOVA and Tukey’s post hoc testing. p < 0.05 was considered significant.

4.4. Quantification of Plasma Hormone Levels

Plasma insulin, glucagon, peptide YY (PYY), and active glucagon-like peptide 1 (GLP-1) were measured using a custom MesoScale U-Plex assay using the manufacturer’s instructions (Meso Scale Diagnostics, Rockville, MD, USA). Results were analyzed in Graphpad Prism 9, using two-way ANOVA and Tukey’s post hoc testing. p < 0.05 was considered significant.

4.5. Western Blotting

Protein lysates were prepared by homogenizing liver tissue in a modified RIPA buffer as previously described [77]. First, 40 ug of protein were loaded onto 12% SDS-Polyacrylimide Gels (Invitrogen, Waltham, MA, USA). Then, the protein was transferred to 0.45 µm PVDF membranes (Thermo). Primary antibodies for Western blot were diluted 1:1000 in 5% (w/v) bovine serum albumin in TBST buffer, and secondary antibodies were diluted 1:5000 in 5% (w/v) milk/TBST. Antibodies were supplied by various vendors (see Table 2 for details). Blots were developed using ECL reagent (Amhersham), and images were captured with a GE Amhersham Imager 6000 (Software Version 1.1.1).

4.6. Quantification of Plasma TMAO Levels

Stable isotope dilution high-performance liquid chromatography tandem mass spectrometry (LC-MS/MS) was used for the quantification of TMAO levels as previously described [78,79]. The d9(methyl)-isotopologues, d9-TMAO, were spiked into plasma as internal standards. LC-MS/MS analyses were performed on a Shimadzu 8050 triple quadrupole mass spectrometer. TMAO and d9-TMAO were monitored using multiple reaction monitoring of precursor and characteristic product ions in positive mode as follows: m/z 76.0 → 58.1 for TMAO; and m/z 85.0 → 66.2 for d9-TMAO. Results were analyzed in Graphpad Prism 9, using two-way ANOVA and Tukey’s post hoc testing. p < 0.05 was considered significant.

4.7. Gut Microbiome Analyses

DNA was extracted from mouse cecal contents using the QIAGEN PowerSoil Pro kit using the manufacturer’s protocol. The 16S rRNA amplicon sequencing was completed for the V3–V4 region using an Illumina iSeq 100 system from mouse cecal contents. Raw 16S amplicon sequences and metadata were demultiplexed using the split_libraries_fastq.py script implemented in QIIME1.9.141 [80]. The demultiplexed fastq file was split into sample specific fastq files using the split_sequence_file_on_sample_ids.py script from QIIME1.9.141 [80]. Individual fastq files without non-biological nucleotides were processed using the Divisive Amplicon Denoising Algorithm (DADA) pipeline [81]. The output of the DADA2 pipeline (feature table of amplicon sequence variants) was processed for alpha and beta diversity analysis using the phyloseq [82] and microbiomeSeq (http://www.github.com/umerijaz/microbiomeSeq, accessed on 28 February 2022) packages in R. Alpha diversity estimates were measured within group categories using the estimate_richness function of the phyloseq package [82]. Non-metric multidimensional scaling (NMDS) was performed using the Bray–Curtis dissimilarity matrix [83] between groups and visualized by using the ggplot2 package [84]. We assessed the statistical significance (p < 0.05) throughout, and whenever necessary, we adjusted p-values for multiple comparisons according to the Benjamini–Hochberg method to control the false discovery rate (FDR) [85] while performing multiple testing on taxa abundance according to sample categories. We performed an analysis of variance among some categories while measuring the alpha diversity measures using the plot_anova_diversity function in the microbiomeSeq package (http://www.github.com/umerijaz/microbiomeSeq, accessed on 28 February 2022). Permutational multivariate analysis of variance (PERMANOVA) with 999 permutations was performed on all principal coordinates obtained during principal coordinates analysis with the ordination function of the microbiomeSeq package. Linear regression (parametric) and Wilcoxon (non-parametric) tests were performed on amplicon sequence variant abundances against meta-data variable levels using their base functions in R [86].

5. Conclusions

The results described herein have implications in our understanding of the complex interactions between environmental pollutant exposure, dietary inputs, host genetics, gut microbial metabolism and community structure, and the development of cardiometabolic disease. It is important to note that the TMAO pathway has become an attractive drug target for a number of human disease, and drugs that lower circulating TMAO levels are showing promise in preclinical animal models of cardiometabolic disease [27,31,38,69,70,71,72,87]. However, as this drug discovery process advances, it will be important to consider how TMAO-perturbing therapeutic strategies may impact microbe–host crosstalk in xenobiotic metabolism.

Supplementary Materials

A supplementary table of differentially expressed genes is available at https://www.mdpi.com/article/10.3390/metabo12040364/s1.

Author Contributions

Conceptualization, W.M. and J.M.B.; methodology, W.M., L.J.O., R.B., A.H., K.K.F., D.O., E.R.C., N.S., Z.W. and J.M.B.; software, W.M., E.R.C. and N.S.; validation, W.M., L.J.O., R.B., A.H., K.K.F., D.O., E.R.C., N.S., Z.W. and J.M.B.; formal analysis, W.M., E.R.C., N.S., Z.W. and J.M.B.; investigation, W.M., L.J.O., R.B., A.H., K.K.F., D.O. and J.M.B.; resources, Z.W. and J.M.B.; data curation, W.M., L.J.O., R.B., A.H., K.K.F., D.O., E.R.C., N.S., Z.W. and J.M.B.; writing—original draft preparation, W.M. and J.M.B.; writing—review and editing, W.M., L.J.O., R.B., A.H., K.K.F., D.O., E.R.C., N.S., Z.W. and J.M.B.; visualization, W.M. and J.M.B.; supervision, J.M.B.; project administration, J.M.B.; funding acquisition, Z.W. and J.M.B. All authors have read and agreed to the published version of the manuscript.

Funding

This work was supported in part by grants from the National Institutes of Health: R01 DK130227 (J.M.B.), R01 DK120679 (J.M.B.), P50 AA024333 (J.M.B.), P01 HL147823 (Z.W. and J.M.B.), U01 AA026938 (J.M.B.), R01 HL144651 (Z.W.), and R01 HL130819 (Z.W.).

Institutional Review Board Statement

There are no Institutional Review Board (IRB) oversights on this study. However, animal assurances were overseen in an Association for the Assessment and Accreditation of Laboratory Animal Care, International-approved animal facility, and all experimental protocols were approved by the Institutional Animal Care and use Committee of the Cleveland Clinic (IACUC protocol numbers 2018-1941 and 00002609).

Informed Consent Statement

Not applicable; no human studies were performed in this work.

Data Availability Statement

RNA sequencing data have been submitted to the NCBI GEO portal (accession GSE191138).

Acknowledgments

We thank Michael Petriello (Wayne State University) and Stanley L. Hazen (Cleveland Clinic) for critical discussion during the preparation of this manuscript.

Conflicts of Interest

W.M., L.J.O., R.B., A.H., K.F., D.O., E.R.C. and N.S. all declare no competing financial interests. Z.W. reports being named as a co-inventor on pending and issued patents held by the Cleveland Clinic relating to cardiovascular diagnostics and therapeutics. Z.W. reports being eligible to receive royalty payments for inventions or discoveries related to cardiovascular diagnostics or therapeutics from Cleveland Heart Lab, and Procter & Gamble. J.M.B. is listed as co-inventor on a United States patent application 20200121615 entitled “Treating disease and promoting weight loss by inhibiting the TMA/FMO3/TMAO pathway,” which describes agents that inhibit the TMA/FMO3/TMAO pathway for the prevention and/or treatment of obesity-related disorders.

Abbreviations

AhR: aryl hydrocarbon receptor; CVD, cardiovascular disease; FMO, flavin-containing monooxygenase; Fmo3, flavin-containing monooxygenase 3; PAHs, polycyclic aromatic hydrocarbons; PCB, polychlorinated biphenyl; TCDD, 2,3,7,8-Tetrachlorodibenzo-p-dioxin; TMA, trimethylamine; TMAO, trimethylamine-N-oxide.

References

  1. Kim, Y.A.; Park, J.B.; Woo, M.S.; Lee, S.Y.; Kim, H.Y.; Yoo, Y.H. Persistent Organic Pollutant-Mediated Insulin Resistance. Int. J. Environ. Res. Public Health 2019, 16, 448. [Google Scholar] [CrossRef] [PubMed] [Green Version]
  2. Cranmer, M.; Louie, S.; Kennedy, R.H.; Kern, P.A.; Fonseca, V.A. Exposure to 2,3,7,8-Tetrachlorodibenzo-P-Dioxin (Tcdd) Is Associated with Hyperinsulinemia and Insulin Resistance. Toxicol. Sci. 2000, 56, 431–436. [Google Scholar] [CrossRef] [PubMed] [Green Version]
  3. Hoyeck, M.P.; Blair, H.; Ibrahim, M.; Solanki, S.; Elsawy, M.; Prakash, A.; Rick, K.R.; Matteo, G.; O’Dwyer, S.; Bruin, J.E. Long-Term Metabolic Consequences of Acute Dioxin Exposure Differ between Male and Female Mice. Sci. Rep. 2020, 10, 1448. [Google Scholar] [CrossRef] [Green Version]
  4. Huang, C.Y.; Wu, C.L.; Yang, Y.C.; Chang, J.W.; Kuo, Y.C.; Cheng, Y.Y.; Wu, J.S.; Lee, C.C.; Guo, H.R. Association between Dioxin and Diabetes Mellitus in an Endemic Area of Exposure in Taiwan: A Population-Based Study. Medicine 2015, 94, e1730. [Google Scholar] [CrossRef] [PubMed]
  5. Petriello, M.C.; Hoffman, J.B.; Sunkara, M.; Wahlang, B.; Perkins, J.T.; Morris, A.J.; Hennig, B. Dioxin-Like Pollutants Increase Hepatic Flavin Containing Monooxygenase (Fmo3) Expression to Promote Synthesis of the Pro-Atherogenic Nutrient Biomarker Trimethylamine N-Oxide from Dietary Precursors. J. Nutr. Biochem. 2016, 33, 145–153. [Google Scholar] [CrossRef] [PubMed] [Green Version]
  6. Lind, P.M.; Van Bavel, B.; Salihovic, S.; Lind, L. Circulating Levels of Persistent Organic Pollutants (Pops) and Carotid Atherosclerosis in the Elderly. Environ. Health Perspect. 2012, 120, 38–43. [Google Scholar] [CrossRef]
  7. Ennour-Idrissi, K.; Ayotte, P.; Diorio, C. Persistent Organic Pollutants and Breast Cancer: A Systematic Review and Critical Appraisal of the Literature. Cancers 2019, 11, 1063. [Google Scholar] [CrossRef] [Green Version]
  8. Han, M.A.; Kim, J.H.; Song, H.S. Persistent Organic Pollutants, Pesticides, and the Risk of Thyroid Cancer: Systematic Review and Meta-Analysis. Eur. J. Cancer Prev. 2019, 28, 344–349. [Google Scholar] [CrossRef]
  9. Needham, L.L.; Gerthoux, P.M.; Patterson, D.G., Jr.; Brambilla, P.; Turner, W.E.; Beretta, C.; Pirkle, J.L.; Colombo, L.; Sampson, E.J.; Tramacere, P.L.; et al. Serum Dioxin Levels in Seveso, Italy, Population in 1976. Teratog. Carcinog. Mutagenesis 1997, 17, 225–240. [Google Scholar] [CrossRef]
  10. Park, E.Y.; Park, E.; Kim, J.; Oh, J.-K.; Kim, B.; Hong, Y.-C.; Lim, M.K. Impact of Environmental Exposure to Persistent Organic Pollutants on Lung Cancer Risk. Environ. Int. 2020, 143, 105925. [Google Scholar] [CrossRef]
  11. Kataria, A.; Trasande, L.; Trachtman, H. The Effects of Environmental Chemicals on Renal Function. Nat. Rev. Nephrol. 2015, 11, 610–625. [Google Scholar] [CrossRef] [PubMed]
  12. Tsai, H.-J.; Wu, P.-Y.; Huang, J.-C.; Chen, S.-C. Environmental Pollution and Chronic Kidney Disease. Int. J. Med. Sci. 2021, 18, 1121–1129. [Google Scholar] [CrossRef] [PubMed]
  13. Valcke, M.; Levasseur, M.-E.; Da Silva, A.S.; Wesseling, C. Pesticide exposures and chronic kidney disease of unknown etiology: An epidemiologic review. Environ. Health 2017, 16, 49. [Google Scholar] [CrossRef] [Green Version]
  14. Celius, T.; Roblin, S.; Harper, P.A.; Matthews, J.; Boutros, P.C.; Pohjanvirta, R.; Okey, A.B. Aryl Hydrocarbon Receptor-Dependent Induction of Flavin-Containing Monooxygenase Mrnas in Mouse Liver. Drug Metab. Dispos. 2008, 36, 2499–2505. [Google Scholar] [CrossRef] [PubMed] [Green Version]
  15. Harrill, J.A.; Layko, D.; Nyska, A.; Hukkanen, R.R.; Manno, R.A.; Grassetti, A.; Lawson, M.; Martin, G.; Budinsky, R.A.; Rowlands, J.C.; et al. Aryl Hydrocarbon Receptor Knockout Rats Are Insensitive to the Pathological Effects of Repeated Oral Exposure to 2,3,7,8-Tetrachlorodibenzo-P-Dioxin. J. Appl. Toxicol. 2016, 36, 802–814. [Google Scholar] [CrossRef] [PubMed]
  16. McDonnell, A.M.; Dang, C.H. Basic Review of the Cytochrome P450 System. J. Adv. Pract. Oncol. 2013, 4, 263–268. [Google Scholar]
  17. Michalex, J.; Robinson, J.; Fox, K.; Elequin, V.; Ketchum, N.; Jackson, W.; Pavuk, M.; Grubbs, W.; Cooper, B.; Johnson, P. Pharmacokinetics of Tcdd in Veterans of Operation Ranch Hand: 15-Year Follow-Up. J. Toxicol. Environ. Health Part A 1999, 57, 369–378. [Google Scholar]
  18. Lee, J.; Prokopec, S.D.; Watson, J.D.; Sun, R.X.; Pohjanvirta, R.; Boutros, P.C. Male and Female Mice Show Significant Differences in Hepatic Transcriptomic Response to 2,3,7,8-Tetrachlorodibenzo-P-Dioxin. BMC Genom. 2015, 16, 625. [Google Scholar] [CrossRef] [Green Version]
  19. Catucci, G.; Querio, G.; Sadeghi, S.J.; Gilardi, G.; Levi, R. Enzymatically Produced Trimethylamine N-Oxide: Conserving It or Eliminating It. Catalysts 2019, 9, 1028. [Google Scholar] [CrossRef] [Green Version]
  20. Miao, J.; Ling, A.V.; Manthena, P.V.; Gearing, M.E.; Graham, M.J.; Crooke, R.M.; Croce, K.J.; Esquejo, R.M.; Clish, C.B.; Vicent, D.; et al. Flavin-Containing Monooxygenase 3 as a Potential Player in Diabetes-Associated Atherosclerosis. Nat. Commun. 2015, 6, 6498. [Google Scholar] [CrossRef]
  21. Schugar, R.C.; Shih, D.M.; Warrier, M.; Helsley, R.N.; Burrows, A.; Ferguson, D.; Brown, A.L.; Gromovsky, A.D.; Heine, M.; Chatterjee, A.; et al. The Tmao-Producing Enzyme Flavin-Containing Monooxygenase 3 Regulates Obesity and the Beiging of White Adipose Tissue. Cell Rep. 2017, 19, 2451–2461. [Google Scholar] [CrossRef] [PubMed] [Green Version]
  22. Shih, D.M.; Wang, Z.; Lee, R.; Meng, Y.; Che, N.; Charugundla, S.; Qi, H.; Wu, J.; Pan, C.; Brown, J.M.; et al. Flavin Containing Monooxygenase 3 Exerts Broad Effects on Glucose and Lipid Metabolism and Atherosclerosis. J. Lipid Res. 2015, 56, 22–37. [Google Scholar] [CrossRef] [PubMed] [Green Version]
  23. Warrier, M.; Shih, D.M.; Burrows, A.C.; Ferguson, D.; Gromovsky, A.D.; Brown, A.L.; Marshall, S.; McDaniel, A.; Schugar, R.C.; Wang, Z.; et al. The Tmao-Generating Enzyme Flavin Monooxygenase 3 Is a Central Regulator of Cholesterol Balance. Cell Rep. 2015, 10, 326–338. [Google Scholar] [CrossRef] [PubMed] [Green Version]
  24. Petriello, M.C.; Charnigo, R.; Sunkara, M.; Soman, S.; Pavuk, M.; Birnbaum, L.; Morris, A.J.; Hennig, B. Relationship between Serum Trimethylamine N-Oxide and Exposure to Dioxin-Like Pollutants. Environ. Res. 2018, 162, 211–218. [Google Scholar] [CrossRef]
  25. Koeth, R.A.; Wang, Z.; Levison, B.S.; Buffa, J.A.; Org, E.; Sheehy, B.T.; Britt, E.B.; Fu, X.; Wu, Y.; Li, L.; et al. Intestinal Microbiota Metabolism of L-Carnitine, a Nutrient in Red Meat, Promotes Atherosclerosis. Nat. Med. 2013, 19, 576–585. [Google Scholar] [CrossRef] [Green Version]
  26. Chen, S.; Henderson, A.; Petriello, M.C.; Romano, K.A.; Gearing, M.; Miao, J.; Schell, M.; Sandoval-Espinola, W.J.; Tao, J.; Sha, B.; et al. Trimethylamine N-Oxide Binds and Activates Perk to Promote Metabolic Dysfunction. Cell Metab. 2019, 30, 1141–1151.e5. [Google Scholar] [CrossRef]
  27. Gupta, N.; Buffa, J.A.; Roberts, A.B.; Sangwan, N.; Skye, S.M.; Li, L.; Ho, K.J.; Varga, J.; DiDonato, J.A.; Tang, W.W.; et al. Targeted Inhibition of Gut Microbial Trimethylamine N-Oxide Production Reduces Renal Tubulointerstitial Fibrosis and Functional Impairment in a Murine Model of Chronic Kidney Disease. Arterioscler. Thromb. Vasc. Biol. 2020, 40, 1239–1255. [Google Scholar] [CrossRef]
  28. Johnson, C.; Prokopienko, A.J.; West, R.E.; Nolin, T.D.; Stubbs, J.R. Decreased Kidney Function Is Associated with Enhanced Hepatic Flavin Monooxygenase Activity and Increased Circulating Trimethylamine N-Oxide Concentrations in Mice. Drug Metab. Dispos. 2018, 46, 1304. [Google Scholar]
  29. Pelletier, C.C.; Croyal, M.; Ene, L.; Aguesse, A.; Billon-Crossouard, S.; Krempf, M.; Lemoine, S.; Guebre-Egziabher, F.; Juillard, L.; Soulage, C.O. Elevation of Trimethylamine-N-Oxide in Chronic Kidney Disease: Contribution of Decreased Glomerular Filtration Rate. Toxins 2019, 11, 635. [Google Scholar] [CrossRef] [Green Version]
  30. Robinson-Cohen, C.; Newitt, R.; Shen, D.D.; Rettie, A.E.; Kestenbaum, B.R.; Himmelfarb, J.; Yeung, C.K. Association of Fmo3 Variants and Trimethylamine N-Oxide Concentration, Disease Progression, and Mortality in Ckd Patients. PLoS ONE 2016, 11, e0161074. [Google Scholar] [CrossRef]
  31. Zhang, W.; Miikeda, A.; Zuckerman, J.; Jia, X.; Charugundla, S.; Zhou, Z.; Kaczor-Urbanowicz, K.E.; Magyar, C.; Guo, F.; Wang, Z.; et al. Inhibition of Microbiota-Dependent Tmao Production Attenuates Chronic Kidney Disease in Mice. Sci. Rep. 2021, 11, 518. [Google Scholar] [CrossRef]
  32. Chen, L.; Chen, Y.; Zhao, M.; Zheng, L.; Fan, D. Changes in the Concentrations of Trimethylamine N-Oxide (Tmao) and Its Precursors in Patients with Amyotrophic Lateral Sclerosis. Sci. Rep. 2020, 10, 15198. [Google Scholar] [CrossRef] [PubMed]
  33. Gagliardi, S.; Ogliari, P.; Davin, A.; Corato, M.; Cova, E.; Abel, K.; Cashman, J.R.; Ceroni, M.; Cereda, C. Flavin-Containing Monooxygenase Mrna Levels Are up-Regulated in Als Brain Areas in Sod1-Mutant Mice. Neurotox. Res. 2011, 20, 150–158. [Google Scholar] [CrossRef] [PubMed]
  34. Govindarajulu, M.; Pinky, P.D.; Steinke, I.; Bloemer, J.; Ramesh, S.; Kariharan, T.; Rella, R.T.; Bhattacharya, S.; Dhanasekaran, M.; Suppiramaniam, V.; et al. Gut Metabolite Tmao Induces Synaptic Plasticity Deficits by Promoting Endoplasmic Reticulum Stress. Front. Mol. Neurosci. 2020, 13, 138. [Google Scholar] [CrossRef] [PubMed]
  35. Li, D.; Ke, Y.; Zhan, R.; Liu, C.; Zhao, M.; Zeng, A.; Shi, X.; Ji, L.; Cheng, S.; Pan, B.; et al. Trimethylamine-N-Oxide Promotes Brain Aging and Cognitive Impairment in Mice. Aging Cell 2018, 17, e12768. [Google Scholar] [CrossRef]
  36. Vogt, N.M.; Romano, K.A.; Darst, B.F.; Engelman, C.D.; Johnson, S.C.; Carlsson, C.M.; Asthana, S.; Blennow, K.; Zetterberg, H.; Bendlin, B.B.; et al. The Gut Microbiota-Derived Metabolite Trimethylamine N-Oxide Is Elevated in Alzheimer’s Disease. Alzheimer’s Res. Ther. 2018, 10, 124. [Google Scholar] [CrossRef] [Green Version]
  37. Bennett, B.J.; de Aguiar Vallim, T.Q.; Wang, Z.; Shih, D.M.; Meng, Y.; Gregory, J.; Allayee, H.; Lee, R.; Graham, M.; Crooke, R.; et al. Trimethylamine-N-Oxide, a Metabolite Associated with Atherosclerosis, Exhibits Complex Genetic and Dietary Regulation. Cell Metab. 2013, 17, 49–60. [Google Scholar] [CrossRef] [Green Version]
  38. Schugar, R.C.; Gliniak, C.M.; Osborn, L.J.; Massey, W.; Sangwan, N.; Horak, A.; Banerjee, R.; Orabi, D.; Helsley, R.N.; Brown, A.L.; et al. Gut Microbe-Targeted Choline Trimethylamine Lyase Inhibition Improves Obesity Via Rewiring of Host Circadian Rhythms. eLife 2022, 11, e63998. [Google Scholar] [CrossRef]
  39. Sundberg, C.D.; Hankinson, O. A Crispr/Cas9 Whole-Genome Screen Identifies Genes Required for Aryl Hydrocarbon Receptor-Dependent Induction of Functional Cyp1a1. Toxicol. Sci. 2019, 170, 310–319. [Google Scholar] [CrossRef]
  40. Biljes, D.; Hammerschmidt-Kamper, C.; Kadow, S.; Diel, P.; Weigt, C.; Burkart, V.; Esser, C. Impaired Glucose and Lipid Metabolism in Ageing Aryl Hydrocarbon Receptor Deficient Mice. EXCLI J. 2015, 14, 1153–1163. [Google Scholar]
  41. Fernandez-Salguero, P.M.; Hilbert, D.M.; Rudikoff, S.; Ward, J.M.; Gonzalez, F.J. Aryl-Hydrocarbon Receptor-Deficient Mice Are Resistant to 2,3,7,8-Tetrachlorodibenzo-P-Dioxin-Induced Toxicity. Toxicol. Appl. Pharmacol. 1996, 140, 173–179. [Google Scholar] [CrossRef] [PubMed]
  42. Natividad, J.M.; Agus, A.; Planchais, J.; Lamas, B.; Jarry, A.C.; Martin, R.; Michel, M.-L.; Chong-Nguyen, C.; Roussel, R.; Straube, M.; et al. Impaired Aryl Hydrocarbon Receptor Ligand Production by the Gut Microbiota Is a Key Factor in Metabolic Syndrome. Cell Metab. 2018, 28, 737–749.e4. [Google Scholar] [CrossRef] [PubMed] [Green Version]
  43. Pierre, S.; Chevallier, A.; Teixeira-Clerc, F.; Ambolet-Camoit, A.; Bui, L.C.; Bats, A.S.; Fournet, J.C.; Fernandez-Salguero, P.; Aggerbeck, M.; Lotersztajn, S.; et al. Aryl Hydrocarbon Receptor-Dependent Induction of Liver Fibrosis by Dioxin. Toxicol. Sci. 2014, 137, 114–124. [Google Scholar] [CrossRef] [PubMed] [Green Version]
  44. Song, D.; Dunaief, J.L. Retinal Iron Homeostasis in Health and Disease. Front. Aging Neurosci. 2013, 5, 24. [Google Scholar] [CrossRef] [PubMed] [Green Version]
  45. Esmith, A.; McCulloh, R.J. Hemopexin and Haptoglobin: Allies against Heme Toxicity from Hemoglobin Not Contenders. Front. Physiol. 2015, 6, 187. [Google Scholar]
  46. Vinchi, F.; Gastaldi, S.; Silengo, L.; Altruda, F.; Tolosano, E. Hemopexin Prevents Endothelial Damage and Liver Congestion in a Mouse Model of Heme Overload. Am. J. Pathol. 2008, 173, 289–299. [Google Scholar] [CrossRef] [Green Version]
  47. Scheja, L.; Heese, B.; Zitzer, H.; Michael, M.; Siesky, A.M.; Pospisil, H.; Beisiegel, U.; Seedorf, K. Acute-Phase Serum Amyloid a as a Marker of Insulin Resistance in Mice. Exp. Diabetes Res. 2008, 2008, 230837. [Google Scholar] [CrossRef] [Green Version]
  48. Sun, Y.; Yang, Y.; Qin, Z.; Cai, J.; Guo, X.; Tang, Y.; Wan, J.; Su, D.-F.; Liu, X. The Acute-Phase Protein Orosomucoid Regulates Food Intake and Energy Homeostasis Via Leptin Receptor Signaling Pathway. Diabetes 2016, 65, 1630. [Google Scholar] [CrossRef] [Green Version]
  49. Komori, H.; Nishi, K.; Uehara, N.; Watanabe, H.; Shuto, T.; Suenaga, A.; Maruyama, T.; Otagiri, M. Characterization of Hepatic Cellular Uptake of A1-Acid Glycoprotein (Agp), Part 2: Involvement of Hemoglobin Β-Chain on Plasma Membranes in the Uptake of Human Agp by Liver Parenchymal Cells. J. Pharm. Sci. 2012, 101, 1607–1615. [Google Scholar] [CrossRef]
  50. Chen, G.I.; Tisayakorn, S.; Jorgensen, C.; D’Ambrosio, L.M.; Goudreault, M.; Gingras, A.C. Pp4r4/Kiaa1622 Forms a Novel Stable Cytosolic Complex with Phosphoprotein Phosphatase 4. J. Biol. Chem. 2008, 283, 29273–29284. [Google Scholar] [CrossRef] [Green Version]
  51. Hu, M.C.-T.; Tang-Oxley, Q.; Qiu, W.R.; Wang, Y.-P.; Mihindukulasuriya, K.A.; Afshar, R.; Tan, T.-H. Protein Phosphatase X Interacts with C-Rel and Stimulates C-Rel/Nuclear Factor Κb Activity. J. Biol. Chem. 1998, 273, 33561–33565. [Google Scholar] [CrossRef] [PubMed] [Green Version]
  52. Chen, L.; Dong, W.; Zou, T.; Ouyang, L.; He, G.; Liu, Y.; Qi, Y. Protein Phosphatase 4 Negatively Regulates Lps Cascade by Inhibiting Ubiquitination of Traf6. FEBS Lett. 2008, 582, 2843–2849. [Google Scholar] [CrossRef] [PubMed] [Green Version]
  53. Zhao, H.; Huang, X.; Jiao, J.; Zhang, H.; Liu, J.; Qin, W.; Meng, X.; Shen, T.; Lin, Y.; Chu, J.; et al. Protein Phosphatase 4 (Pp4) Functions as a Critical Regulator in Tumor Necrosis Factor (Tnf)-A-Induced Hepatic Insulin Resistance. Sci. Rep. 2015, 5, 18093. [Google Scholar] [CrossRef] [PubMed] [Green Version]
  54. Tian, Y.; Gui, W.; Rimal, B.; Koo, I.; Smith, P.B.; Nichols, R.G.; Cai, J.; Liu, Q.; Patterson, A.D. Metabolic Impact of Persistent Organic Pollutants on Gut Microbiota. Gut Microbes 2020, 12, 1848209. [Google Scholar] [CrossRef] [PubMed]
  55. Menni, C.; Zhu, J.; Le Roy, C.I.; Mompeo, O.; Young, K.; Rebholz, C.M.; Selvin, E.; North, K.E.; Mohney, R.P.; Bell, J.T.; et al. Serum Metabolites Reflecting Gut Microbiome Alpha Diversity Predict Type 2 Diabetes. Gut Microbes 2020, 11, 1632–1642. [Google Scholar] [CrossRef] [PubMed]
  56. Da Silva, C.C.; Monteil, M.A.; Davis, E.M. Overweight and Obesity in Children Are Associated with an Abundance of Firmicutes and Reduction of Bifidobacterium in Their Gastrointestinal Microbiota. Child. Obes. 2020, 16, 204–210. [Google Scholar] [CrossRef] [PubMed] [Green Version]
  57. Ludwig, H.; Hausmann, B.; Schreder, M.; Pönisch, W.; Zojer, N.; Knop, S.; Gunsilius, E.; Egle, A.; Petzer, A.; Einsele, H.; et al. Reduced Alpha Diversity of the Oral Microbiome Correlates with Short Progression-Free Survival in Patients with Relapsed/Refractory Multiple Myeloma Treated with Ixazomib-Based Therapy (Agmt Mm 1, Phase Ii Trial). eJHaem 2021, 2, 102–106. [Google Scholar] [CrossRef]
  58. Li, C.; You, Z.; Lin, Y.; Liu, H.; Su, J. Skin Microbiome Differences Relate to the Grade of Acne Vulgaris. J. Dermatol. 2019, 46, 787–790. [Google Scholar] [CrossRef]
  59. Vogtmann, E.; Flores, R.; Yu, G.; Freedman, N.D.; Shi, J.; Gail, M.H.; Dye, B.A.; Wang, G.-Q.; Klepac-Ceraj, V.; Paster, B.J.; et al. Association between Tobacco Use and the Upper Gastrointestinal Microbiome among Chinese Men. Cancer Causes Control 2015, 26, 581–588. [Google Scholar] [CrossRef] [Green Version]
  60. Greer, R.L.; Dong, X.; de Moraes, A.; Zielke, R.A.; Fernandes, G.R.; Peremyslova, E.; Vasquez-Perez, S.; Schoenborn, A.A.; Gomes, E.P.; Pereira, A.C.; et al. Akkermansia Muciniphila Mediates Negative Effects of Ifnγ on Glucose Metabolism. Nat. Commun. 2016, 7, 13329. [Google Scholar] [CrossRef]
  61. Van Hul, M.; Geurts, L.; Plovier, H.; Druart, C.; Everard, A.; Ståhlman, M.; Rhimi, M.; Chira, K.; Teissedre, P.-L.; Delzenne, N.M.; et al. Reduced Obesity, Diabetes, and Steatosis Upon Cinnamon and Grape Pomace Are Associated with Changes in Gut Microbiota and Markers of Gut Barrier. Am. J. Physiol. Endocrinol. Metab. 2018, 314, E334–E352. [Google Scholar] [CrossRef] [PubMed]
  62. Dopkins, N.; Neameh, W.H.; Hall, A.; Lai, Y.; Rutkovsky, A.; Gandy, A.O.; Lu, K.; Nagarkatti, P.S.; Nagarkatti, M. Effects of Acute 2,3,7,8-Tetrachlorodibenzo-P-Dioxin Exposure on the Circulating and Cecal Metabolome Profile. Int. J. Mol. Sci. 2021, 22, 11801. [Google Scholar] [CrossRef] [PubMed]
  63. Li, C.; Liu, Y.; Dong, Z.; Xu, M.; Gao, M.; Cong, M.; Liu, S. Tcdd Promotes Liver Fibrosis through Disordering Systemic and Hepatic Iron Homeostasis. J. Hazard. Mater. 2020, 395, 122588. [Google Scholar] [CrossRef]
  64. Catucci, G.; Aramini, D.; Sadeghi, S.J.; Gilardi, G. Ligand Stabilization and Effect on Unfolding by Polymorphism in Human Flavin-Containing Monooxygenase 3. Int. J. Biol. Macromol. 2020, 162, 1484–1493. [Google Scholar] [CrossRef] [PubMed]
  65. Catucci, G.; Bortolussi, S.; Rampolla, G.; Cusumano, D.; Gilardi, G.; Sadeghi, S.J. Flavin-Containing Monooxygenase 3 Polymorphic Variants Significantly Affect Clearance of Tamoxifen and Clomiphene. Basic Clin. Pharmacol. Toxicol. 2018, 123, 687–691. [Google Scholar] [CrossRef] [PubMed]
  66. Catucci, G.; Occhipinti, A.; Maffei, M.; Gilardi, G.; Sadeghi, S.J. Effect of Human Flavin-Containing Monooxygenase 3 Polymorphism on the Metabolism of Aurora Kinase Inhibitors. Int. J. Mol. Sci. 2013, 14, 2707–2716. [Google Scholar] [CrossRef] [PubMed]
  67. Gao, C.; Catucci, G.; Castrignanò, S.; Gilardi, G.; Sadeghi, S.J. Inactivation Mechanism of N61s Mutant of Human Fmo3 Towards Trimethylamine. Sci. Rep. 2017, 7, 14668. [Google Scholar] [CrossRef] [PubMed] [Green Version]
  68. Gao, C.; Catucci, G.; di Nardo, G.; Gilardi, G.; Sadeghi, S.J. Human Flavin-Containing Monooxygenase 3: Structural Mapping of Gene Polymorphisms and Insights into Molecular Basis of Drug Binding. Gene 2016, 593, 91–99. [Google Scholar] [CrossRef] [Green Version]
  69. Helsley, R.N.; Miyata, T.; Kadam, A.; Varadharajan, V.; Sangwan, N.; Huang, E.C.; Banerjee, R.; Brown, A.L.; Fung, K.K.; Massey, W.J.; et al. Gut Microbial Trimethylamine Is Elevated in Alcohol-Associated Hepatitis and Contributes to Ethanol-Induced Liver Injury in Mice. eLife 2022, 11, e76554. [Google Scholar] [CrossRef]
  70. Pathak, P.; Helsley, R.N.; Brown, A.L.; Buffa, J.A.; Choucair, I.; Nemet, I.; Gogonea, C.B.; Gogonea, V.; Wang, Z.; Garcia-Garcia, J.C.; et al. Small Molecule Inhibition of Gut Microbial Choline Trimethylamine Lyase Activity Alters Host Cholesterol and Bile Acid Metabolism. Am. J. Physiol. Heart Circ. Physiol. 2020, 318, H1474–H1486. [Google Scholar] [CrossRef]
  71. Roberts, A.B.; Gu, X.; Buffa, J.A.; Hurd, A.G.; Wang, Z.; Zhu, W.; Gupta, N.; Skye, S.M.; Cody, D.B.; Levison, B.S.; et al. Development of a Gut Microbe-Targeted Nonlethal Therapeutic to Inhibit Thrombosis Potential. Nat. Med. 2018, 24, 1407–1417. [Google Scholar] [CrossRef]
  72. Wang, Z.; Roberts, A.B.; Buffa, J.A.; Levison, B.S.; Zhu, W.; Org, E.; Gu, X.; Huang, Y.; Zamanian-Daryoush, M.; Culley, M.K.; et al. Non-Lethal Inhibition of Gut Microbial Trimethylamine Production for the Treatment of Atherosclerosis. Cell 2015, 163, 1585–1595. [Google Scholar] [CrossRef] [PubMed] [Green Version]
  73. Wang, C.; Xu, C.-X.; Krager, S.L.; Bottum, K.M.; Liao, D.-F.; Tischkau, S.A. Aryl Hydrocarbon Receptor Deficiency Enhances Insulin Sensitivity and Reduces Ppar-A Pathway Activity in Mice. Environ. Health Perspect. 2011, 119, 1739–1744. [Google Scholar] [CrossRef] [PubMed] [Green Version]
  74. Tan, X.; Liu, Y.; Long, J.; Chen, S.; Liao, G.; Wu, S.; Li, C.; Wang, L.; Ling, W.; Zhu, H. Trimethylamine N-Oxide Aggravates Liver Steatosis through Modulation of Bile Acid Metabolism and Inhibition of Farnesoid X Receptor Signaling in Nonalcoholic Fatty Liver Disease. Mol. Nutr. Food Res. 2019, 63, 1900257. [Google Scholar] [CrossRef] [PubMed]
  75. Dobin, A.; Davis, C.A.; Schlesinger, F.; Drenkow, J.; Zaleski, C.; Jha, S.; Batut, P.; Chaisson, M.; Gingeras, T.R. Star: Ultrafast Universal Rna-Seq Aligner. Bioinformatics 2013, 29, 15–21. [Google Scholar] [CrossRef] [PubMed]
  76. Trapnell, C.; Williams, B.A.; Pertea, G.; Mortazavi, A.; Kwan, G.; van Baren, M.J.; Salzberg, S.L.; Wold, B.J.; Pachter, L. Transcript Assembly and Quantification by Rna-Seq Reveals Unannotated Transcripts and Isoform Switching During Cell Differentiation. Nat. Biotechnol. 2010, 28, 511–515. [Google Scholar] [CrossRef] [PubMed] [Green Version]
  77. Brown, J.M.; Boysen, M.S.; Chung, S.; Fabiyi, O.; Morrison, R.F.; Mandrup, S.; McIntosh, M.K. Conjugated Linoleic Acid Induces Human Adipocyte Delipidation: Autocrine/Paracrine Regulation of Mek/Erk Signaling by Adipocytokines. J. Biol. Chem. 2004, 279, 26735–26747. [Google Scholar] [CrossRef] [Green Version]
  78. Wang, Z.; Klipfell, E.; Bennett, B.J.; Koeth, R.; Levison, B.S.; Dugar, B.; Feldstein, A.E.; Britt, E.B.; Fu, X.; Chung, Y.M.; et al. Gut Flora Metabolism of Phosphatidylcholine Promotes Cardiovascular Disease. Nature 2011, 472, 57–63. [Google Scholar] [CrossRef] [Green Version]
  79. Wang, Z.; Levison, B.S.; Hazen, J.E.; Donahue, L.; Li, X.M.; Hazen, S.L. Measurement of Trimethylamine-N-Oxide by Stable Isotope Dilution Liquid Chromatography Tandem Mass Spectrometry. Anal. Biochem. 2014, 455, 35–40. [Google Scholar] [CrossRef] [Green Version]
  80. Caporaso, J.G.; Kuczynski, J.; Stombaugh, J.; Bittinger, K.; Bushman, F.D.; Costello, E.K.; Fierer, N.; Gonzalez Peña, A.; Goodrich, J.K.; Gordon, J.I.; et al. Qiime Allows Analysis of High-Throughput Community Sequencing Data. Nat. Methods 2010, 7, 335–336. [Google Scholar] [CrossRef] [Green Version]
  81. Callahan, B.J.; Mcmurdie, P.J.; Rosen, M.J.; Han, A.W.; Johnson, A.J.A.; Holmes, S.P. Dada2: High-Resolution Sample Inference from Illumina Amplicon Data. Nat. Methods 2016, 13, 581–583. [Google Scholar] [CrossRef] [PubMed] [Green Version]
  82. McMurdie, P.J.; Holmes, S. Phyloseq: An R Package for Reproducible Interactive Analysis and Graphics of Microbiome Census Data. PLoS ONE 2013, 8, e61217. [Google Scholar] [CrossRef] [PubMed] [Green Version]
  83. McMurdie, P.J.; Holmes, S. Waste Not, Want Not: Why Rarefying Microbiome Data Is Inadmissible. PLoS Comput. Biol. 2014, 10, e1003531. [Google Scholar] [CrossRef] [PubMed] [Green Version]
  84. Wickham, H. Ggplot2: Elegant Graphics for Data Analysis, 2nd ed.; Springer Publishing Company: New York, NY, USA, 2009. [Google Scholar]
  85. Benjamini, Y.; Hochberg, Y. Controlling the False Discovery Rate: A Practical and Powerful Approach to Multiple Testing. J. R. Stat. Soc. Ser. B Methodol. 1995, 57, 289–300. [Google Scholar] [CrossRef]
  86. Hollander, M.; Wolfe, D.A. Nonparametric Statistical Methods, 2nd ed.; Wiley-Interscience: Hoboken, NJ, USA, 1999; Volume 19, pp. 1386–1388. ISBN 0-471-19045-4. [Google Scholar]
  87. Witkowski, M.; Witkowski, M.; Friebel, J.; Buffa, J.A.; Li, X.S.; Wang, Z.; Sangwan, N.; Li, L.; DiDonato, J.A.; Tizian, C.; et al. Endothelial Tissue Factor Contributes to Trimethylamine N-Oxide-Enhanced Arterial Thrombosis. Cardiovasc. Res. 2021, cvab263. [Google Scholar] [CrossRef]
Figure 1. TCDD Exposure Stimulates the Gene Expression, Protein Abundance, and TMAO-Producing Function FMO3 in Male Mice. (A) Experiment schematic showing that age-matched male Fmo3+/+ or Fmo3−/− mice were injected weekly with either corn oil vehicle or 25 µg/kg TCDD for 6 weeks. (B) Quantitative PCR (qPCR) analysis for the aryl hydrocarbon receptor target gene Cytochrome P450 family 1 subfamily A member 1 (Cyp1a1) and flavin-containing monooxygenase 3 (Fmo3). Data were analyzed using a 2-way ANOVA followed by a Tukey post hoc test. (C) Western blot of N = 4/group showing that FMO3 protein expression is elevated in Fmo3+/+ mice treated with TCDD. (D) Plasma trimethylamine N-oxide (TMAO) levels were quantified using stable isotope dilution liquid chromatography tandem mass spectrometry (LC-MS/MS). Data represent the mean ± S.E.M. from 5 to 7 mice per group. Data were analyzed using a 2-way ANOVA followed by a Tukey post hoc test.
Metabolites 12 00364 g001
Figure 2. TCDD Treatment Promotes Glucose Intolerance in Fmo3−/− Male Mice. Age-matched male Fmo3+/+ or Fmo3−/− mice were injected weekly with either corn oil vehicle or 25 µg/kg TCDD for 4 weeks. (A) Blood glucose was measured after a 4 h fast and then 15, 30, 60, and 120 min during an intraperitoneal glucose tolerance test (GTT). Data represent the mean ± S.E.M. from 5 to 7 mice per group. Data were analyzed using a 3-way ANOVA followed by a Tukey post hoc test. (B) Blood glucose was measured after 4 h of fasting and revealed no significant changes due to genotype or treatment. Data represent the mean ± S.E.M. from 5 to 7 mice per group. Data were analyzed using a 2-way ANOVA followed by a Tukey post hoc test. (C) The area under the curve (AUC) was measured for each animal over the course of the GTT, showing that there is a significant increase in AUC in TCDD-treated KO vs. WT mice. Data represent the mean ± S.E.M. from 5 to 7 mice per group. Data were analyzed using a 2-way ANOVA followed by a Tukey post hoc test. (DG) Levels of plasma hormones levels were quantified for (D) insulin, (E) glucagon, (F) active glucagon-like peptide 1 (GLP-1), and (G) peptide YY (PYY). Data represent the mean ± S.E.M. from 5 to 7 mice per group. Data were analyzed using a 2-way ANOVA followed by a Tukey post hoc test.
Metabolites 12 00364 g002
Figure 3. RNA Sequencing Demonstrates that TCDD-Induced Gene Expression is Significantly Altered in Male Fmo3−/− Mice. (A) Volcano plot generated from bulk RNAseq data in Fmo3+/+ or Fmo3−/− mice treated with TCDD. (B) Western blot analysis of hemopexin (HPX) and haptoglobin (HP). Data shown are from N = 4 mice per group. (C) Pathway analysis of 86 significantly differentially expressed genes by RNAseq using the Elsevier Pathway Collection. Sorted by p-value ranking.
Metabolites 12 00364 g003
Figure 4. Pro-Inflammatory and Pro-Fibrotic Gene Expression Signatures Are Altered in Fmo3−/− mice. (A) Volcano plot generated from bulk RNAseq data in Fmo3+/+ or Fmo3−/− mice treated with corn oil vehicle; N = 4 per group. (BF) qPCR confirmation of the most differentially expressed genes (DEGs) in mouse liver including 5′-aminolevulinate synthase 1 (Alas1), collagen 1a1 (Col1a1), interleukin 1 β (IL-1β), tumor necrosis factor α, (Tnfα), and interleukin 6 (IL-6). Data represent the mean ± S.E.M. from 5 to 7 mice per group. Data were analyzed using a 2-way ANOVA followed by a Tukey post hoc test.
Metabolites 12 00364 g004
Figure 5. TCDD treatment significantly alters gut microbiota in an Fmo3-dependent manner. 16S rRNA gene sequencing was conducted in cecal samples from vehicle and TCDD-treated Fmo3+/+ and Fmo3−/− mice. (A) Beta diversity was analyzed using the Bray–Curtis dissimilarity matrix and plotted using non-metric multidimensional scaling (NMDS). PERMANOVA analysis shows that there are significant differences between groups. N = 4/group (B) Alpha diversity was measured with the Shannon Index and shows that TCDD-treated KO mice have significantly (p < 0.05, Mann–Whitney U test) higher alpha diversity than TCDD-treated WTs and corn oil-treated KOs. N = 4/group. (C) The cumulative relative abundance of the most abundant microbial genera (>2%, not rarefied). Each stacked color bar represents a different genus. Total diversity patterns revealed that TCDD-treated KO mice show significant reductions in Akkermansia and Allobaculum compared to all other groups. N = 4/group.
Metabolites 12 00364 g005
Figure 6. TCDD treatment significantly alters gut microbiota in an Fmo3-dependent manner. The 16S rRNA gene sequencing was conducted in cecal samples from vehicle and TCDD-treated Fmo3+/+ and Fmo3−/− mice. ASVs significantly different in abundance (White’s non-parametric t-test with Benjamini–Hochberg FDR multiple test correction, adjusted p ≤ 0.01). (A) Significantly different ASVs when comparing Fmo3+/+—vehicle treated versus Fmo3+/+—TCDD-treated. (B) Significantly different ASVs when comparing Fmo3+/+—TCDD-treated versus Fmo3−/−—TCDD-treated.
Metabolites 12 00364 g006
Figure 7. Gut Microbiome Alterations Correlate with Host Phenotypes. The 16S rRNA gene sequencing was conducted in cecal samples from vehicle and TCDD-treated Fmo3+/+ and Fmo3−/− mice. Linear regression (parametric) and Wilcoxon (non-parametric) tests were performed on amplicon sequence variant abundances against meta-data variable levels using their base functions in R. The correlations shown are analyses comparing the abundance of ASVs and key phenotypes under investigation including glucose tolerance test area under the curve—GTT (AUC), liver cytochrome P450 family 1 subfamily A member 1 (Cyp1a1) messenger RNA (mRNA) expression, and plasma trimethylamine N-oxide (TMAO) levels.
Metabolites 12 00364 g007
Figure 8. The Effects of TCDD Are Also Altered in Female Fmo3−/− Mice. Age-matched female Fmo3+/+ or Fmo3−/− mice were injected weekly with either corn oil vehicle or 25 µg/kg TCDD for 6 weeks. (AB) Quantitative PCR (qPCR) analysis for the aryl hydrocarbon receptor target gene Cytochrome P450 family 1 subfamily A member 1 (Cyp1a1) and flavin-containing monooxygenase 3 (Fmo3). (C) Plasma trimethylamine N-oxide (TMAO) levels. (D) Western blot of liver lsyates. N = 4 per group. All other data represent the mean ± S.E.M. from 5 to 7 mice per group. Data were analyzed using a 2-way ANOVA followed by a Tukey post hoc test.
Metabolites 12 00364 g008
Figure 9. Genetic Deficiency of Fmo3 Impairs Glucose Tolerance in a TCDD-Dependent Manner in Female Mice. Age-matched female Fmo3+/+ or Fmo3−/− mice were injected weekly with either corn oil vehicle or 25 µg/kg TCDD for 4 weeks. (A) Blood glucose was measured after a 4 h fast and then 15, 30, 60, and 120 min during an intraperitoneal glucose tolerance test (GTT). Data represent the mean ± S.E.M. from 5 to 8 mice per group. Data were analyzed using a 3-way ANOVA followed by a Tukey post hoc test. (B) Blood glucose was measured after 4 h of fasting. Data represent the mean ± S.E.M. from 5 to 8 mice per group. Data were analyzed using a 2-way ANOVA followed by a Tukey post hoc test. (C) The area under the curve (AUC) was measured for each animal over the course of the GTT. Data represent the mean ± S.E.M. from 5 to 8 mice per group. Data were analyzed using a 2-way ANOVA followed by a Tukey post hoc test. (DG) Levels of plasma hormones levels were quantified for (D) insulin, (E) glucagon, (F) active glucagon-like peptide 1 (GLP-1), and (G) peptide YY (PYY). Data represent the mean ± S.E.M. from 5 to 8 mice per group. Data were analyzed using a 2-way ANOVA followed by a Tukey post hoc test.
Metabolites 12 00364 g009
Figure 10. Summary of Findings. Collectively, the mRNA, protein, and TMAO-producing function of FMO3 are potently stimulated by TCDD exposure in mice. Both male and female Fmo3−/− mice exhibit glucose intolerance when exposed to TCDD, despite normal fasting metabolic hormone levels. Furthermore, TCDD exposure reorganizes the gut microbiome, and TCDD-driven microbiome reorganization is dramatically altered in Fmo3−/− mice. In addition, TCDD-driven expression of the AhR target (i.e., Cyp1a1), heme metabolism, pro-inflammatory, and pro-fibrotic genes is dysregulated in Fmo3−/− mice.
Metabolites 12 00364 g010
Table 1. Primer Sequences Used for Quantitative Real-Time PCR.
PrimerSequence (5′–3′)
Fmo3 FCCCACATGCTTTGAGAGGAG
Fmo3 RGGAAGAGTTGGTGAAGACCG
Cyp1a1 FCTGAAGGTGGTAGTTCTTGGAG
Cyp1a1 RCCATACATGGAAGGCATGATCTA
CycloA FGCGGCAGGTCCATCTACG
CycloA RGCCATCCAGCCATTCAGTC
Alas1 FCACTGTCCGAGTCACATCATC
Alas1 RTGATGGCCTGGACGTAGATA
Col1a1 FATGTTCAGCTTTGTGGACCTC
Col1a1 RCAGAAAGCACAGCACTCGC
IL-1b FAGTTGACGGACCCCAAAAG
IL-1b RAGCTGGATGCTCTCATCAGG
TNFa FCCACCACGCTCTTCTGTCTAC
TNFa RAGGGTCTGGGCCATAGAACT
IL-6 FGCTACCAAACTGGATATAATCAGGA
IL-6 RCCAGGTAGCTATGGTACTCCAGAA
Table 2. Antibody Used for Immunoblotting.
AntibodyVendorProduct #
FMO3Abcamab126790
HPXR&D SystemsAF7007
HPAbcamab256454
β-Actin HRPCell Signaling4970S
Rabbit HRPCell Signaling7074S
Publisher’s Note: MDPI stays neutral with regard to jurisdictional claims in published maps and institutional affiliations.

