
Metabolomic Abnormalities in Serum from Untreated and Treated Dogs with Hyper- and Hypoadrenocorticism

 , , , and
Abstract
:1. Introduction
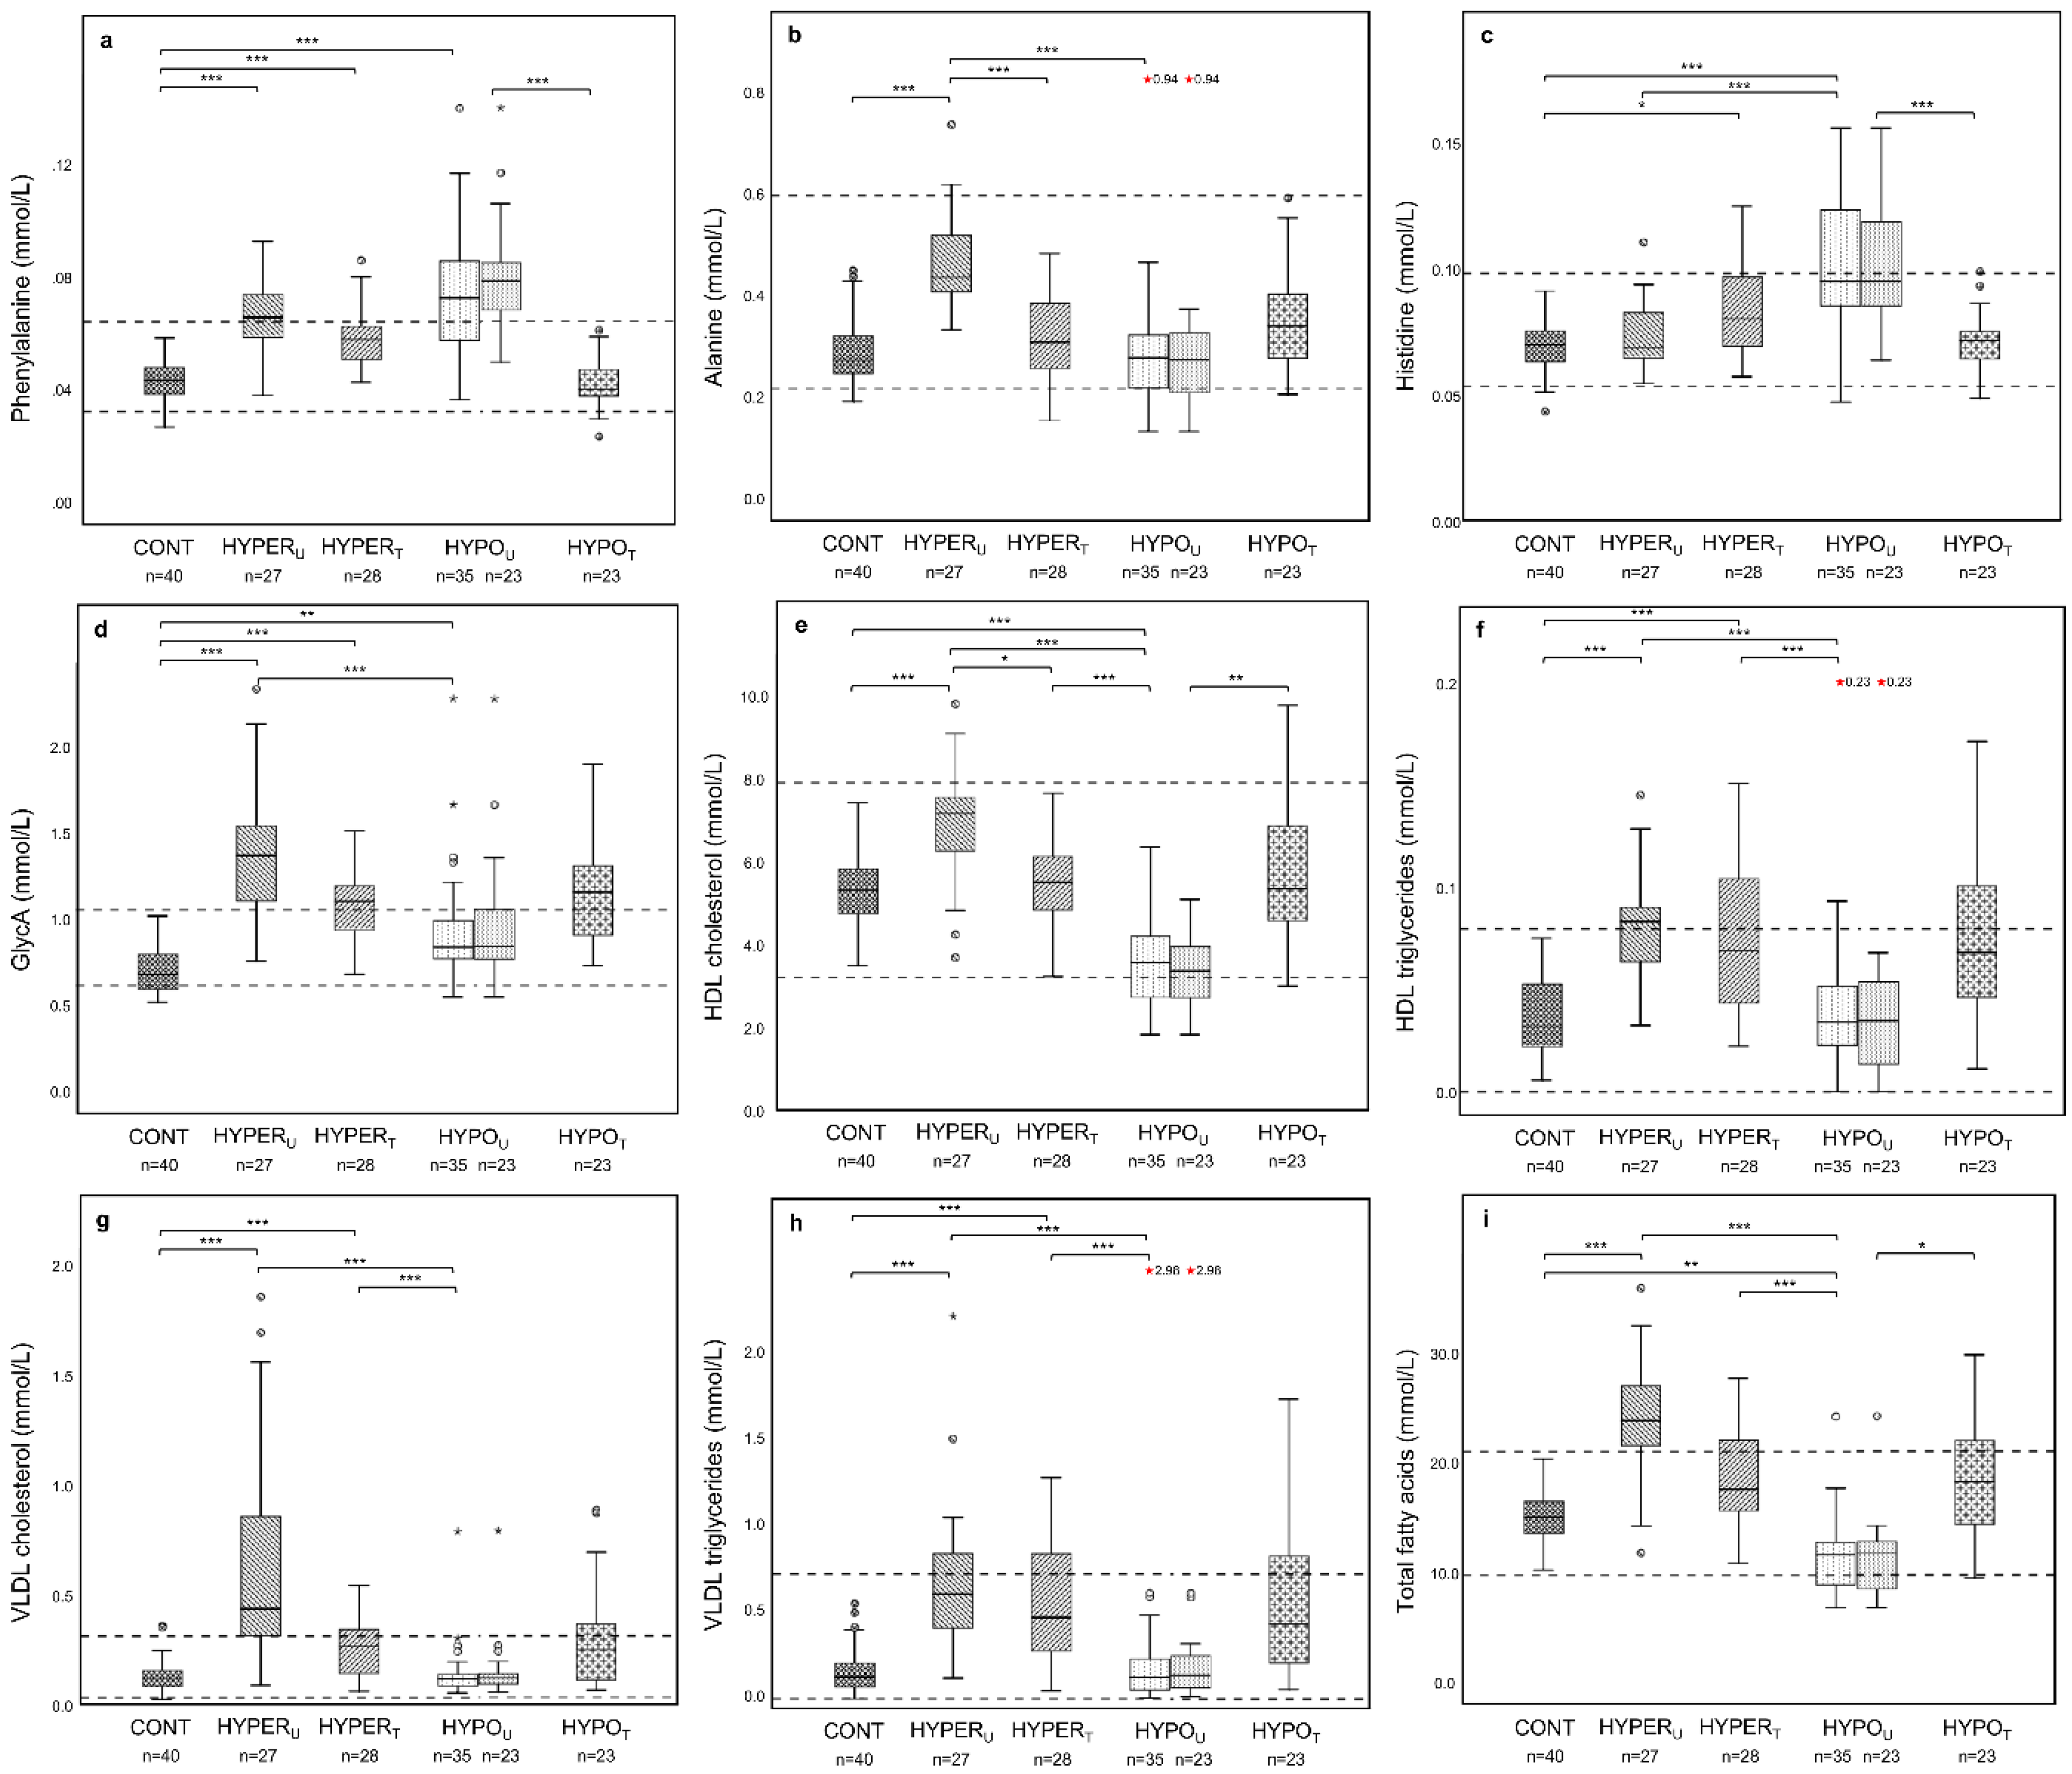
2. Results
2.1. Samples, Demographics, and Serum Cortisol Test Results
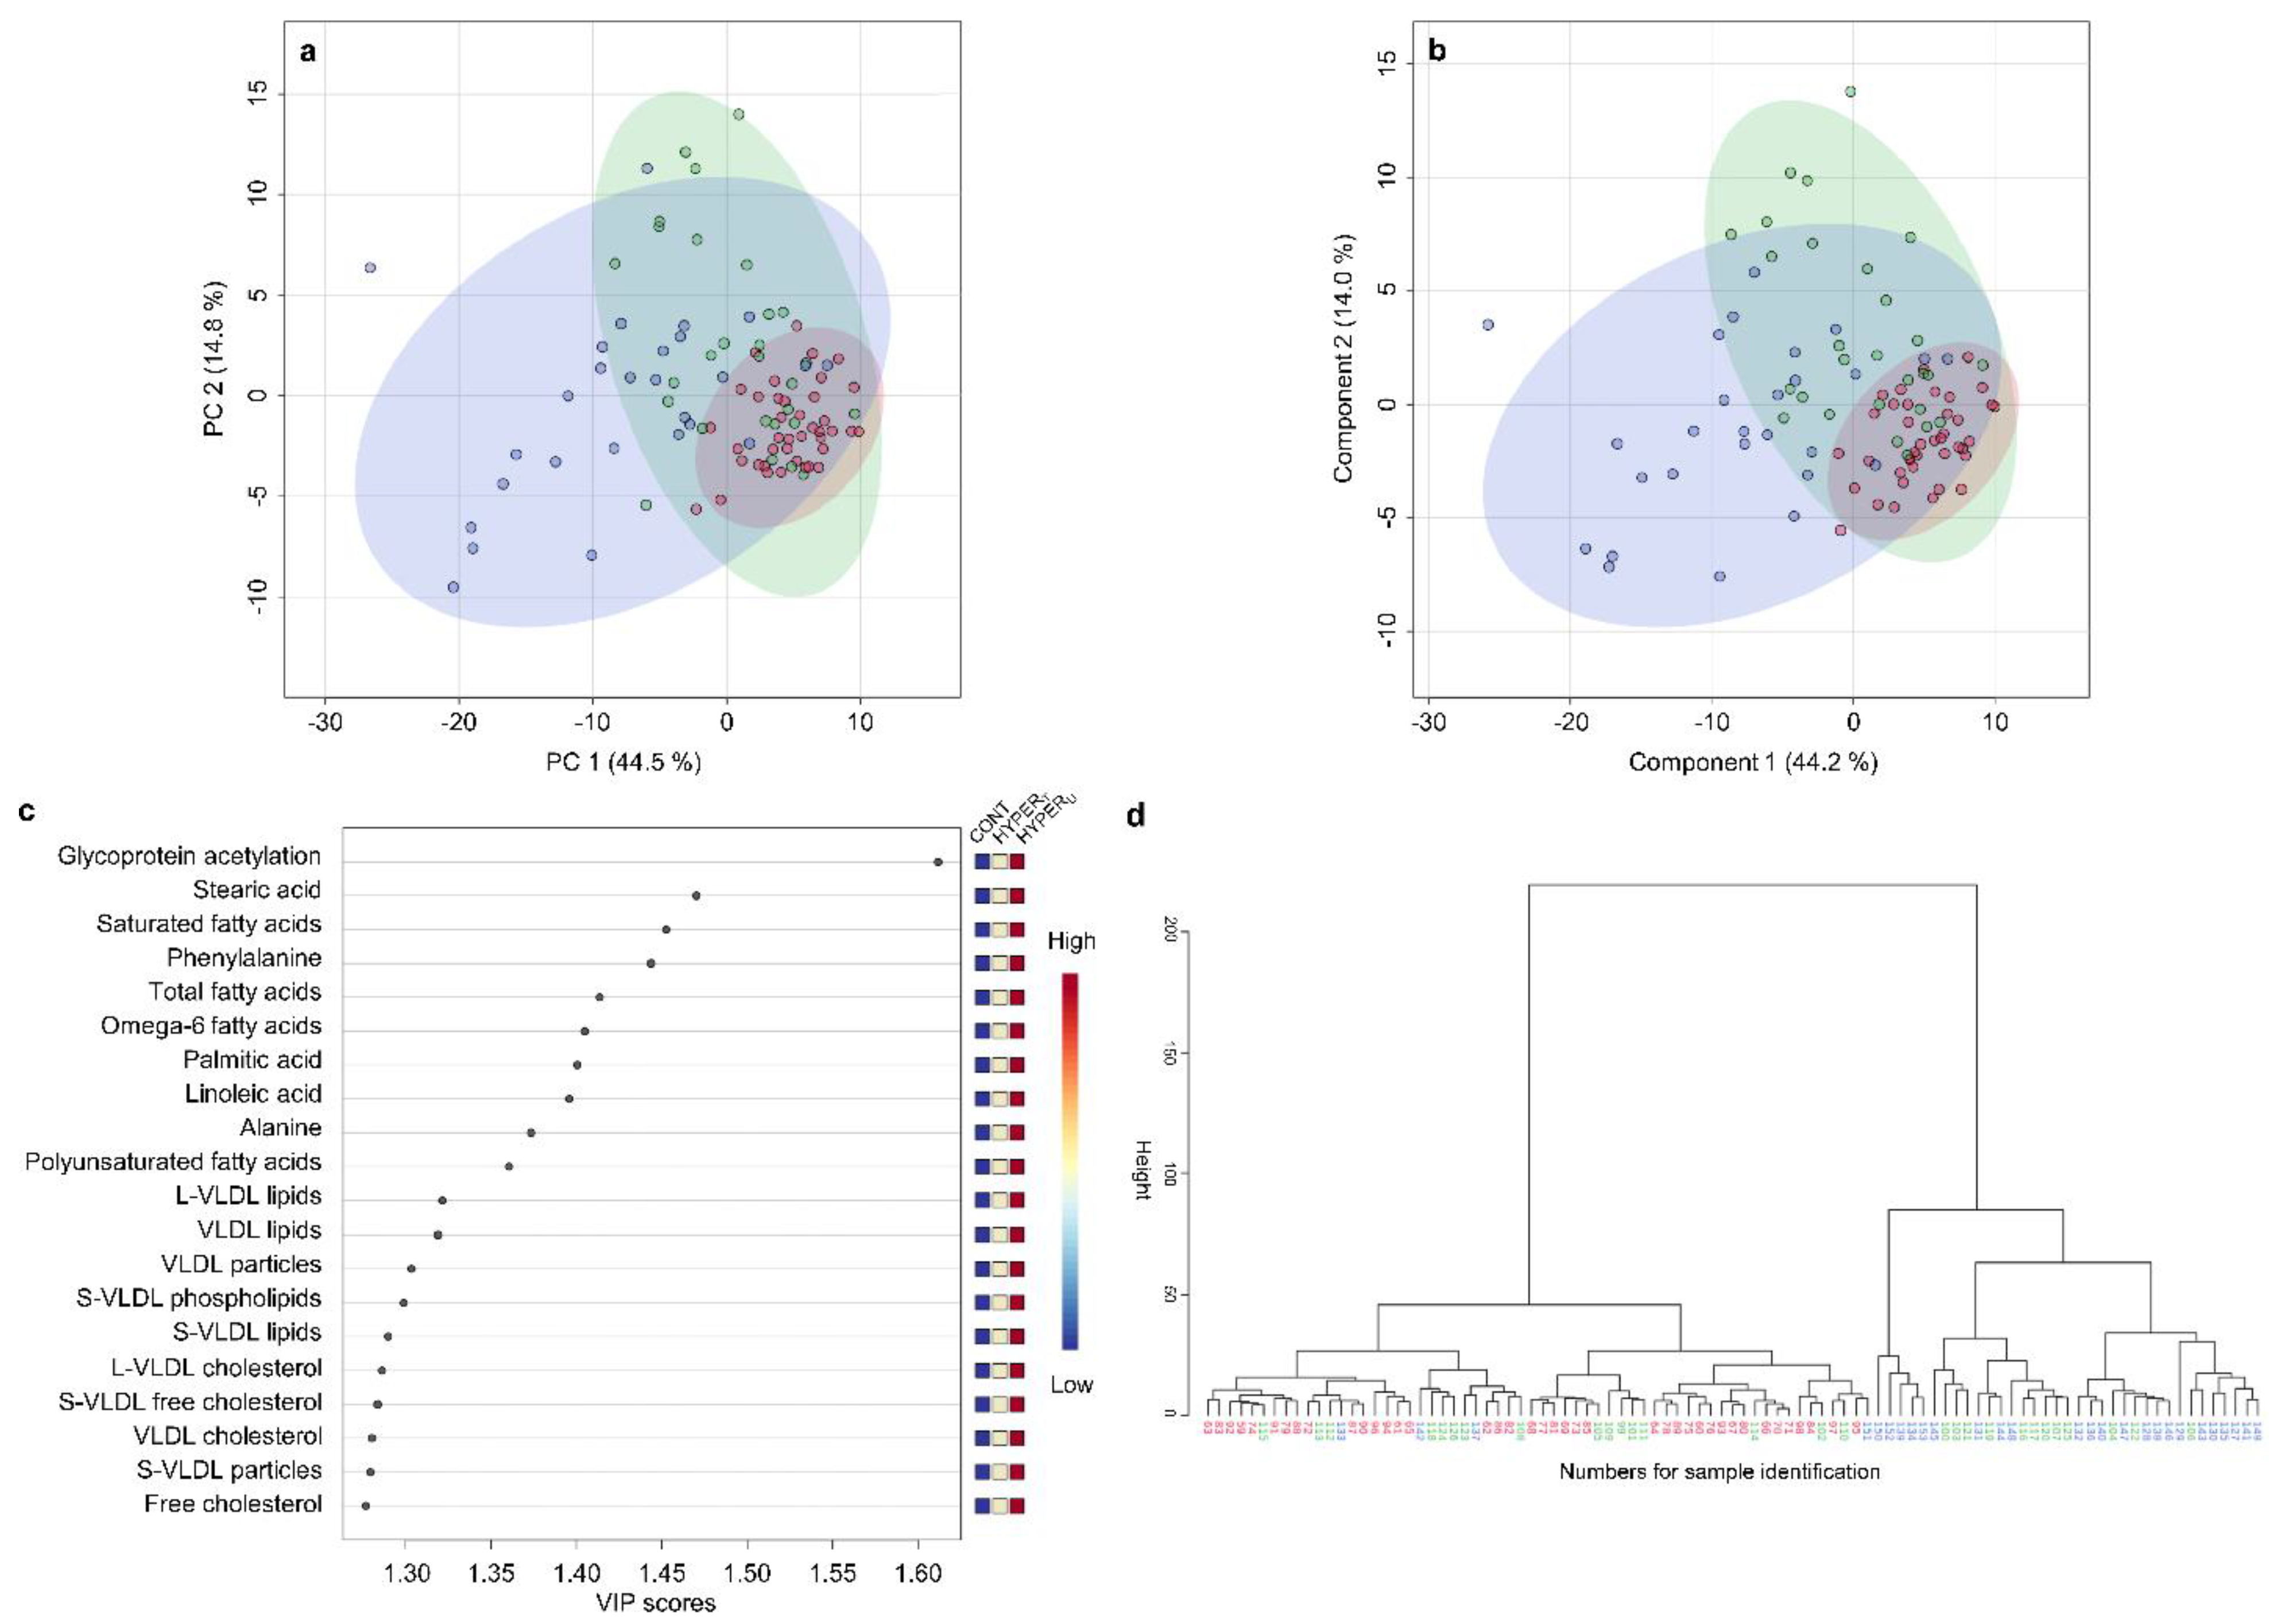
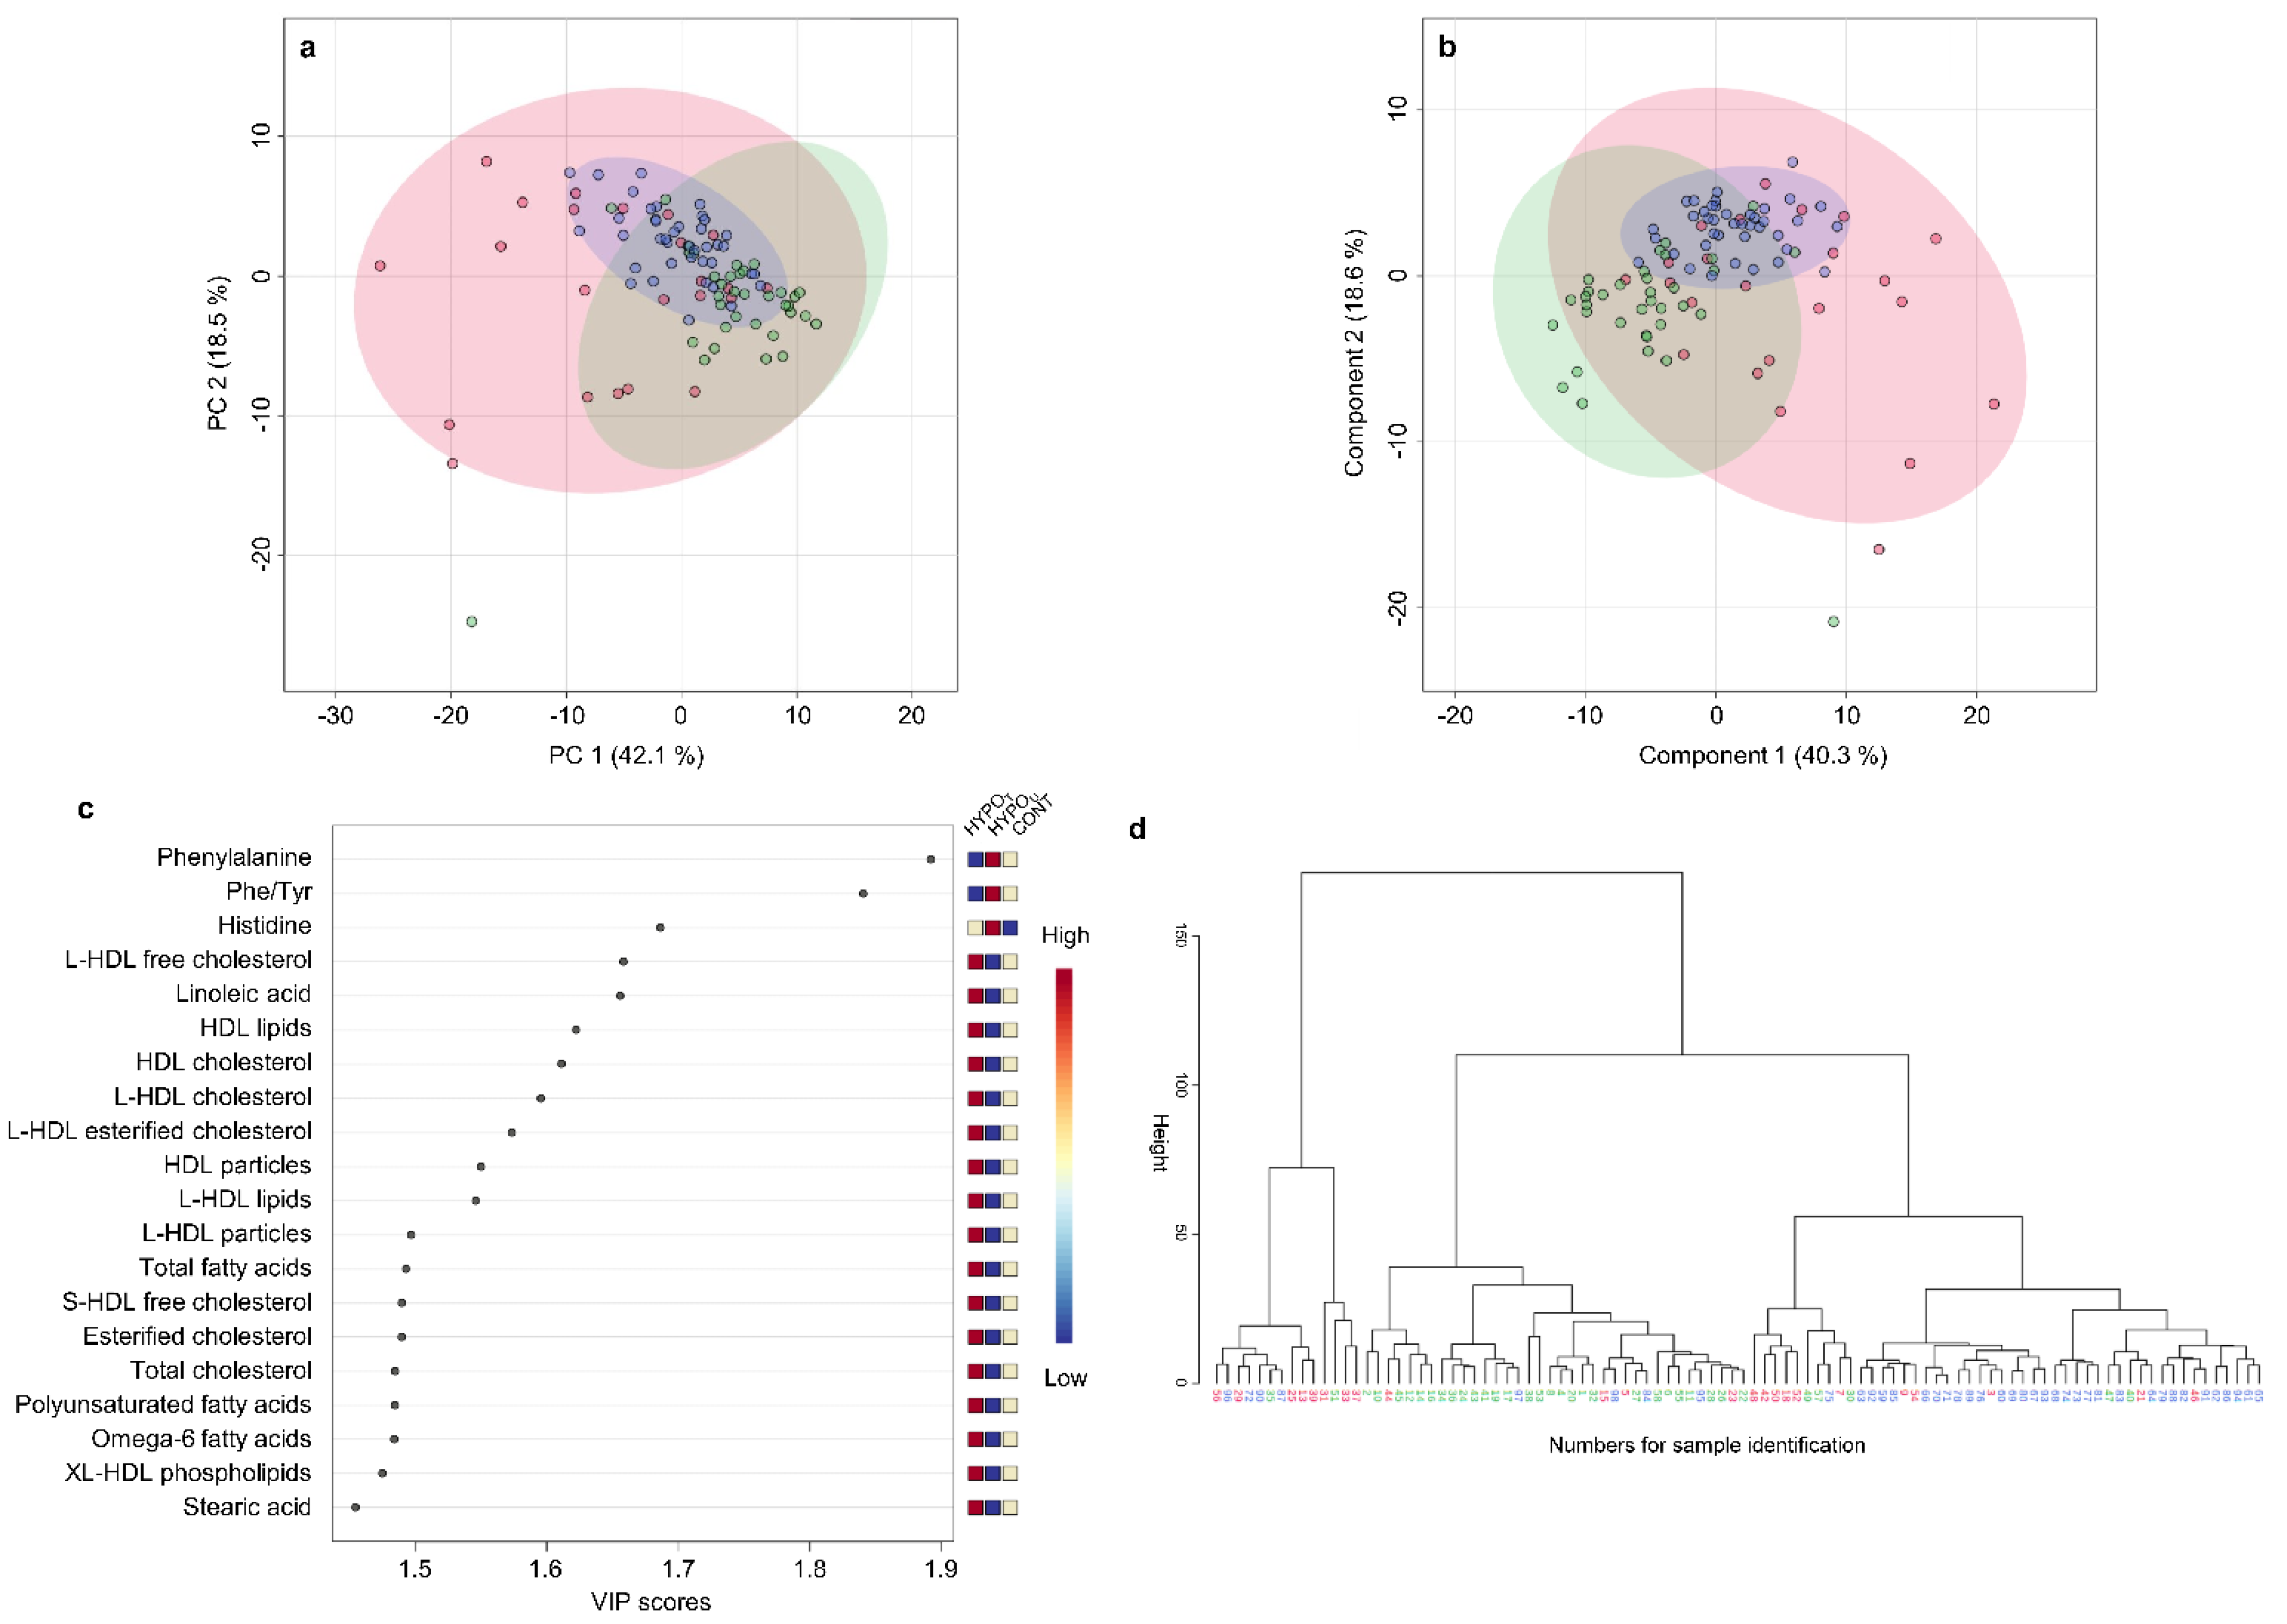
2.2. Metabolomic Analyses
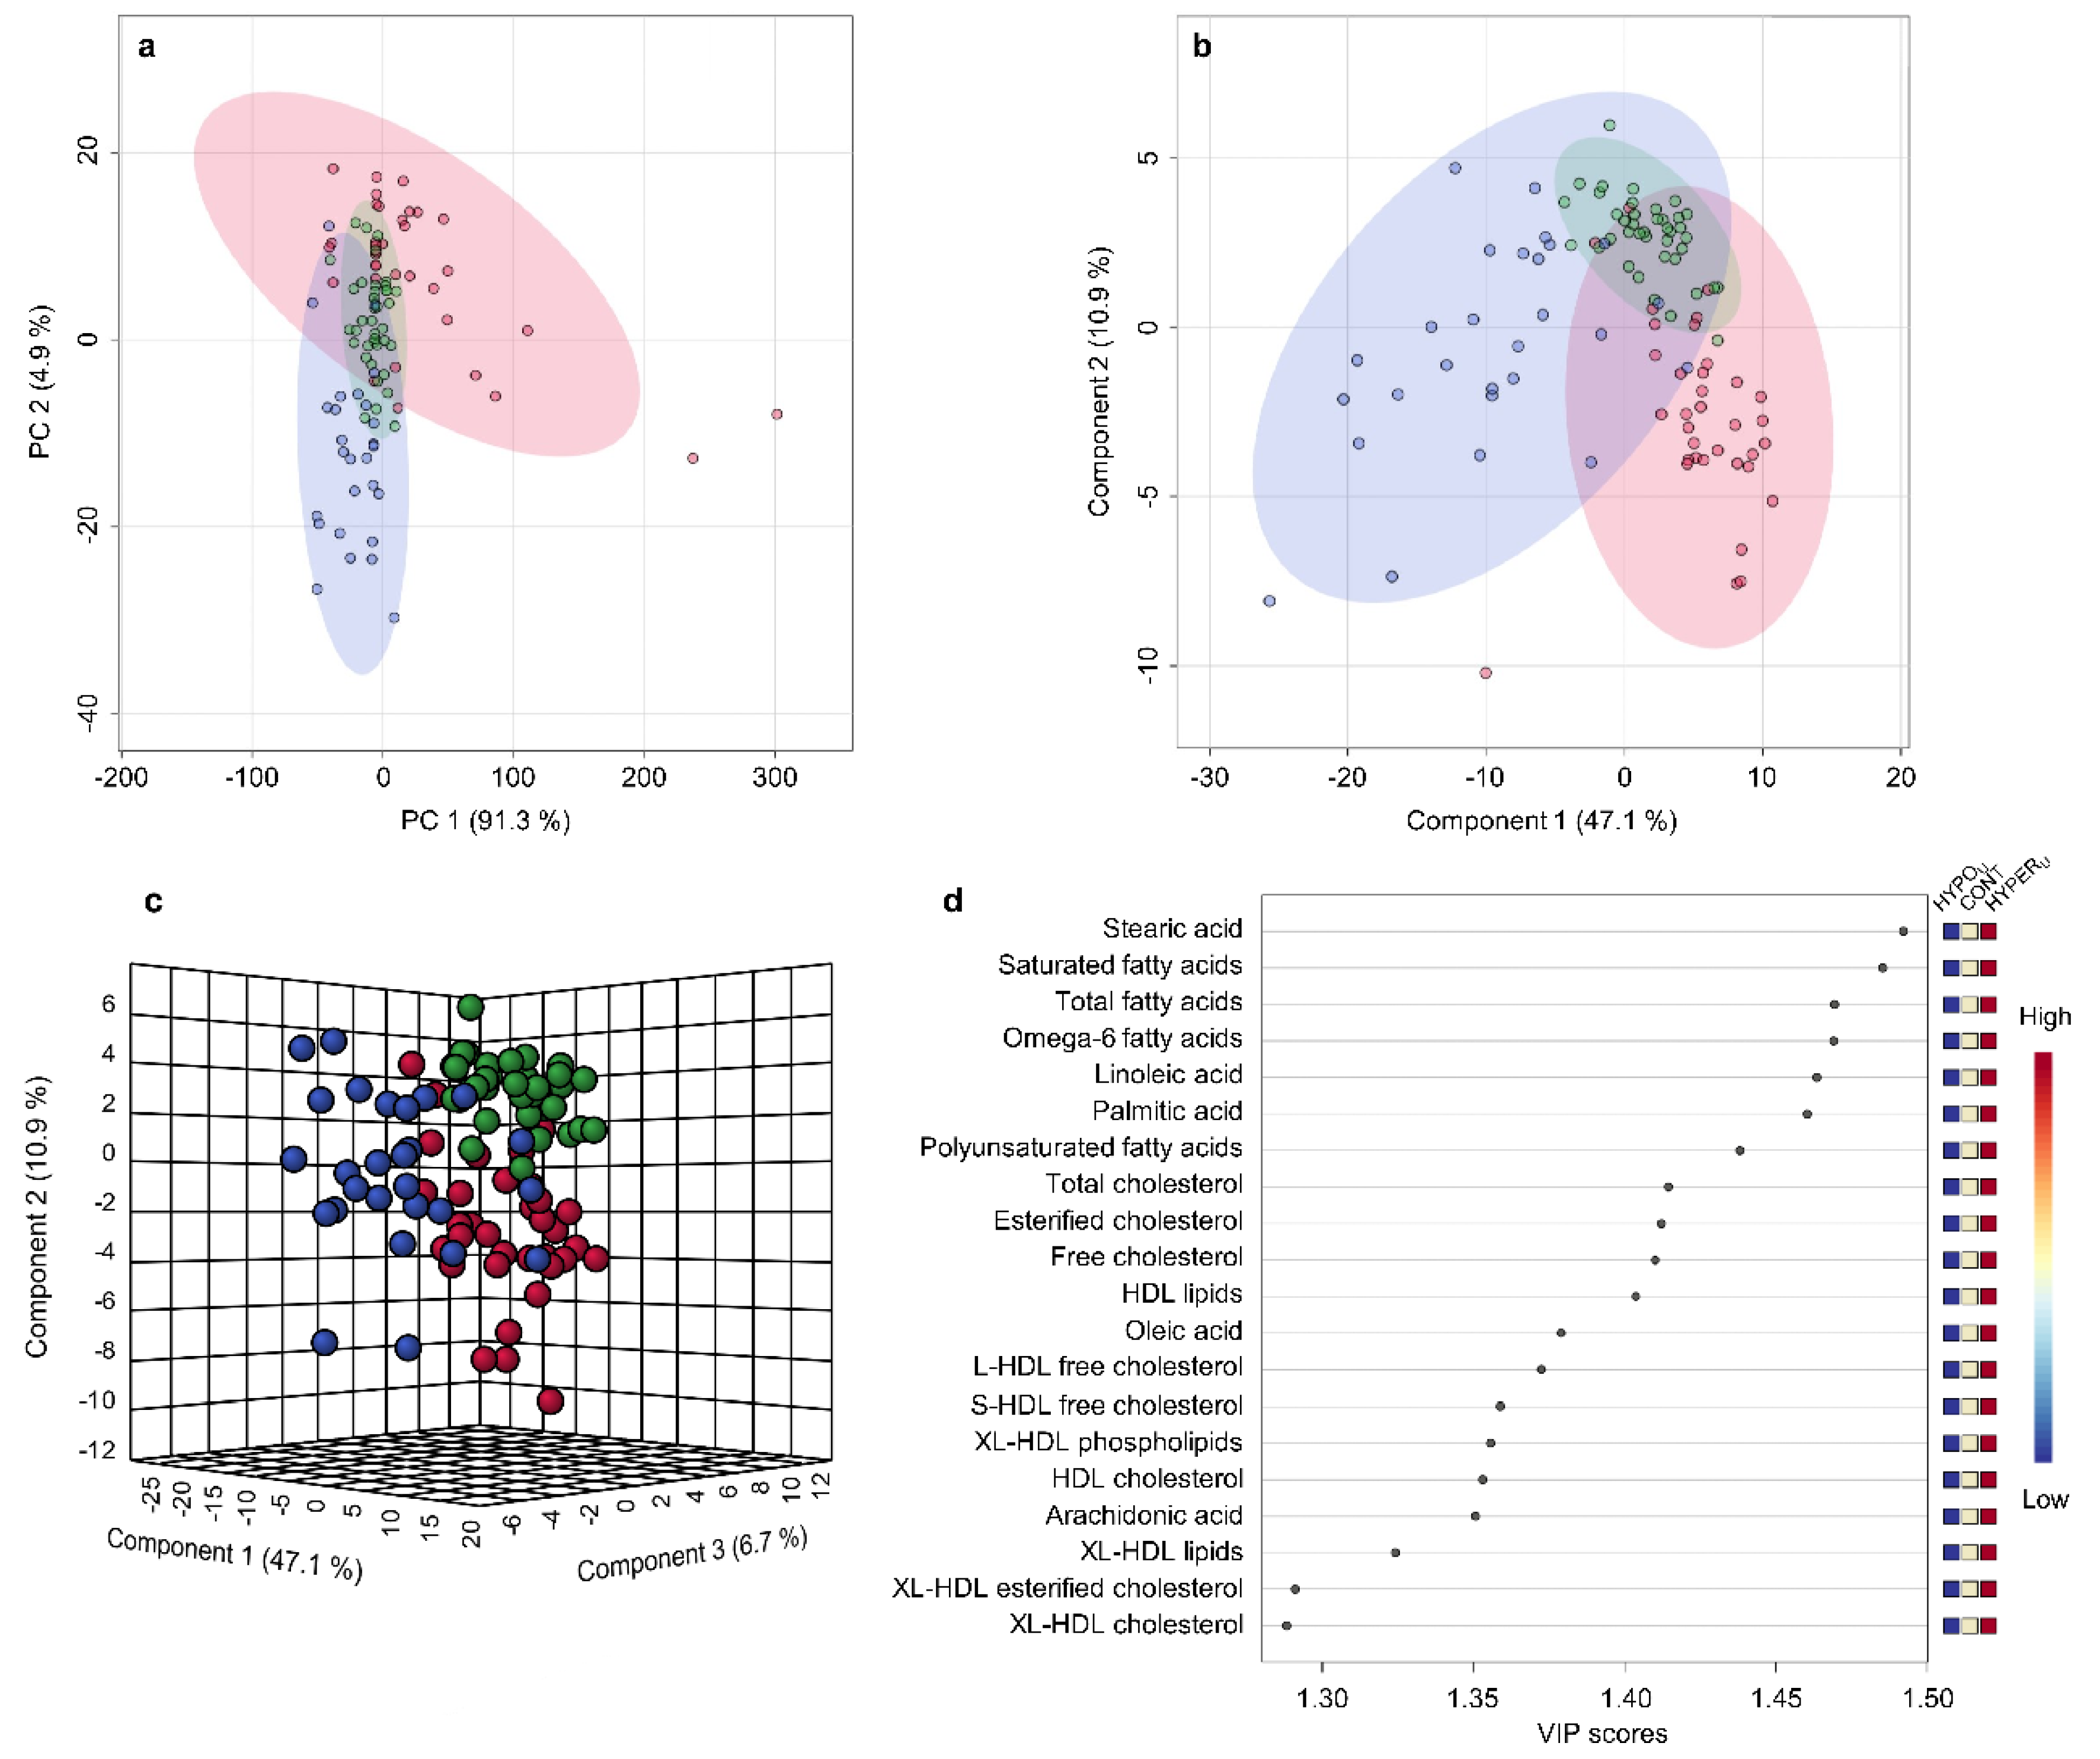
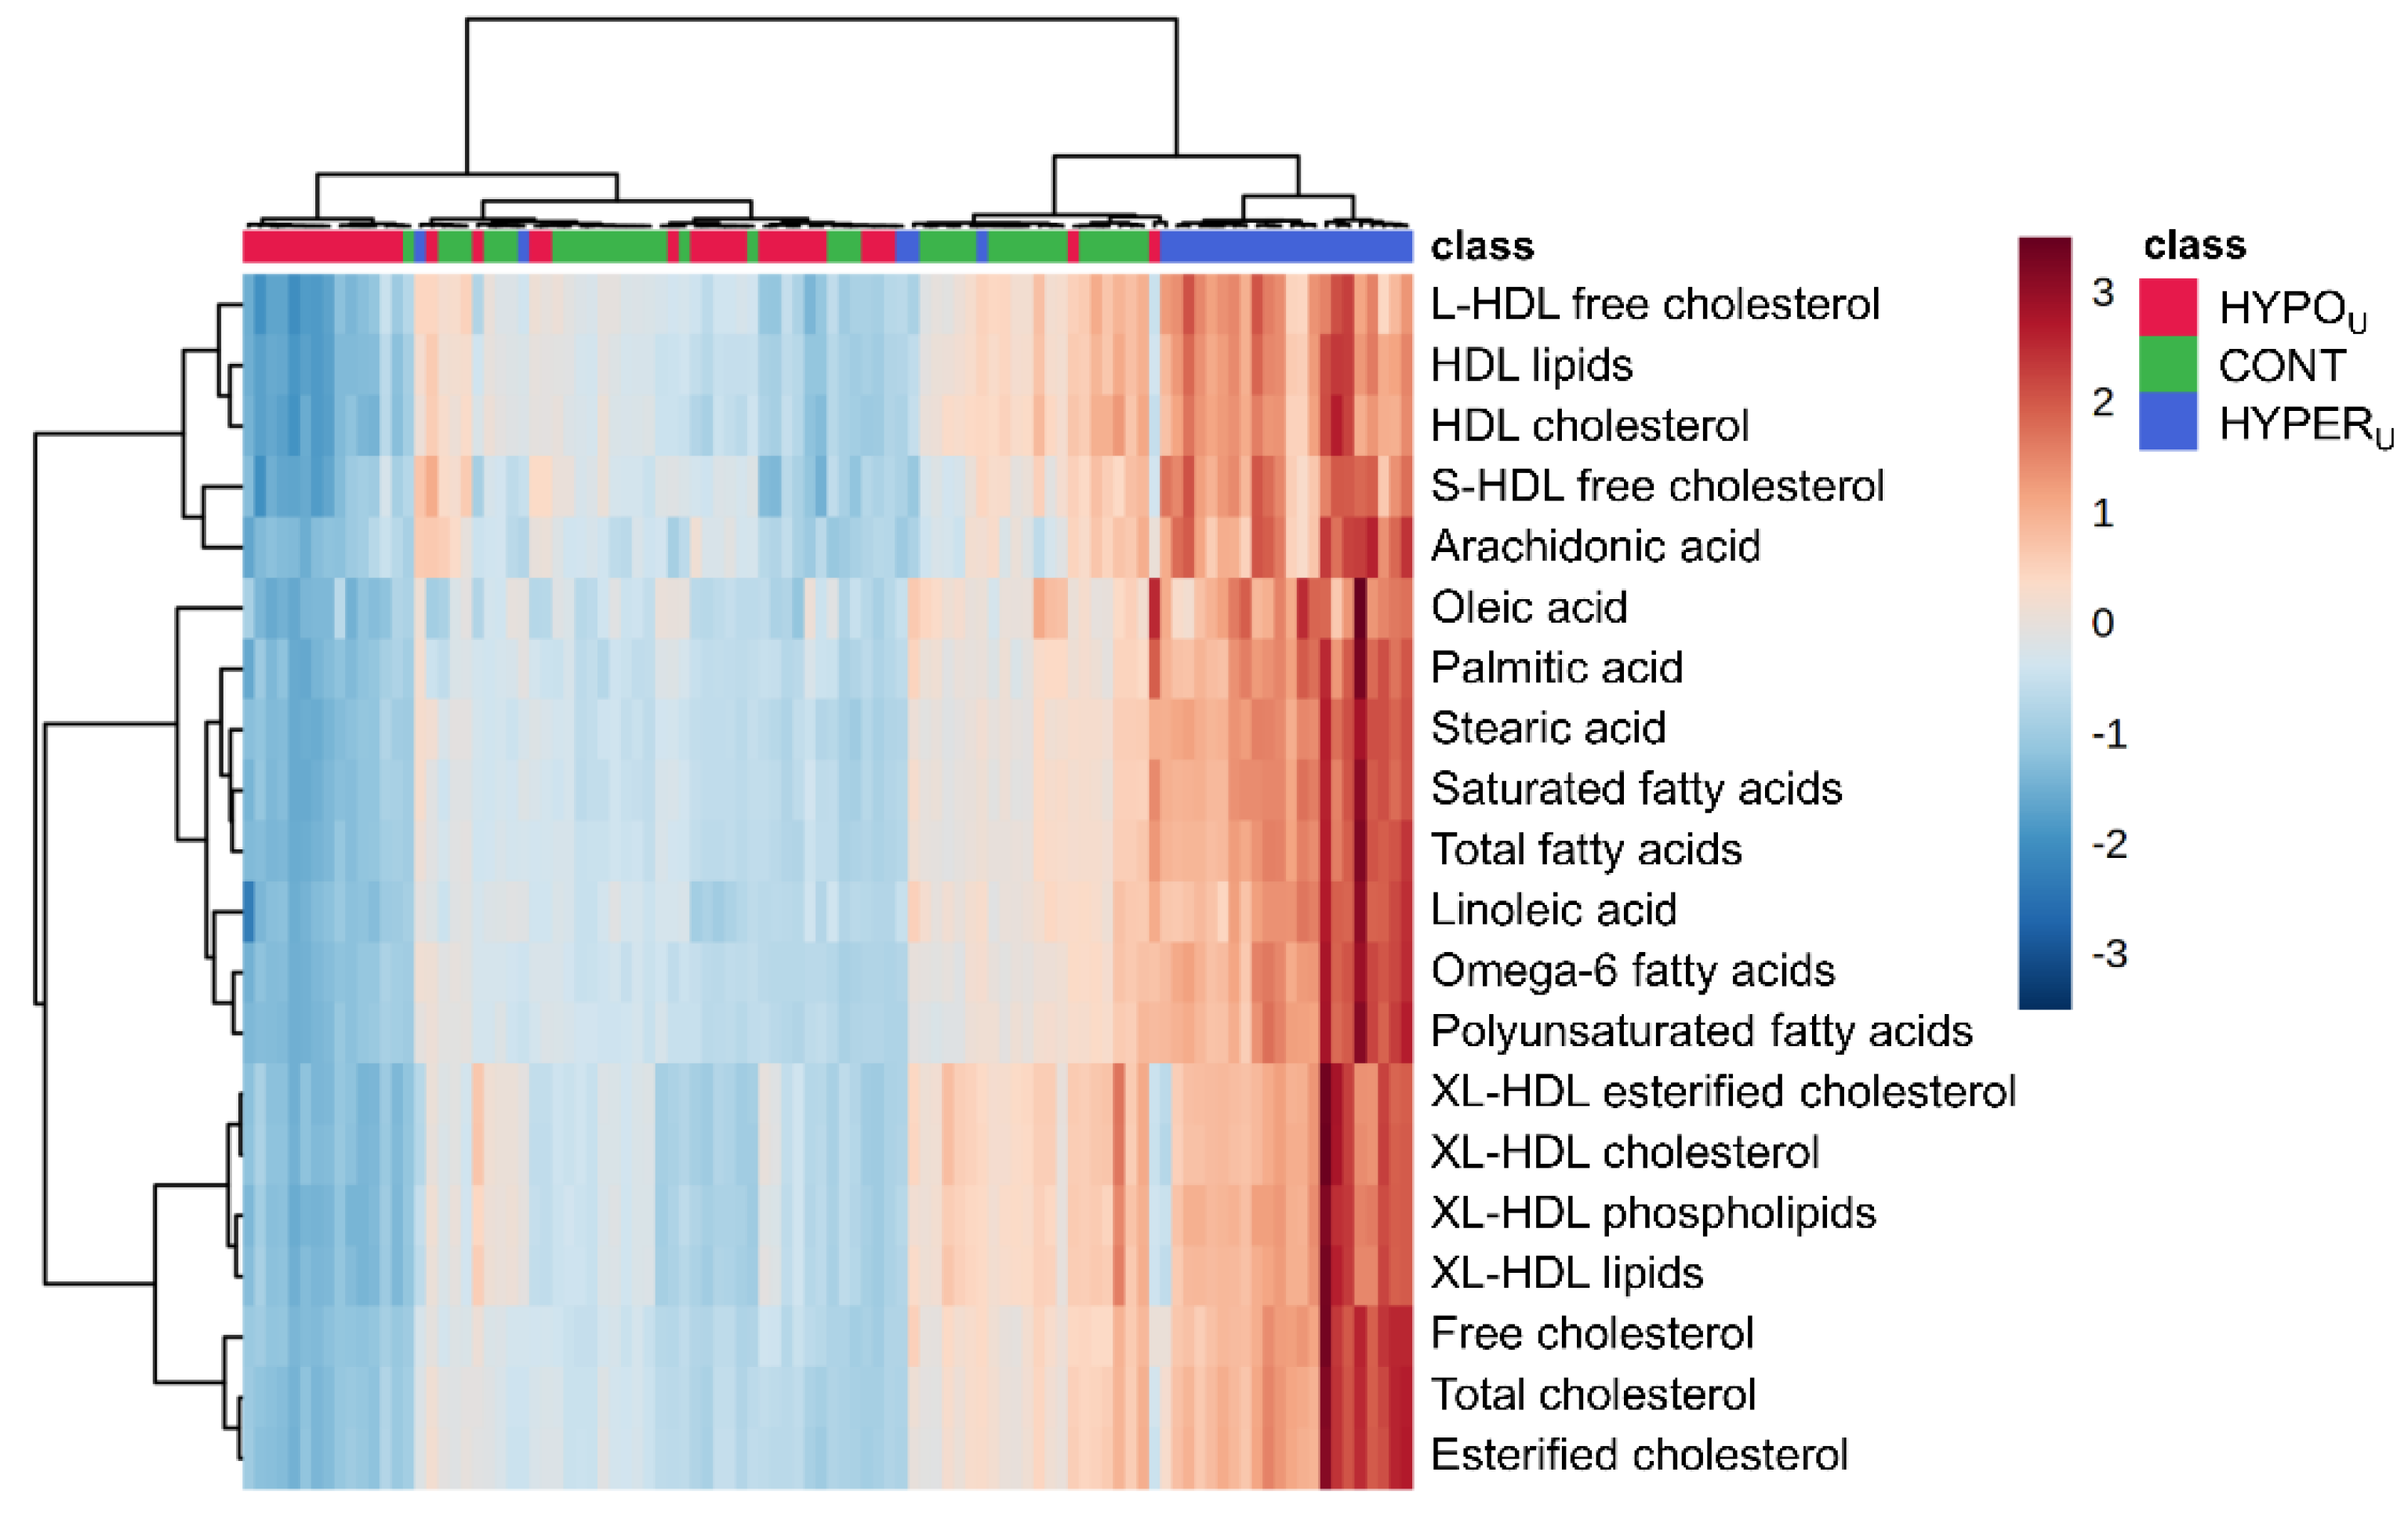
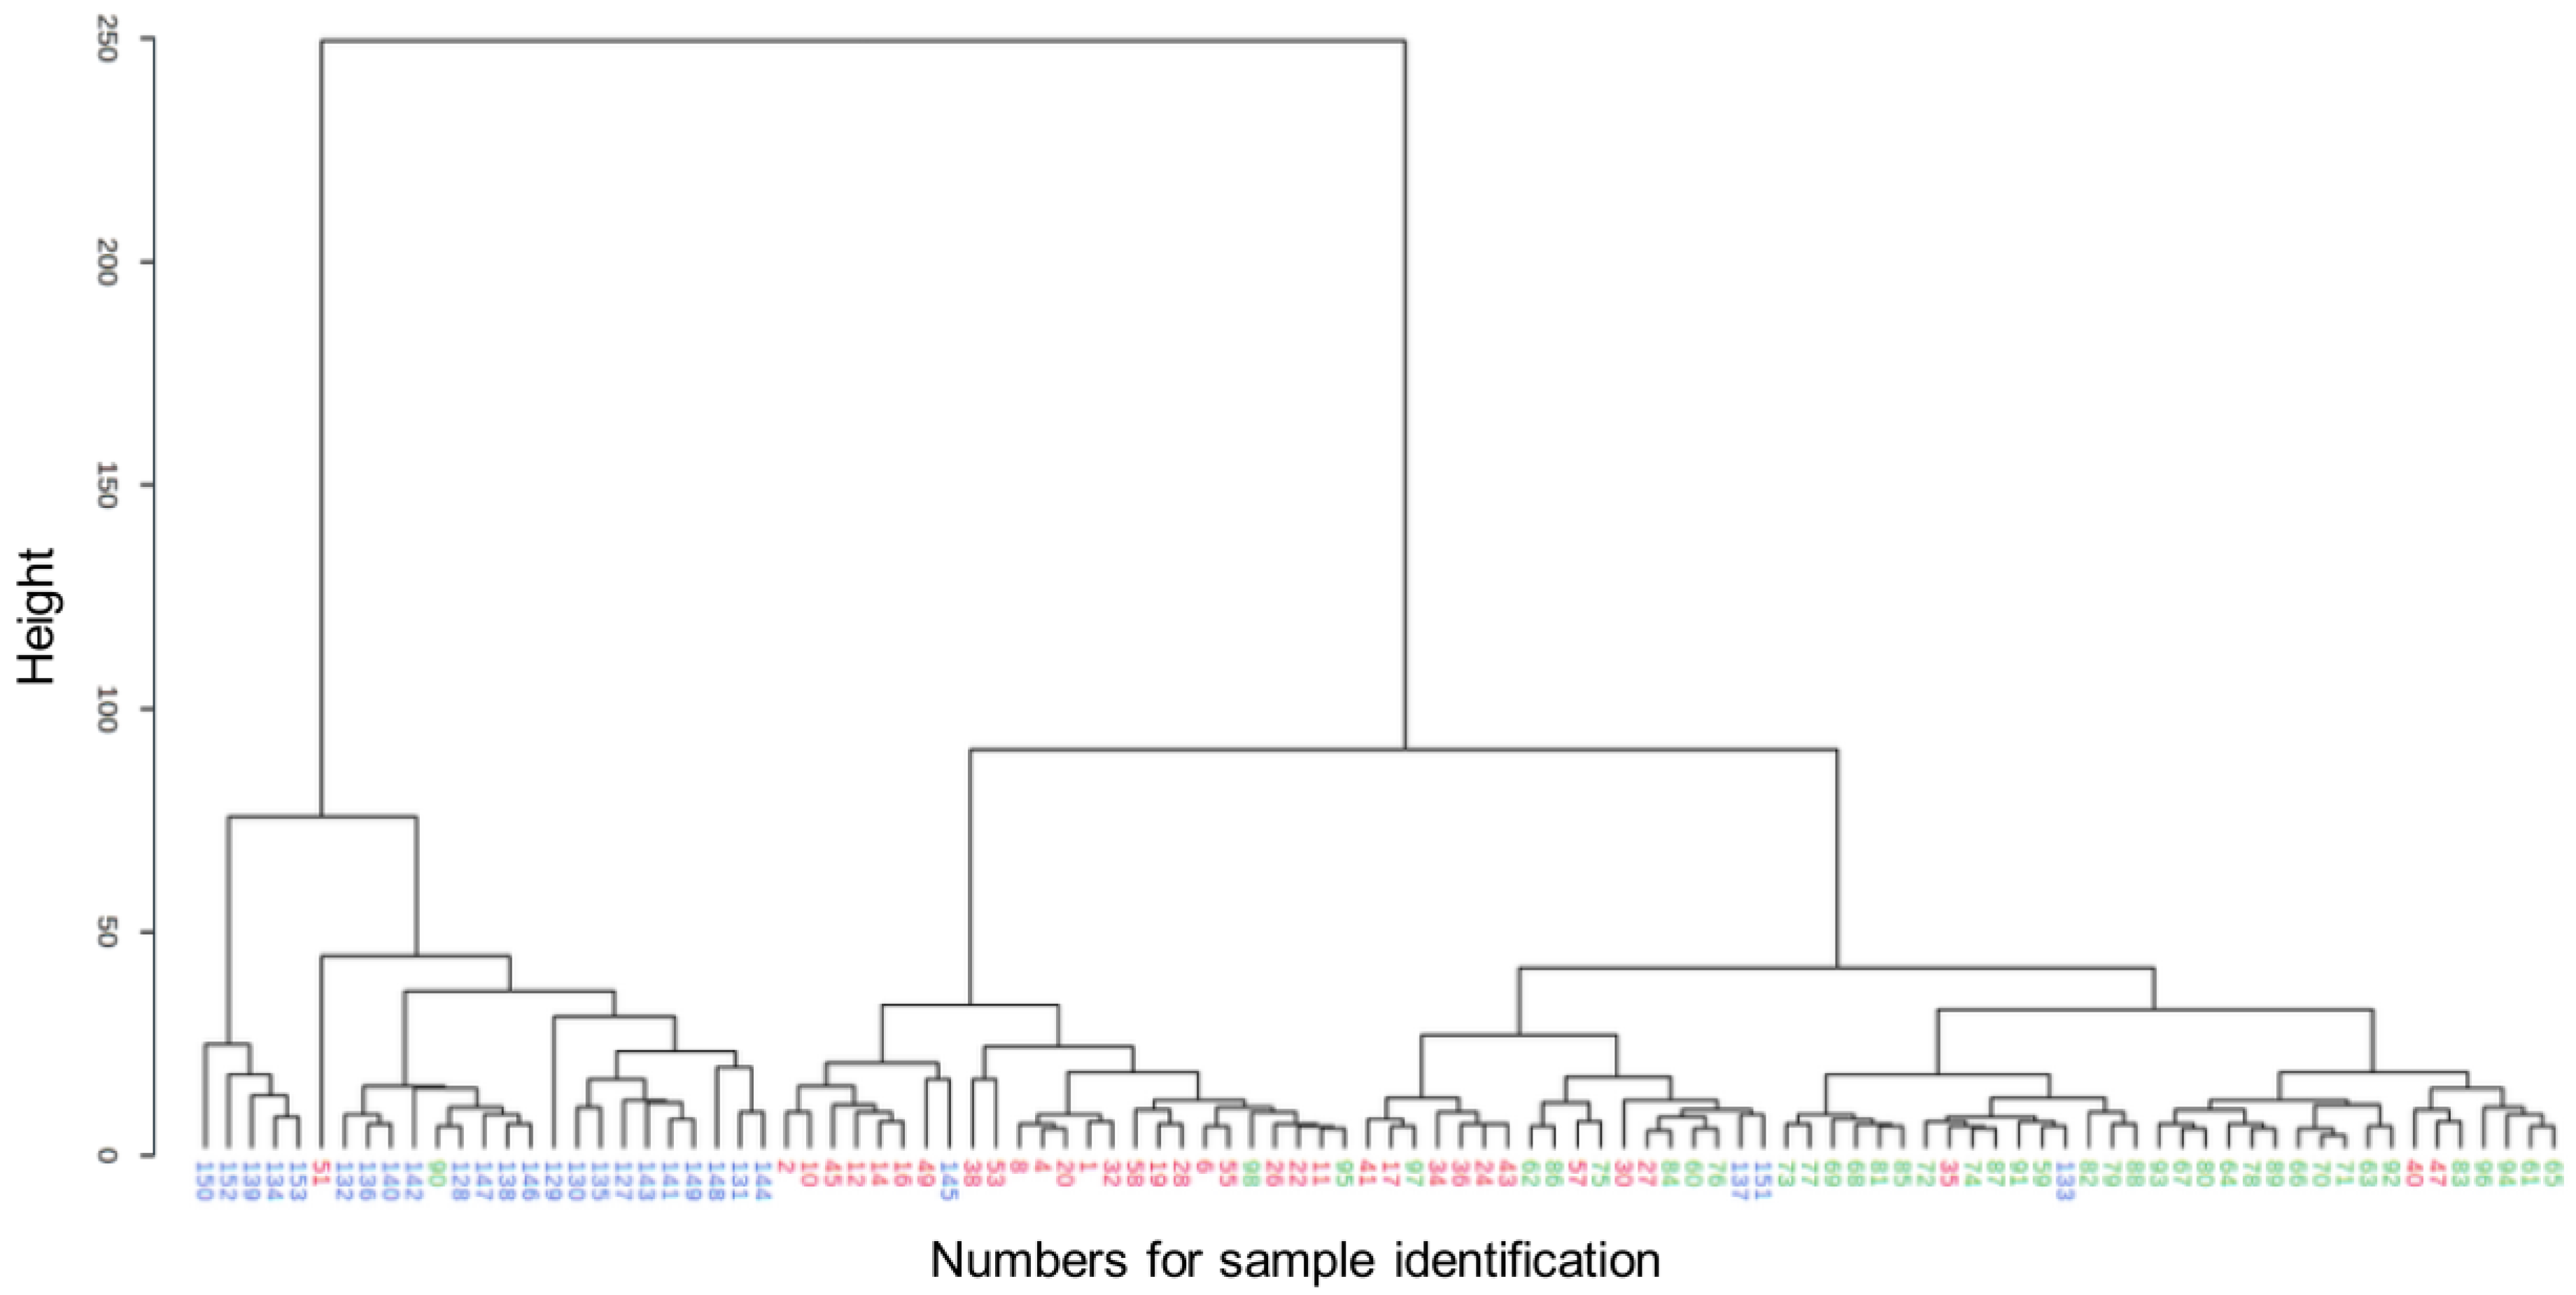
2.2.1. Metabolomic Comparison of HYPERU, HYPOU, and CONT Groups
2.2.2. Metabolomic Comparison of HYPERU, HYPERT, and CONT Groups
2.2.3. Metabolomic Comparison of HYPOU, HYPOT, and CONT Groups
3. Discussion
4. Materials and Methods
4.1. Samples and Groups
- HYPERT group—samples from treated dogs with hyperadrenocorticism and serum cortisol concentrations of <20 ng/mL (<2 µg/dL) in pre- and post-ACTH-ST samples. All HYPERT dogs were different from the HYPERU dogs (unpaired samples).
- HYPOU group—samples with low serum cortisol concentrations of <10 ng/mL (<1 µg/dL) in both pre- and post-ACTH-ST samples consistent with a diagnosis of hypoadrenocorticism [8].
- HYPOT group—samples from dogs in the HYPOU group mentioned above were examined once during treatment for at least two weeks. For those dogs, routine blood testing during treatment was offered to attending clinicians (free of charge), and the left-over serum sample was used for the metabolomic study (paired samples).
- CONT group—samples from adult dogs with serum chemistry panel and CBC results in the reference intervals. All serum samples from apparently healthy dogs were also part of the control group in our recent metabolomic study on canine hepatopathies [20]. No metabolomic differences were observed between two age-dependent CONT subgroups (dogs < 6 yrs old vs. dogs ≥ 6 yrs old) by univariate testing with Kruskal–Wallis test adjusted with Bonferroni correction and by PCA of their serum metabolomics data (Supplementary Figure S1). Thus, to simplify the presentation the control dogs were combined to one CONT group for bioinformatic analyses of the metabolomics data.
4.2. Serum Metabolomic Analyses
4.3. Statistical Analysis
4.3.1. Univariate Analyses
4.3.2. Multivariate Analyses
5. Conclusions
Supplementary Materials
Author Contributions
Funding
Institutional Review Board Statement
Informed Consent Statement
Data Availability Statement
Acknowledgments
Conflicts of Interest
References
- Kemppainen, R.J.; Behrend, E. Adrenal physiology. Vet. Clin. North Am. Small Anim. Pract. 1997, 27, 173–186. [Google Scholar] [CrossRef]
- Hall, J.E.; Hall, M.E. Guyton and Hall Textbook of Medical Physiology, 14th ed.; Elsevier Saunders: Philadelphia, PA, USA, 2021; ISBN 978-0-323-59712-8. [Google Scholar]
- Greco, D.S. Hypoadrenocorticism in small animals. Clin. Tech. Small Anim. Pract. 2007, 22, 32–35. [Google Scholar] [CrossRef] [PubMed] [Green Version]
- Merchant, S.R.; Taboada, J. Endocrinopathies: Thyroid and adrenal disorders. Vet. Clin. North Am. Small Anim. Pract. 1997, 27, 1285–1303. [Google Scholar] [CrossRef]
- Charmandari, E.; Nicolaides, N.C.; Chrousos, G.P. Adrenal insufficiency. Lancet 2014, 383, 2152–2167. [Google Scholar] [CrossRef]
- Arnaldi, G.; Angeli, A.; Atkinson, A.B.; Bertagna, X.; Cavagnini, F.; Chrousos, G.P.; Fava, G.A.; Findling, J.W.; Gaillard, R.C.; Grossman, A.B.; et al. Diagnosis and complications of Cushing’s syndrome: A consensus statement. J. Clin. Endocrinol. Metab. 2003, 88, 5593–5602. [Google Scholar] [CrossRef] [Green Version]
- Behrend, E.N. Canine Hyperadrenocorticism. In Canine and Feline Endocrinology, 4th ed.; Feldman, E.C., Nelson, R.W., Reusch, C., Scott-Moncrieff, J.C., Eds.; Elsevier: St. Louis, MO, USA, 2015; pp. 377–451. ISBN 9781455744565. [Google Scholar]
- Scott-Moncrieff, J.C. Hypoadrenocorticism. In Canine and Feline Endocrinology, 4th ed.; Feldman, E.C., Nelson, R.W., Reusch, C., Scott-Moncrieff, J.C., Eds.; Elsevier: St. Louis, MO, USA, 2015; pp. 485–520. ISBN 9781455744565. [Google Scholar]
- Melián, C.; Peterson, M.E. Diagnosis and treatment of naturally occurring hypoadrenocorticism in 42 dogs. J. Small Anim. Pract. 1996, 37, 268–275. [Google Scholar] [CrossRef]
- Peterson, M.E.; Kintzer, P.P.; Kass, P.H. Pretreatment clinical and laboratory findings in dogs with hypoadrenocorticism: 225 cases (1979–1993). J. Am. Vet. Med. Assoc. 1996, 208, 85–91. [Google Scholar]
- Muñoz-Prieto, A.; Rubić, I.; Horvatic, A.; Rafaj, R.B.; Cerón, J.J.; Tvarijonaviciute, A.; Mrljak, V. Metabolic profiling of serum from dogs with pituitary-dependent hyperadrenocorticism. Res. Vet. Sci. 2021, 138, 161–166. [Google Scholar] [CrossRef]
- Di Dalmazi, G.; Quinkler, M.; Deutschbein, T.; Prehn, C.; Rayes, N.; Kroiss, M.; Berr, C.M.; Stalla, G.; Fassnacht, M.; Adamski, J.; et al. Cortisol-related metabolic alterations assessed by mass spectrometry assay in patients with Cushing’s syndrome. Eur. J. Endocrinol. 2017, 177, 227–237. [Google Scholar] [CrossRef] [Green Version]
- Vega-Beyhart, A.; Iruarrizaga, M.; Pané, A.; García-Eguren, G.; Giró, O.; Boswell, L.; Aranda, G.; Flores, V.; Casals, G.; Alonso, C.; et al. Endogenous cortisol excess confers a unique lipid signature and metabolic network. J. Mol. Med. 2021, 99, 1085–1099. [Google Scholar] [CrossRef]
- Chantzichristos, D.; Svensson, P.-A.; Garner, T.; Glad, C.A.; Walker, B.R.; Bergthorsdottir, R.; Ragnarsson, O.; Trimpou, P.; Stimson, R.H.; Borresen, S.W.; et al. Identification of human glucocorticoid response markers using integrated multi-omic analysis from a randomized crossover trial. Elife 2021, 10, e62236. [Google Scholar] [CrossRef]
- Nguyen, L.S.; Prifti, E.; Ichou, F.; Leban, M.; Funck-Brentano, C.; Touraine, P.; Salem, J.-E.; Bachelot, A. Effect of congenital adrenal hyperplasia treated by glucocorticoids on plasma metabolome: A machine-learning-based analysis. Sci. Rep. 2020, 10, 8859. [Google Scholar] [CrossRef] [PubMed]
- Alwashih, M.A.; Watson, D.G.; Andrew, R.; Stimson, R.H.; Alossaimi, M.; Blackburn, G.; Walker, B.R. Plasma metabolomic profile varies with glucocorticoid dose in patients with congenital adrenal hyperplasia. Sci. Rep. 2017, 7, 17092. [Google Scholar] [CrossRef] [PubMed] [Green Version]
- Hollywood, K.; Brison, D.R.; Goodacre, R. Metabolomics: Current technologies and future trends. Proteomics 2006, 6, 4716–4723. [Google Scholar] [CrossRef] [PubMed]
- Dunn, W.B.; Broadhurst, D.I.; Atherton, H.J.; Goodacre, R.; Griffin, J.L. Systems level studies of mammalian metabolomes: The roles of mass spectrometry and nuclear magnetic resonance spectroscopy. Chem. Soc. Rev. 2011, 40, 387–426. [Google Scholar] [CrossRef]
- Ottka, C.; Vapalahti, K.; Puurunen, J.; Vahtera, L.; Lohi, H. A novel canine nuclear magnetic resonance spectroscopy-based metabolomics platform: Validation and sample handling. Vet. Clin. Pathol. 2021, 50, 410–426. [Google Scholar] [CrossRef]
- Imbery, C.A.; Dieterle, F.; Ottka, C.; Weber, C.; Schlotterbeck, G.; Müller, E.; Lohi, H.; Giger, U. Metabolomic serum abnormalities in dogs with hepatopathies. Sci. Rep. 2022, 12, 5329. [Google Scholar] [CrossRef]
- Bennaim, M.; Shiel, R.E.; Mooney, C.T. Diagnosis of spontaneous hyperadrenocorticism in dogs. Part 1: Pathophysiology, aetiology, clinical and clinicopathological features. Vet. J. 2019, 252, 105342. [Google Scholar] [CrossRef]
- Thompson, A.L.; Scott-Moncrieff, J.C.; Anderson, J.D. Comparison of classic hypoadrenocorticism with glucocorticoid-deficient hypoadrenocorticism in dogs: 46 cases (1985–2005). J. Am. Vet. Med. Assoc. 2007, 230, 1190–1194. [Google Scholar] [CrossRef]
- Jericó, M.M.; de Camargo Chiquito, F.; Kajihara, K.; Moreira, M.A.B.; Gonzales, R.; Machado, F.L.A.; Nunes, V.S.; Catanozi, S.; Nakandakare, E.R. Chromatographic analysis of lipid fractions in healthy dogs and dogs with obesity or hyperadrenocorticism. J. Vet. Diagn. Investig. 2009, 21, 203–207. [Google Scholar] [CrossRef] [Green Version]
- Arnaldi, G.; Scandali, V.M.; Trementino, L.; Cardinaletti, M.; Appolloni, G.; Boscaro, M. Pathophysiology of dyslipidemia in Cushing’s syndrome. Neuroendocrinology 2010, 92, 86–90. [Google Scholar] [CrossRef]
- Mancini, T.; Kola, B.; Mantero, F.; Boscaro, M.; Arnaldi, G. High cardiovascular risk in patients with Cushing’s syndrome according to 1999 WHO/ISH guidelines. Clin. Endocrinol. 2004, 61, 768–777. [Google Scholar] [CrossRef] [PubMed]
- Zimmerman, J.; Fainaru, M.; Eisenberg, S. The effects of prednisone therapy on plasma lipoproteins and apolipoproteins: A prospective study. Metabolism 1984, 33, 521–526. [Google Scholar] [CrossRef]
- Tinklenberg, R.L.; Murphy, S.D.; Mochel, J.P.; Seo, Y.-J.; Mahaffey, A.L.; Yan, Y.; Ward, J.L. Evaluation of dose-response effects of short-term oral prednisone administration on clinicopathologic and hemodynamic variables in healthy dogs. Am. J. Vet. Res. 2020, 81, 317–325. [Google Scholar] [CrossRef] [PubMed]
- Wiss, O.; Wiss, V. The stimulation of the cholesterol synthesis in rat liver by hydrocortisone. Helv. Chim. Acta 1976, 59, 2179–2180. [Google Scholar] [CrossRef]
- Lin, R.C.; Snodgrass, P.J. Effect of dexamethasone on 3-hydroxy-3-methylglutaryl-coenzyme a reductase activity and cholesterol synthesis in rat liver. Biochim. Biophys. Acta 1982, 713, 240–250. [Google Scholar] [CrossRef]
- Sieber-Ruckstuhl, N.S.; Burla, B.; Spoerel, S.; Schmid, F.; Venzin, C.; Cazenave-Gassiot, A.; Bendt, A.K.; Torta, F.; Wenk, M.R.; Boretti, F.S. Changes in the canine plasma lipidome after short- and long-term excess glucocorticoid exposure. Sci. Rep. 2019, 9, 6015. [Google Scholar] [CrossRef] [Green Version]
- Barrie, J.; Watson, T.D.G.; Stear, M.J.; Nash, A.S. Plasma cholesterol and lipoprotein concentrations in the dog: The effects of age, breed, gender and endocrine disease. J. Small Anim. Pract. 1993, 34, 507–512. [Google Scholar] [CrossRef]
- Colao, A.; Pivonello, R.; Spiezia, S.; Faggiano, A.; Ferone, D.; Filippella, M.; Marzullo, P.; Cerbone, G.; Siciliani, M.; Lombardi, G. Persistence of increased cardiovascular risk in patients with Cushing’s disease after five years of successful cure. J. Clin. Endocrinol. Metab. 1999, 84, 2664–2672. [Google Scholar] [CrossRef] [Green Version]
- Makri, A.; Cheung, A.; Sinaii, N.; Remaley, A.T.; Sampson, M.; Keil, M.; Belyavskaya, E.; Lyssikatos, C.; de La Luz Sierra, M.; Stratakis, C.A.; et al. Lipoprotein particles in patients with pediatric Cushing disease and possible cardiovascular risks. Pediatr. Res. 2019, 86, 375–381. [Google Scholar] [CrossRef]
- Maldonado, E.N.; Romero, J.R.; Ochoa, B.; Aveldaño, M.I. Lipid and fatty acid composition of canine lipoproteins. Comp. Biochem. Physiol. B. Biochem. Mol. Biol. 2001, 128, 719–729. [Google Scholar] [CrossRef]
- Macfarlane, D.P.; Forbes, S.; Walker, B.R. Glucocorticoids and fatty acid metabolism in humans: Fuelling fat redistribution in the metabolic syndrome. J. Endocrinol. 2008, 197, 189–204. [Google Scholar] [CrossRef] [PubMed] [Green Version]
- Faggiano, A.; Pivonello, R.; Melis, D.; Alfieri, R.; Filippella, M.; Spagnuolo, G.; Salvatore, F.; Lombardi, G.; Colao, A. Evaluation of circulating levels and renal clearance of natural amino acids in patients with Cushing’s disease. J. Endocrinol. Investig. 2002, 25, 142–151. [Google Scholar] [CrossRef] [PubMed]
- Ellero-Simatos, S.; Szymańska, E.; Rullmann, T.; Dokter, W.H.; Ramaker, R.; Berger, R.; van Iersel, T.M.; Smilde, A.K.; Hankemeier, T.; Alkema, W. Assessing the metabolic effects of prednisolone in healthy volunteers using urine metabolic profiling. Genome Med. 2012, 4, 94. [Google Scholar] [CrossRef] [PubMed] [Green Version]
- Otvos, J.D.; Shalaurova, I.; Wolak-Dinsmore, J.; Connelly, M.A.; Mackey, R.H.; Stein, J.H.; Tracy, R.P. GlycA: A composite nuclear magnetic resonance biomarker of systemic inflammation. Clin. Chem. 2015, 61, 714–723. [Google Scholar] [CrossRef] [PubMed] [Green Version]
- Bell, J.D.; Brown, J.; Nicholson, J.K.; Sadler, P.J. Assignment of resonances for ‘acute-phase’ glycoproteins in high resolution proton NMR spectra of human blood plasma. FEBS Lett. 1987, 215, 311–315. [Google Scholar] [CrossRef] [Green Version]
- McGrotty, Y.L.; Arteaga, A.; Knottenbelt, C.M.; Ramsey, I.K.; Eckersall, P.D. Haptoglobin concentrations in dogs undergoing trilostane treatment for hyperadrenocorticism. Vet. Clin. Pathol. 2005, 34, 255–258. [Google Scholar] [CrossRef]
- Arteaga, A.; Dhand, N.K.; McCann, T.; Knottenbelt, C.M.; Tebb, A.J.; Evans, H.; Eckersall, P.D.; Ramsey, I.K. Monitoring the response of canine hyperadrenocorticism to trilostane treatment by assessment of acute phase protein concentrations. J. Small Anim. Pract. 2010, 51, 204–209. [Google Scholar] [CrossRef] [Green Version]
- McGrotty, Y.L.; Knottenbelt, C.M.; Ramsey, I.K.; Reid, S.W.J.; Eckersall, P.D. Haptoglobin concentrations in a canine hospital population. Vet. Rec. 2003, 152, 562–564. [Google Scholar] [CrossRef]
- Caldin, M.; Tasca, S.; Carli, E.; Bianchini, S.; Furlanello, T.; Martinez-Subiela, S.; Cerón, J.J. Serum acute phase protein concentrations in dogs with hyperadrenocorticism with and without concurrent inflammatory conditions. Vet. Clin. Pathol. 2009, 38, 63–68. [Google Scholar] [CrossRef]
- Golinelli, S.; de Marco, V.; Leal, R.O.; Barbarossa, A.; Aniballi, C.; Maietti, E.; Tardo, A.M.; Galac, S.; Fracassi, F. Comparison of methods to monitor dogs with hypercortisolism treated with trilostane. J. Vet. Intern. Med. 2021, 35, 2616–2627. [Google Scholar] [CrossRef] [PubMed]
- Schofield, I.; Brodbelt, D.C.; Kennedy, N.; Niessen, S.J.M.; Church, D.B.; Geddes, R.F.; O’Neill, D.G. Machine-learning based prediction of Cushing’s syndrome in dogs attending UK primary-care veterinary practice. Sci. Rep. 2021, 11, 9035. [Google Scholar] [CrossRef] [PubMed]
- Reagan, K.L.; Reagan, B.A.; Gilor, C. Machine learning algorithm as a diagnostic tool for hypoadrenocorticism in dogs. Domest. Anim. Endocrinol. 2020, 72, 106396. [Google Scholar] [CrossRef] [PubMed]
- Wehner, A.; Glöckner, S.; Weiss, B.; Ballhausen, D.; Stockhaus, C.; Zablotski, Y.; Hartmann, K. Association between ACTH stimulation test results and clinical signs in dogs with hyperadrenocorticism treated with trilostane. Vet. J. 2021, 276, 105740. [Google Scholar] [CrossRef]
- Boretti, F.S.; Holzthüm, J.; Reusch, C.E.; Sieber-Ruckstuhl, N.S. Fehlender Zusammenhang zwischen klinischen Symptomen und Laborwerten von Hunden mit Hyperadrenokortizismus vor und während der Trilostan-Behandlung. Schweiz. Arch. Tierheilkd. 2016, 158, 631–638. [Google Scholar] [CrossRef] [Green Version]
- Kintzer, P.P.; Peterson, M.E. Treatment and long-term follow-up of 205 dogs with hypoadrenocorticism. J. Vet. Intern. Med. 1997, 11, 43–49. [Google Scholar] [CrossRef]
- Zeugswetter, F.K.; Haninger, T. Prednisolondosierung bei Hunden mit Hypoadrenokortizismus nach Integration der ACTH-Messung in die Therapieüberwachung. Tierarztl. Prax. Ausg. K Kleintiere Heimtiere 2018, 46, 90–96. [Google Scholar] [CrossRef]
- Behrend, E.N.; Kemppainen, R.J. Diagnosis of canine hyperadrenocorticism. Vet. Clin. North Am. Small Anim. Pract. 2001, 31, 985–1003. [Google Scholar] [CrossRef]
- Peterson, M.E. Diagnosis of hyperadrenocorticism in dogs. Clin. Tech. Small Anim. Pract. 2007, 22, 2–11. [Google Scholar] [CrossRef]
- Soininen, P.; Kangas, A.J.; Würtz, P.; Tukiainen, T.; Tynkkynen, T.; Laatikainen, R.; Järvelin, M.-R.; Kähönen, M.; Lehtimäki, T.; Viikari, J.; et al. High-throughput serum NMR metabonomics for cost-effective holistic studies on systemic metabolism. Analyst 2009, 134, 1781–1785. [Google Scholar] [CrossRef]
- Doncaster, C.P.; Davey, A.J.H. Analysis of Variance and Covariance; Cambridge University Press: Cambridge, UK, 2007; ISBN 9780511611377. [Google Scholar]
- Kruskal, W.H.; Wallis, W.A. Use of ranks in one-criterion variance analysis. J. Am. Stat. Assoc. 1952, 47, 583–621. [Google Scholar] [CrossRef]
- Wilcoxon, F. Individual comparisons by ranking methods. Biom. Bull. 1945, 1, 80–83. [Google Scholar] [CrossRef]
- Dunn, O.J. Multiple comparisons among means. J. Am. Stat. Assoc. 1961, 56, 52–64. [Google Scholar] [CrossRef]
- Hotelling, H. Analysis of a complex of statistical variables into principal components. J. Educ. Psychol. 1933, 24, 417–441. [Google Scholar] [CrossRef]
- Squillacciotti, S. Prediction oriented classification in PLS path modeling. In Handbook of Partial Least Squares; Esposito Vinzi, V., Chin, W.W., Henseler, J., Wang, H., Eds.; Springer: Berlin/Heidelberg, Germany, 2010; pp. 219–233. ISBN 978-3-540-32825-4. [Google Scholar]
- MetaboAnalyst. Available online: https://www.metaboanalyst.ca/ (accessed on 6 October 2021).
- Rokach, L.; Maimon, O. Clustering methods. In Data Mining and Knowledge Discovery Handbook; Maimon, O.Z., Rokach, L., Eds.; Springer: New York, NY, USA, 2005; pp. 321–352. ISBN 978-0-387-25465-4. [Google Scholar]
- Witten, I.H.; Frank, E.; Hall, M.A.; Pal, C.J. Data Mining: Practical Machine Learning Tools and Techniques; The WEKA Workbench. Online Appendix, 4th ed.; Elsevier Reference Monographs: Cambridge, MA, USA, 2011; ISBN 978-0128042915. [Google Scholar]
- Sumner, M.; Frank, E.; Hall, M. Speeding up logistic model tree induction. In Knowledge Discovery in Databases: PKDD 2005: 9th European Conference on Principles and Practice of Knowledge Discovery in Databases; Hutchison, D., Kanade, T., Kittler, J., Kleinberg, J.M., Mattern, F., Mitchell, J.C., Naor, M., Nierstrasz, O., Pandu Rangan, C., Steffen, B., et al., Eds.; Springer: Berlin/Heidelberg, Germany, 2005; pp. 675–683. ISBN 978-3-540-29244-9. [Google Scholar]
- Crammer, K.; Singer, Y. On the algorithmic implementation of multiclass kernel-based vector machines. J. Mach. Learn. Res. 2002, 2, 265–292. [Google Scholar]
- Aha, D.W.; Kibler, D.; Albert, M.K. Instance-based learning algorithms. Mach. Learn. 1991, 6, 37–66. [Google Scholar] [CrossRef] [Green Version]
- Morariu, D.; Crețulescu, R.; Breazu, M. The WEKA multilayer perceptron classifier. J. Adv. Stat. IT&C Econom. Life Sci. 2017, 7. [Google Scholar]
- Breiman, L. Random Forests. Mach. Learn. 2001, 45, 5–32. [Google Scholar] [CrossRef] [Green Version]
- Hand, D.J.; Yu, K. Idiot’s bayes: Not so stupid after all? Int. Stat. Rev. 2001, 69, 385–398. [Google Scholar] [CrossRef]


| CONT | HYPERU | HYPERT | HYPOU | p Value | HYPOU† | HYPOT† | |
|---|---|---|---|---|---|---|---|
| Number of dogs, n | 40 | 27 | 28 | 35 | 23 | 23 | |
| Age, years, median (range) | 5.3 (1.3–11.0) a | 11.0 (8.0–14.0) b | 11.0 (6.3–15.0) b | 6.0 (0.8–12.0) a | <0.001 | 6.0 (1.3–11.0) | 6.0 (1.3–11.0) |
| Breeds, n | |||||||
| Mixed breed | 11 | 10 | 11 | 18 | 11 | 11 | |
| Others ¥/Dachshund | 29/0 | 10/7 | 15/2 | 17/0 | 12/0 | 12/0 | |
| Sex, n | |||||||
| Males, intact/castrated | 12/9 | 8/7 | 9/4 | 9/12 | >0.05 | 4/10 | 4/10 |
| Females, intact/spayed | 10/8 ‡ | 7/5 | 2/13 | 4/10 | 1/8 | 1/8 | |
| Cortisol ACTH-ST, ng/mL, median (range) | |||||||
| Cortisol pre-ACTH | ND | ND | 5.5 (1.4–13.8) | 0.5 (0.5–4.3) | 0.5 (0.5–4.3) | ND | |
| Cortisol post-ACTH | ND | ND | 12.2 (3.0–19.9) | 0.5 (0.5–6.1) | 0.5 (0.5–3.9) | ND | |
| Cortisol LDDST, ng/mL, median (range) | |||||||
| Cortisol pre-dexamethasone | ND | 55.9 (15.5–300.7) | ND | ND | ND | ND | |
| Cortisol 8 hrs post-dexamethasone | ND | 36.5 (11.2–86.4) | ND | ND | ND | ND | |
| Clinicopathologically Assigned Groups | Dogs, n | Groups Assigned by Simple Logistic Regression Model | |||
|---|---|---|---|---|---|
| a | CONT | HYPERU | HYPOU | ||
| CONT | 40 | 38 | 1 | 1 | |
| HYPERU | 27 | 1 | 25 | 1 | |
| HYPOU | 35 | 6 | 2 | 27 | |
| b | CONT | HYPERU | HYPERT | ||
| CONT | 40 | 40 | 0 | 0 | |
| HYPERU | 27 | 1 | 24 | 2 | |
| HYPERT | 28 | 5 | 3 | 20 | |
| c | CONT | HYPOU | HYPOT | ||
| CONT | 40 | 32 | 3 | 5 | |
| HYPOU | 35 | 5 | 28 | 2 | |
| HYPOT | 23 | 6 | 1 | 16 | |
Publisher’s Note: MDPI stays neutral with regard to jurisdictional claims in published maps and institutional affiliations. |
© 2022 by the authors. Licensee MDPI, Basel, Switzerland. This article is an open access article distributed under the terms and conditions of the Creative Commons Attribution (CC BY) license (https://creativecommons.org/licenses/by/4.0/).
Share and Cite
Imbery, C.A.; Dieterle, F.; Ottka, C.; Weber, C.; Schlotterbeck, G.; Müller, E.; Lohi, H.; Giger, U. Metabolomic Abnormalities in Serum from Untreated and Treated Dogs with Hyper- and Hypoadrenocorticism. Metabolites 2022, 12, 339. https://doi.org/10.3390/metabo12040339
Imbery CA, Dieterle F, Ottka C, Weber C, Schlotterbeck G, Müller E, Lohi H, Giger U. Metabolomic Abnormalities in Serum from Untreated and Treated Dogs with Hyper- and Hypoadrenocorticism. Metabolites. 2022; 12(4):339. https://doi.org/10.3390/metabo12040339
Chicago/Turabian StyleImbery, Carolin Anna, Frank Dieterle, Claudia Ottka, Corinna Weber, Götz Schlotterbeck, Elisabeth Müller, Hannes Lohi, and Urs Giger. 2022. "Metabolomic Abnormalities in Serum from Untreated and Treated Dogs with Hyper- and Hypoadrenocorticism" Metabolites 12, no. 4: 339. https://doi.org/10.3390/metabo12040339
APA StyleImbery, C. A., Dieterle, F., Ottka, C., Weber, C., Schlotterbeck, G., Müller, E., Lohi, H., & Giger, U. (2022). Metabolomic Abnormalities in Serum from Untreated and Treated Dogs with Hyper- and Hypoadrenocorticism. Metabolites, 12(4), 339. https://doi.org/10.3390/metabo12040339