
Network Reconstruction and Modelling Made Reproducible with moped


Abstract
:1. Introduction
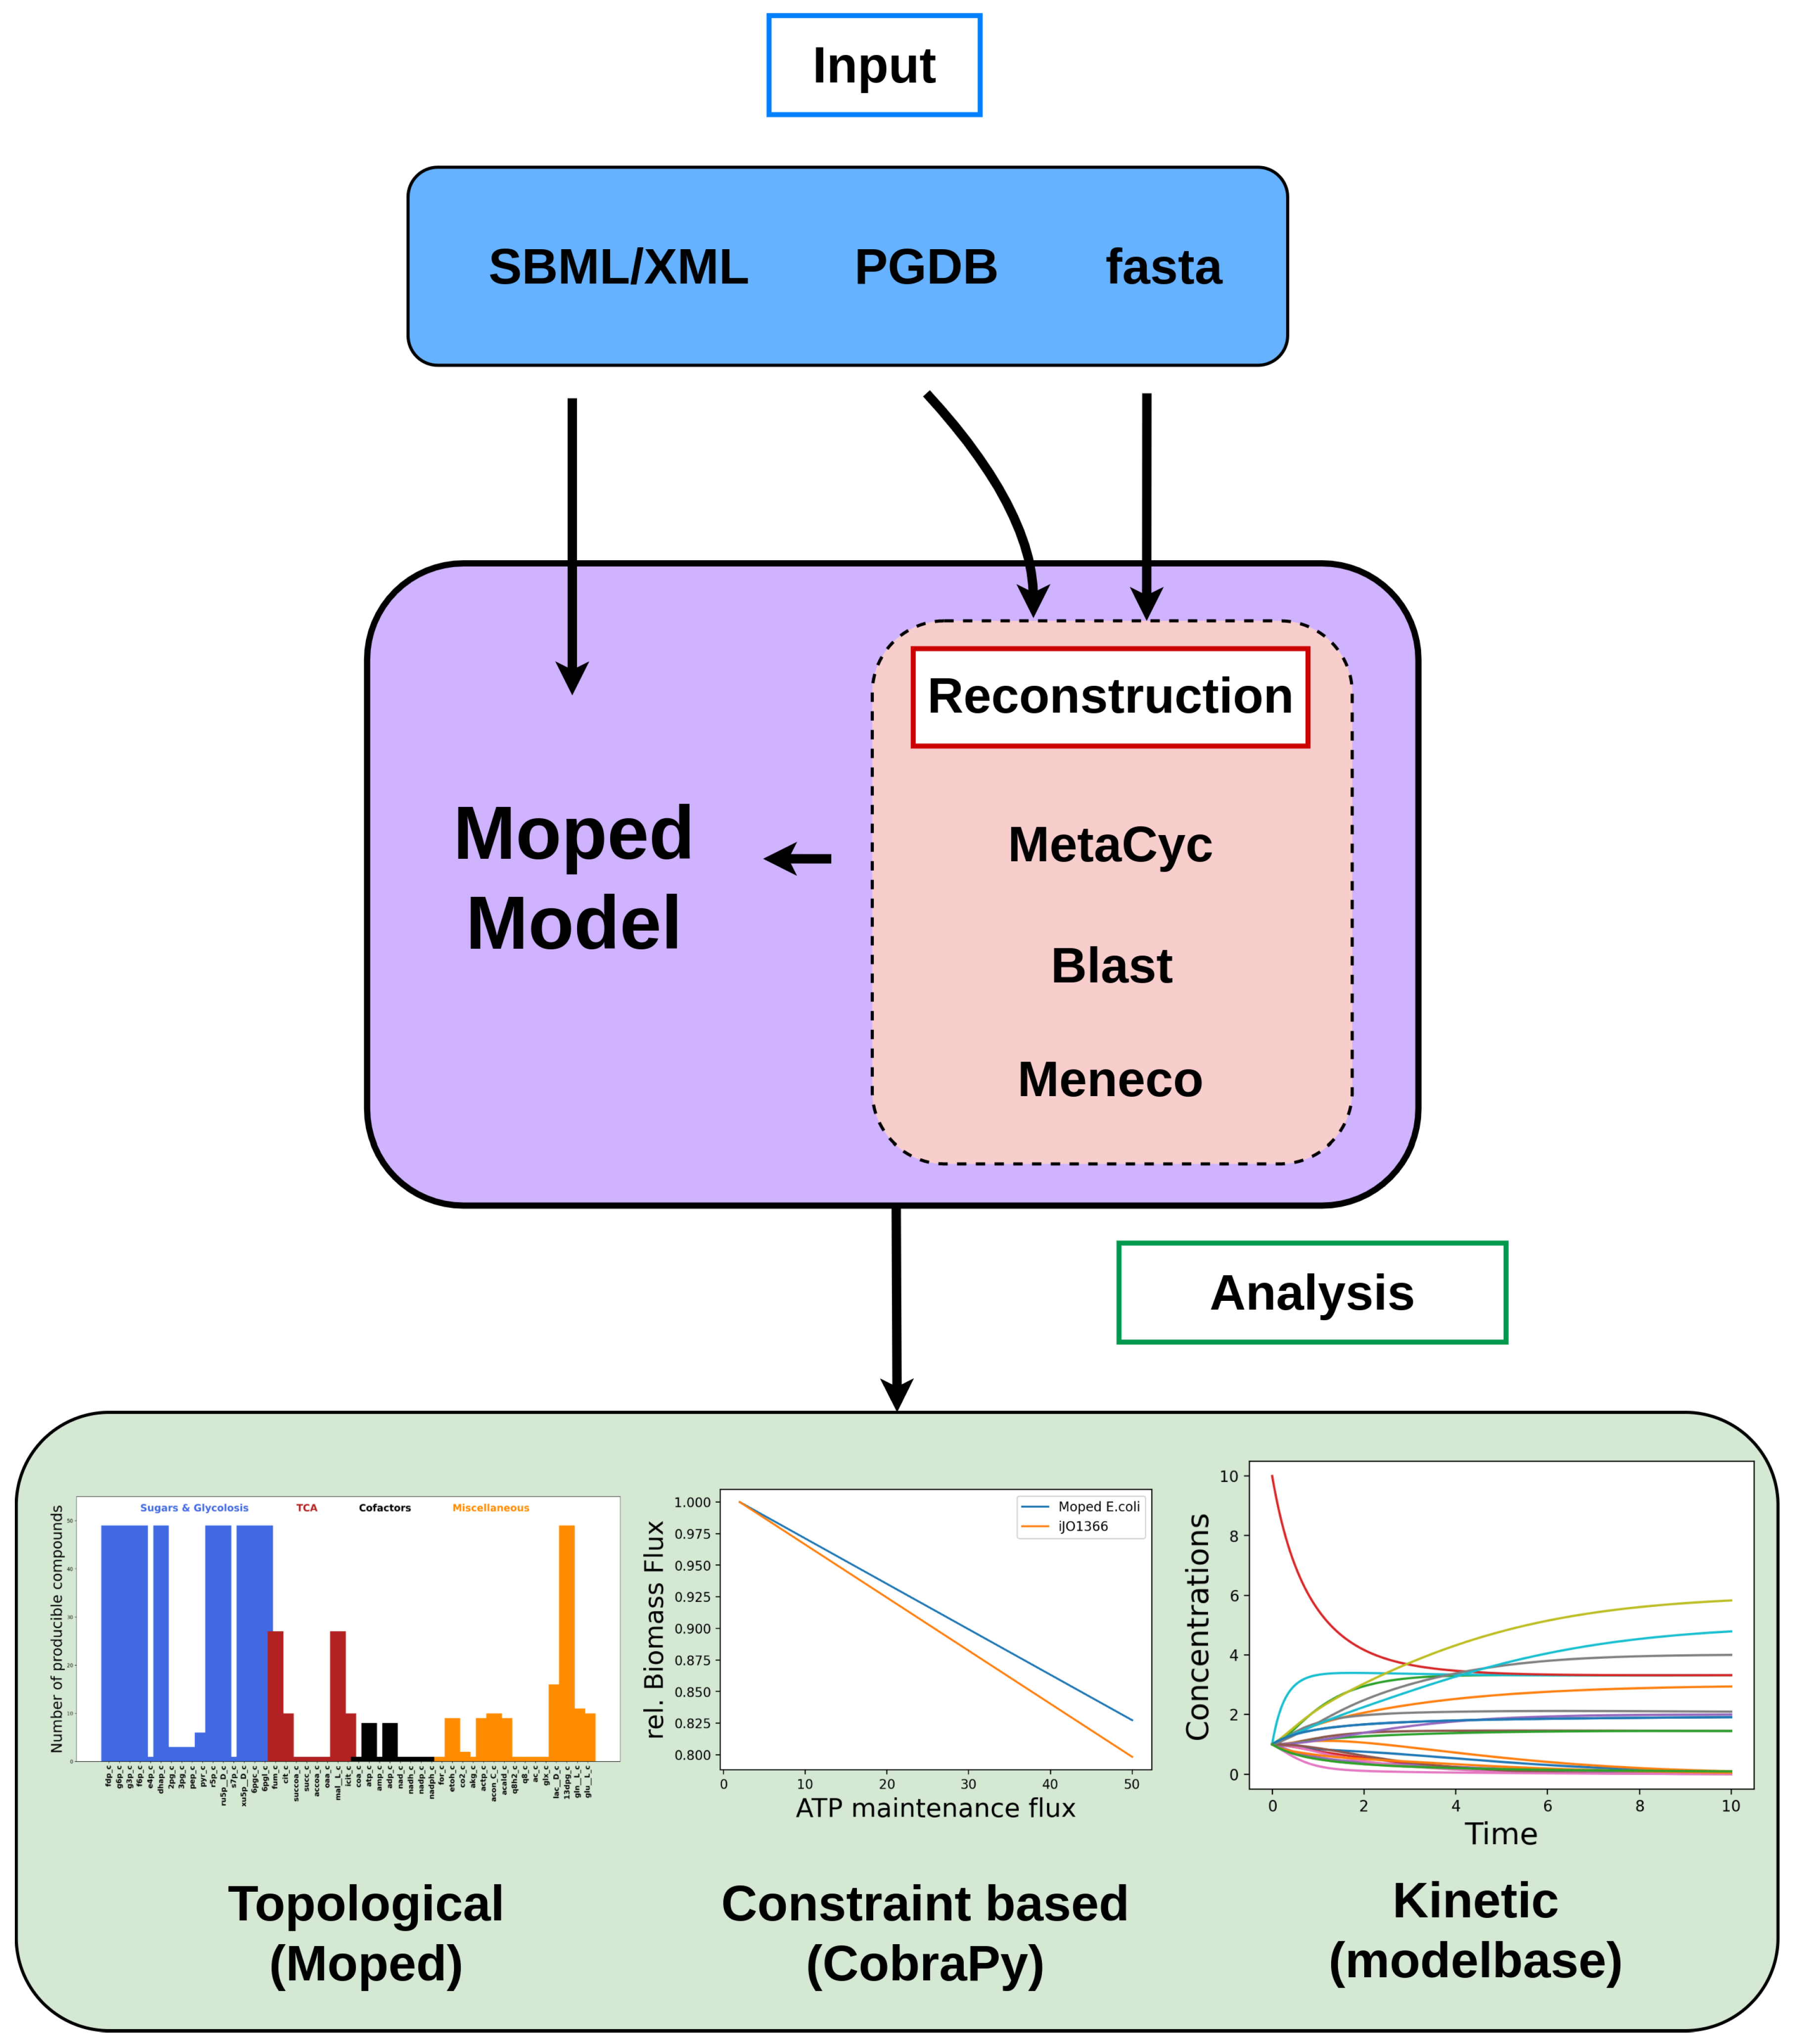
2. Implementation
2.1. Model Import, Extension and Modification
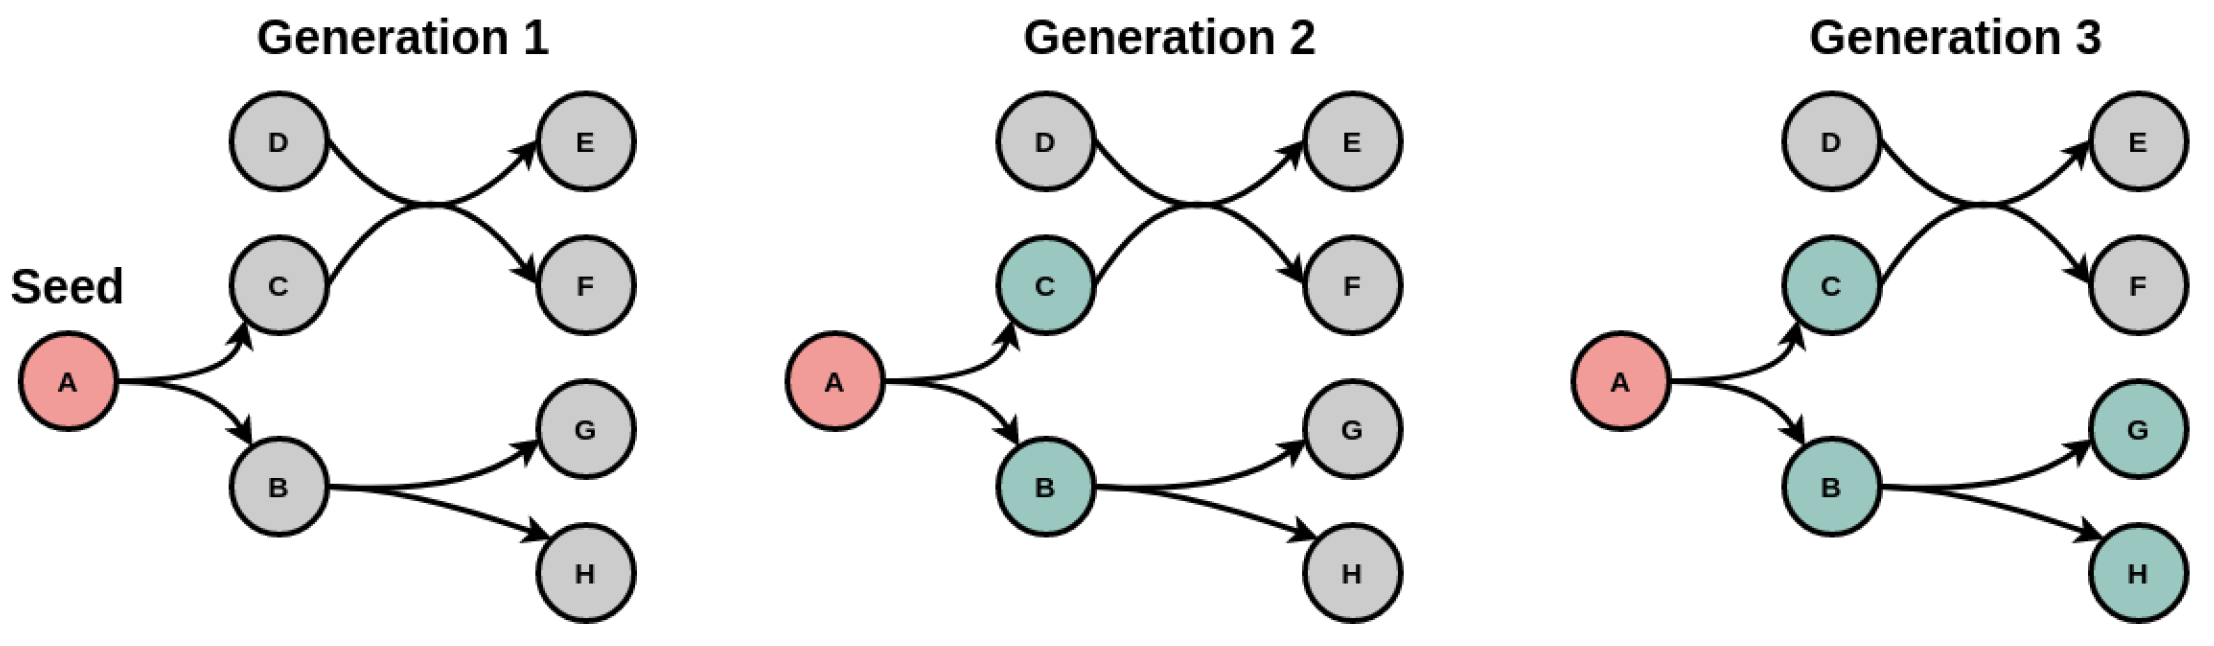
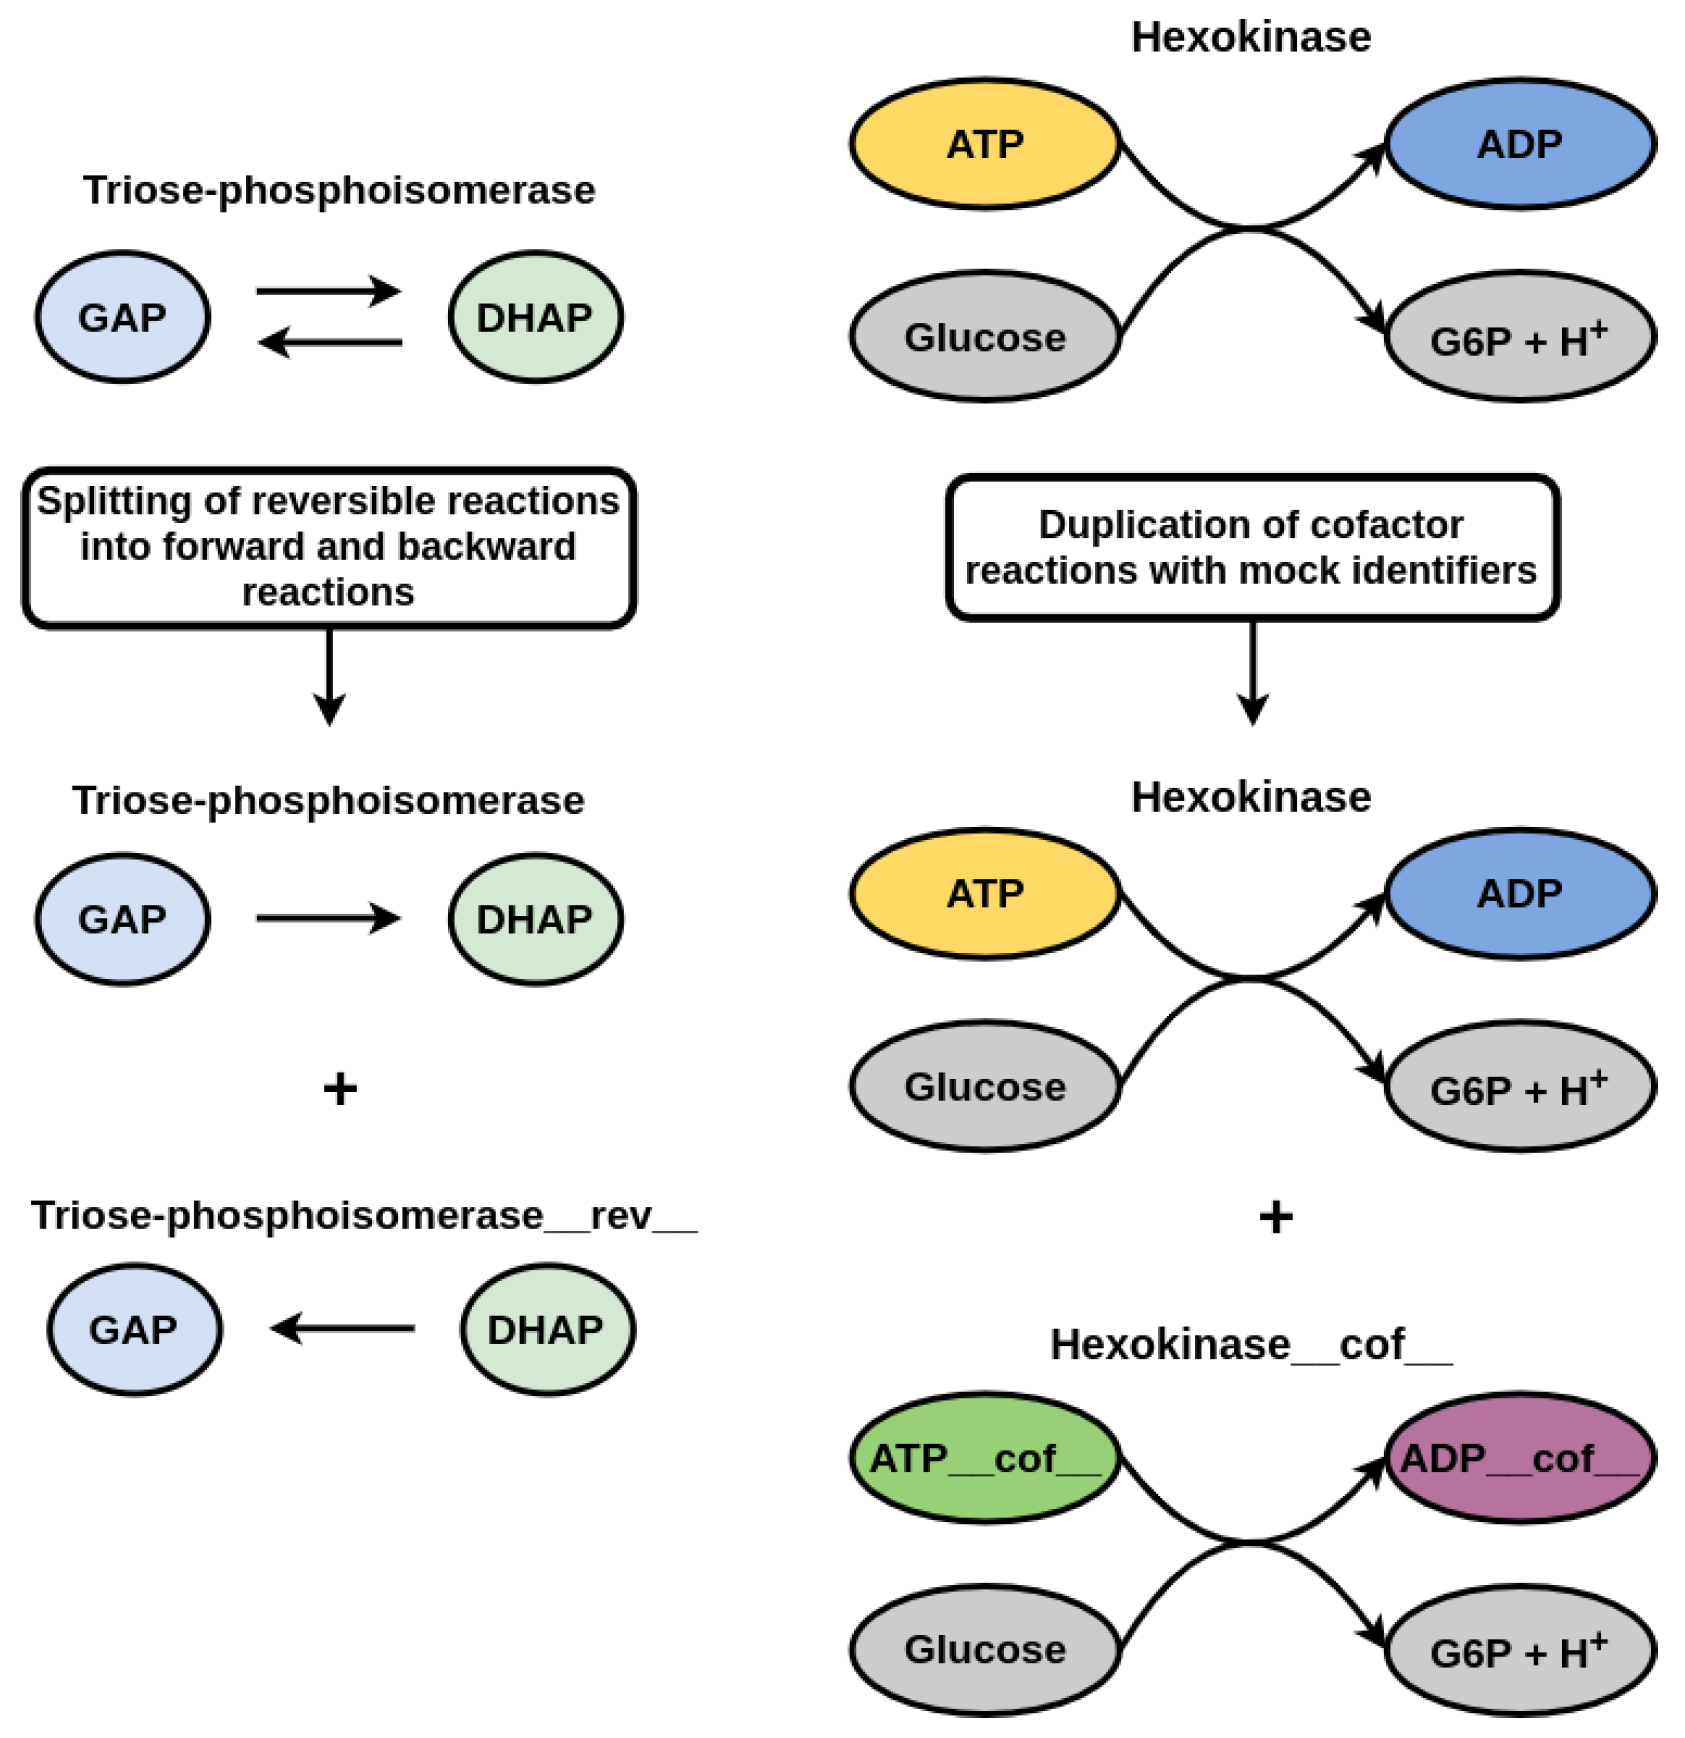
2.2. Tools for Metabolic Network Expansion
2.3. Reconstruction of Draft Network Models
3. Results
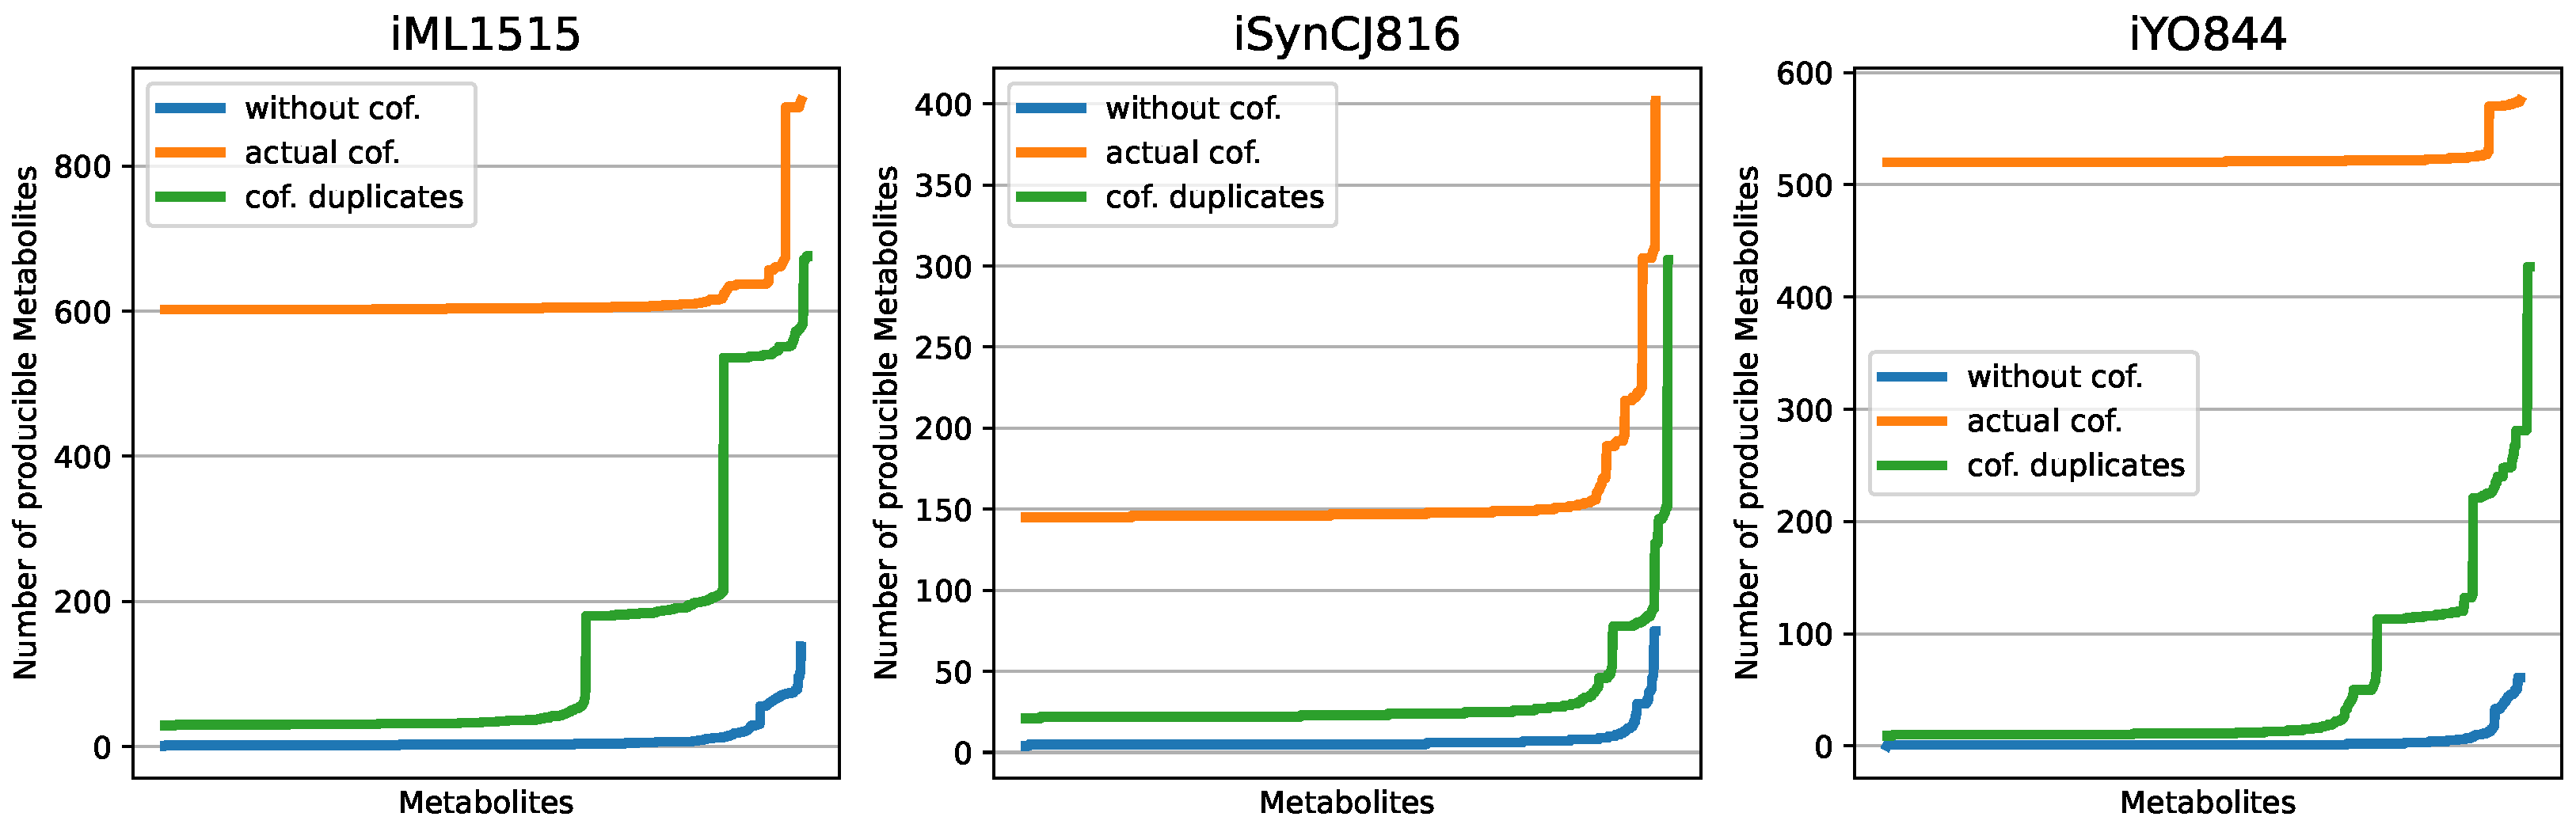
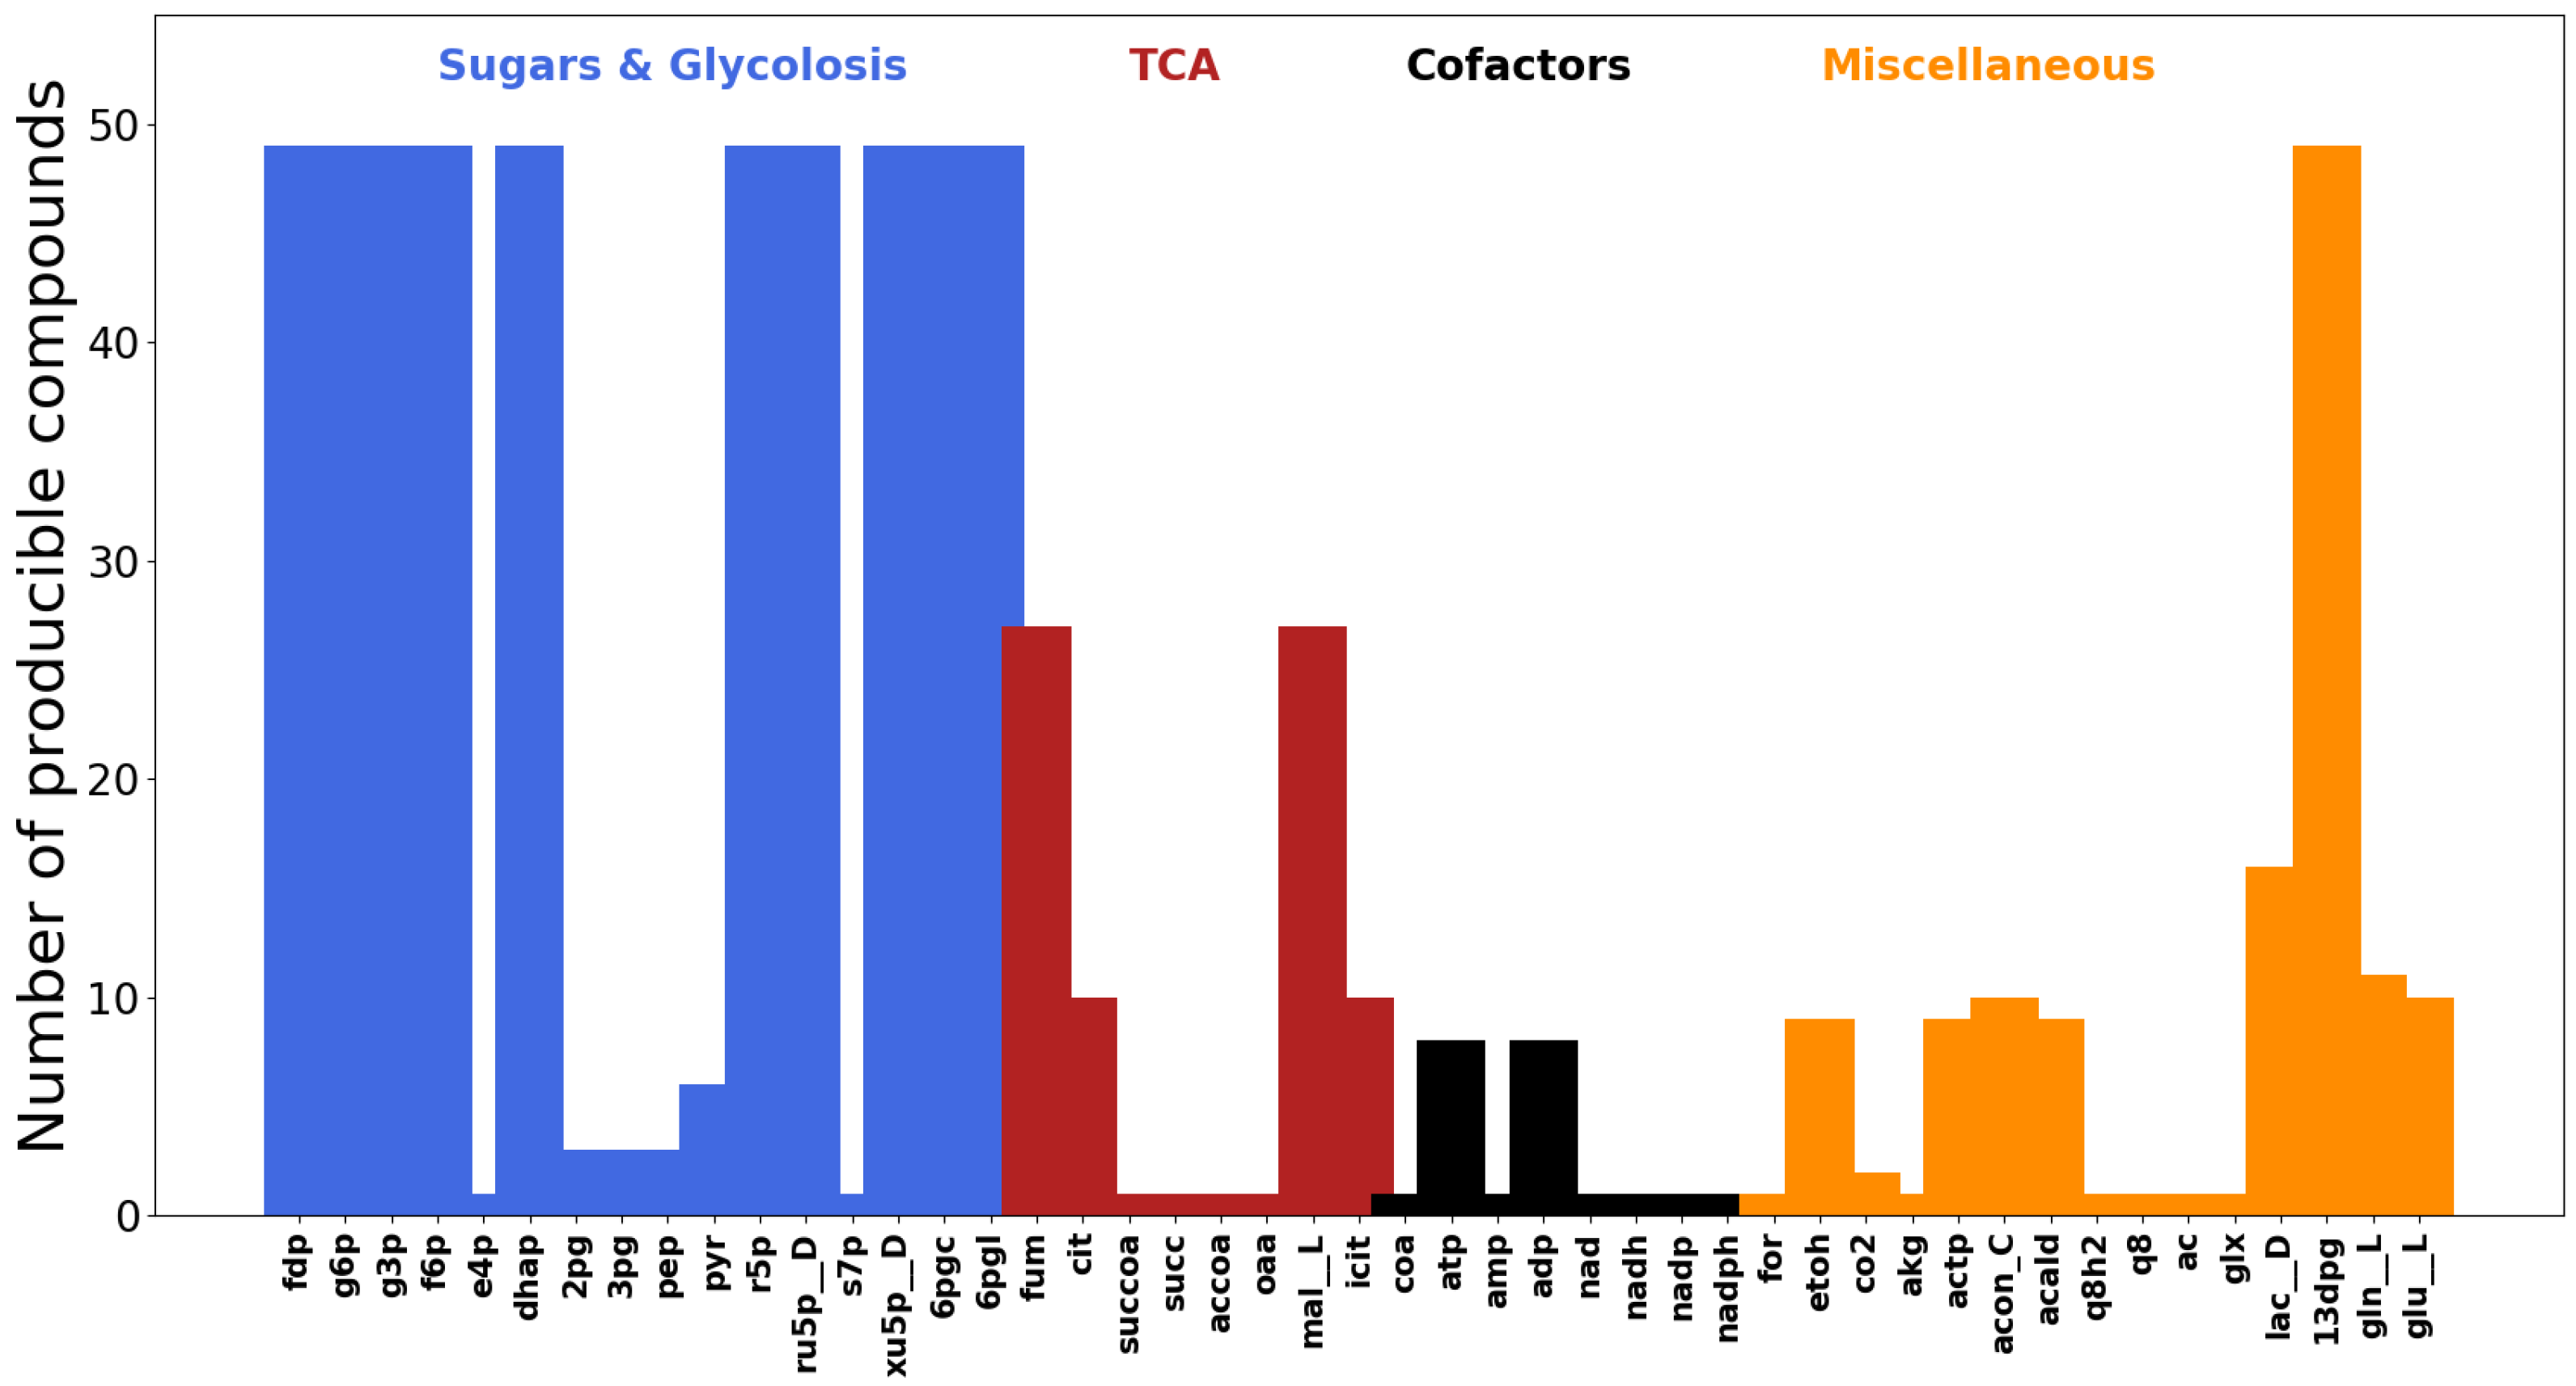
3.1. Displaying the Advantage of Cofactor Duplications in Topological Network Analysis
3.2. Applying Metabolic Network Expansion to a Model of E. coli Core Metabolism
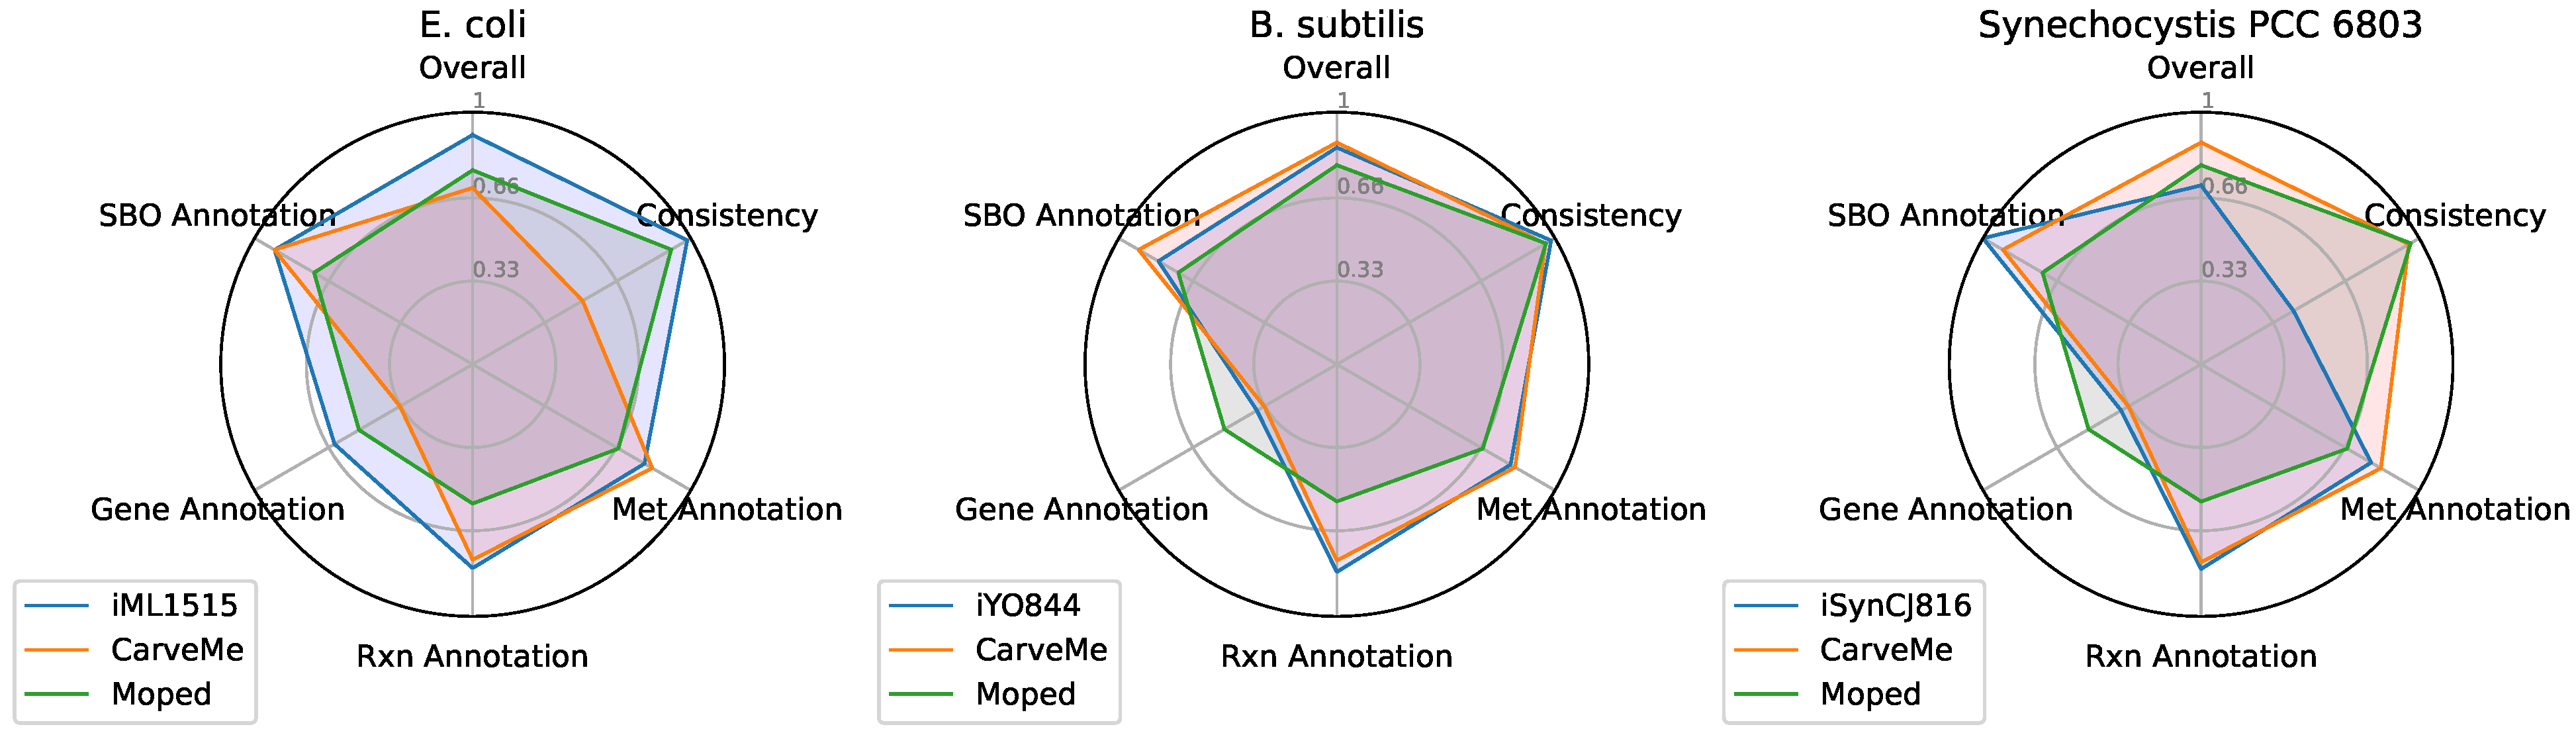
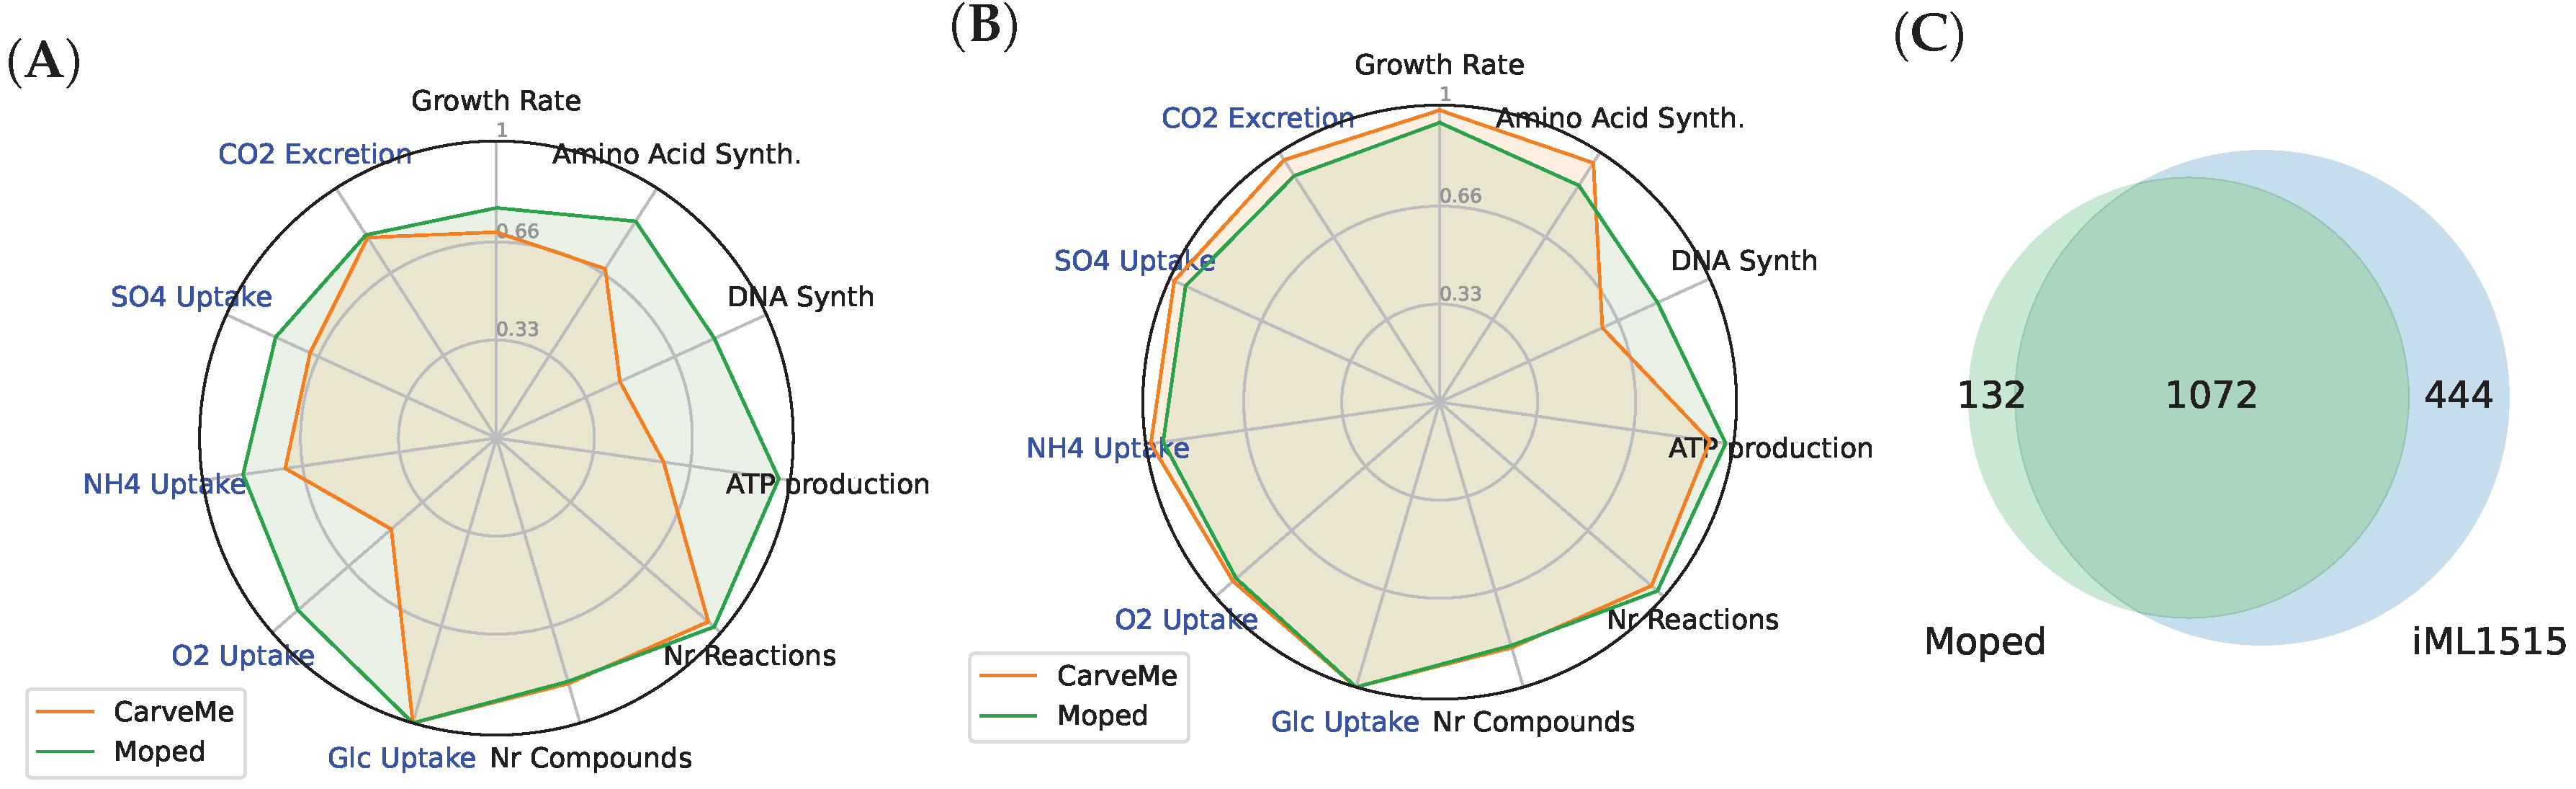
3.3. Comparison of Draft Reconstructions with Established Models and Softwares
4. Conclusions
Supplementary Materials
Author Contributions
Funding
Data Availability Statement
Acknowledgments
Conflicts of Interest
Abbreviations
| PGDB | Pathway/Genome Database |
| FBA | Flux Balance Analysis |
| GPR | Gene–Protein–Reaction |
| SBML | Systems Biology Markup Language |
| ODE | Ordinary Differential Equations |
References
- Rapoport, T.A.; Heinrich, R.; Jacobasch, G.; Rapoport, S. A linear steady-state treatment of enzymatic chains. A mathematical model of glycolysis of human erythrocytes. Eur. J. Biochem. 1974, 42, 107–120. [Google Scholar] [CrossRef] [PubMed]
- Zomorrodi, A.R.; Segrè, D. Genome-driven evolutionary game theory helps understand the rise of metabolic interdependencies in microbial communities. Nat. Commun. 2017, 8, 1563. [Google Scholar] [CrossRef] [PubMed]
- Hartman, H.B.; Fell, D.A.; Rossell, S.; Jensen, P.R.; Woodward, M.J.; Thorndahl, L.; Jelsbak, L.; Olsen, J.E.; Raghunathan, A.; Daefler, S.; et al. Identification of potential drug targets in Salmonella enterica sv. Typhimurium using metabolic modelling and experimental validation. Microbiology 2014, 160, 1252–1266. [Google Scholar] [CrossRef] [PubMed] [Green Version]
- Heinrich, R.; Schuster, S. The Regulation of Cellular Systems; Chapman and Hall: New York, NY, USA, 1996. [Google Scholar]
- Caspi, R.; Billington, R.; Keseler, I.M.; Kothari, A.; Krummenacker, M.; Midford, P.E.; Ong, W.K.; Paley, S.; Subhraveti, P.; Karp, P.D. The MetaCyc database of metabolic pathways and enzymes-a 2019 update. Nucleic Acids Res. 2020, 48, D445–D453. [Google Scholar] [CrossRef] [PubMed] [Green Version]
- Karp, P.D.; Billington, R.; Caspi, R.; Fulcher, C.A.; Latendresse, M.; Kothari, A.; Keseler, I.M.; Krummenacker, M.; Midford, P.E.; Ong, Q.; et al. The BioCyc collection of microbial genomes and metabolic pathways. Brief. Bioinform. 2019, 20, 1085–1093. [Google Scholar] [CrossRef] [PubMed]
- King, Z.A.; Lu, J.; Dräger, A.; Miller, P.; Federowicz, S.; Lerman, J.A.; Ebrahim, A.; Palsson, B.O.; Lewis, N.E. BiGG Models: A platform for integrating, standardizing and sharing genome-scale models. Nucleic Acids Res. 2016, 44, D515–D522. [Google Scholar] [CrossRef]
- Kanehisa, M.; Goto, S. KEGG: Kyoto encyclopedia of genes and genomes. Nucleic Acids Res. 2000, 28, 27–30. [Google Scholar] [CrossRef]
- Raman, K.; Chandra, N. Flux balance analysis of biological systems: Applications and challenges. Brief. Bioinform. 2009, 10, 435–449. [Google Scholar] [CrossRef]
- Orth, J.D.; Thiele, I.; Palsson, B.Ø. What is flux balance analysis? Nat. Biotechnol. 2010, 28, 245–248. [Google Scholar] [CrossRef]
- Wunderlich, Z.; Mirny, L.A. Using the topology of metabolic networks to predict viability of mutant strains. Biophys. J. 2006, 91, 2304–2311. [Google Scholar] [CrossRef] [Green Version]
- Handorf, T.; Ebenhöh, O.; Heinrich, R. Expanding metabolic networks: Scopes of compounds, robustness, and evolution. J. Mol. Evol. 2005, 61, 498–512. [Google Scholar] [CrossRef] [PubMed]
- Romero, P.; Karp, P. Nutrient-related analysis of pathway/genome databases. In Biocomputing 2001; World Scientific: Singapore, 2000; pp. 471–482. [Google Scholar]
- Ebenhöh, O.; Handorf, T. Functional classification of genome-scale metabolic networks. EURASIP J. Bioinform. Syst. Biol. 2009, 2009, 570456. [Google Scholar] [CrossRef] [PubMed] [Green Version]
- Christian, N.; May, P.; Kempa, S.; Handorf, T.; Ebenhöh, O. An integrative approach towards completing genome-scale metabolic networks. Mol. Biosyst. 2009, 5, 1889–1903. [Google Scholar] [CrossRef]
- Orth, J.D.; Palsson, B.Ø. Systematizing the generation of missing metabolic knowledge. Biotechnol. Bioeng. 2010, 107, 403–412. [Google Scholar] [CrossRef] [PubMed] [Green Version]
- Altschul, S.F.; Gish, W.; Miller, W.; Myers, E.W.; Lipman, D.J. Basic local alignment search tool. J. Mol. Biol. 1990, 215, 403–410. [Google Scholar] [CrossRef]
- Prigent, S.; Frioux, C.; Dittami, S.M.; Thiele, S.; Larhlimi, A.; Collet, G.; Gutknecht, F.; Got, J.; Eveillard, D.; Bourdon, J.; et al. Meneco, a topology-based gap-filling tool applicable to degraded genome-wide metabolic networks. PLoS Comput. Biol. 2017, 13, e1005276. [Google Scholar] [CrossRef]
- Ebrahim, A.; Lerman, J.A.; Palsson, B.O.; Hyduke, D.R. COBRApy: COnstraints-based reconstruction and analysis for python. BMC Syst. Biol. 2013, 7, 74. [Google Scholar] [CrossRef] [PubMed] [Green Version]
- van Aalst, M.; Ebenhöh, O.; Matuszyńska, A. Constructing and analysing dynamic models with modelbase v1. 2.3: A software update. BMC Bioinform. 2021, 22, 203. [Google Scholar] [CrossRef]
- Hucka, M.; Finney, A.; Sauro, H.M.; Bolouri, H.; Doyle, J.C.; Kitano, H.; Arkin, A.P.; Bornstein, B.J.; Bray, D.; Cornish-Bowden, A.; et al. The systems biology markup language (SBML): A medium for representation and exchange of biochemical network models. Bioinformatics 2003, 19, 524–531. [Google Scholar] [CrossRef]
- Karp, P.D.; Paley, S.; Romero, P. The pathway tools software. Bioinformatics 2002, 18, S225–S232. [Google Scholar] [CrossRef]
- Karpe, P.D.; Latendresse, M.; Caspi, R. The pathway tools pathway prediction algorithm. Stand. Genom. Sci. 2011, 5, 424–429. [Google Scholar] [CrossRef] [PubMed] [Green Version]
- Machado, D.; Herrgård, M.J.; Rocha, I. Stoichiometric representation of gene–protein–reaction associations leverages constraint-based analysis from reaction to gene-level phenotype prediction. PLoS Comput. Biol. 2016, 12, e1005140. [Google Scholar] [CrossRef] [PubMed] [Green Version]
- Thiele, I.; Palsson, B.Ø. A protocol for generating a high-quality genome-scale metabolic reconstruction. Nat. Protoc. 2010, 5, 93. [Google Scholar] [CrossRef] [Green Version]
- Kumar, V.S.; Dasika, M.S.; Maranas, C.D. Optimization based automated curation of metabolic reconstructions. BMC Bioinform. 2007, 8, 212. [Google Scholar]
- Vitkin, E.; Shlomi, T. MIRAGE: A functional genomics-based approach for metabolic network model reconstruction and its application to cyanobacteria networks. Genome Biol. 2012, 13, R111. [Google Scholar] [CrossRef] [PubMed] [Green Version]
- Tiwari, K.; Kananathan, S.; Roberts, M.G.; Meyer, J.P.; Sharif Shohan, M.U.; Xavier, A.; Maire, M.; Zyoud, A.; Men, J.; Ng, S.; et al. Reproducibility in systems biology modelling. Mol. Syst. Biol. 2021, 17, e9982. [Google Scholar] [CrossRef]
- Mendoza, S.N.; Olivier, B.G.; Molenaar, D.; Teusink, B. A systematic assessment of current genome-scale metabolic reconstruction tools. Genome Biol. 2019, 20, 158. [Google Scholar] [CrossRef] [Green Version]
- Monk, J.M.; Lloyd, C.J.; Brunk, E.; Mih, N.; Sastry, A.; King, Z.; Takeuchi, R.; Nomura, W.; Zhang, Z.; Mori, H.; et al. i ML1515, a knowledgebase that computes Escherichia coli traits. Nat. Biotechnol. 2017, 35, 904–908. [Google Scholar] [CrossRef]
- Oh, Y.K.; Palsson, B.O.; Park, S.M.; Schilling, C.H.; Mahadevan, R. Genome-scale reconstruction of metabolic network in Bacillus subtilis based on high-throughput phenotyping and gene essentiality data. J. Biol. Chem. 2007, 282, 28791–28799. [Google Scholar] [CrossRef] [Green Version]
- Joshi, C.J.; Peebles, C.A.; Prasad, A. Modeling and analysis of flux distribution and bioproduct formation in Synechocystis sp. PCC 6803 using a new genome-scale metabolic reconstruction. Algal Res. 2017, 27, 295–310. [Google Scholar] [CrossRef]
- Orth, J.D.; Fleming, R.M.; Palsson, B.O. Reconstruction and use of microbial metabolic networks: The core Escherichia coli metabolic model as an educational guide. EcoSal Plus 2010, 4, 1. [Google Scholar] [CrossRef] [PubMed]
- Blattner, F.R.; Plunkett, G.; Bloch, C.A.; Perna, N.T.; Burland, V.; Riley, M.; Collado-Vides, J.; Glasner, J.D.; Rode, C.K.; Mayhew, G.F.; et al. The complete genome sequence of Escherichia coli K-12. Science 1997, 277, 1453–1462. [Google Scholar] [CrossRef] [PubMed] [Green Version]
- Kaneko, T.; Sato, S.; Kotani, H.; Tanaka, A.; Asamizu, E.; Nakamura, Y.; Miyajima, N.; Hirosawa, M.; Sugiura, M.; Sasamoto, S.; et al. Sequence analysis of the genome of the unicellular cyanobacterium Synechocystis sp. strain PCC6803. II. Sequence determination of the entire genome and assignment of potential protein-coding regions. DNA Res. 1996, 3, 109–136. [Google Scholar] [CrossRef] [PubMed] [Green Version]
- Kunst, F.; Ogasawara, N.; Moszer, I.; Albertini, A.; Alloni, G.; Azevedo, V.; Bertero, M.; Bessières, P.; Bolotin, A.; Borchert, S.; et al. The complete genome sequence of the gram-positive bacterium Bacillus subtilis. Nature 1997, 390, 249–256. [Google Scholar] [CrossRef] [Green Version]
- Orth, J.D.; Conrad, T.M.; Na, J.; Lerman, J.A.; Nam, H.; Feist, A.M.; Palsson, B.Ø. A comprehensive genome-scale reconstruction of Escherichia coli metabolism—2011. Mol. Syst. Biol. 2011, 7, 535. [Google Scholar] [CrossRef]
- Machado, D.; Andrejev, S.; Tramontano, M.; Patil, K.R. Fast automated reconstruction of genome-scale metabolic models for microbial species and communities. Nucleic Acids Res. 2018, 46, 7542–7553. [Google Scholar] [CrossRef]
- Lieven, C.; Beber, M.E.; Olivier, B.G.; Bergmann, F.T.; Ataman, M.; Babaei, P.; Bartell, J.A.; Blank, L.M.; Chauhan, S.; Correia, K.; et al. MEMOTE for standardized genome-scale metabolic model testing. Nat. Biotechnol. 2020, 38, 272–276. [Google Scholar] [CrossRef] [Green Version]
Publisher’s Note: MDPI stays neutral with regard to jurisdictional claims in published maps and institutional affiliations. |
© 2022 by the authors. Licensee MDPI, Basel, Switzerland. This article is an open access article distributed under the terms and conditions of the Creative Commons Attribution (CC BY) license (https://creativecommons.org/licenses/by/4.0/).
Share and Cite
Saadat, N.P.; van Aalst, M.; Ebenhöh, O. Network Reconstruction and Modelling Made Reproducible with moped. Metabolites 2022, 12, 275. https://doi.org/10.3390/metabo12040275
Saadat NP, van Aalst M, Ebenhöh O. Network Reconstruction and Modelling Made Reproducible with moped. Metabolites. 2022; 12(4):275. https://doi.org/10.3390/metabo12040275
Chicago/Turabian StyleSaadat, Nima P., Marvin van Aalst, and Oliver Ebenhöh. 2022. "Network Reconstruction and Modelling Made Reproducible with moped" Metabolites 12, no. 4: 275. https://doi.org/10.3390/metabo12040275
APA StyleSaadat, N. P., van Aalst, M., & Ebenhöh, O. (2022). Network Reconstruction and Modelling Made Reproducible with moped. Metabolites, 12(4), 275. https://doi.org/10.3390/metabo12040275