
Impact of Influenza A Virus Infection on Growth and Metabolism of Suspension MDCK Cells Using a Dynamic Model


Abstract

1. Introduction
2. Results and Discussion
2.1. Simulation of Cell Growth and Virus Production
2.2. Simulation of Substrate and Metabolic By-Product Dynamics
2.3. Simulation of Intracellular Metabolism
2.3.1. Glycolysis, Pentose Phosphate Cycle and Uridine Diphosphate Sugar Metabolism
2.3.2. TCA Cycle
2.3.3. Energy Metabolism
2.3.4. Analysis of Intracellular Rates
3. Materials and Methods
3.1. Shake Flask Cultivations
3.2. Analytics
3.2.1. Cell Count and Cell Volume
3.2.2. Hemagglutination Activity Assay
3.2.3. Imaging Flow Cytometry
3.2.4. Extracellular Metabolites
3.2.5. Intracellular Metabolites
3.3. Model Definition
3.3.1. Segregated Cell Growth and Infection Model
3.3.2. Structured Model of the Central Carbon Metabolism
3.4. Parameter Fitting and Model Simulation
4. Conclusions
Supplementary Materials
Author Contributions
Funding
Institutional Review Board Statement
Informed Consent Statement
Data Availability Statement
Acknowledgments
Conflicts of Interest
References
- Genzel, Y.; Rödig, J.; Rapp, E.; Reichl, U. Vaccine Production: Upstream Processing with Adherent or Suspension Cell Lines. In Animal Cell Biotechnology; Pörtner, R., Ed.; Methods in Molecular Biology; Humana Press: Totowa, NJ, USA, 2014; Volume 1104, pp. 371–393. ISBN 978-1-62703-732-7. [Google Scholar]
- Robertson, J.S.; Cook, P.; Attwell, A.M.; Williams, S.P. Replicative advantage in tissue culture of egg-adapted influenza virus over tissue-culture derived virus: Implications for vaccine manufacture. Vaccine 1995, 13, 1583–1588. [Google Scholar] [CrossRef]
- Govorkova, E.A.; Kodihalli, S.; Alymova, I.V.; Fanget, B.; Webster, R.G. Growth and immunogenicity of influenza viruses cultivated in Vero or MDCK cells and in embryonated chicken eggs. Dev. Biol. Stand. 1999, 98, 39–51; discussion 73–74. [Google Scholar] [PubMed]
- Tree, J.A.; Richardson, C.; Fooks, A.R.; Clegg, J.C.; Looby, D. Comparison of large-scale mammalian cell culture systems with egg culture for the production of influenza virus A vaccine strains. Vaccine 2001, 19, 3444–3450. [Google Scholar] [CrossRef]
- Hussain, A.I.; Cordeiro, M.; Sevilla, E.; Liu, J. Comparison of egg and high yielding MDCK cell-derived live attenuated influenza virus for commercial production of trivalent influenza vaccine: In vitro cell susceptibility and influenza virus replication kinetics in permissive and semi-permissive cells. Vaccine 2010, 28, 3848–3855. [Google Scholar] [CrossRef] [PubMed]
- Gregersen, J.-P.; Schmitt, H.-J.; Trusheim, H.; Bröker, M. Safety of MDCK cell culture-based influenza vaccines. Future Microbiol. 2011, 6, 143–152. [Google Scholar] [CrossRef] [PubMed]
- Ambrozaitis, A.; Groth, N.; Bugarini, R.; Sparacio, V.; Podda, A.; Lattanzi, M. A novel mammalian cell-culture technique for consistent production of a well-tolerated and immunogenic trivalent subunit influenza vaccine. Vaccine 2009, 27, 6022–6029. [Google Scholar] [CrossRef] [PubMed]
- Tzeng, T.-T.; Chen, P.-L.; Weng, T.-C.; Tsai, S.-Y.; Lai, C.-C.; Chou, H.-I.; Chen, P.-W.; Lu, C.-C.; Liu, M.-T.; Sung, W.-C.; et al. Development of high-growth influenza H7N9 prepandemic candidate vaccine viruses in suspension MDCK cells. J. Biomed. Sci. 2020, 27, 47. [Google Scholar] [CrossRef] [PubMed]
- Lowy, R.J. Influenza virus induction of apoptosis by intrinsic and extrinsic mechanisms. Int. Rev. Immunol. 2003, 22, 425–449. [Google Scholar] [CrossRef] [PubMed]
- Santos, L.A.; Solá, S.; Rodrigues, C.M.P.; Rebelo-de-Andrade, H. Distinct kinetics and pathways of apoptosis in influenza A and B virus infection. Virus Res. 2015, 205, 33–40. [Google Scholar] [CrossRef] [PubMed]
- Ludwig, S.; Pleschka, S.; Planz, O.; Wolff, T. Ringing the alarm bells: Signalling and apoptosis in influenza virus infected cells. Cell. Microbiol. 2006, 8, 375–386. [Google Scholar] [CrossRef]
- de Vries, W.; Haasnoot, J.; van der Velden, J.; van Montfort, T.; Zorgdrager, F.; Paxton, W.; Cornelissen, M.; van Kuppeveld, F.; de Haan, P.; Berkhout, B. Increased virus replication in mammalian cells by blocking intracellular innate defense responses. Gene Ther. 2008, 15, 545–552. [Google Scholar] [CrossRef] [PubMed]
- Young, D.F.; Andrejeva, L.; Livingstone, A.; Goodbourn, S.; Lamb, R.A.; Collins, P.L.; Elliott, R.M.; Randall, R.E. Virus Replication in Engineered Human Cells That Do Not Respond to Interferons. J. Virol. 2003, 77, 2174–2181. [Google Scholar] [CrossRef] [PubMed]
- Schulze-Horsel, J.; Schulze, M.; Agalaridis, G.; Genzel, Y.; Reichl, U. Infection dynamics and virus-induced apoptosis in cell culture-based influenza vaccine production-Flow cytometry and mathematical modeling. Vaccine 2009, 27, 2712–2722. [Google Scholar] [CrossRef] [PubMed]
- Majors, B.S.; Betenbaugh, M.J.; Chiang, G.G. Links between metabolism and apoptosis in mammalian cells: Applications for anti-apoptosis engineering. Metab. Eng. 2007, 9, 317–326. [Google Scholar] [CrossRef] [PubMed]
- Kim, J.W.; Dang, C.V. Multifaceted roles of glycolytic enzymes. Trends Biochem. Sci. 2005, 30, 142–150. [Google Scholar] [CrossRef] [PubMed]
- Pastorino, J.; Hoek, J. Hexokinase II: The Integration of Energy Metabolism and Control of Apoptosis. Curr. Med. Chem. 2005, 10, 1535–1551. [Google Scholar] [CrossRef] [PubMed]
- Shaw, M.L.; Stertz, S. Role of Host Genes in Influenza Virus Replication. In Cellular and Molecular Immunology; Springer: Cham, Switzerland, 2017; pp. 151–189. ISBN 9783030053697. [Google Scholar]
- Fernandes, P.; Santiago, V.M.; Rodrigues, A.F.; Tomás, H.; Kremer, E.J.; Alves, P.M.; Coroadinha, A.S. Impact of E1 and Cre on Adenovirus Vector Amplification: Developing MDCK CAV-2-E1 and E1-Cre Transcomplementing Cell Lines. PLoS ONE 2013, 8, e60342. [Google Scholar] [CrossRef] [PubMed]
- Laske, T.; Bachmann, M.; Dostert, M.; Karlas, A.; Wirth, D.; Frensing, T.; Meyer, T.F.; Hauser, H.; Reichl, U. Model-based analysis of influenza A virus replication in genetically engineered cell lines elucidates the impact of host cell factors on key kinetic parameters of virus growth. PLoS Comput. Biol. 2019, 15, e1006944. [Google Scholar] [CrossRef] [PubMed]
- Ritter, J.B.; Wahl, A.S.; Freund, S.; Genzel, Y.; Reichl, U. Metabolic effects of influenza virus infection in cultured animal cells: Intra- and extracellular metabolite profiling. BMC Syst. Biol. 2010, 4, 61. [Google Scholar] [CrossRef] [PubMed]
- Genzel, Y.; Behrendt, I.; König, S.; Sann, H.; Reichl, U. Metabolism of MDCK cells during cell growth and influenza virus production in large-scale microcarrier culture. Vaccine 2004, 22, 2202–2208. [Google Scholar] [CrossRef] [PubMed]
- Silva, A.C.; Teixeira, A.P.; Alves, P.M. Impact of Adenovirus infection in host cell metabolism evaluated by 1 H-NMR spectroscopy. J. Biotechnol. 2016, 231, 16–23. [Google Scholar] [CrossRef] [PubMed]
- Vastag, L.; Koyuncu, E.; Grady, S.L.; Shenk, T.E.; Rabinowitz, J.D. Divergent Effects of Human Cytomegalovirus and Herpes Simplex Virus-1 on Cellular Metabolism. PLoS Pathog. 2011, 7, e1002124. [Google Scholar] [CrossRef] [PubMed]
- Bernal, V.; Monteiro, F.; Carinhas, N.; Ambrósio, R.; Alves, P.M. An integrated analysis of enzyme activities, cofactor pools and metabolic fluxes in baculovirus-infected Spodoptera frugiperda Sf9 cells. J. Biotechnol. 2010, 150, 332–342. [Google Scholar] [CrossRef] [PubMed]
- Sanchez, E.L.; Lagunoff, M. Viral activation of cellular metabolism. Virology 2015, 479, 609–618. [Google Scholar] [CrossRef] [PubMed]
- Cvijovic, M.; Almquist, J.; Hagmar, J.; Hohmann, S.; Kaltenbach, H.M.; Klipp, E.; Krantz, M.; Mendes, P.; Nelander, S.; Nielsen, J.; et al. Bridging the gaps in systems biology. Mol. Genet. Genomics 2014, 289, 727–734. [Google Scholar] [CrossRef] [PubMed]
- Batt, B.C.; Kompala, D.S. A structured kinetic modeling framework for the dynamics of hybridoma growth and monoclonal antibody production in continuous suspension cultures. Biotechnol. Bioeng. 1989, 34, 515–531. [Google Scholar] [CrossRef] [PubMed]
- Bailey, J.E. Mathematical Modeling and Analysis in Biochemical Engineering: Past Accomplishments and Future Opportunities. Biotechnol. Prog. 1998, 14, 8–20. [Google Scholar] [CrossRef]
- van Riel, N.A.W. Dynamic modelling and analysis of biochemical networks: Mechanism-based models and model-based experiments. Brief. Bioinform. 2006, 7, 364–374. [Google Scholar] [CrossRef] [PubMed]
- Sidoli, F.R.; Mantalaris, A.; Asprey, S.P. Modelling of mammalian cells and cell culture processes. Cytotechnology 2004, 44, 27–46. [Google Scholar] [CrossRef] [PubMed]
- Miskovic, L.; Tokic, M.; Fengos, G.; Hatzimanikatis, V. Rites of passage: Requirements and standards for building kinetic models of metabolic phenotypes. Curr. Opin. Biotechnol. 2015, 36, 146–153. [Google Scholar] [CrossRef]
- Le Novère, N. Quantitative and logic modelling of molecular and gene networks. Nat. Rev. Genet. 2015, 16, 146–158. [Google Scholar] [CrossRef] [PubMed]
- Almquist, J.; Cvijovic, M.; Hatzimanikatis, V.; Nielsen, J.; Jirstrand, M. Kinetic models in industrial biotechnology—Improving cell factory performance. Metab. Eng. 2014, 24, 38–60. [Google Scholar] [CrossRef] [PubMed]
- Macklin, D.N.; Ruggero, N.A.; Covert, M.W. The future of whole-cell modeling. Curr. Opin. Biotechnol. 2014, 28, 111–115. [Google Scholar] [CrossRef] [PubMed]
- Strutz, J.; Martin, J.; Greene, J.; Broadbelt, L.; Tyo, K. Metabolic kinetic modeling provides insight into complex biological questions, but hurdles remain. Curr. Opin. Biotechnol. 2019, 59, 24–30. [Google Scholar] [CrossRef] [PubMed]
- Fröhlich, F.; Loos, C.; Hasenauer, J. Scalable Inference of Ordinary Differential Equation Models of Biochemical Processes. In Methods in Molecular Biology; Springer: New York, NY, USA, 2019; Volume 1883, pp. 385–422. ISBN 9781493988822. [Google Scholar]
- Nielsen, J. Systems Biology of Metabolism. Annu. Rev. Biochem. 2017, 86, 245–275. [Google Scholar] [CrossRef] [PubMed]
- von Stosch, M.; Peres, J.; de Azevedo, S.F.; Oliveira, R. Modelling biochemical networks with intrinsic time delays: A hybrid semi-parametric approach. BMC Syst. Biol. 2010, 4, 8–12. [Google Scholar] [CrossRef] [PubMed]
- Karr, J.R.; Sanghvi, J.C.; MacKlin, D.N.; Gutschow, M.V.; Jacobs, J.M.; Bolival, B.; Assad-Garcia, N.; Glass, J.I.; Covert, M.W. A whole-cell computational model predicts phenotype from genotype. Cell 2012, 150, 389–401. [Google Scholar] [CrossRef] [PubMed]
- Khodayari, A.; Zomorrodi, A.R.; Liao, J.C.; Maranas, C.D. A kinetic model of Escherichia coli core metabolism satisfying multiple sets of mutant flux data. Metab. Eng. 2014, 25, 50–62. [Google Scholar] [CrossRef] [PubMed]
- Theobald, U.; Mailinger, W.; Baltes, M.; Rizzi, M.; Reuss, M. In vivo analysis of metabolic dynamics in Saccharomyces cerevisiae: I. Experimental observations. Biotechnol. Bioeng. 1997, 55, 305–316. [Google Scholar] [CrossRef]
- König, M.; Bulik, S.; Holzhütter, H.G. Quantifying the contribution of the liver to glucose homeostasis: A detailed kinetic model of human hepatic glucose metabolism. PLoS Comput. Biol. 2012, 8, e1002577. [Google Scholar] [CrossRef]
- Noguchi, R.; Kubota, H.; Yugi, K.; Toyoshima, Y.; Komori, Y.; Soga, T.; Kuroda, S. The selective control of glycolysis, gluconeogenesis and glycogenesis by temporal insulin patterns. Mol. Syst. Biol. 2013, 9, 664. [Google Scholar] [CrossRef] [PubMed]
- Rehberg, M.; Ritter, J.B.; Reichl, U. Glycolysis Is Governed by Growth Regime and Simple Enzyme Regulation in Adherent MDCK Cells. PLoS Comput. Biol. 2014, 10, e1003885. [Google Scholar] [CrossRef] [PubMed]
- Bazil, J.N.; Buzzard, G.T.; Rundell, A.E. Modeling Mitochondrial Bioenergetics with Integrated Volume Dynamics. PLoS Comput. Biol. 2010, 6, e1000632. [Google Scholar] [CrossRef] [PubMed]
- Nazaret, C.; Heiske, M.; Thurley, K.; Mazat, J.P. Mitochondrial energetic metabolism: A simplified model of TCA cycle with ATP production. J. Theor. Biol. 2009, 258, 455–464. [Google Scholar] [CrossRef] [PubMed]
- Sidorenko, Y.; Reichl, U. Structured model of influenza virus replication in MDCK cells. Biotechnol. Bioeng. 2004, 88, 1–14. [Google Scholar] [CrossRef] [PubMed]
- Martinez, V.; Gerdtzen, Z.P.; Andrews, B.A.; Asenjo, J.A. Viral vectors for the treatment of alcoholism: Use of metabolic flux analysis for cell cultivation and vector production. Metab. Eng. 2010, 12, 129–137. [Google Scholar] [CrossRef] [PubMed]
- Carinhas, N.; Koshkin, A.; Pais, D.A.M.; Alves, P.M.; Teixeira, A.P. 13 C-metabolic flux analysis of human adenovirus infection: Implications for viral vector production. Biotechnol. Bioeng. 2017, 114, 195–207. [Google Scholar] [CrossRef] [PubMed]
- Carinhas, N.; Pais, D.A.M.; Koshkin, A.; Fernandes, P.; Coroadinha, A.S.; Carrondo, M.J.T.; Alves, P.M.; Teixeira, A.P. Metabolic flux profiling of MDCK cells during growth and canine adenovirus vector production. Sci. Rep. 2016, 6, 23529. [Google Scholar] [CrossRef] [PubMed]
- Ramos, J.R.C.; Rath, A.G.; Genzel, Y.; Sandig, V.; Reichl, U. A dynamic model linking cell growth to intracellular metabolism and extracellular by-product accumulation. Biotechnol. Bioeng. 2020, 117, 1533–1553. [Google Scholar] [CrossRef] [PubMed]
- Rehberg, M.; Ritter, J.B.; Genzel, Y.; Flockerzi, D.; Reichl, U. The relation between growth phases, cell volume changes and metabolism of adherent cells during cultivation. J. Biotechnol. 2013, 164, 489–499. [Google Scholar] [CrossRef] [PubMed]
- Rehberg, M.; Wetzel, M.; Ritter, J.B.; Reichl, U. The regulation of glutaminolysis and citric acid cycle activity during mammalian cell cultivation. IFAC Proc. Vol. 2013, 12, 48–53. [Google Scholar] [CrossRef]
- Janke, R.; Genzel, Y.; Händel, N.; Wahl, A.; Reichl, U. Metabolic adaptation of MDCK cells to different growth conditions: Effects on catalytic activities of central metabolic enzymes. Biotechnol. Bioeng. 2011, 108, 2691–2704. [Google Scholar] [CrossRef] [PubMed]
- Rath, A.G.; Rehberg, M.; Janke, R.; Genzel, Y.; Scholz, S.; Noll, T.; Rose, T.; Sandig, V.; Reichl, U. The influence of cell growth and enzyme activity changes on intracellular metabolite dynamics in AGE1.HN.AAT cells. J. Biotechnol. 2014, 178, 43–53. [Google Scholar] [CrossRef] [PubMed]
- Rehberg, M. Dynamics in Growth and Metabolism of Adherent MDCK Cells Unraveled by an Integrated Modeling Approach; Otto-von-Guericke-Universität: Magdeburg, Germany, 2015. [Google Scholar]
- Rehberg, M.; Rath, A.; Ritter, J.B.; Genzel, Y.; Reichl, U. Changes in intracellular metabolite pools during growth of adherent MDCK cells in two different media. Appl. Microbiol. Biotechnol. 2014, 98, 385–397. [Google Scholar] [CrossRef] [PubMed]
- Lopez-Lazaro, M. The Warburg Effect: Why and How Do Cancer Cells Activate Glycolysis in the Presence of Oxygen? Anticancer. Agents Med. Chem. 2008, 8, 305–312. [Google Scholar] [CrossRef] [PubMed]
- Pelicano, H.; Martin, D.S.; Xu, R.-H.; Huang, P. Glycolysis inhibition for anticancer treatment. Oncogene 2006, 25, 4633–4646. [Google Scholar] [CrossRef] [PubMed]
- Martínez, V.S.; Dietmair, S.; Quek, L.-E.; Hodson, M.P.; Gray, P.; Nielsen, L.K. Flux balance analysis of CHO cells before and after a metabolic switch from lactate production to consumption. Biotechnol. Bioeng. 2013, 110, 660–666. [Google Scholar] [CrossRef] [PubMed]
- Xie, J.; Wu, H.; Dai, C.; Pan, Q.; Ding, Z.; Hu, D.; Ji, B.; Luo, Y.; Hu, X. Beyond Warburg effect—dual metabolic nature of cancer cells. Sci. Rep. 2015, 4, 4927. [Google Scholar] [CrossRef] [PubMed]
- Mulukutla, B.C.; Yongky, A.; Grimm, S.; Daoutidis, P.; Hu, W.S. Multiplicity of steady states in glycolysis and shift of metabolic state in cultured mammalian cells. PLoS ONE 2015, 10, 1–20. [Google Scholar] [CrossRef]
- Ryll, T.; Valley, U.; Wagner, R. Biochemistry of growth inhibition by ammonium ions in mammalian cells. Biotechnol. Bioeng. 1994, 44, 184–193. [Google Scholar] [CrossRef] [PubMed]
- Schmid, G.; Blanch, H.W. Extra- and intracellular metabolite concentrations for murine hybridoma cells. Appl. Microbiol. Biotechnol. 1992, 36, 621–625. [Google Scholar] [CrossRef] [PubMed]
- Genzel, Y.; Fischer, M.; Reichl, U. Serum-free influenza virus production avoiding washing steps and medium exchange in large-scale microcarrier culture. Vaccine 2006, 24, 3261–3272. [Google Scholar] [CrossRef] [PubMed]
- Hartley, F.; Walker, T.; Chung, V.; Morten, K. Mechanisms driving the lactate switch in Chinese hamster ovary cells. Biotechnol. Bioeng. 2018, 115, 1890–1903. [Google Scholar] [CrossRef] [PubMed]
- Im, D.-K.; Cheong, H.; Lee, J.S.; Oh, M.-K.; Yang, K.M. Protein kinase CK2-dependent aerobic glycolysis-induced lactate dehydrogenase A enhances the migration and invasion of cancer cells. Sci. Rep. 2019, 9, 5337. [Google Scholar] [CrossRef] [PubMed]
- Bröer, S.; Bröer, A. Amino acid homeostasis and signalling in mammalian cells and organisms. Biochem. J. 2017, 474, 1935–1963. [Google Scholar] [CrossRef] [PubMed]
- Sauro, H.M. Enzyme Kinetics for Systems Biology; Future Skill Software (Ambrosius Publishing): Washington, DC, USA, 2012; ISBN 9780982477311. [Google Scholar]
- Sonnewald, U. Glutamate synthesis has to be matched by its degradation—Where do all the carbons go? J. Neurochem. 2014, 131, 399–406. [Google Scholar] [CrossRef] [PubMed]
- Bissinger, T. Evaluation of MDCK Suspension Cell Lines for Influenza A Virus Production: Media, Metabolism, and Process Conditions; Otto-von-Guericke-Universität: Magdeburg, Germany, 2020. [Google Scholar]
- Lohr, V.; Hädicke, O.; Genzel, Y.; Jordan, I.; Büntemeyer, H.; Klamt, S.; Reichl, U. The avian cell line AGE1.CR.pIX characterized by metabolic flux analysis. BMC Biotechnol. 2014, 14, 72. [Google Scholar] [CrossRef] [PubMed]
- Tanner, L.B.; Goglia, A.G.; Wei, M.H.; Sehgal, T.; Parsons, L.R.; Park, J.O.; White, E.; Toettcher, J.E.; Rabinowitz, J.D. Four Key Steps Control Glycolytic Flux in Mammalian Cells. Cell Syst. 2018, 7, 49–62.e8. [Google Scholar] [CrossRef] [PubMed]
- Yalcin, A.; Telang, S.; Clem, B.; Chesney, J. Regulation of glucose metabolism by 6-phosphofructo-2-kinase/fructose-2,6-bisphosphatases in cancer. Exp. Mol. Pathol. 2009, 86, 174–179. [Google Scholar] [CrossRef] [PubMed]
- Sola-Penna, M.; Da Silva, D.; Coelho, W.S.; Marinho-Carvalho, M.M.; Zancan, P. Regulation of mammalian muscle type 6-phosphofructo-1-kinase and its implication for the control of the metabolism. IUBMB Life 2010, 62, 791–796. [Google Scholar] [CrossRef] [PubMed]
- Eprintsev, A.T.; Wu, T.L.; Selivanova, N.V.; Khasan Khamad, A. Obtaining homogenous preparations of succinate dehydrogenase isoforms from the D-507 strain of Sphaerotilus natans. Appl. Biochem. Microbiol. 2012, 48, 541–545. [Google Scholar] [CrossRef]
- Manhas, N.; Duong, Q.V.; Lee, P.; Richardson, J.D.; Robertson, J.D.; Moxley, M.A.; Bazil, J.N. Computationally modeling mammalian succinate dehydrogenase kinetics identifies the origins and primary determinants of ROS production. J. Biol. Chem. 2020, 295, 15262–15279. [Google Scholar] [CrossRef] [PubMed]
- Cairns, R.A.; Harris, I.S.; Mak, T.W. Regulation of cancer cell metabolism. Nat. Rev. Cancer 2011, 11, 85–95. [Google Scholar] [CrossRef] [PubMed]
- Cantor, J.R.; Sabatini, D.M. Cancer cell metabolism: One hallmark, many faces. Cancer Discov. 2012, 2, 881–898. [Google Scholar] [CrossRef] [PubMed]
- Grüning, N.M.; Lehrach, H.; Ralser, M. Regulatory crosstalk of the metabolic network. Trends Biochem. Sci. 2010, 35, 220–227. [Google Scholar] [CrossRef] [PubMed]
- Hyde, R.; Taylor, P.M.; Hundal, H.S. Amino acid transporters: Roles in amino acid sensing and signalling in animal cells. Biochem. J. 2003, 373, 1–18. [Google Scholar] [CrossRef] [PubMed]
- Yuan, H.-X.; Xiong, Y.; Guan, K.-L. Nutrient Sensing, Metabolism, and Cell Growth Control. Mol. Cell 2013, 49, 379–387. [Google Scholar] [CrossRef] [PubMed]
- Barabási, A.L.; Oltvai, Z.N. Network biology: Understanding the cell’s functional organization. Nat. Rev. Genet. 2004, 5, 101–113. [Google Scholar] [CrossRef]
- Zu, X.L.; Guppy, M. Cancer metabolism: Facts, fantasy, and fiction. Biochem. Biophys. Res. Commun. 2004, 313, 459–465. [Google Scholar] [CrossRef]
- Wagner, B.A.; Venkataraman, S.; Buettner, G.R. The rate of oxygen utilization by cells. Free Radic. Biol. Med. 2011, 51, 700–712. [Google Scholar] [CrossRef]
- Herst, P.M.; Berridge, M.V. Cell surface oxygen consumption: A major contributor to cellular oxygen consumption in glycolytic cancer cell lines. Biochim. Biophys. Acta—Bioenerg. 2007, 1767, 170–177. [Google Scholar] [CrossRef] [PubMed]
- Mahmoudabadi, G.; Milo, R.; Phillips, R. Energetic cost of building a virus. Proc. Natl. Acad. Sci. USA 2017, 114, E4324–E4333. [Google Scholar] [CrossRef] [PubMed]
- Klemperer, H. Glucose breakdown in chick embryo cells infected with influenza virus. Virology 1961, 13, 68–77. [Google Scholar] [CrossRef]
- Petch, D.; Butler, M. Profile of energy metabolism in a murine hybridoma: Glucose and glutamine utilization. J. Cell. Physiol. 1994, 161, 71–76. [Google Scholar] [CrossRef] [PubMed]
- Bonarius, H.P.J.; Özemre, A.; Timmerarends, B.; Skrabal, P.; Tramper, J.; Schmid, G.; Heinzle, E. Metabolic-flux analysis of continuously cultured hybridoma cells using 13CO2 mass spectrometry in combination with 13C-lactate nuclear magnetic resonance spectroscopy and metabolite balancing. Biotechnol. Bioeng. 2001, 74, 528–538. [Google Scholar] [CrossRef] [PubMed]
- Goudar, C.; Biener, R.; Boisart, C.; Heidemann, R.; Piret, J.; de Graaf, A.; Konstantinov, K. Metabolic flux analysis of CHO cells in perfusion culture by metabolite balancing and 2D [13C, 1H] COSY NMR spectroscopy. Metab. Eng. 2010, 12, 138–149. [Google Scholar] [CrossRef] [PubMed]
- Dean, J.; Reddy, P. Metabolic analysis of antibody producing CHO cells in fed-batch production. Biotechnol. Bioeng. 2013, 110, 1735–1747. [Google Scholar] [CrossRef] [PubMed]
- DeBerardinis, R.J.; Lum, J.J.; Hatzivassiliou, G.; Thompson, C.B. The Biology of Cancer: Metabolic Reprogramming Fuels Cell Growth and Proliferation. Cell Metab. 2008, 7, 11–20. [Google Scholar] [CrossRef]
- Lohr, V.; Genzel, Y.; Behrendt, I.; Scharfenberg, K.; Reichl, U. A new MDCK suspension line cultivated in a fully defined medium in stirred-tank and wave bioreactor. Vaccine 2010, 28, 6256–6264. [Google Scholar] [CrossRef]
- Kalbfuss, B.; Knöchlein, A.; Kröber, T.; Reichl, U. Monitoring influenza virus content in vaccine production: Precise assays for the quantitation of hemagglutination and neuraminidase activity. Biologicals 2008, 36, 145–161. [Google Scholar] [CrossRef]
- Frensing, T.; Kupke, S.Y.; Bachmann, M.; Fritzsche, S.; Gallo-Ramirez, L.E.; Reichl, U. Influenza virus intracellular replication dynamics, release kinetics, and particle morphology during propagation in MDCK cells. Appl. Microbiol. Biotechnol. 2016, 100, 7181–7192. [Google Scholar] [CrossRef] [PubMed]
- Momose, F.; Kikuchi, Y.; Komase, K.; Morikawa, Y. Visualization of microtubule-mediated transport of influenza viral progeny ribonucleoprotein. Microbes Infect. 2007, 9, 1422–1433. [Google Scholar] [CrossRef] [PubMed]
- Sellick, C.A.; Croxford, A.S.; Maqsood, A.R.; Stephens, G.; Westerhoff, H.V.; Goodacre, R.; Dickson, A.J. Metabolite profiling of recombinant CHO cells: Designing tailored feeding regimes that enhance recombinant antibody production. Biotechnol. Bioeng. 2011, 108, 3025–3031. [Google Scholar] [CrossRef] [PubMed]
- Ritter, J.B.; Genzel, Y.; Reichl, U. High-performance anion-exchange chromatography using on-line electrolytic eluent generation for the determination of more than 25 intermediates from energy metabolism of mammalian cells in culture. J. Chromatogr. B Anal. Technol. Biomed. Life Sci. 2006, 843, 216–226. [Google Scholar] [CrossRef] [PubMed]
- Ritter, J.B.; Genzel, Y.; Reichl, U. Simultaneous extraction of several metabolites of energy metabolism and related substances in mammalian cells: Optimization using experimental design. Anal. Biochem. 2008, 373, 349–369. [Google Scholar] [CrossRef] [PubMed]
- Rüdiger, D.; Kupke, S.Y.; Laske, T.; Zmora, P.; Reichl, U. Multiscale modeling of influenza a virus replication in cell cultures predicts infection dynamics for highly different infection conditions. PLoS Comput. Biol. 2019, 15, 1–22. [Google Scholar] [CrossRef] [PubMed]
- Schmidt, H.; Jirstrand, M. Systems Biology Toolbox for MATLAB: A computational platform for research in systems biology. Bioinformatics 2006, 22, 514–515. [Google Scholar] [CrossRef] [PubMed]
- Cohen, S.D.; Hindmarsh, A.C. CVODE, a stiff/nonstiff ODE solver in C. Comput. Phys. 1996, 10, 138–143. [Google Scholar] [CrossRef]
- Hansen, N.; Kern, S. Evaluating the CMA Evolution Strategy on Multimodal Test Functions. In Lecture Notes in Computer Science (Including Subseries Lecture Notes in Artificial Intelligence and Lecture Notes in Bioinformatics); Springer: Berlin/Heidelberg, Germany, 2004; pp. 282–291. ISBN 9783540302179. [Google Scholar]
- Hansen, N.; Ostermeier, A. Completely Derandomized Self-Adaptation in Evolution Strategies. Evol. Comput. 2001, 9, 159–195. [Google Scholar] [CrossRef]
 and infected
  ). Lines: model simulations. Vertical blue lines correspond to 0, 12 and 24 h post infection. Experimental data used for parameter estimation: A1, B1, C1 (see Supplementary Files S4 and S5).
and infected ). Lines: model simulations. Vertical blue lines correspond to 0, 12 and 24 h post infection. Experimental data used for parameter estimation: A1, B1, C1 (see Supplementary Files S4 and S5).
). Lines: model simulations. Vertical blue lines correspond to 0, 12 and 24 h post infection. Experimental data used for parameter estimation: A1, B1, C1 (see Supplementary Files S4 and S5).
and infected ). Lines: model simulations. Vertical blue lines correspond to 0, 12 and 24 h post infection. Experimental data used for parameter estimation: A1, B1, C1 (see Supplementary Files S4 and S5). ).
).
).
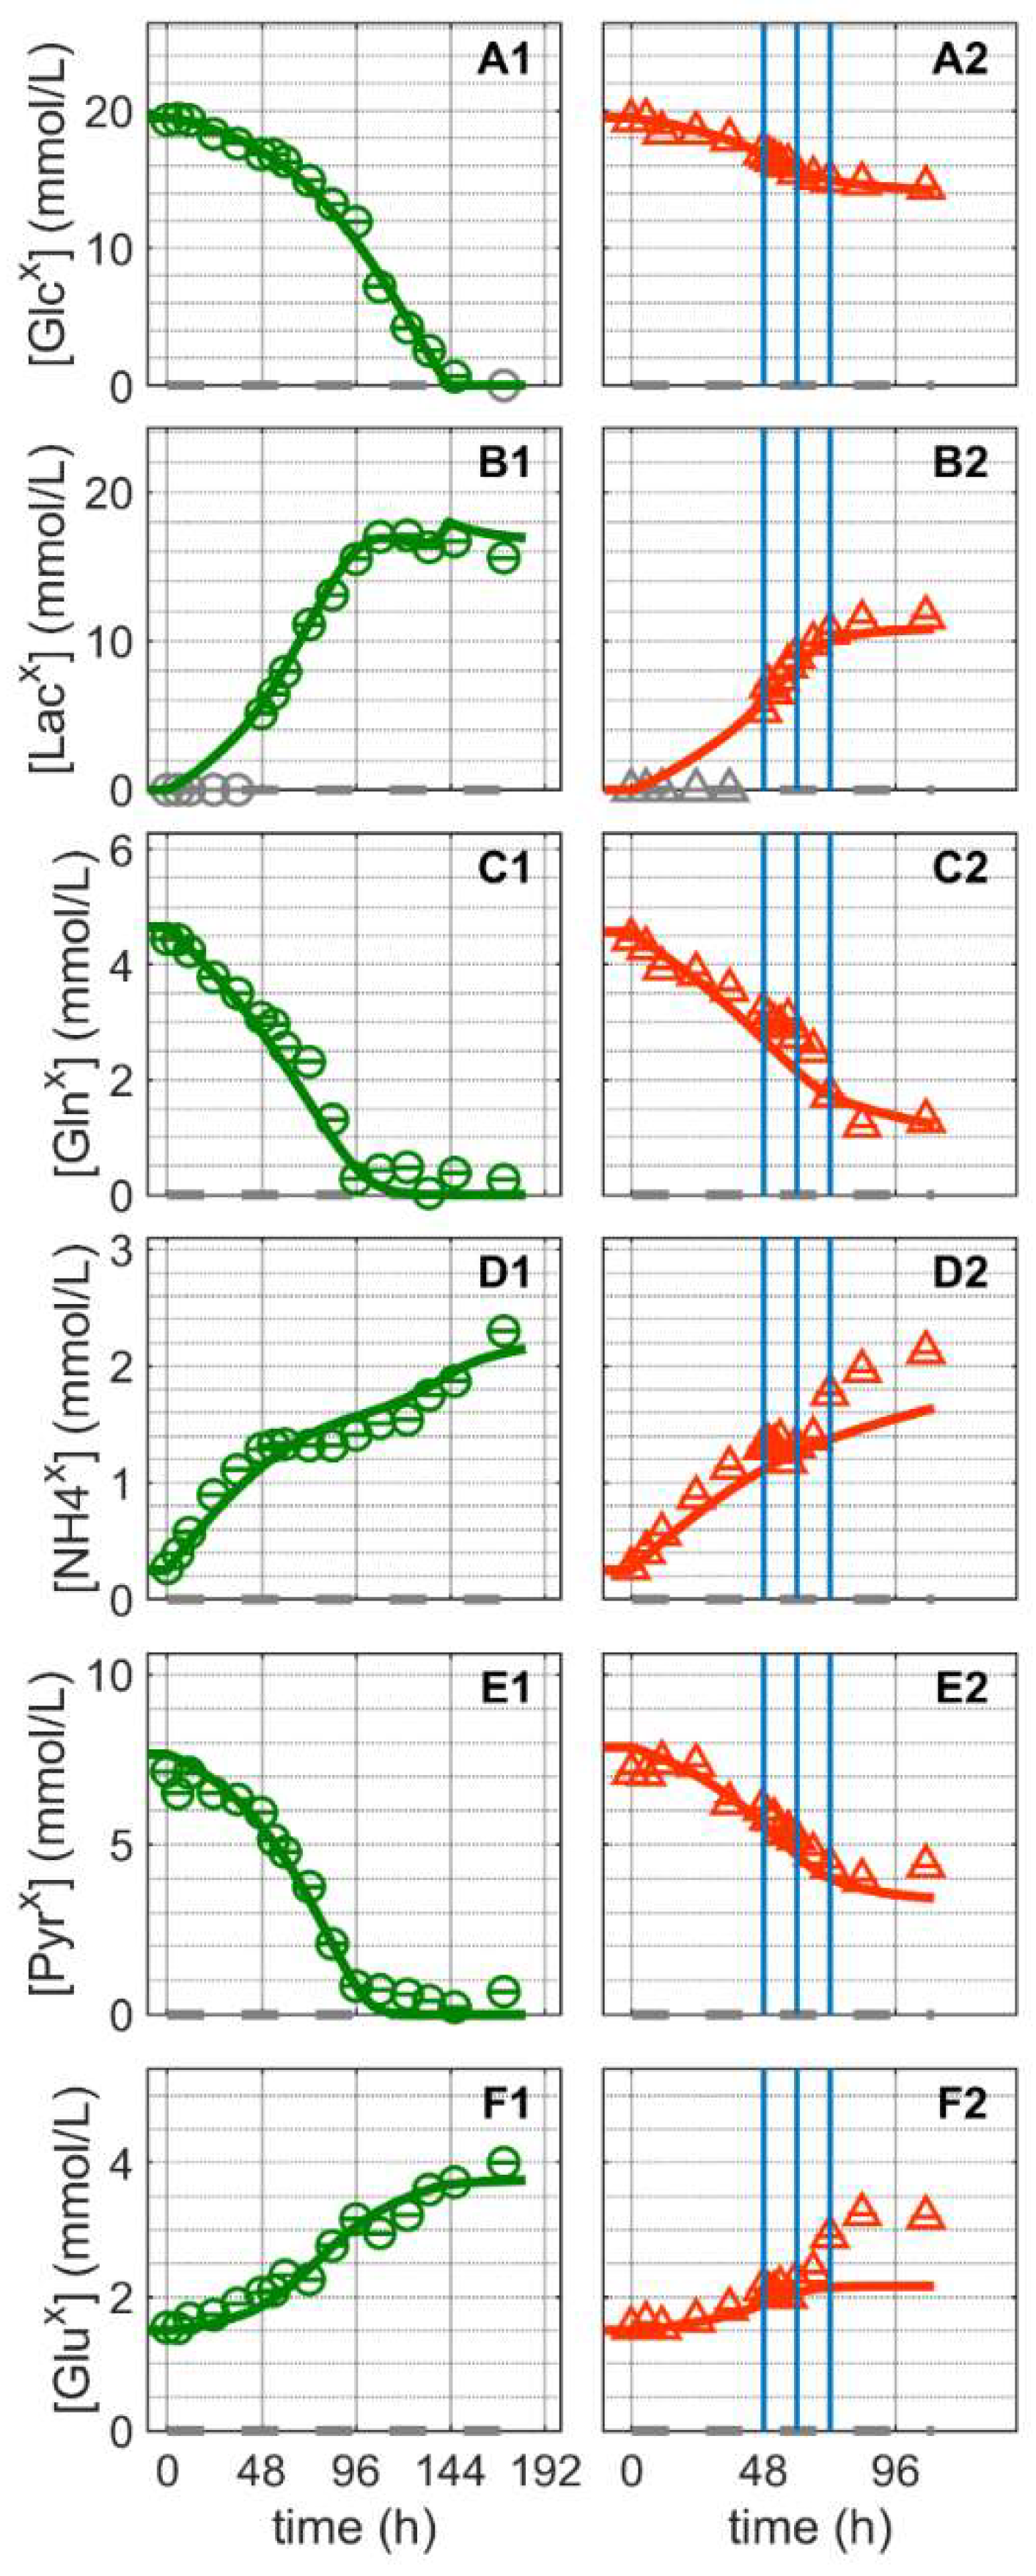
). and infected ). Lines: model simulations. Vertical blue lines correspond to 0, 12 and 24 h post infection, respectively. The grey dashed lines indicate the limit of quantification for each metabolite and grey data points are under the limit of quantification. Experimental data used for parameter estimation: A1, B1, C1, D1, E1 and F1 (see Supplementary Files S4 and S5).
and infected ). Lines: model simulations. Vertical blue lines correspond to 0, 12 and 24 h post infection, respectively. The grey dashed lines indicate the limit of quantification for each metabolite and grey data points are under the limit of quantification. Experimental data used for parameter estimation: A1, B1, C1, D1, E1 and F1 (see Supplementary Files S4 and S5).
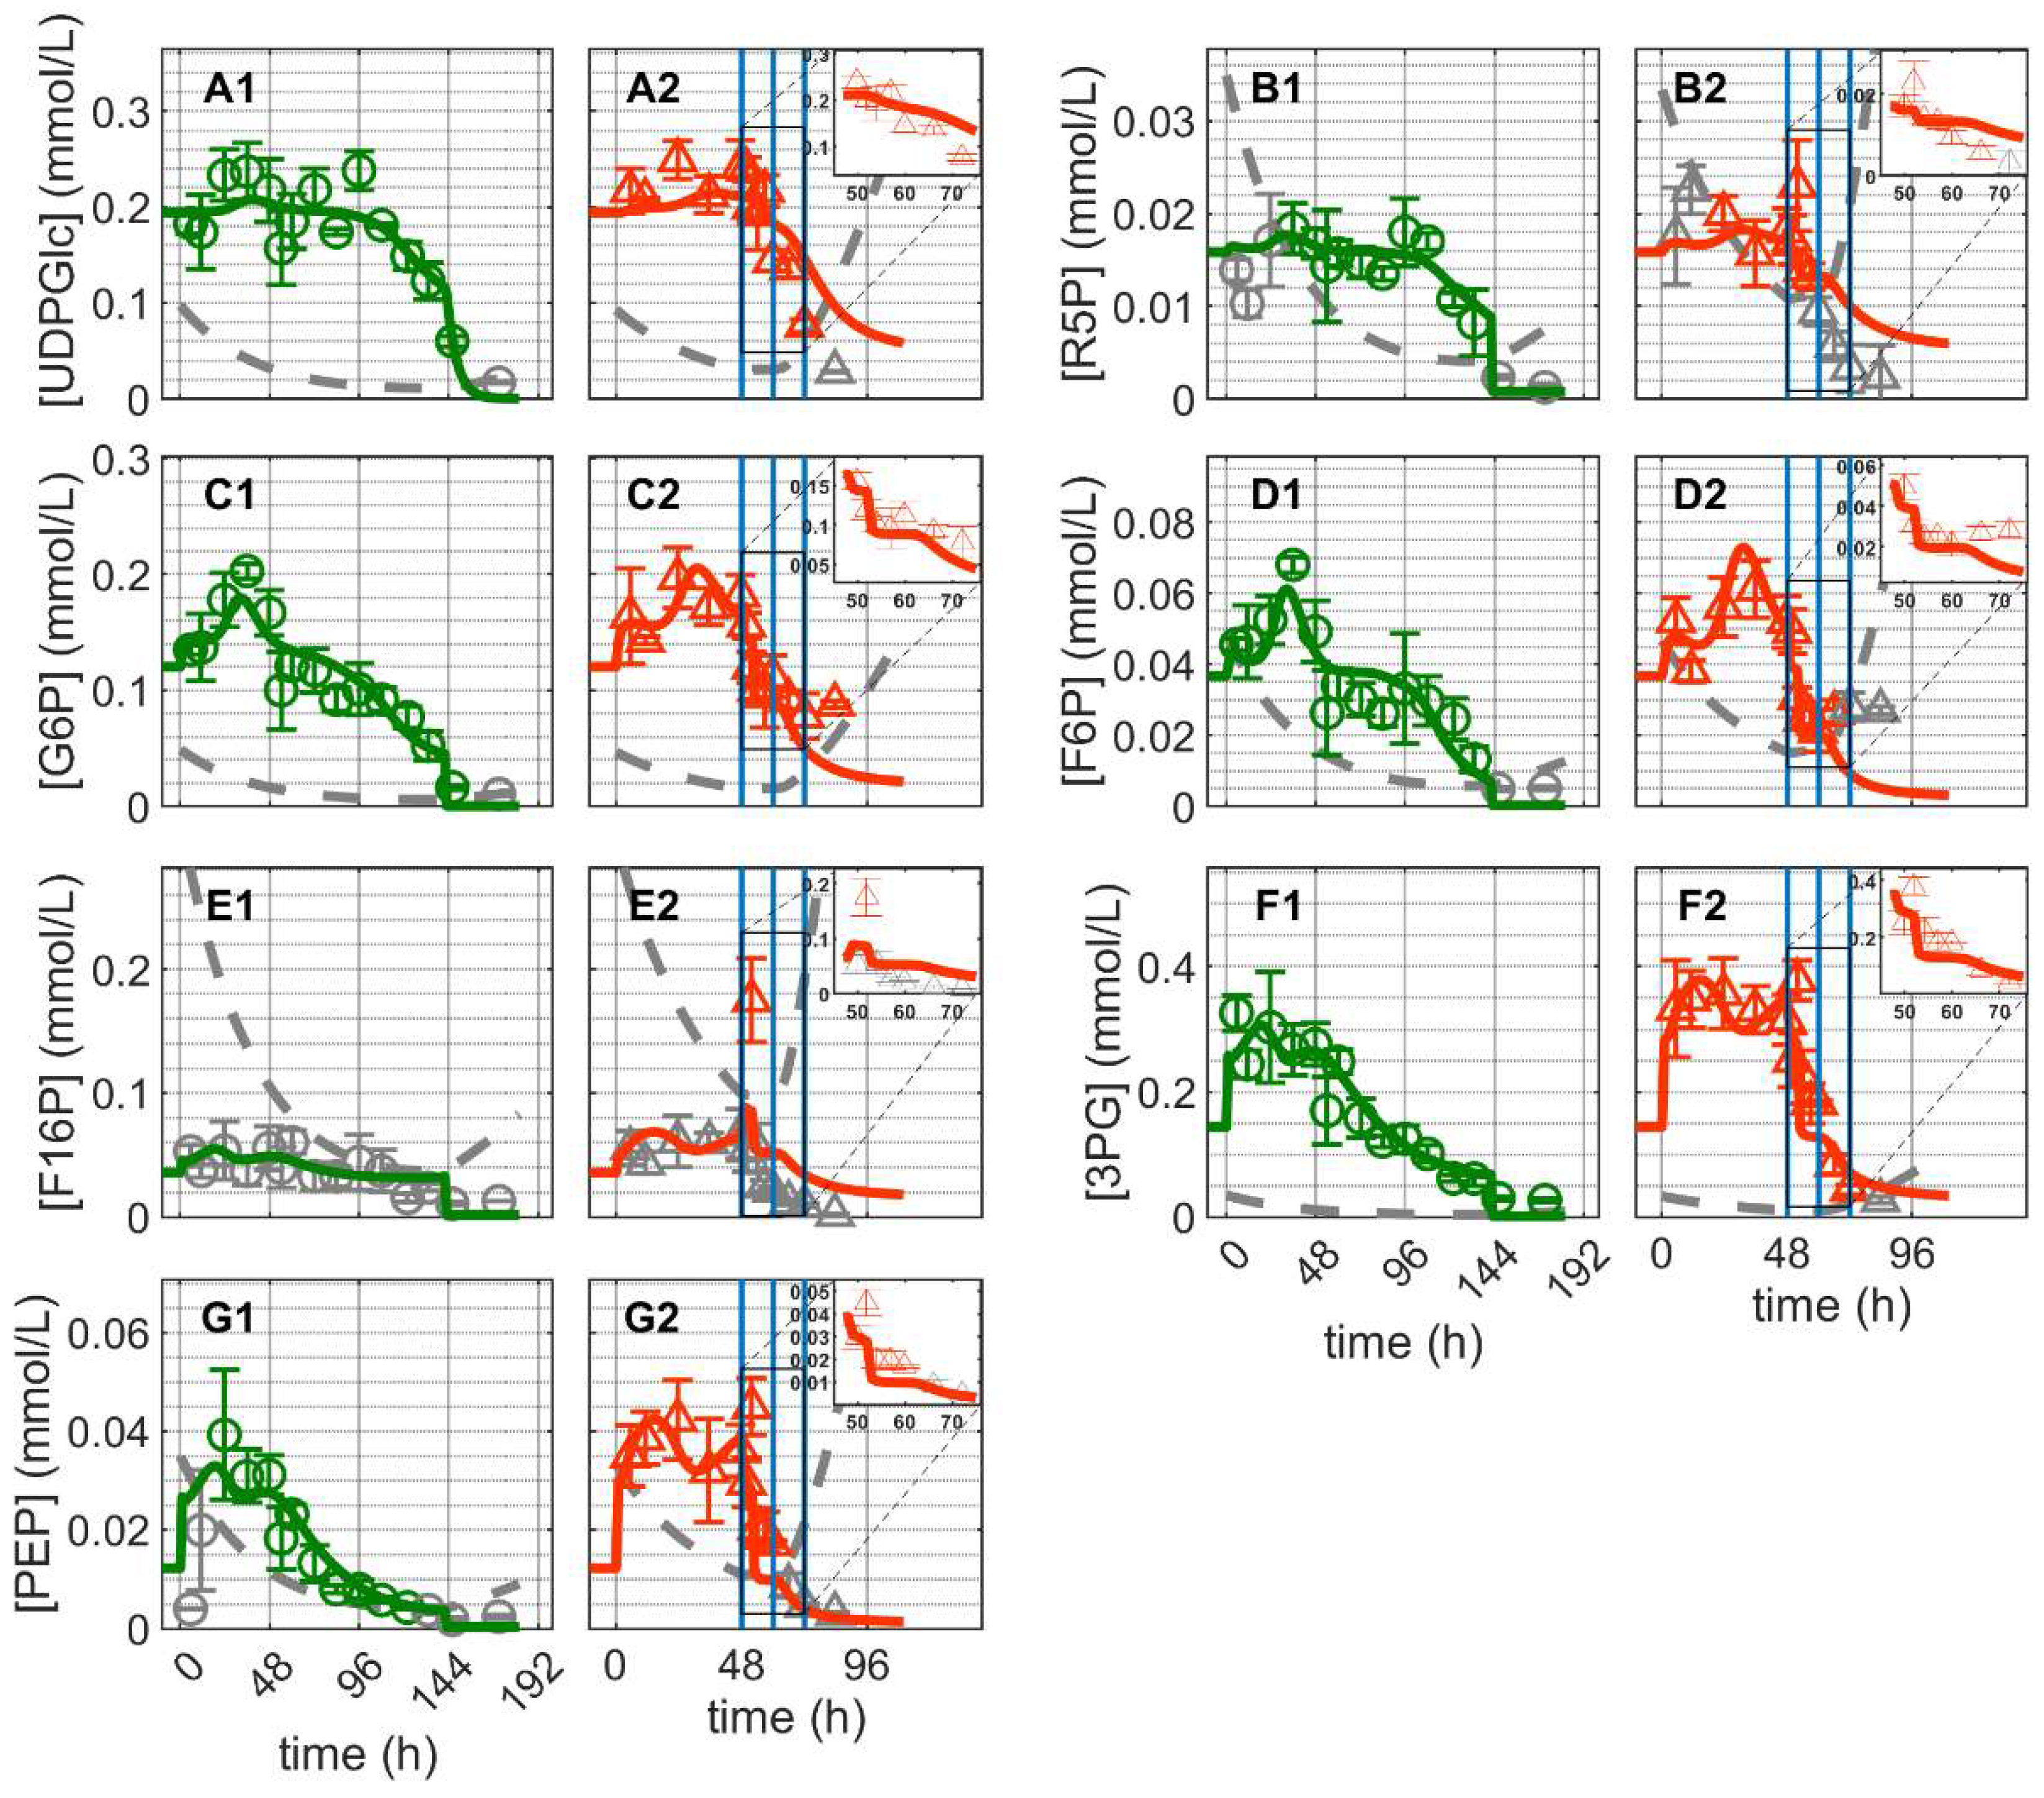
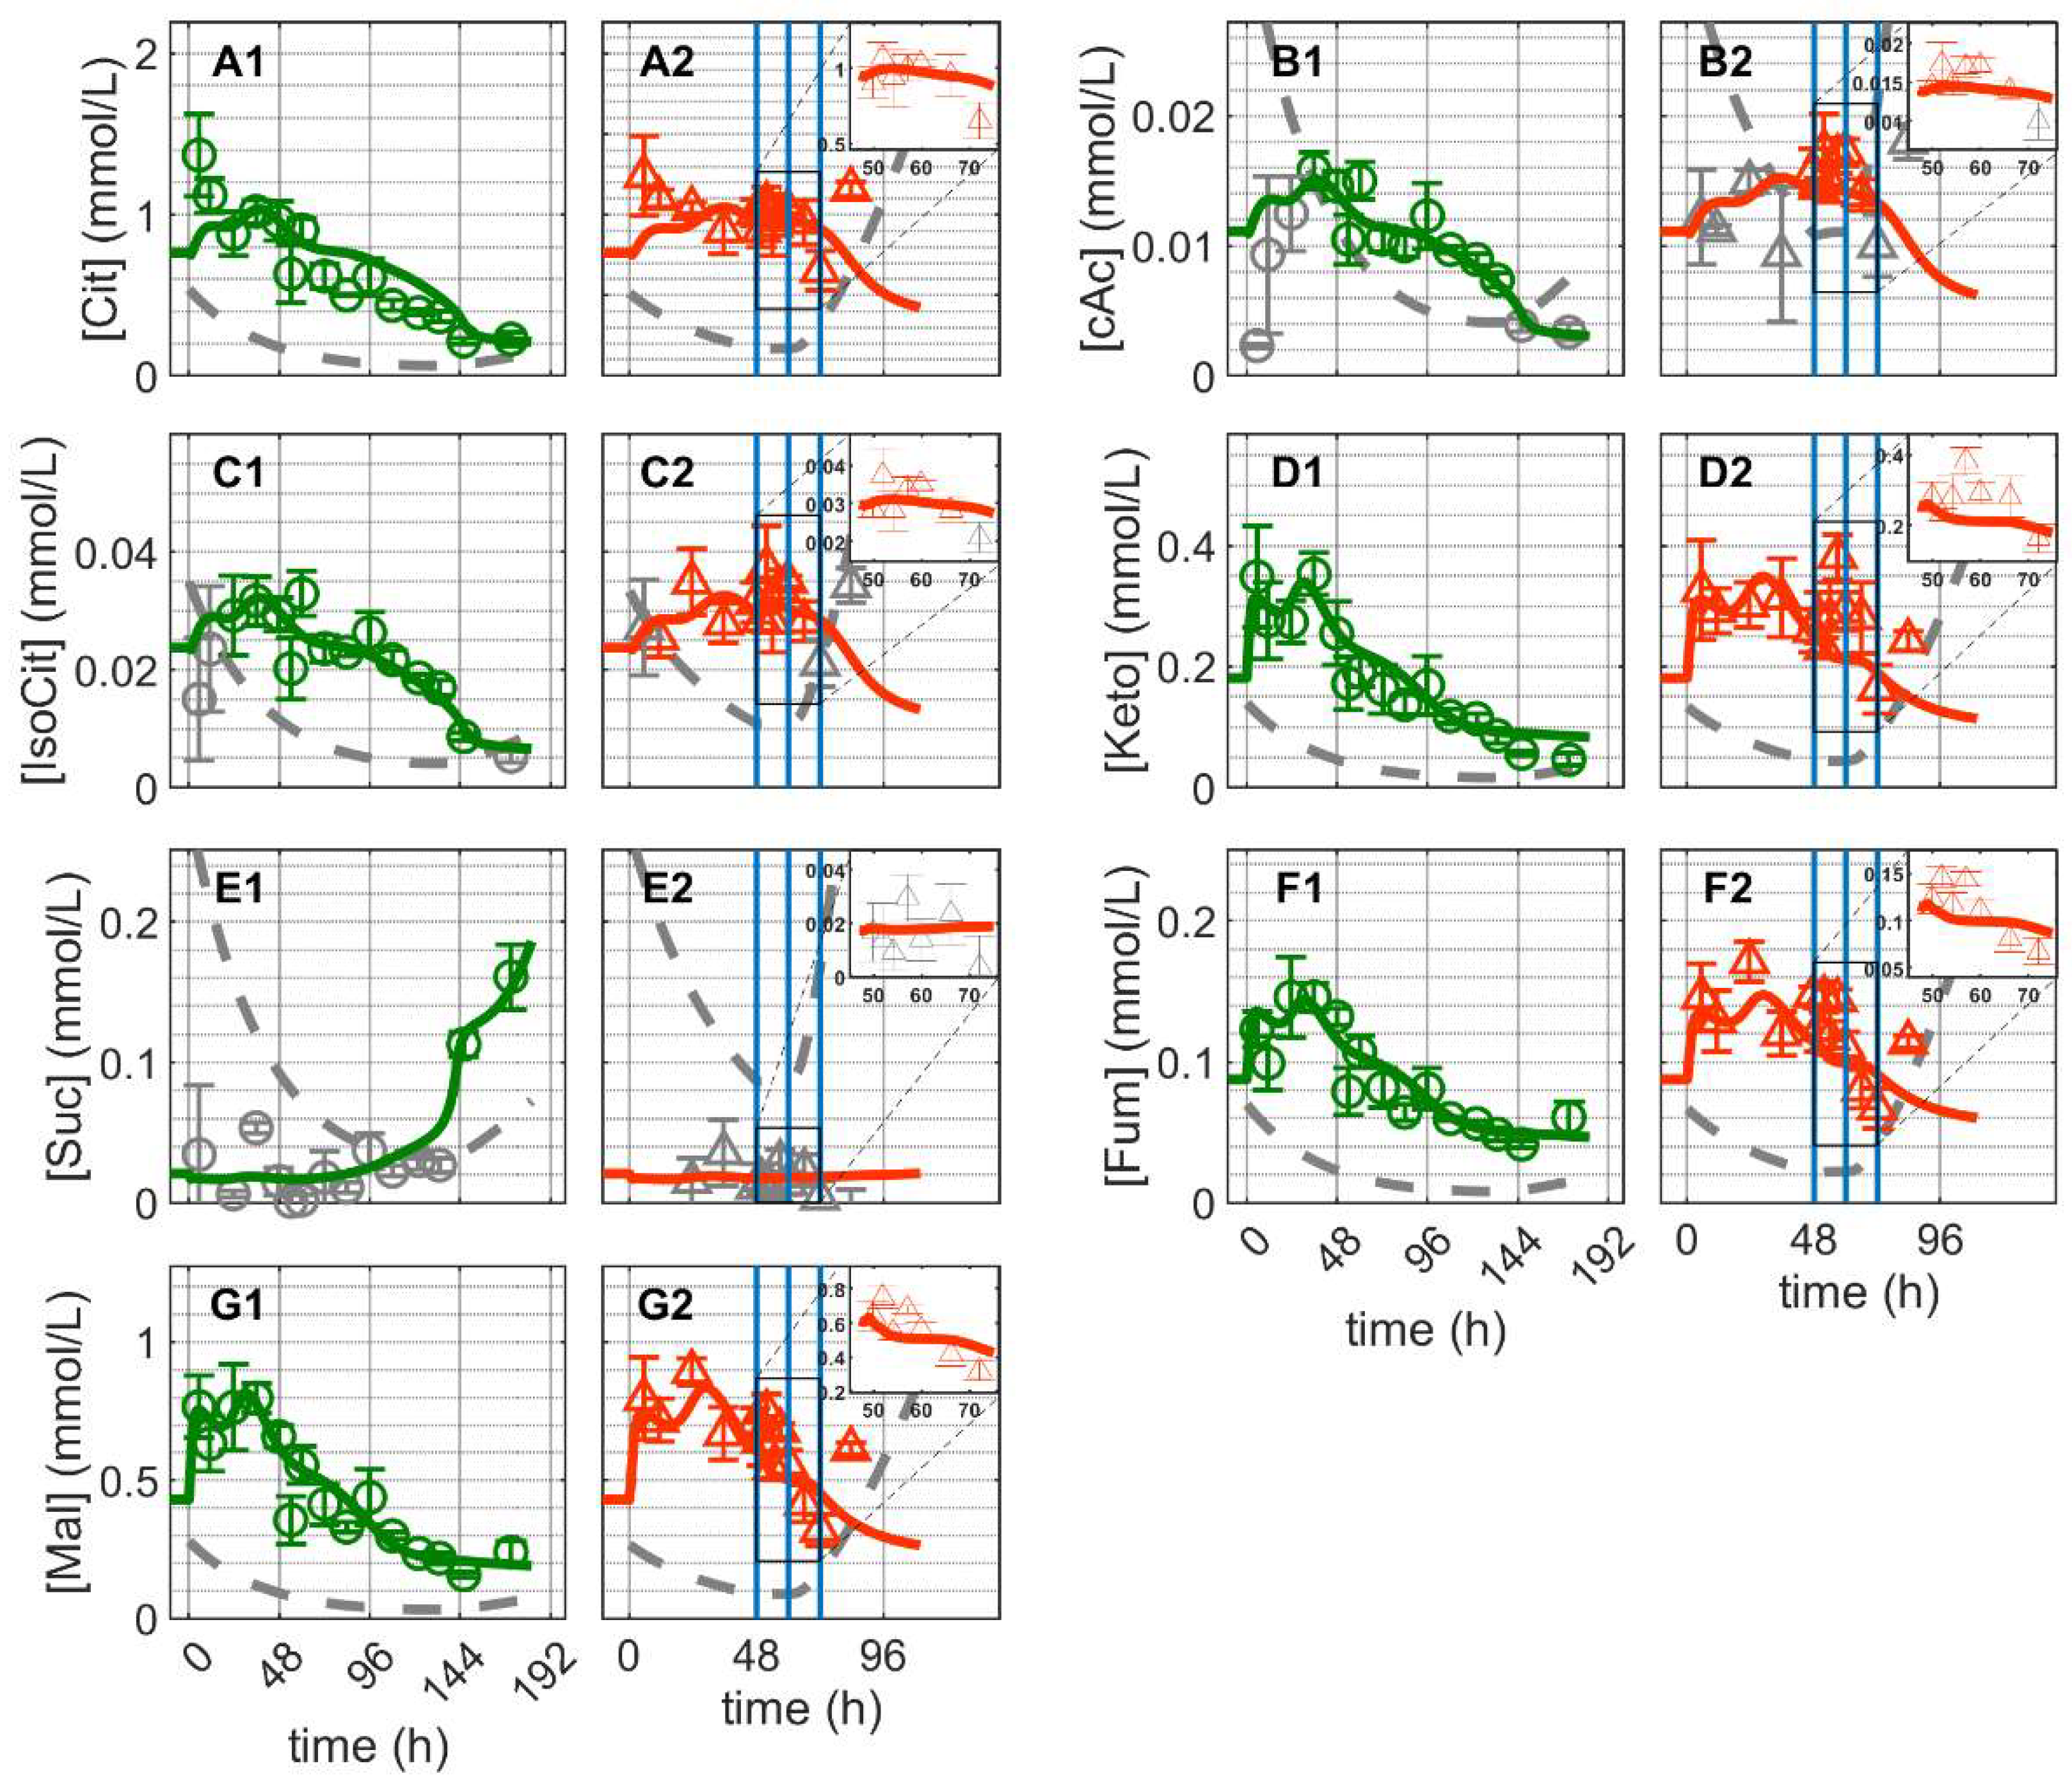
and infected ). Lines: model simulations. Vertical blue lines correspond to 0, 12 and 24 h post infection, respectively. The grey dashed lines indicate the limit of quantification for each metabolite and grey data points are under the limit of quantification. Experimental data used for parameter estimation: A1, B1, C1, D1, E1 and F1 (see Supplementary Files S4 and S5). and infected ). Lines: model simulations. Vertical blue lines correspond to (0, 12 and 24 h post infection, respectively). The grey lines indicate the limit of quantification for each metabolite and the grey data points are under the limit of quantification. Experimental data used for parameter estimation: A1, B1, C1, D1, E1, F1 and G1 (see Supplementary Files S4 and S5).
and infected ). Lines: model simulations. Vertical blue lines correspond to (0, 12 and 24 h post infection, respectively). The grey lines indicate the limit of quantification for each metabolite and the grey data points are under the limit of quantification. Experimental data used for parameter estimation: A1, B1, C1, D1, E1, F1 and G1 (see Supplementary Files S4 and S5).
and infected ). Lines: model simulations. Vertical blue lines correspond to (0, 12 and 24 h post infection, respectively). The grey lines indicate the limit of quantification for each metabolite and the grey data points are under the limit of quantification. Experimental data used for parameter estimation: A1, B1, C1, D1, E1, F1 and G1 (see Supplementary Files S4 and S5). and infected ). Lines: model simulations. Vertical blue lines correspond to (0, 12 and 24 h post infection, respectively). The grey lines indicate the limit of quantification for each metabolite and the grey data points are under the limit of quantification. Experimental data used for parameter estimation: A1, B1, C1, D1, E1, F1 and G1 (see Supplementary Files S4 and S5).
and infected ). Lines: model simulations. Vertical blue lines correspond to (0, 12 and 24 h post infection, respectively). The grey lines indicate the limit of quantification for each metabolite and the grey data points are under the limit of quantification. Experimental data used for parameter estimation: A1, B1, C1, D1, E1, F1 and G1 (see Supplementary Files S4 and S5).
and infected ). Lines: model simulations. Vertical blue lines correspond to (0, 12 and 24 h post infection, respectively). The grey lines indicate the limit of quantification for each metabolite and the grey data points are under the limit of quantification. Experimental data used for parameter estimation: A1, B1, C1, D1, E1, F1 and G1 (see Supplementary Files S4 and S5). and infected ). Lines: model simulations. Vertical blue lines correspond to (0, 12 and 24 h post infection, respectively). The grey lines indicate the limit of quantification for each metabolite and the grey data points are under the limit of quantification. Experimental data used for parameter estimation: A1 (see Supplementary Files S4 and S5).
and infected ). Lines: model simulations. Vertical blue lines correspond to (0, 12 and 24 h post infection, respectively). The grey lines indicate the limit of quantification for each metabolite and the grey data points are under the limit of quantification. Experimental data used for parameter estimation: A1 (see Supplementary Files S4 and S5).
and infected ). Lines: model simulations. Vertical blue lines correspond to (0, 12 and 24 h post infection, respectively). The grey lines indicate the limit of quantification for each metabolite and the grey data points are under the limit of quantification. Experimental data used for parameter estimation: A1 (see Supplementary Files S4 and S5).
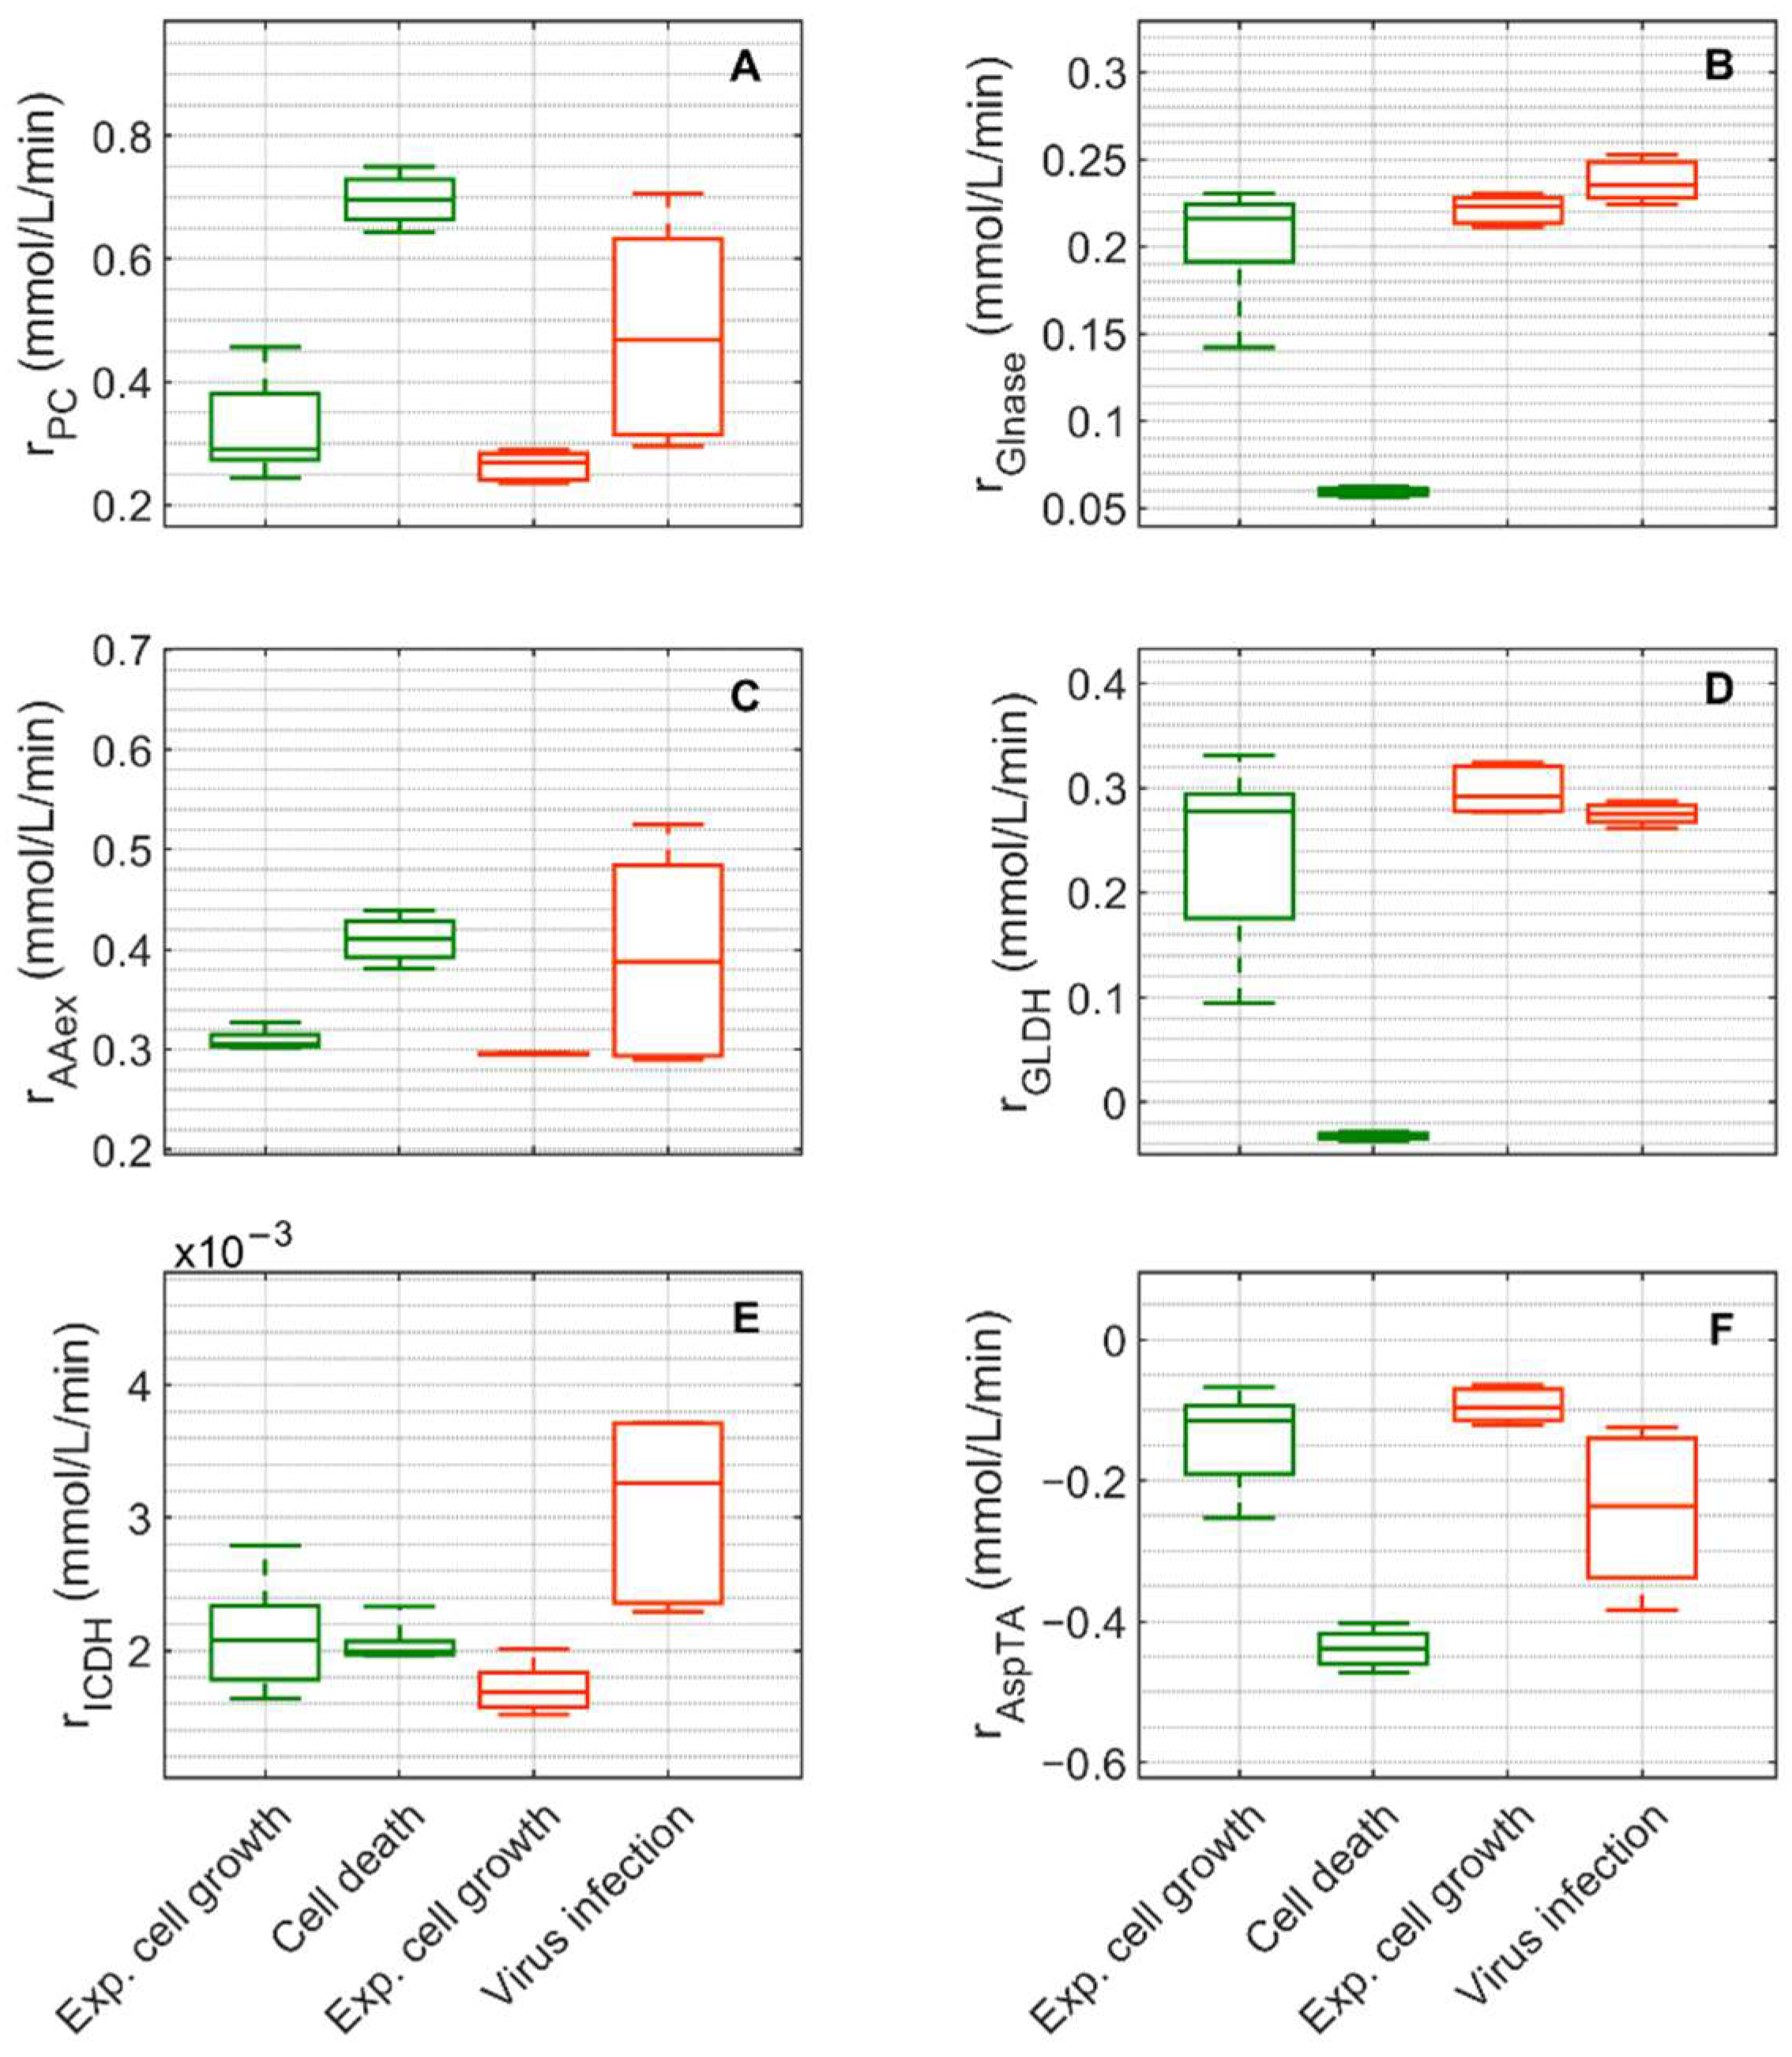
 , 6–108 h), the death phase of Cultivation 1 (, 146–169 h), the exponential growth phase of Cultivation 2 (
 , 6–48 h) and the virus replication phase of Cultivation 2 (, 49.9–107 h). The bar represents the median, the box is the first and third quartile, and the whisker the minimum and maximum of the rates from the model simulations of the corresponding cultivation phase.
, 6–108 h), the death phase of Cultivation 1 (, 146–169 h), the exponential growth phase of Cultivation 2 (, 6–48 h) and the virus replication phase of Cultivation 2 (, 49.9–107 h). The bar represents the median, the box is the first and third quartile, and the whisker the minimum and maximum of the rates from the model simulations of the corresponding cultivation phase.
, 6–48 h) and the virus replication phase of Cultivation 2 (, 49.9–107 h). The bar represents the median, the box is the first and third quartile, and the whisker the minimum and maximum of the rates from the model simulations of the corresponding cultivation phase.
, 6–108 h), the death phase of Cultivation 1 (, 146–169 h), the exponential growth phase of Cultivation 2 (, 6–48 h) and the virus replication phase of Cultivation 2 (, 49.9–107 h). The bar represents the median, the box is the first and third quartile, and the whisker the minimum and maximum of the rates from the model simulations of the corresponding cultivation phase. , 6–108 h), the death phase of Cultivation 1 (, 146–169 h), the exponential growth phase of Cultivation 2 (, 6–48 h) and the virus replication phase of Cultivation 2 (, 49.9–107 h). The bar represents the median, the box is the first and third quartile, and the whisker the minimum and maximum of the rates from the model simulations of the corresponding cultivation phase.
, 6–108 h), the death phase of Cultivation 1 (, 146–169 h), the exponential growth phase of Cultivation 2 (, 6–48 h) and the virus replication phase of Cultivation 2 (, 49.9–107 h). The bar represents the median, the box is the first and third quartile, and the whisker the minimum and maximum of the rates from the model simulations of the corresponding cultivation phase.
, 6–108 h), the death phase of Cultivation 1 (, 146–169 h), the exponential growth phase of Cultivation 2 (, 6–48 h) and the virus replication phase of Cultivation 2 (, 49.9–107 h). The bar represents the median, the box is the first and third quartile, and the whisker the minimum and maximum of the rates from the model simulations of the corresponding cultivation phase.

Publisher’s Note: MDPI stays neutral with regard to jurisdictional claims in published maps and institutional affiliations. |
© 2022 by the authors. Licensee MDPI, Basel, Switzerland. This article is an open access article distributed under the terms and conditions of the Creative Commons Attribution (CC BY) license (https://creativecommons.org/licenses/by/4.0/).
Share and Cite
Ramos, J.R.C.; Bissinger, T.; Genzel, Y.; Reichl, U. Impact of Influenza A Virus Infection on Growth and Metabolism of Suspension MDCK Cells Using a Dynamic Model. Metabolites 2022, 12, 239. https://doi.org/10.3390/metabo12030239
Ramos JRC, Bissinger T, Genzel Y, Reichl U. Impact of Influenza A Virus Infection on Growth and Metabolism of Suspension MDCK Cells Using a Dynamic Model. Metabolites. 2022; 12(3):239. https://doi.org/10.3390/metabo12030239
Chicago/Turabian StyleRamos, João Rodrigues Correia, Thomas Bissinger, Yvonne Genzel, and Udo Reichl. 2022. "Impact of Influenza A Virus Infection on Growth and Metabolism of Suspension MDCK Cells Using a Dynamic Model" Metabolites 12, no. 3: 239. https://doi.org/10.3390/metabo12030239
APA StyleRamos, J. R. C., Bissinger, T., Genzel, Y., & Reichl, U. (2022). Impact of Influenza A Virus Infection on Growth and Metabolism of Suspension MDCK Cells Using a Dynamic Model. Metabolites, 12(3), 239. https://doi.org/10.3390/metabo12030239