
Effects of a Metabolic Mixture on Gut Inflammation and Permeability in Elderly Patients with Chronic Kidney Disease: A Proof-of-Concept Study


 ,
, 
 ,
,
Abstract
1. Introduction
2. Methods
- Biohumoral variables, including 24 h urine protein content. Urea Nitrogen Appearance (UNA) was calculated to estimate protein intake [39].
- Body composition: Total Body Water (TBW), Extracellular Water (ECW) and Intracellular Water (ICW), all in liters (L), percentage of body weight, Resistance (RZ in Ohm), Conductance (XC in Ohm) and phase angle (in degrees), considered an indicator of skeletal muscle mass [40], were measured by Bioelectrical Impedance Analysis (BIA) by the same operator who used the same instrument (renal EFG 50 Hz,; EFG Diagnostic Ltd., Belfast, Northern Ireland).
- Determination of plasma AAs.
- 4.
- Determination of fecal calprotectin and Zo levels.
- 5.
- Evaluation of patient adherence to the mixture.
- 6.
- Estimation of the effects of the mixture on ureagenesis.
3. Statistical Analysis
4. Objectives of the Study
5. Results
5.1. Patients’ Baseline Characteristics vs. Controls (CTRL) (Table 2)

| Variables | CTR | CKD | p |
|---|---|---|---|
| Demographic, antrophometric variables | |||
| Male gender n (%) | 4 (36%) | 4 (50%) | 0.66 * |
| Age (years) | 72.27 ± 3.74 | 74.56 ± 6.90 | 0.32 |
| Body Weight (Kg) | 64.50 ± 12.80 | 62.76 ± 9.05 | 0.61 |
| Body surface (sqm) | 1.72 ± 0.20 | 1.66 ± 0.15 | 0.40 |
| Body mass index (Kg/m2) | 24.86± 2.79 | 25.31 ± 2.31 | 0.50 |
| BIA measures | |||
| Resistance (Ohm) | 536.3 ± 40.0 | 515.5 ± 113.2 | 0.99 |
| Conductance (Ohm) | 52.15 ± 12.42 | 42.25 ± 17.38 | 0.17 |
| Phase angle (NV > 5.0 degrees A°) | 5.16 ± 0.60 | 4.22 ± 0.67 | 0.008 ^ |
| Total Body Water (%) | 52.15 ± 12.42 | 55.93 ± 9.20 | 0.012 ^ |
| Extracellular Body Water (%) | 41.61 ± 15.61 | 55.75 ± 4.39 | <0.0001 ^ |
| Intracellular Water (%) | 35.65 ± 16.6 | 40.69 ± 10.06 | 0.59 |
| Biohumoral variables | |||
| Modification of Diet in Renal Disease | 88.20 ± 16.59 | 30.83 ± 7.88 | <0.0001 ^ |
| Glucose (NV. 70–100 mg/dL) | 94.36 ± 8.03 | 97.22 ±12.43 | 0.45 |
| Blood Urea Nitrogen (NV 9.35 ± 18.7 mg/dL) | 11.47 ± 3.52 | 43.86 ± 16.09 | <0.0001 ^ |
| Hemoglobin (NV F > 12; M > 13 g/dL) | 14.16 ± 1.20 | 11.85 ± 1.12 | 0.0006 ^ |
| Iron (NV 40–160 ug/dL) | 106.09 ± 26.69 | 72.38 ± 32.76 | 0.005 ^ |
| Ferritin (NV 30–230 ng/mL) | 175.60 ± 93.28 | 78.97 ± 60.65 | 0.016 ^ |
| Calcium (NV 8.2–10 mg/dL) | 9.72 ± 0.58 | 9.41 ± 0.52 | 0.14 |
| Phosphorus (NV 2.8–4.1 mg/dL) | 3.54 ± 0.60 | 4.14 ± 0.90 | 0.046 |
| Albumin (NV 4.0–4.8 g/dL) | 4.19 ± 0.20 | 6.94 ± 0.45 | 0.45 |
| Total protein (NV 6.2–8.0 g/dL) | 7.21 ± 0.043 | 7.07 ± 0.57 | 0.71 |
| Sodium (NV 136–146 mEq/L) | 141.03 ± 2.12 | 141.14 ± 2.89 | 0.49 |
| Potassium (NV 3.5–5.1 mEq/L) Triglycerides (NV 50–150mg/dl) Total cholesterol (NV 100–200 mg/dl) HDL cholesterol (NV > 40 mg/dl) LDL cholesterol (NV 0–100 mg/dl) Reactive C-protein (NV > 0.8 mg/dl) | 4.31 ± 0.41 98.91 ± 69.06 222.27 ± 23.09 64.18 ± 18.87 137.09 ± 22.52 0.13 ± 0.19 | 4.36 ± 0.47 75.50 ± 19.57 193.13 ± 34.69 77.86 ± 32.19 102.50 ± 20.79 0.30 ± 0.54 | 0.79 0.21 0.04 0.3 0.009 0.2 |
| Kidney function | |||
| 24 h urine proteins (NV <100) | 109.11 ± 78.02 | 324.04 ± 316.12 | 0.21 |
| Plasma creatinine (NV 0.6–1.4 mg/dL) | 0.8 ± 0.16 | 3.25 ± 1.43 | <0.0001 ^ |
| Estimated Glomerular Filtration Rate (eGFR; ml/min/1.73 sqm) | 88.1 ±19.63 | 27.79 ± 3.00 | <0.0001 ^ |
| Modification of Diet in Renal Disease (MDRD, ml/min/1.73 sqm) | 88.20 ± 16.59 | 30.83 ± 7.88 | <0.0001 ^ |
| Urinary nitrogen appearance (UNA, protein g/kg/day) | 1.08 ± 0.21 | 0.89 ± 0.21 | 0.02 ^ |
| Blood acid-base status | |||
| pH (NV 7.36–7.42) | 7.36 ± 0.02 | 7.35 ± 0.04 | 0.4 |
| Bicarbonate (NV 24–26 mEq/L | 26.69 ± 2.18 | 23.03 ± 1.42 | 0.001 ^ |
5.2. Changes in Baseline Variables after 6 Months of EAA Supplementation (T6-Baseline)
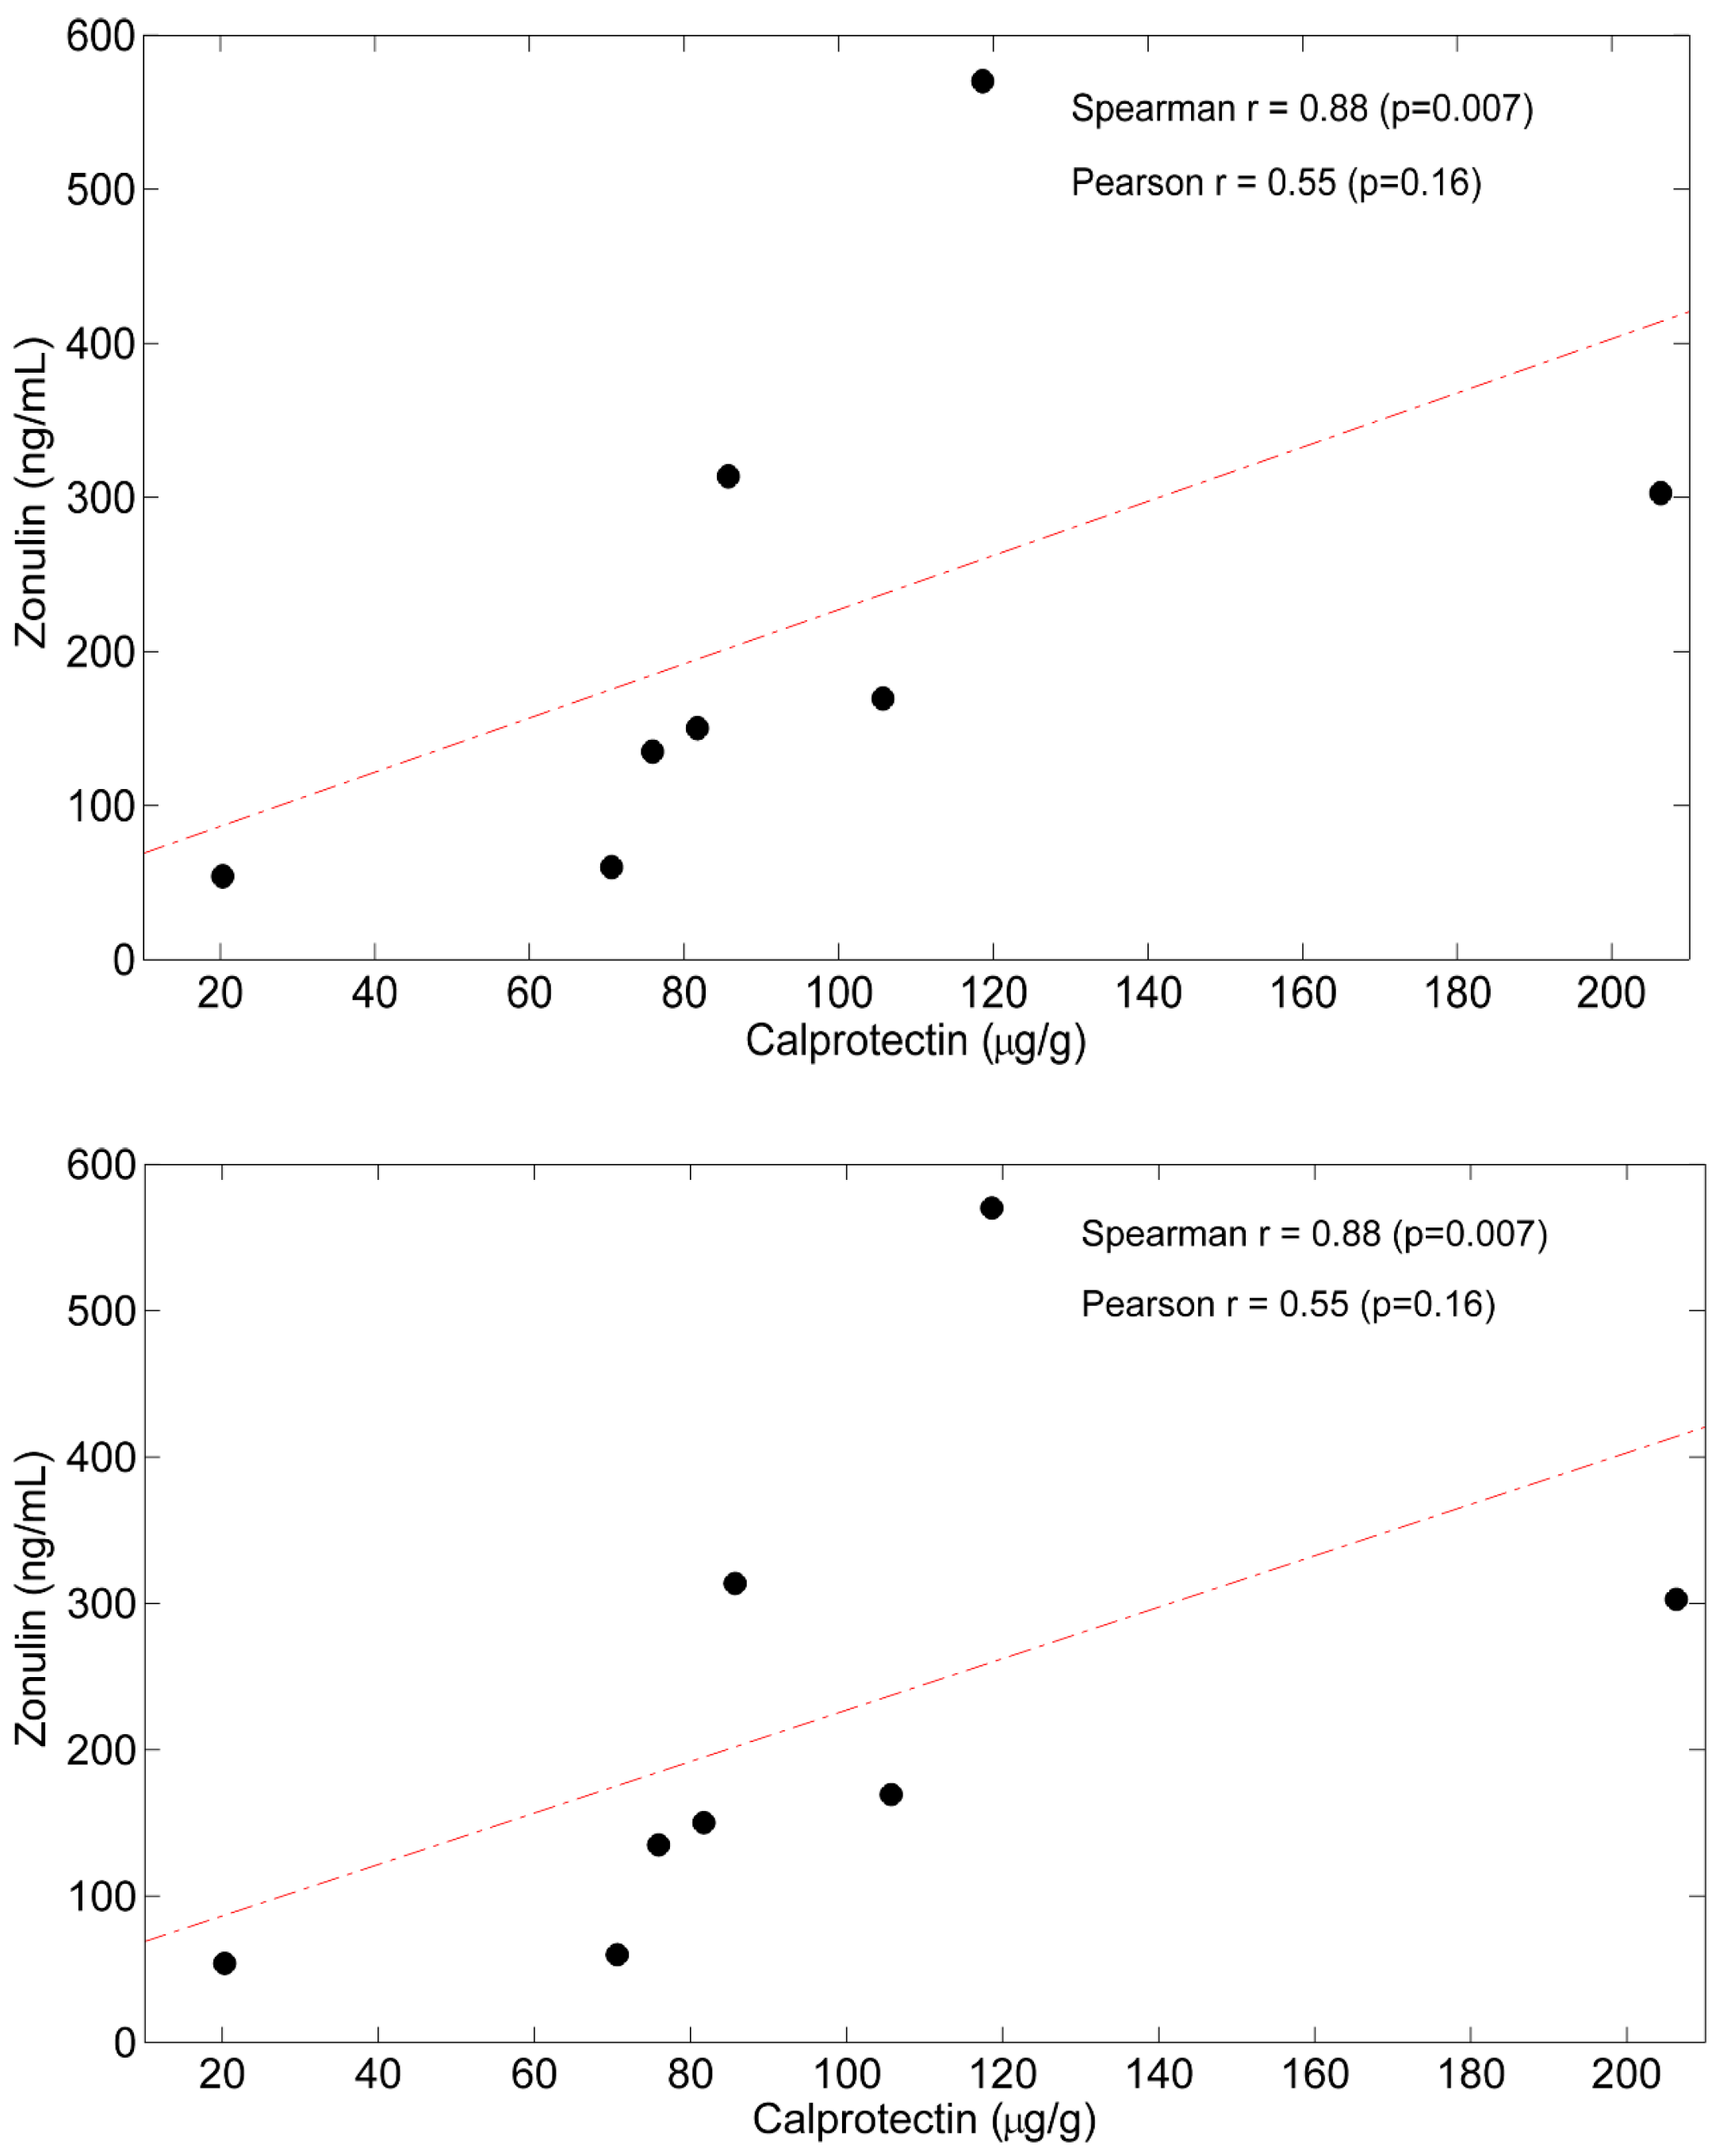
5.3. Correlations between Time Courses of Calprotectin, Zo and Plasma AAs
5.4. Estimation of Patients’ Adherence to EAA Prescription
5.5. Estimation of Supplemented Mixture Effect on Ureagenesis
6. Discussion
6.1. Gut Inflammation at Baseline and 6 Months after EAA Supplementation
6.2. Gut Permeability at Baseline and after 6 Months of EAA Supplementation
6.3. Plasma Amino Acids at Baseline and after 6 Months of EAA Supplementation
6.4. Patients’ Characteristics at Baseline and after 6 Months of EAA Supplementation
7. Was the Study Mixture Appropriate to the Study Patients?
8. Limits of the Study
9. Conclusions
Author Contributions
Funding
Institutional Review Board Statement
Informed Consent Statement
Data Availability Statement
Conflicts of Interest
References
- Vaziri, N.D.; Yuan, J.; Norris, K. Role of Urea in Intestinal Barrier Dysfunction and Disruption of Epithelial Tight Junction in Chronic Kidney Disease. Am. J. Nephrol. 2013, 37, 1–6. [Google Scholar] [CrossRef]
- Yang, J.; Lim, S.Y.; Ko, Y.S.; Lee, H.Y.; Oh, S.W.; Kim, M.G.; Cho, W.Y.; Jo, S.K. Intestinal Barrier Disruption and Dysregulated Mucosal Immunity Contribute to Kidney Fibrosis in Chronic Kidney Disease. Nephrol. Dial. Transplant. 2019, 34, 419–428. [Google Scholar] [CrossRef]
- Vaziri, N.D.; Zhao, Y.-Y.; Pahl, M.V. Altered Intestinal Microbial Flora and Impaired Epithelial Barrier Structure and Function in CKD: The Nature, Mechanisms, Consequences and Potential Treatment. Nephrol Dial. Transplant. 2016, 31, 737–746. [Google Scholar] [CrossRef]
- Khoury, T.; Tzukert, K.; Abel, R.; Abu Rmeileh, A.; Levi, R.; Ilan, Y. The Gut-Kidney Axis in Chronic Renal Failure: A New Potential Target for Therapy. Hemodial. Int. 2017, 21, 323–334. [Google Scholar] [CrossRef]
- Vaziri, N.D. CKD Impairs Barrier Function and Alters Microbial Flora of the Intestine: A Major Link to Inflammation and Uremic Toxicity. Curr. Opin. Nephrol. Hypertens. 2012, 21, 587–592. [Google Scholar] [CrossRef]
- Andersen, K.; Kesper, M.S.; Marschner, J.A.; Konrad, L.; Ryu, M.; Kumar Vr, S.; Kulkarni, O.P.; Mulay, S.R.; Romoli, S.; Demleitner, J.; et al. Intestinal Dysbiosis, Barrier Dysfunction, and Bacterial Translocation Account for CKD-Related Systemic Inflammation. J. Am. Soc. Nephrol. 2017, 28, 76–83. [Google Scholar] [CrossRef]
- Meijers, B.; Farré, R.; Dejongh, S.; Vicario, M.; Evenepoel, P. Intestinal Barrier Function in Chronic Kidney Disease. Toxins 2018, 10, 298. [Google Scholar] [CrossRef]
- Karahan, D.; Şahin, İ. Comparison of Gastrointestinal Symptoms and Findings in Renal Replacement Therapy Modalities. BMC Nephrol. 2022, 23, 261. [Google Scholar] [CrossRef]
- Vaziri, N.D.; Wong, J.; Pahl, M.; Piceno, Y.M.; Yuan, J.; DeSantis, T.Z.; Ni, Z.; Nguyen, T.-H.; Andersen, G.L. Chronic Kidney Disease Alters Intestinal Microbial Flora. Kidney Int. 2013, 83, 308–315. [Google Scholar] [CrossRef]
- Ritz, E. Intestinal-Renal Syndrome: Mirage or Reality? Blood Purif. 2011, 31, 70–76. [Google Scholar] [CrossRef]
- Crespo-Salgado, J.; Vehaskari, V.M.; Stewart, T.; Ferris, M.; Zhang, Q.; Wang, G.; Blanchard, E.E.; Taylor, C.M.; Kallash, M.; Greenbaum, L.A.; et al. Intestinal Microbiota in Pediatric Patients with End Stage Renal Disease: A Midwest Pediatric Nephrology Consortium Study. Microbiome 2016, 4, 50. [Google Scholar] [CrossRef] [PubMed]
- Yu, J.; Shen, Y.; Zhou, N. Advances in the Role and Mechanism of Zonulin Pathway in Kidney Diseases. Int. Urol. Nephrol. 2021, 53, 2081–2088. [Google Scholar] [CrossRef] [PubMed]
- Evenepoel, P.; Poesen, R.; Meijers, B. The Gut-Kidney Axis. Pediatr Nephrol. 2017, 32, 2005–2014. [Google Scholar] [CrossRef]
- Sturgeon, C.; Fasano, A. Zonulin, A. Regulator of Epithelial and Endothelial Barrier Functions, and Its Involvement in Chronic Inflammatory Diseases. Tissue Barriers 2016, 4, e1251384. [Google Scholar] [CrossRef]
- Amasheh, M.; Fromm, A.; Krug, S.M.; Amasheh, S.; Andres, S.; Zeitz, M.; Fromm, M.; Schulzke, J.-D. TNFalpha-Induced and Berberine-Antagonized Tight Junction Barrier Impairment via Tyrosine Kinase, Akt and NFkappaB Signaling. J. Cell. Sci. 2010, 123, 4145–4155. [Google Scholar] [CrossRef]
- Barmeyer, C.; Fromm, M.; Schulzke, J.-D. Active and Passive Involvement of Claudins in the Pathophysiology of Intestinal Inflammatory Diseases. Pflugers. Arch. 2017, 469, 15–26. [Google Scholar] [CrossRef]
- Ayling, R.M.; Kok, K. Fecal Calprotectin. Adv. Clin. Chem. 2018, 87, 161–190. [Google Scholar] [CrossRef]
- Fasano, A. Intestinal Permeability and Its Regulation by Zonulin: Diagnostic and Therapeutic Implications. Clin. Gastroenterol. Hepatol. 2012, 10, 1096–1100. [Google Scholar] [CrossRef]
- Fasano, A. Zonulin, regulation of Tight Junctions, and Autoimmune Diseases. Ann. NY Acad. Sci. USA 2012, 1258, 25–33. [Google Scholar] [CrossRef]
- Szymanska, E.; Wierzbicka, A.; Dadalski, M.; Kierkus, J. Fecal Zonulin as a Noninvasive Biomarker of Intestinal Permeability in Pediatric Patients with Inflammatory Bowel Diseases-Correlation with Disease Activity and Fecal Calprotectin. J. Clin. Med. 2021, 10, 3905. [Google Scholar] [CrossRef]
- Baracos, V.E. Animal Models of Amino Acid Metabolism: A Focus on the Intestine. J. Nutr. 2004, 134, 1656S–1659S. [Google Scholar] [CrossRef] [PubMed]
- Matthews, D.E.; Marano, M.A.; Campbell, R.G. Splanchnic Bed Utilization of Leucine and Phenylalanine in Humans. Am. J. Physiol. 1993, 264, E109–E118. [Google Scholar] [CrossRef] [PubMed]
- Hoerr, R.A.; Matthews, D.E.; Bier, D.M.; Young, V.R. Leucine Kinetics from [2H3]- and [13C]Leucine Infused Simultaneously by Gut and Vein. Am. J. Physiol. 1991, 260, E111–E117. [Google Scholar] [CrossRef]
- Biolo, G.; Tessari, P.; Inchiostro, S.; Bruttomesso, D.; Fongher, C.; Sabadin, L.; Fratton, M.G.; Valerio, A.; Tiengo, A. Leucine and Phenylalanine Kinetics during Mixed Meal Ingestion: A Multiple Tracer Approach. Am. J. Physiol. 1992, 262, E455–E463. [Google Scholar] [CrossRef]
- Van der Schoor, S.R.D.; Reeds, P.J.; Stellaard, F.; Wattimena, J.D.L.; Sauer, P.J.J.; Büller, H.A.; van Goudoever, J.B. Lysine Kinetics in Preterm Infants: The Importance of Enteral Feeding. Gut 2004, 53, 38–43. [Google Scholar] [CrossRef]
- Wu, G. Intestinal Mucosal Amino Acid Catabolism. J. Nutr. 1998, 128, 1249–1252. [Google Scholar] [CrossRef]
- Shen, Y.B.; Voilqué, G.; Kim, J.D.; Odle, J.; Kim, S.W. Effects of Increasing Tryptophan Intake on Growth and Physiological Changes in Nursery Pigs. J. Anim. Sci. 2012, 90, 2264–2275. [Google Scholar] [CrossRef]
- Shen, Y.B.; Voilqué, G.; Odle, J.; Kim, S.W. Dietary L-Tryptophan Supplementation with Reduced Large Neutral Amino Acids Enhances Feed Efficiency and Decreases Stress Hormone Secretion in Nursery Pigs under Social-Mixing Stress. J. Nutr. 2012, 142, 1540–1546. [Google Scholar] [CrossRef]
- Wang, C.; Wu, Q.; Zhang, L.; Hao, Y.; Fan, R.; Peng, X.; Liu, S.; Chen, Z.; Zhang, T.; Chen, S.; et al. Elevated Total Plasma Homocysteine Levels Are Associated with Type 2 Diabetes in Women with Hypertension. Asia Pac. J. Clin. Nutr. 2015, 24, 683–691. [Google Scholar] [CrossRef]
- Chen, C.; Yin, Y.; Tu, Q.; Yang, H. Glucose and Amino Acid in Enterocyte: Absorption, Metabolism and Maturation. Front. Biosci. 2018, 23, 1721–1739. [Google Scholar] [CrossRef]
- Funk, M.C.; Zhou, J.; Boutros, M. Ageing, Metabolism and the Intestine. EMBO Rep. 2020, 21, e50047. [Google Scholar] [CrossRef]
- Solan, J.L.; Lampe, P.D. Specific Cx43 Phosphorylation Events Regulate Gap Junction Turnover in Vivo. FEBS Lett. 2014, 588, 1423–1429. [Google Scholar] [CrossRef] [PubMed]
- Rittig, N.; Bach, E.; Thomsen, H.H.; Johannsen, M.; Jørgensen, J.O.; Richelsen, B.; Jessen, N.; Møller, N. Amino Acid Supplementation Is Anabolic during the Acute Phase of Endotoxin-Induced Inflammation: A Human Randomized Crossover Trial. Clin. Nutr. 2016, 35, 322–330. [Google Scholar] [CrossRef] [PubMed]
- Solerte, S.B.; Fioravanti, M.; Locatelli, E.; Bonacasa, R.; Zamboni, M.; Basso, C.; Mazzoleni, A.; Mansi, V.; Geroutis, N.; Gazzaruso, C. Improvement of Blood Glucose Control and Insulin Sensitivity during a Long-Term (60 Weeks) Randomized Study with Amino Acid Dietary Supplements in Elderly Subjects with Type 2 Diabetes Mellitus. Am. J. Cardiol. 2008, 101, 82E–88E. [Google Scholar] [CrossRef]
- Aquilani, R.; Zuccarelli, G.C.; Maestri, R.; Boselli, M.; Dossena, M.; Baldissarro, E.; Boschi, F.; Buonocore, D.; Verri, M. Essential Amino Acid Supplementation Is Associated with Reduced Serum C-Reactive Protein Levels and Improved Circulating Lymphocytes in Post-Acute Inflamed Elderly Patients. Int. J. Immunopathol. Pharmacol. 2021, 35, 20587384211036824. [Google Scholar] [CrossRef] [PubMed]
- Yang, Z.; Huang, S.; Zou, D.; Dong, D.; He, X.; Liu, N.; Liu, W.; Huang, L. Metabolic Shifts and Structural Changes in the Gut Microbiota upon Branched-Chain Amino Acid Supplementation in Middle-Aged Mice. Amino Acids 2016, 48, 2731–2745. [Google Scholar] [CrossRef]
- Choi, I.; Son, H.; Baek, J.-H. Tricarboxylic Acid (TCA) Cycle Intermediates: Regulators of Immune Responses. Life 2021, 11, 69. [Google Scholar] [CrossRef] [PubMed]
- Menon, V.; Kopple, J.D.; Wang, X.; Beck, G.J.; Collins, A.J.; Kusek, J.W.; Greene, T.; Levey, A.S.; Sarnak, M.J. Effect of a Very Low-Protein Diet on Outcomes: Long-Term Follow-up of the Modification of Diet in Renal Disease (MDRD) Study. Am. J. Kidney Dis. 2009, 53, 208–217. [Google Scholar] [CrossRef] [PubMed]
- Maroni, B.J.; Steinman, T.I.; Mitch, W.E. A Method for Estimating Nitrogen Intake of Patients with Chronic Renal Failure. Kidney Int. 1985, 27, 58–65. [Google Scholar] [CrossRef]
- Sunario, J.; Wibrow, B.; Jacques, A.; Ho, K.M.; Anstey, M. Associations Between Nutrition Markers and Muscle Mass on Bioimpedance Analysis in Patients Receiving Parenteral Nutrition. JPEN J. Parenter. Enteral. Nutr. 2021, 45, 1089–1099. [Google Scholar] [CrossRef]
- Aquilani, R.; La Rovere, M.T.; Corbellini, D.; Pasini, E.; Verri, M.; Barbieri, A.; Condino, A.M.; Boschi, F. Plasma Amino Acid Abnormalities in Chronic Heart Failure. Mechanisms, Potential Risks and Targets in Human Myocardium Metabolism. Nutrients 2017, 9, 1251. [Google Scholar] [CrossRef] [PubMed]
- Tedesco, L.; Rossi, F.; Ragni, M.; Ruocco, C.; Brunetti, D.; Carruba, M.O.; Torrente, Y.; Valerio, A.; Nisoli, E. A Special Amino-Acid Formula Tailored to Boosting Cell Respiration Prevents Mitochondrial Dysfunction and Oxidative Stress Caused by Doxorubicin in Mouse Cardiomyocytes. Nutrients 2020, 12, 282. [Google Scholar] [CrossRef]
- Ruocco, C.; Segala, A.; Valerio, A.; Nisoli, E. Essential Amino Acid Formulations to Prevent Mitochondrial Dysfunction and Oxidative Stress. Curr. Opin. Clin. Nutr. Metab. Care 2021, 24, 88–95. [Google Scholar] [CrossRef] [PubMed]
- D’Antona, G.; Ragni, M.; Cardile, A.; Tedesco, L.; Dossena, M.; Bruttini, F.; Caliaro, F.; Corsetti, G.; Bottinelli, R.; Carruba, M.O.; et al. Branched-Chain Amino Acid Supplementation Promotes Survival and Supports Cardiac and Skeletal Muscle Mitochondrial Biogenesis in Middle-Aged Mice. Cell Metab. 2010, 12, 362–372. [Google Scholar] [CrossRef]
- Ferrando, A.A.; Paddon-Jones, D.; Hays, N.P.; Kortebein, P.; Ronsen, O.; Williams, R.H.; McComb, A.; Symons, T.B.; Wolfe, R.R.; Evans, W. EAA Supplementation to Increase Nitrogen Intake Improves Muscle Function during Bed Rest in the Elderly. Clin. Nutr. 2010, 29, 18–23. [Google Scholar] [CrossRef] [PubMed]
- Aquilani, R.; Opasich, C.; Gualco, A.; Verri, M.; Testa, A.; Pasini, E.; Viglio, S.; Iadarola, P.; Pastoris, O.; Dossena, M.; et al. Adequate Energy-Protein Intake Is Not Enough to Improve Nutritional and Metabolic Status in Muscle-Depleted Patients with Chronic Heart Failure. Eur. J. Heart Fail. 2008, 10, 1127–1135. [Google Scholar] [CrossRef]
- Solerte, S.B.; Gazzaruso, C.; Bonacasa, R.; Rondanelli, M.; Zamboni, M.; Basso, C.; Locatelli, E.; Schifino, N.; Giustina, A.; Fioravanti, M. Nutritional Supplements with Oral Amino Acid Mixtures Increases Whole-Body Lean Mass and Insulin Sensitivity in Elderly Subjects with Sarcopenia. Am. J. Cardiol. 2008, 101, 69E–77E. [Google Scholar] [CrossRef]
- Riquelme, S.A.; Wong Fok Lung, T.; Prince, A. Pulmonary Pathogens Adapt to Immune Signaling Metabolites in the Airway. Front. Immunol. 2020, 11, 385. [Google Scholar] [CrossRef]
- Galván-Peña, S.; O’Neill, L.A.J. Metabolic Reprograming in Macrophage Polarization. Front. Immunol. 2014, 5, 420. [Google Scholar] [CrossRef]
- Darmaun, D.; Déchelotte, P. Role of Leucine as a Precursor of Glutamine Alpha-Amino Nitrogen in Vivo in Humans. Am. J. Physiol. 1991, 260, E326–E329. [Google Scholar] [CrossRef]
- Haymond, M.W.; Miles, J.M. Branched Chain Amino Acids as a Major Source of Alanine Nitrogen in Man. Diabetes 1982, 31, 86–89. [Google Scholar] [CrossRef]
- Kikuchi, M.; Ueno, M.; Itoh, Y.; Suda, W.; Hattori, M. Uremic Toxin-Producing Gut Microbiota in Rats with Chronic Kidney Disease. Nephron 2017, 135, 51–60. [Google Scholar] [CrossRef] [PubMed]
- Schepers, E.; Glorieux, G.; Vanholder, R. The Gut: The Forgotten Organ in Uremia? Blood Purif. 2010, 29, 130–136. [Google Scholar] [CrossRef] [PubMed]
- Venugopal, S.; Anwer, S.; Szászi, K. Claudin-2: Roles beyond Permeability Functions. Int. J. Mol. Sci. 2019, 20, 5655. [Google Scholar] [CrossRef] [PubMed]
- Corsetti, G.; Romano, C.; Pasini, E.; Testa, C.; Dioguardi, F.S. Qualitative Nitrogen Malnutrition Damages Gut and Alters Microbiome in Adult Mice. A Preliminary Histopathological Study. Nutrients 2021, 13, 1089. [Google Scholar] [CrossRef] [PubMed]
- Aquilani, R.; Emilio, B.; Dossena, M.; Baiardi, P.; Testa, A.; Boschi, F.; Viglio, S.; Iadarola, P.; Pasini, E.; Verri, M. Correlation of Deglutition in Subacute Ischemic Stroke Patients with Peripheral Blood Adaptive Immunity: Essential Amino Acid Improvement. Int. J. Immunopathol. Pharmacol. 2015, 28, 576–583. [Google Scholar] [CrossRef] [PubMed]
- Lam, Y.Y.; Ha, C.W.Y.; Campbell, C.R.; Mitchell, A.J.; Dinudom, A.; Oscarsson, J.; Cook, D.I.; Hunt, N.H.; Caterson, I.D.; Holmes, A.J.; et al. Increased Gut Permeability and Microbiota Change Associate with Mesenteric Fat Inflammation and Metabolic Dysfunction in Diet-Induced Obese Mice. PLoS ONE 2012, 7, e34233. [Google Scholar] [CrossRef]
- McIntyre, C.W.; Harrison, L.E.A.; Eldehni, M.T.; Jefferies, H.J.; Szeto, C.-C.; John, S.G.; Sigrist, M.K.; Burton, J.O.; Hothi, D.; Korsheed, S.; et al. Circulating Endotoxemia: A Novel Factor in Systemic Inflammation and Cardiovascular Disease in Chronic Kidney Disease. Clin. J. Am. Soc. Nephrol. 2011, 6, 133–141. [Google Scholar] [CrossRef] [PubMed]
- Lee, Y.T. Urea Concentration in Intestinal Fluids in Normal and Uremic Dogs. J. Surg. Oncol. 1971, 3, 163–168. [Google Scholar] [CrossRef] [PubMed]
- Wong, J.; Piceno, Y.M.; DeSantis, T.Z.; Pahl, M.; Andersen, G.L.; Vaziri, N.D. Expansion of Urease- and Uricase-Containing, Indole- and p-Cresol-Forming and Contraction of Short-Chain Fatty Acid-Producing Intestinal Microbiota in ESRD. Am. J. Nephrol. 2014, 39, 230–237. [Google Scholar] [CrossRef]
- Conlon, M.A.; Bird, A.R. The Impact of Diet and Lifestyle on Gut Microbiota and Human Health. Nutrients 2014, 7, 17–44. [Google Scholar] [CrossRef] [PubMed]
- Pédron, T.; Sansonetti, P. Commensals, Bacterial Pathogens and Intestinal Inflammation: An Intriguing Ménage à Trois. Cell Host Microbe 2008, 3, 344–347. [Google Scholar] [CrossRef] [PubMed]
- Everard, A.; Belzer, C.; Geurts, L.; Ouwerkerk, J.P.; Druart, C.; Bindels, L.B.; Guiot, Y.; Derrien, M.; Muccioli, G.G.; Delzenne, N.M.; et al. Cross-Talk between Akkermansia Muciniphila and Intestinal Epithelium Controls Diet-Induced Obesity. Proc. Natl. Acad. Sci. USA 2013, 110, 9066–9071. [Google Scholar] [CrossRef] [PubMed]
- Mishima, E.; Fukuda, S.; Mukawa, C.; Yuri, A.; Kanemitsu, Y.; Matsumoto, Y.; Akiyama, Y.; Fukuda, N.N.; Tsukamoto, H.; Asaji, K.; et al. Evaluation of the Impact of Gut Microbiota on Uremic Solute Accumulation by a CE-TOFMS-Based Metabolomics Approach. Kidney Int. 2017, 92, 634–645. [Google Scholar] [CrossRef] [PubMed]
- Barnes, T.; Bell, K.; DiSebastiano, K.M.; Vance, V.; Hanning, R.; Russell, C.; Dubin, J.A.; Bahl, M.; Califaretti, N.; Campbell, C.; et al. Plasma Amino Acid Profiles of Breast Cancer Patients Early in the Trajectory of the Disease Differ from Healthy Comparison Groups. Appl. Physiol. Nutr. Metab. 2014, 39, 740–744. [Google Scholar] [CrossRef]
- Stoll, B.; Henry, J.; Reeds, P.J.; Yu, H.; Jahoor, F.; Burrin, D.G. Catabolism Dominates the First-Pass Intestinal Metabolism of Dietary Essential Amino Acids in Milk Protein-Fed Piglets. J. Nutr. 1998, 128, 606–614. [Google Scholar] [CrossRef] [PubMed]
- Schaart, M.W.; Schierbeek, H.; van der Schoor, S.R.D.; Stoll, B.; Burrin, D.G.; Reeds, P.J.; van Goudoever, J.B. Threonine Utilization Is High in the Intestine of Piglets. J. Nutr. 2005, 135, 765–770. [Google Scholar] [CrossRef]
- Bertolo, R.F.; Chen, C.Z.; Law, G.; Pencharz, P.B.; Ball, R.O. Threonine Requirement of Neonatal Piglets Receiving Total Parenteral Nutrition Is Considerably Lower than That of Piglets Receiving an Identical Diet Intragastrically. J. Nutr. 1998, 128, 1752–1759. [Google Scholar] [CrossRef] [PubMed]
- Nichols, N.L.; Bertolo, R.F. Luminal Threonine Concentration Acutely Affects Intestinal Mucosal Protein and Mucin Synthesis in Piglets. J. Nutr. 2008, 138, 1298–1303. [Google Scholar] [CrossRef] [PubMed]
- Tytgat, K.M.; Büller, H.A.; Opdam, F.J.; Kim, Y.S.; Einerhand, A.W.; Dekker, J. Biosynthesis of Human Colonic Mucin: Muc2 Is the Prominent Secretory Mucin. Gastroenterology 1994, 107, 1352–1363. [Google Scholar] [CrossRef]
- Van der Sluis, M.; De Koning, B.A.E.; De Bruijn, A.C.J.M.; Velcich, A.; Meijerink, J.P.P.; Van Goudoever, J.B.; Büller, H.A.; Dekker, J.; Van Seuningen, I.; Renes, I.B.; et al. Muc2-Deficient Mice Spontaneously Develop Colitis, Indicating That MUC2 Is Critical for Colonic Protection. Gastroenterology 2006, 131, 117–129. [Google Scholar] [CrossRef]
- Burrin, D.G. Chapter 24—Gastrointestinal Protein and Amino Acid Metabolism in Growing Animals. In Biology of Growing Animals; Elsevier: Houston, TX, USA, 2002; Volume 1, pp. 695–725. ISBN 978-0-444-50928-4. [Google Scholar]
- Faure, M.; Moënnoz, D.; Montigon, F.; Mettraux, C.; Breuillé, D.; Ballèvre, O. Dietary Threonine Restriction Specifically Reduces Intestinal Mucin Synthesis in Rats. J. Nutr. 2005, 135, 486–491. [Google Scholar] [CrossRef] [PubMed]
- Liu, Y.; Li, J.; Yu, J.; Wang, Y.; Lu, J.; Shang, E.-X.; Zhu, Z.; Guo, J.; Duan, J. Disorder of Gut Amino Acids Metabolism during CKD Progression Is Related with Gut Microbiota Dysbiosis and Metagenome Change. J. Pharm. Biomed. Anal. 2018, 149, 425–435. [Google Scholar] [CrossRef] [PubMed]
- Wang, H.; Zhang, C.; Wu, G.; Sun, Y.; Wang, B.; He, B.; Dai, Z.; Wu, Z. Glutamine Enhances Tight Junction Protein Expression and Modulates Corticotropin-Releasing Factor Signaling in the Jejunum of Weanling Piglets. J. Nutr. 2015, 145, 25–31. [Google Scholar] [CrossRef]
- Wang, B.; Wu, Z.; Ji, Y.; Sun, K.; Dai, Z.; Wu, G. L-Glutamine Enhances Tight Junction Integrity by Activating CaMK Kinase 2-AMP-Activated Protein Kinase Signaling in Intestinal Porcine Epithelial Cells. J. Nutr. 2016, 146, 501–508. [Google Scholar] [CrossRef] [PubMed]
- Matés, J.M.; Segura, J.A.; Campos-Sandoval, J.A.; Lobo, C.; Alonso, L.; Alonso, F.J.; Márquez, J. Glutamine Homeostasis and Mitochondrial Dynamics. Int. J. Biochem. Cell. Biol. 2009, 41, 2051–2061. [Google Scholar] [CrossRef] [PubMed]
- Hu, Y.-M.; Hsiung, Y.-C.; Pai, M.-H.; Yeh, S.-L. Glutamine Administration in Early or Late Septic Phase Downregulates Lymphocyte PD-1/PD-L1 Expression and the Inflammatory Response in Mice with Polymicrobial Sepsis. JPEN J. Parenter. Enteral. Nutr. 2018, 42, 538–549. [Google Scholar] [CrossRef] [PubMed]
- Rahman, M.T.; Ghosh, C.; Hossain, M.; Linfield, D.; Rezaee, F.; Janigro, D.; Marchi, N.; van Boxel-Dezaire, A.H.H. IFN-γ, IL-17A, or Zonulin Rapidly Increase the Permeability of the Blood-Brain and Small Intestinal Epithelial Barriers: Relevance for Neuro-Inflammatory Diseases. Biochem. Biophys. Res. Commun. 2018, 507, 274–279. [Google Scholar] [CrossRef]
- Kinugasa, T.; Sakaguchi, T.; Gu, X.; Reinecker, H.C. Claudins Regulate the Intestinal Barrier in Response to Immune Mediators. Gastroenterology 2000, 118, 1001–1011. [Google Scholar] [CrossRef]
- Williams, N.C.; O’Neill, L.A.J. A Role for the Krebs Cycle Intermediate Citrate in Metabolic Reprogramming in Innate Immunity and Inflammation. Front. Immunol. 2018, 9, 141. [Google Scholar] [CrossRef]
- Lampropoulou, V.; Sergushichev, A.; Bambouskova, M.; Nair, S.; Vincent, E.E.; Loginicheva, E.; Cervantes-Barragan, L.; Ma, X.; Huang, S.C.-C.; Griss, T.; et al. Itaconate Links Inhibition of Succinate Dehydrogenase with Macrophage Metabolic Remodeling and Regulation of Inflammation. Cell. Metab. 2016, 24, 158–166. [Google Scholar] [CrossRef]
- Daniels, B.P.; Kofman, S.B.; Smith, J.R.; Norris, G.T.; Snyder, A.G.; Kolb, J.P.; Gao, X.; Locasale, J.W.; Martinez, J.; Gale, M.; et al. The Nucleotide Sensor ZBP1 and Kinase RIPK3 Induce the Enzyme IRG1 to Promote an Antiviral Metabolic State in Neurons. Immunity 2019, 50, 64–76. [Google Scholar] [CrossRef]
- Chen, L.; Chen, X.-W.; Huang, X.; Song, B.-L.; Wang, Y.; Wang, Y. Regulation of Glucose and Lipid Metabolism in Health and Disease. Sci. China Life Sci. 2019, 62, 1420–1458. [Google Scholar] [CrossRef] [PubMed]
- Song, W.; Li, D.; Tao, L.; Luo, Q.; Chen, L. Solute Carrier Transporters: The Metabolic Gatekeepers of Immune Cells. Acta Pharm. Sin. B 2020, 10, 61–78. [Google Scholar] [CrossRef] [PubMed]
- Ryan, D.G.; O’Neill, L.A.J. Krebs Cycle Reborn in Macrophage Immunometabolism. Ann. Rev. Immunol. 2020, 38, 289–313. [Google Scholar] [CrossRef] [PubMed]
- Liu, P.-S.; Wang, H.; Li, X.; Chao, T.; Teav, T.; Christen, S.; Di Conza, G.; Cheng, W.-C.; Chou, C.-H.; Vavakova, M.; et al. α-Ketoglutarate Orchestrates Macrophage Activation through Metabolic and Epigenetic Reprogramming. Nat. Immunol. 2017, 18, 985–994. [Google Scholar] [CrossRef]
- Zasłona, Z.; O’Neill, L.A.J. Cytokine-like Roles for Metabolites in Immunity. Mol. Cell. 2020, 78, 814–823. [Google Scholar] [CrossRef]
- Rubic, T.; Lametschwandtner, G.; Jost, S.; Hinteregger, S.; Kund, J.; Carballido-Perrig, N.; Schwärzler, C.; Junt, T.; Voshol, H.; Meingassner, J.G.; et al. Triggering the Succinate Receptor GPR91 on Dendritic Cells Enhances Immunity. Nat. Immunol. 2008, 9, 1261–1269. [Google Scholar] [CrossRef] [PubMed]
- Jiang, S.; Yan, W. Succinate in the Cancer-Immune Cycle. Cancer Lett. 2017, 390, 45–47. [Google Scholar] [CrossRef] [PubMed]
- Michalek, R.D.; Gerriets, V.A.; Jacobs, S.R.; Macintyre, A.N.; MacIver, N.J.; Mason, E.F.; Sullivan, S.A.; Nichols, A.G.; Rathmell, J.C. Cutting Edge: Distinct Glycolytic and Lipid Oxidative Metabolic Programs Are Essential for Effector and Regulatory CD4+ T Cell Subsets. J. Immunol. 2011, 186, 3299–3303. [Google Scholar] [CrossRef]
- Shi, L.Z.; Wang, R.; Huang, G.; Vogel, P.; Neale, G.; Green, D.R.; Chi, H. HIF1alpha-Dependent Glycolytic Pathway Orchestrates a Metabolic Checkpoint for the Differentiation of TH17 and Treg Cells. J. Exp. Med. 2011, 208, 1367–1376. [Google Scholar] [CrossRef]
- Van der Windt, G.J.W.; Everts, B.; Chang, C.-H.; Curtis, J.D.; Freitas, T.C.; Amiel, E.; Pearce, E.J.; Pearce, E.L. Mitochondrial Respiratory Capacity Is a Critical Regulator of CD8+ T Cell Memory Development. Immunity 2012, 36, 68–78. [Google Scholar] [CrossRef] [PubMed]
- Fasano, A. Zonulin and Its Regulation of Intestinal Barrier Function: The Biological Door to Inflammation, Autoimmunity, and Cancer. Physiol. Rev. 2011, 91, 151–175. [Google Scholar] [CrossRef] [PubMed]
- Ciccia, F.; Guggino, G.; Rizzo, A.; Alessandro, R.; Luchetti, M.M.; Milling, S.; Saieva, L.; Cypers, H.; Stampone, T.; Di Benedetto, P.; et al. Dysbiosis and Zonulin Upregulation Alter Gut Epithelial and Vascular Barriers in Patients with Ankylosing Spondylitis. Ann. Rheum. Dis. 2017, 76, 1123–1132. [Google Scholar] [CrossRef] [PubMed]
- Metges, C.C. Contribution of Microbial Amino Acids to Amino Acid Homeostasis of the Host. J. Nutr. 2000, 130, 1857S–1864S. [Google Scholar] [CrossRef]
- Matteuzzi, D.; Crociani, F.; Emaldi, O. Amino Acids Produced by Bifidobacteria and Some Clostridia. Ann. Microbiol. 1978, 129, 175–181. [Google Scholar]
- Malke, H.F.C.; Neidhardt, J.L.; Ingraham, K.B.; Low, B.; Magasanik, B.; Schaechter, M.; Umbarger, H.E. Escherichia Coli and Salmonella Typhimurium—Cellular and Molecular Biology, Volume 1. J. Basic Microbiol. 1988, 28, 462. [Google Scholar] [CrossRef]
- Torrallardona, D.; Harris, C.I.; Fuller, M.F. Microbial Amino Acid Synthesis and Utilization in Rats: The Role of Coprophagy. Br. J. Nutr. 1996, 76, 701–709. [Google Scholar] [CrossRef] [PubMed]
- Zhao, X.H.; Wen, Z.M.; Meredith, C.N.; Matthews, D.E.; Bier, D.M.; Young, V.R. Threonine Kinetics at Graded Threonine Intakes in Young Men. Am. J. Clin. Nutr. 1986, 43, 795–802. [Google Scholar] [CrossRef]
- Roager, H.M.; Licht, T.R. Microbial Tryptophan Catabolites in Health and Disease. Nat. Commun. 2018, 9, 3294. [Google Scholar] [CrossRef] [PubMed]
- Israelyan, N.; Del Colle, A.; Li, Z.; Park, Y.; Xing, A.; Jacobsen, J.P.R.; Luna, R.A.; Jensen, D.D.; Madra, M.; Saurman, V.; et al. Effects of Serotonin and Slow-Release 5-Hydroxytryptophan on Gastrointestinal Motility in a Mouse Model of Depression. Gastroenterology 2019, 157, 507–521. [Google Scholar] [CrossRef] [PubMed]
- Ye, L.; Bae, M.; Cassilly, C.D.; Jabba, S.V.; Thorpe, D.W.; Martin, A.M.; Lu, H.-Y.; Wang, J.; Thompson, J.D.; Lickwar, C.R.; et al. Enteroendocrine Cells Sense Bacterial Tryptophan Catabolites to Activate Enteric and Vagal Neuronal Pathways. Cell. Host. Microbe. 2021, 29, 179–196. [Google Scholar] [CrossRef] [PubMed]
- Harper, A.E.; Miller, R.H.; Block, K.P. Branched-Chain Amino Acid Metabolism. Ann. Rev. Nutr. 1984, 4, 409–454. [Google Scholar] [CrossRef]
- Giorgi-Coll, S.; Amaral, A.I.; Hutchinson, P.J.A.; Kotter, M.R.; Carpenter, K.L.H. Succinate Supplementation Improves Metabolic Performance of Mixed Glial Cell Cultures with Mitochondrial Dysfunction. Sci. Rep. 2017, 7, 1003. [Google Scholar] [CrossRef]
- Li, X.; Mao, M.; Zhang, Y.; Yu, K.; Zhu, W. Succinate Modulates Intestinal Barrier Function and Inflammation Response in Pigs. Biomolecules 2019, 9, 486. [Google Scholar] [CrossRef]
- Tizianello, A.; Deferrari, G.; Garibotto, G.; Robaudo, C.; Canepa, A.; Passerone, G. Is Amino Acid Imbalance Harmful to Patients in Chronic Renal Failure? Kidney Int. Suppl. 1985, 17, S79–S83. [Google Scholar]
- Garibotto, G.; Sofia, A.; Russo, R.; Paoletti, E.; Bonanni, A.; Parodi, E.L.; Viazzi, F.; Verzola, D. Insulin Sensitivity of Muscle Protein Metabolism Is Altered in Patients with Chronic Kidney Disease and Metabolic Acidosis. Kidney Int. 2015, 88, 1419–1426. [Google Scholar] [CrossRef]
- Kalhan, S.C.; Hanson, R.W. Resurgence of Serine: An Often Neglected but Indispensable Amino Acid. J. Biol. Chem. 2012, 287, 19786–19791. [Google Scholar] [CrossRef]
- Cano, N.J.M.; Fouque, D.; Leverve, X.M. Application of Branched-Chain Amino Acids in Human Pathological States: Renal Failure. J. Nutr. 2006, 136, 299S–307S. [Google Scholar] [CrossRef]
- Adey, D.; Kumar, R.; McCarthy, J.T.; Nair, K.S. Reduced Synthesis of Muscle Proteins in Chronic Renal Failure. Am. J. Physiol. Endocrinol. Metab. 2000, 278, E219–E225. [Google Scholar] [CrossRef]
- Dolan, E.; Saunders, B.; Harris, R.C.; Bicudo, J.E.P.W.; Bishop, D.J.; Sale, C.; Gualano, B. Comparative Physiology Investigations Support a Role for Histidine-Containing Dipeptides in Intracellular Acid-Base Regulation of Skeletal Muscle. Comp. Biochem. Physiol. A Mol. Integr. Physiol. 2019, 234, 77–86. [Google Scholar] [CrossRef] [PubMed]
- Holecek, M. Relation between Glutamine, Branched-Chain Amino Acids, and Protein Metabolism. Nutrition 2002, 18, 130–133. [Google Scholar] [CrossRef]
- Liu, Z.; Barrett, E.J. Human Protein Metabolism: Its Measurement and Regulation. Am. J. Physiol. Endocrinol. Metab. 2002, 283, 1105–1112. [Google Scholar] [CrossRef] [PubMed]
- Pastoris, O.; Aquilani, R.; Foppa, P.; Bovio, G.; Segagni, S.; Baiardi, P.; Catapano, M.; Maccario, M.; Salvadeo, A.; Dossena, M. Altered Muscle Energy Metabolism in Post-Absorptive Patients with Chronic Renal Failure. Scand. J. Urol. Nephrol. 1997, 31, 281–287. [Google Scholar] [CrossRef]
- Garibotto, G.; Valli, A.; Anderstam, B.; Eriksson, M.; Suliman, M.E.; Balbi, M.; Rollando, D.; Vigo, E.; Lindholm, B. The Kidney Is the Major Site of S-Adenosylhomocysteine Disposal in Humans. Kidney Int. 2009, 76, 293–296. [Google Scholar] [CrossRef]
- Herrmann, W.; Schorr, H.; Obeid, R.; Makowski, J.; Fowler, B.; Kuhlmann, M.K. Disturbed Homocysteine and Methionine Cycle Intermediates S-Adenosylhomocysteine and S-Adenosylmethionine Are Related to Degree of Renal Insufficiency in Type 2 Diabetes. Clin. Chem. 2005, 51, 891–897. [Google Scholar] [CrossRef]
- Kruglova, M.P.; Ivanov, A.V.; Virus, E.D.; Bulgakova, P.O.; Samokhin, A.S.; Fedoseev, A.N.; Grachev, S.V.; Kubatiev, A.A. Urine S-Adenosylmethionine Are Related to Degree of Renal Insufficiency in Patients with Chronic Kidney Disease. Lab. Med. 2021, 52, 47–56. [Google Scholar] [CrossRef]
- Mitch, W.E. Cellular Mechanisms of Catabolism Activated by Metabolic Acidosis. Blood Purif. 1995, 13, 368–374. [Google Scholar] [CrossRef]
- Vaziri, N.D.; Pahl, M.V.; Crum, A.; Norris, K. Effect of Uremia on Structure and Function of Immune System. J. Ren. Nutr. 2012, 22, 149–156. [Google Scholar] [CrossRef]
- Zhu, H.; Pi, D.; Leng, W.; Wang, X.; Hu, C.-A.A.; Hou, Y.; Xiong, J.; Wang, C.; Qin, Q.; Liu, Y. Asparagine Preserves Intestinal Barrier Function from LPS-Induced Injury and Regulates CRF/CRFR Signaling Pathway. Innate. Immun. 2017, 23, 546–556. [Google Scholar] [CrossRef]
- Garibotto, G.; Sofia, A.; Saffioti, S.; Bonanni, A.; Mannucci, I.; Verzola, D. Amino Acid and Protein Metabolism in the Human Kidney and in Patients with Chronic Kidney Disease. Clin. Nutr. 2010, 29, 424–433. [Google Scholar] [CrossRef]
- Kopple, J.D. Phenylalanine and Tyrosine Metabolism in Chronic Kidney Failure. J. Nutr 2007, 137, 1586S–1590S. [Google Scholar] [CrossRef] [PubMed]
- Boirie, Y.; Albright, R.; Bigelow, M.; Nair, K.S. Impairment of Phenylalanine Conversion to Tyrosine in End-Stage Renal Disease causing Tyrosine Deficiency. Kidney Int. 2004, 66, 591–596. [Google Scholar] [CrossRef]
- Tessari, P.; Deferrari, G.; Robaudo, C.; Vettore, M.; Pastorino, N.; De Biasi, L.; Garibotto, G. Phenylalanine Hydroxylation across the Kidney in Humans Rapid Communication. Kidney Int. 1999, 56, 2168–2172. [Google Scholar] [CrossRef]
- Møller, N.; Meek, S.; Bigelow, M.; Andrews, J.; Nair, K.S. The Kidney Is an Important Site for in Vivo Phenylalanine-to-Tyrosine Conversion in Adult Humans: A Metabolic Role of the Kidney. Proc. Natl. Acad. Sci. USA 2000, 97, 1242–1246. [Google Scholar] [CrossRef] [PubMed]
- Pi, D.; Liu, Y.; Shi, H.; Li, S.; Odle, J.; Lin, X.; Zhu, H.; Chen, F.; Hou, Y.; Leng, W. Dietary Supplementation of Aspartate Enhances Intestinal Integrity and Energy Status in Weanling Piglets after Lipopolysaccharide Challenge. J. Nutr. Biochem. 2014, 25, 456–462. [Google Scholar] [CrossRef]
- Novak, E.A.; Mollen, K.P. Mitochondrial Dysfunction in Inflammatory Bowel Disease. Front. Cell. Dev. Biol. 2015, 3, 62. [Google Scholar] [CrossRef] [PubMed]
- Tomé, D. Amino Acid Metabolism and Signalling Pathways: Potential Targets in the Control of Infection and Immunity. Eur. J. Clin. Nutr. 2021, 75, 1319–1327. [Google Scholar] [CrossRef] [PubMed]
- Kalantar-Zadeh, K.; Ikizler, T.A.; Block, G.; Avram, M.M.; Kopple, J.D. Malnutrition-Inflammation Complex Syndrome in Dialysis Patients: Causes and Consequences. Am. J. Kidney Dis. 2003, 42, 864–881. [Google Scholar] [CrossRef] [PubMed]
- Rao, M.; Wong, C.; Kanetsky, P.; Girndt, M.; Stenvinkel, P.; Reilly, M.; Raj, D.S.C. Cytokine Gene Polymorphism and Progression of Renal and Cardiovascular Diseases. Kidney Int. 2007, 72, 549–556. [Google Scholar] [CrossRef]
- Zoico, E.; Roubenoff, R. The Role of Cytokines in Regulating Protein Metabolism and Muscle Function. Nutr. Rev. 2002, 60, 39–51. [Google Scholar] [CrossRef] [PubMed]
- Sharma, K.; Mogensen, K.M.; Robinson, M.K. Pathophysiology of Critical Illness and Role of Nutrition. Nutr. Clin. Pract. 2019, 34, 12–22. [Google Scholar] [CrossRef]
- Garibotto, G.; Russo, R.; Sofia, A.; Sala, M.R.; Robaudo, C.; Moscatelli, P.; Deferrari, G.; Tizianello, A. Skeletal Muscle Protein Synthesis and Degradation in Patients with Chronic Renal Failure. Kidney Int. 1994, 45, 1432–1439. [Google Scholar] [CrossRef] [PubMed]
- Lee, P.D.; Conover, C.A.; Powell, D.R. Regulation and Function of Insulin-like Growth Factor-Binding Protein-1. Proc. Soc. Exp. Biol. Med. 1993, 204, 4–29. [Google Scholar] [CrossRef] [PubMed]
- Hokken-Koelega, A.C.; Stijnen, T.; de Muinck Keizer-Schrama, S.M.; Wit, J.M.; Wolff, E.D.; de Jong, M.C.; Donckerwolcke, R.A.; Abbad, N.C.; Bot, A.; Blum, W.F. Placebo-Controlled, Double-Blind, Cross-over Trial of Growth Hormone Treatment in Prepubertal Children with Chronic Renal Failure. Lancet 1991, 338, 585–590. [Google Scholar] [CrossRef]
- Virzì, G.M.; Breglia, A.; Brocca, A.; de Cal, M.; Bolin, C.; Vescovo, G.; Ronco, C. Levels of Proinflammatory Cytokines, Oxidative Stress, and Tissue Damage Markers in Patients with Acute Heart Failure with and without Cardiorenal Syndrome Type 1. Cardiorenal Med. 2018, 8, 321–331. [Google Scholar] [CrossRef] [PubMed]
- Otero, T.M.N.; Canales, C.; Yeh, D.D.; Johnson, E.A.; Harrison, T.M.; Belcher, D.; Quraishi, S.A. Association of Serum Phosphate Levels and Anemia in Critically Ill Surgical Patients. JPEN J. Parenter. Enteral. Nutr. 2017, 41, 986–992. [Google Scholar] [CrossRef] [PubMed]
- Ruiz-Ortega, M.; Rupérez, M.; Esteban, V.; Rodríguez-Vita, J.; Sánchez-López, E.; Carvajal, G.; Egido, J. Angiotensin II: A Key Factor in the Inflammatory and Fibrotic Response in Kidney Diseases. Nephrol. Dial. Transplant. 2006, 21, 16–20. [Google Scholar] [CrossRef] [PubMed]
- Hamza, E.; Metzinger, L.; Metzinger-Le Meuth, V. Uremic Toxins Affect Erythropoiesis during the Course of Chronic Kidney Disease: A Review. Cells 2020, 9, 2039. [Google Scholar] [CrossRef]
- Rizzetto, F.; Leal, V.D.O.; Bastos, L.S.; Fouque, D.; Mafra, D. Chronic Kidney Disease Progression: A Retrospective Analysis of 3-Year Adherence to a Low Protein Diet. Ren. Fail. 2017, 39, 357–362. [Google Scholar] [CrossRef]
- Rhee, C.M.; Ahmadi, S.-F.; Kovesdy, C.P.; Kalantar-Zadeh, K. Low-Protein Diet for Conservative Management of Chronic Kidney Disease: A Systematic Review and Meta-Analysis of Controlled Trials. J. Cachexia Sarcopenia Muscle 2018, 9, 235–245. [Google Scholar] [CrossRef] [PubMed]
- Cupisti, A.; Gallieni, M.; Avesani, C.M.; D’Alessandro, C.; Carrero, J.J.; Piccoli, G.B. Medical Nutritional Therapy for Patients with Chronic Kidney Disease Not on Dialysis: The Low Protein Diet as a Medication. J. Clin. Med. 2020, 9, 3644. [Google Scholar] [CrossRef] [PubMed]
- Apetrii, M.; Timofte, D.; Voroneanu, L.; Covic, A. Nutrition in Chronic Kidney Disease-The Role of Proteins and Specific Diets. Nutrients 2021, 13, 956. [Google Scholar] [CrossRef] [PubMed]
- Kaesler, N.; Baid-Agrawal, S.; Grams, S.; Nadal, J.; Schmid, M.; Schneider, M.P.; Eckardt, K.-U.; Floege, J.; Bergmann, M.M.; Schlieper, G.; et al. Low Adherence to CKD-Specific Dietary Recommendations Associates with Impaired Kidney Function, Dyslipidemia, and Inflammation. Eur. J. Clin. Nutr. 2021, 75, 1389–1397. [Google Scholar] [CrossRef] [PubMed]
- Marletta, L.; Carnovale, E. Tabelle Di Composizione Degli Alimenti Di Istituto Nazionale Della Nutrizione; Marletta, L., Carnovale, E., Eds.; Istituto Nazionale Della Nutrizione: Rome, Italy, 1997; ISBN 88-86457-21-9. [Google Scholar]
- Ratliff, B.B.; Abdulmahdi, W.; Pawar, R.; Wolin, M.S. Oxidant Mechanisms in Renal Injury and Disease. Antioxid. Redox Signal 2016, 25, 119–146. [Google Scholar] [CrossRef] [PubMed]


| Ingredients | mg/Sachet |
|---|---|
| Amino acids | |
| L-leucine * | 1200 |
| L-lysine HCl * | 1129.23 |
| L-threonine * | 700 |
| L-isoleucine * | 600 |
| L-valine * | 600 |
| L-fenilalanine * | 100 |
| L-tryptophan * L-methionine * | 50 50 |
| L-cysteine L-histidine | 150 150 |
| Intermediates of TCA | |
| Citric acid | 409 |
| Succinic acid | 102.50 |
| Malic acid | 102.50 |
| Vitamines | |
| Beta carotene | 10 |
| Pyridoxine hydrocloride | 1.03 |
| Thiamine hydrocloride | 0.90 |
| Others | |
| Polysorbate 80 Flavouring Sucralose Acesulfame K | 237.50 214.94 24 18 |
| Variables | CTR | CKD | p |
|---|---|---|---|
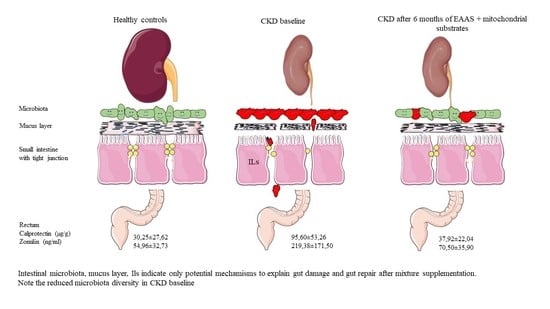
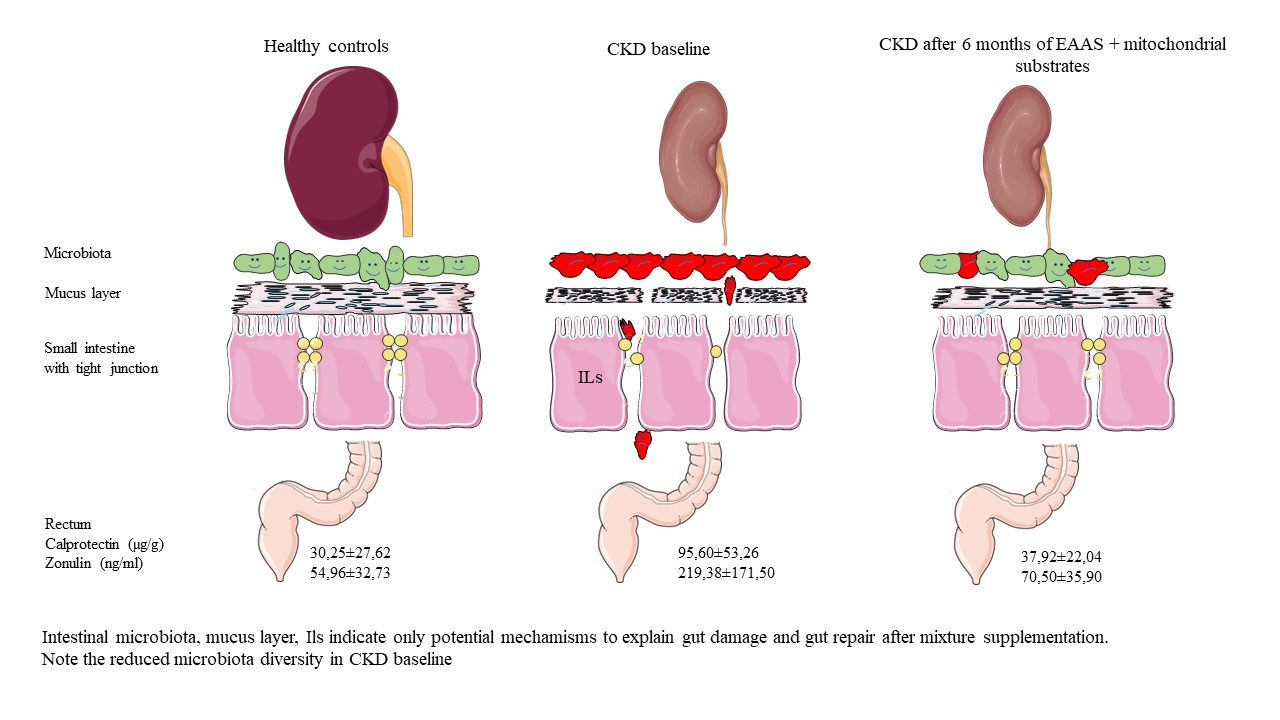
| Calprotectin | 30.25 ± 27.62 | 95.60 ± 53.26 | 0.005 ^ |
| Zonulin | 54.96 ± 32.73 | 219.38 ± 171.50 | 0.001 ^ |
| Amino Acids | CTR | CKD | p |
|---|---|---|---|
| Aspartic acid | 4.84 ± 1.78 | 14.39 ± 5.50 | 0.0005 ^ |
| Glutamic acid | 159.49 ± 21.75 | 179.92 ± 46.72 | 0.45 |
| Asparagine | 10.51 ± 2.12 | 19.57 ± 15.65 | 0.034 |
| Serine | 31.60 ± 6.77 | 40.41 ± 7.35 | 0.016 |
| Glutamine | 147.22 ± 27.46 | 229.41 ± 131.79 | 0.18 |
| Histidine | 22.24 ±3.72 | 63.13 ± 31.61 | 0.002 ^ |
| Glycine | 123.63 ± 34.81 | 176.66 ± 66.84 | 0.043 |
| Threonine | 65.18 ± 14.40 | 89.34 ± 29.27 | 0.13 |
| Alanine | 348.94 ± 84.88 | 316.25 ± 39.76 | 0.46 |
| Arginine | 95.73 ± 15.79 | 158.22 ± 61.73 | 0.08 |
| Tyrosine | 54.69 ± 12.41 | 47.66 ± 7.48 | 0.32 |
| Cysteine | 207.54 ± 56.71 | 208.18 ± 54.18 | 0.92 |
| Valine | 172.90 ± 19.25 | 168.03 ± 35.51 | 0.92 |
| Methionine | 19.12 ± 3.48 | 21.40 ± 5.23 | 0.45 |
| Tryptophan | 34.53 ± 4.95 | 48.61 ± 21.17 | 0.25 |
| Phenylalanine | 45.11 ± 4.76 | 48.63 ± 6.45 | 0.21 |
| Isoleucine | 47.62 ± 8.39 | 50.46 ± 11.84 | 0.36 |
| Leucine | 90.32 ± 15.38 | 88.59 ± 20.23 | 0.99 |
| Lysine | 125.23 ± 15.70 | 134.89 ± 17.86 | 0.25 |
| Proline | 196.71 ± 63.87 | 233.29 ± 125.77 | 0.73 |
| Total AA | 2003.15 ± 239.91 | 2337.05 ± 419.62 | 0.11 |
| Essential AA | 622.25 ± 66.72 | 713.08 ± 140.98 | 0.36 |
| Non Essential AA | 1380.90 ± 218.82 | 1623.97 ± 317.28 | 0.11 |
| Branched Chain AA | 310.85 ± 40.79 | 307.08 ± 66.30 | 0.92 |
| Phenylalanine / Tyrosine ratio | 0.85 ± 0.13 | 1.04 ± 0.17 | 0.010 ^ |
| Variables | Baseline | After 6 months AA | p |
|---|---|---|---|
| Calprotectin | 95.60 ± 53.26 | 37.92 ± 22.04 | 0.008^ |
| Zonulin | 219.4 ± 171.5 | 70.5 ± 35.9 | 0.05 |
| Amino Acids | Baseline | After 6 Months AA | p |
|---|---|---|---|
| Aspartic acid | 14.39 ± 5.50 | 31.75 ± 10.32 | 0.016 |
| Glutamic acid | 179.9 ± 46.7 | 112.3 ± 36.5 | 0.016 |
| Asparagine | 19.57 ± 15.65 | 61.72 ± 16.60 | 0.016 |
| Serine | 40.41 ± 7.35 | 68.36 ± 16.39 | 0.016 |
| Glutamine | 229.4 ± 131.8 | 429.0 ± 119.5 | 0.008 |
| Histidine | 63.13 ± 31.61 | 91.53 ± 26.89 | 0.20 |
| Glycine | 176.7 ± 66.8 | 218.2 ± 58.4 | 0.55 |
| Threonine | 89.34 ± 29.27 | 130.79 ± 65.22 | 0.05 |
| Alanine | 316.3 ± 39.8 | 410.0 ± 78.2 | 0.023 |
| Arginine | 158.2 ± 61.7 | 222.5 ± 59.1 | 0.08 |
| Tyrosine | 47.66 ± 7.48 | 47.56 ± 10.16 | 1.00 |
| Cysteine | 208.2 ± 54.2 | 233.6 ± 76.6 | 0.64 |
| Valine | 168.0 ± 35.5 | 145.0 ± 56.1 | 0.46 |
| Methionine | 21.40 ± 5.23 | 55.53 ± 10.09 | 0.008 |
| Tryptophan | 48.61 ± 21.17 | 50.86 ± 15.54 | 0.95 |
| Phenylalanine | 48.63 ± 6.45 | 58.66 ± 16.85 | 0.15 |
| Isoleucine | 50.46 ± 11.84 | 54.54 ± 17.94 | 0.55 |
| Leucine | 88.59 ± 20.23 | 92.09 ± 31.78 | 0.84 |
| Lysine | 134.9 ± 17.9 | 147.3 ± 43.4 | 0.84 |
| Proline | 233.3 ± 125.8 | 300.7 ± 180.3 | 0.38 |
| Total AA | 2337 ± 420 | 2962 ± 719 | 0.11 |
| Essential AA | 713.1 ± 141.0 | 826.3 ± 257.7 | 0.38 |
| Non Essential AA | 1624 ± 317 | 2136 ± 478 | 0.05 |
| Branched Chain AA | 307.1 ± 66.3 | 291.7 ± 104.7 | 0.55 |
| Phenylalanine/Tyrosine ratio | 1.04 ± 0.17 | 1.23 ± 0.22 | 0.05 |
| Correlation with Δ Zonulin Spearman r (p Value) | Correlation with Δ Calprotectin Spearman r (p Value) | |
|---|---|---|
| Δ Aspartic | 0.357 (0.39) | 0.095 (0.84) |
| Δ Glutamic acid | −0.429 (0.30) | −0.476 (0.24) |
| Δ Asparagine | 0.238 (0.58) | −0.024 (0.98) |
| Δ Serine | 0.024 (0.98) | −0.405 (0.33) |
| Δ Glutamine | 0.619 (0.11) | 0.429 (0.30) |
| Δ Histidine | 0.500 (0.22) | 0.310 (0.46) |
| Δ Glycine | 0.262 (0.54) | −0.024 (0.98) |
| Δ Threonine | 0.571 (0.15) | 0.095 (0.84) |
| Δ Alanine | −0.357 (0.39) | 0.024 (0.98) |
| Δ Arginine | 0.357 (0.39) | −0.024 (0.98) |
| Δ Tyrosine | 0.643 (0.10) | 0.357 (0.39) |
| Δ Cysteine | 0.500 (0.22) | 0.024 (0.98) |
| Δ Valine | 0.714 (0.05) | 0.405 (0.33) |
| Δ Methionine | 0.429 (0.30) | 0.262 (0.54) |
| Δ Tryptophan | 0.643 (0.10) | 0.310 (0.46) |
| Δ Phenylalanine | 0.357 (0.39) | 0.095 (0.84) |
| Δ Isoleucine | 0.452 (0.27) | −0.095 (0.84) |
| Δ Leucine | 0.619 (0.11) | 0.333 (0.43) |
| Δ Lysine | 0.643 (0.10) | 0.595 (0.13) |
| Δ Proline | −0.667 (0.08) | −0.643 (0.10) |
| Δ Total AA | 0.190 (0.66) | −0.048 (0.93) |
| Δ Essential AA | 0.857 (0.024) | 0.262 (0.54) |
| Δ Non Essential AA | 0.190 (0.66) | −0.048 (0.93) |
| Δ Branched Chain AA | 0.571 (0.15) | 0.238 (0.58) |
| Variables | Baseline | After 6 months AA | p Value |
|---|---|---|---|
| Gln/(BCAA+Asp+Asn+Glu) | 0.43 ± 0.23 | 0.91 ± 0.29 | 0.008^ |
| Ala/(BCAA+Asp+Asn+Glu) | 0.61 ± 0.08 | 0.88 ± 0.25 | 0.008^ |
| Variable | Baseline | After 6 Months AA | p Value |
|---|---|---|---|
| BUN (mg/dl) | 43.86 ± 16.09 | 50.33 ± 9.69 | 0.23 |
| BUN/(TAAs) | 0.020 ± 0.012 | 0.018 ± 0.006 | 0.84 |
| BUN/(Non EAAs) | 0.030 ± 0.018 | 0.025 ± 0.009 | 0.55 |
Publisher’s Note: MDPI stays neutral with regard to jurisdictional claims in published maps and institutional affiliations. |
© 2022 by the authors. Licensee MDPI, Basel, Switzerland. This article is an open access article distributed under the terms and conditions of the Creative Commons Attribution (CC BY) license (https://creativecommons.org/licenses/by/4.0/).
Share and Cite
Aquilani, R.; Bolasco, P.; Murtas, S.; Maestri, R.; Iadarola, P.; Testa, C.; Deiana, M.L.; Esposito, M.P.; Contu, R.; Cadeddu, M.; et al. Effects of a Metabolic Mixture on Gut Inflammation and Permeability in Elderly Patients with Chronic Kidney Disease: A Proof-of-Concept Study. Metabolites 2022, 12, 987. https://doi.org/10.3390/metabo12100987
Aquilani R, Bolasco P, Murtas S, Maestri R, Iadarola P, Testa C, Deiana ML, Esposito MP, Contu R, Cadeddu M, et al. Effects of a Metabolic Mixture on Gut Inflammation and Permeability in Elderly Patients with Chronic Kidney Disease: A Proof-of-Concept Study. Metabolites. 2022; 12(10):987. https://doi.org/10.3390/metabo12100987
Chicago/Turabian StyleAquilani, Roberto, Piergiorgio Bolasco, Stefano Murtas, Roberto Maestri, Paolo Iadarola, Cristian Testa, Maria Luisa Deiana, Maria Paola Esposito, Rita Contu, Mariella Cadeddu, and et al. 2022. "Effects of a Metabolic Mixture on Gut Inflammation and Permeability in Elderly Patients with Chronic Kidney Disease: A Proof-of-Concept Study" Metabolites 12, no. 10: 987. https://doi.org/10.3390/metabo12100987
APA StyleAquilani, R., Bolasco, P., Murtas, S., Maestri, R., Iadarola, P., Testa, C., Deiana, M. L., Esposito, M. P., Contu, R., Cadeddu, M., Secci, R., & Boschi, F. (2022). Effects of a Metabolic Mixture on Gut Inflammation and Permeability in Elderly Patients with Chronic Kidney Disease: A Proof-of-Concept Study. Metabolites, 12(10), 987. https://doi.org/10.3390/metabo12100987