
Intersection of Diet and Exercise with the Gut Microbiome and Circulating Metabolites in Male Bodybuilders: A Pilot Study

 , ,
, ,  ,
,  and
and 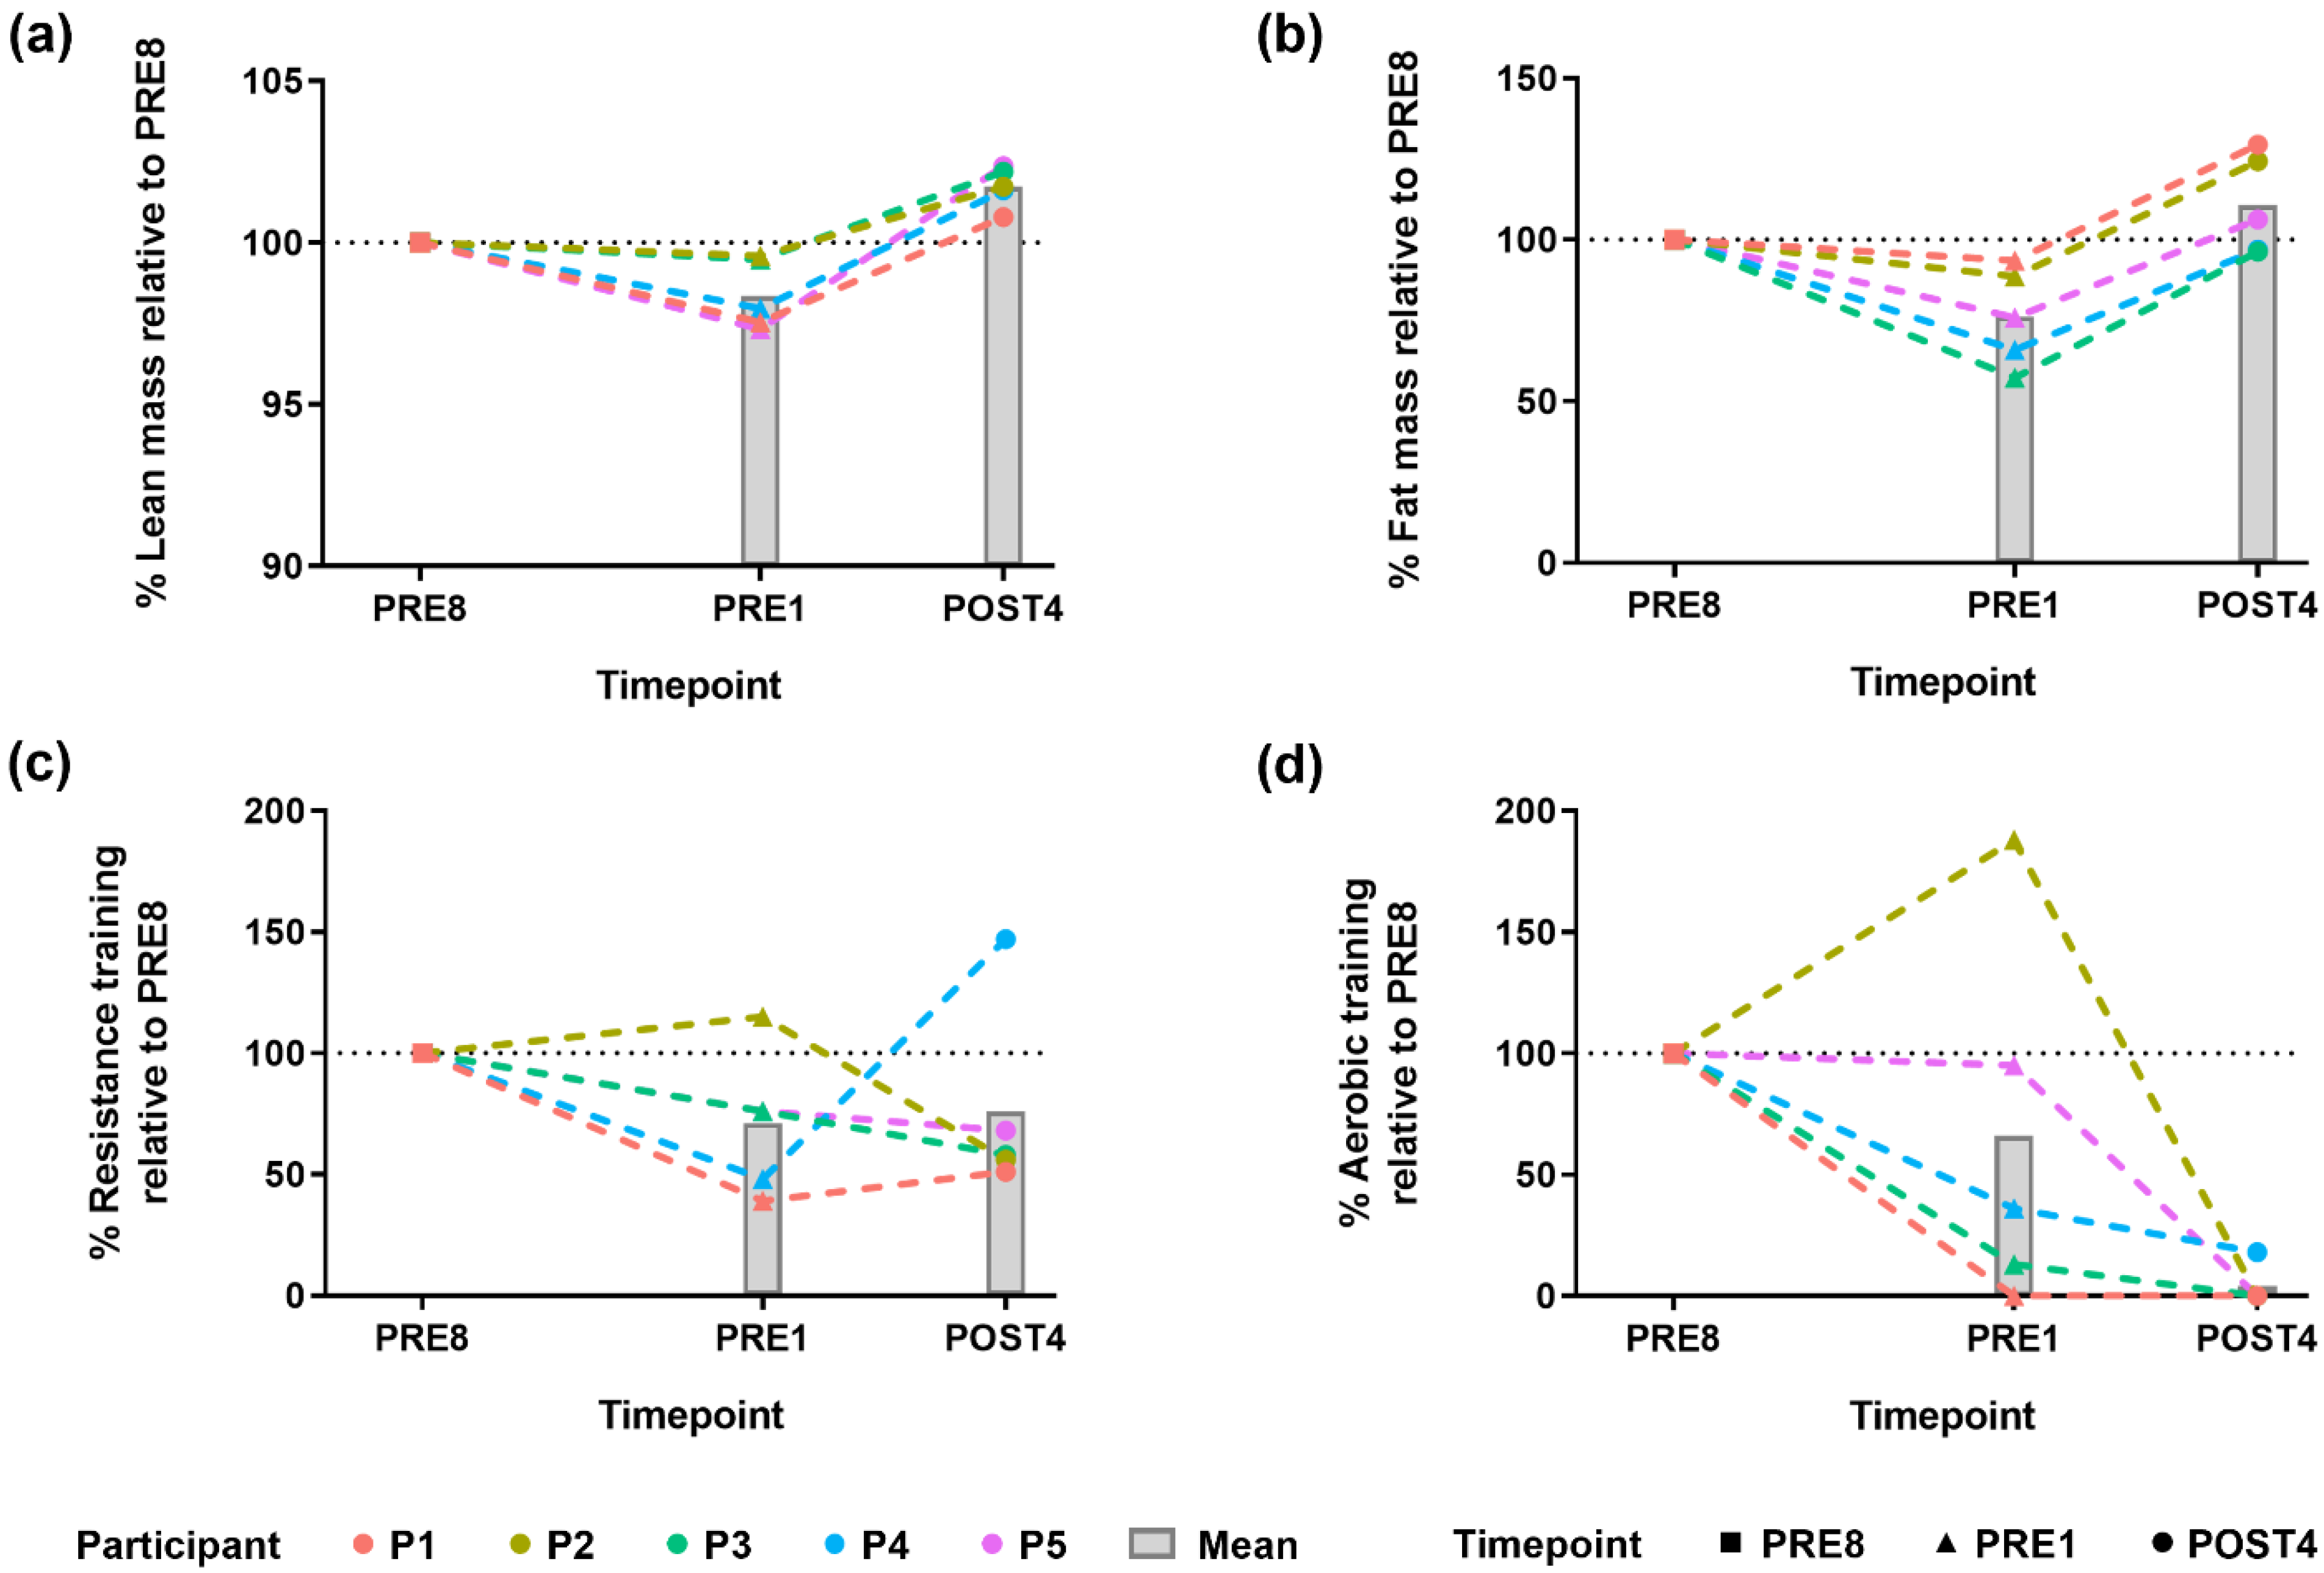
Abstract
1. Introduction
2. Materials and Methods
2.1. Participants
2.2. Blood Sampling and Serum Metabolite Analysis
2.3. Diet and Exercise
2.4. Dual-Energy X-ray Absorptiometry (DXA)
2.5. Faecal Sampling and Microbial Analysis
2.6. Statistical Analysis
3. Results
3.1. Bodybuilders Showed a Common Direction of Change in Body Composition Alteration but Had Varied Exercise Regimes
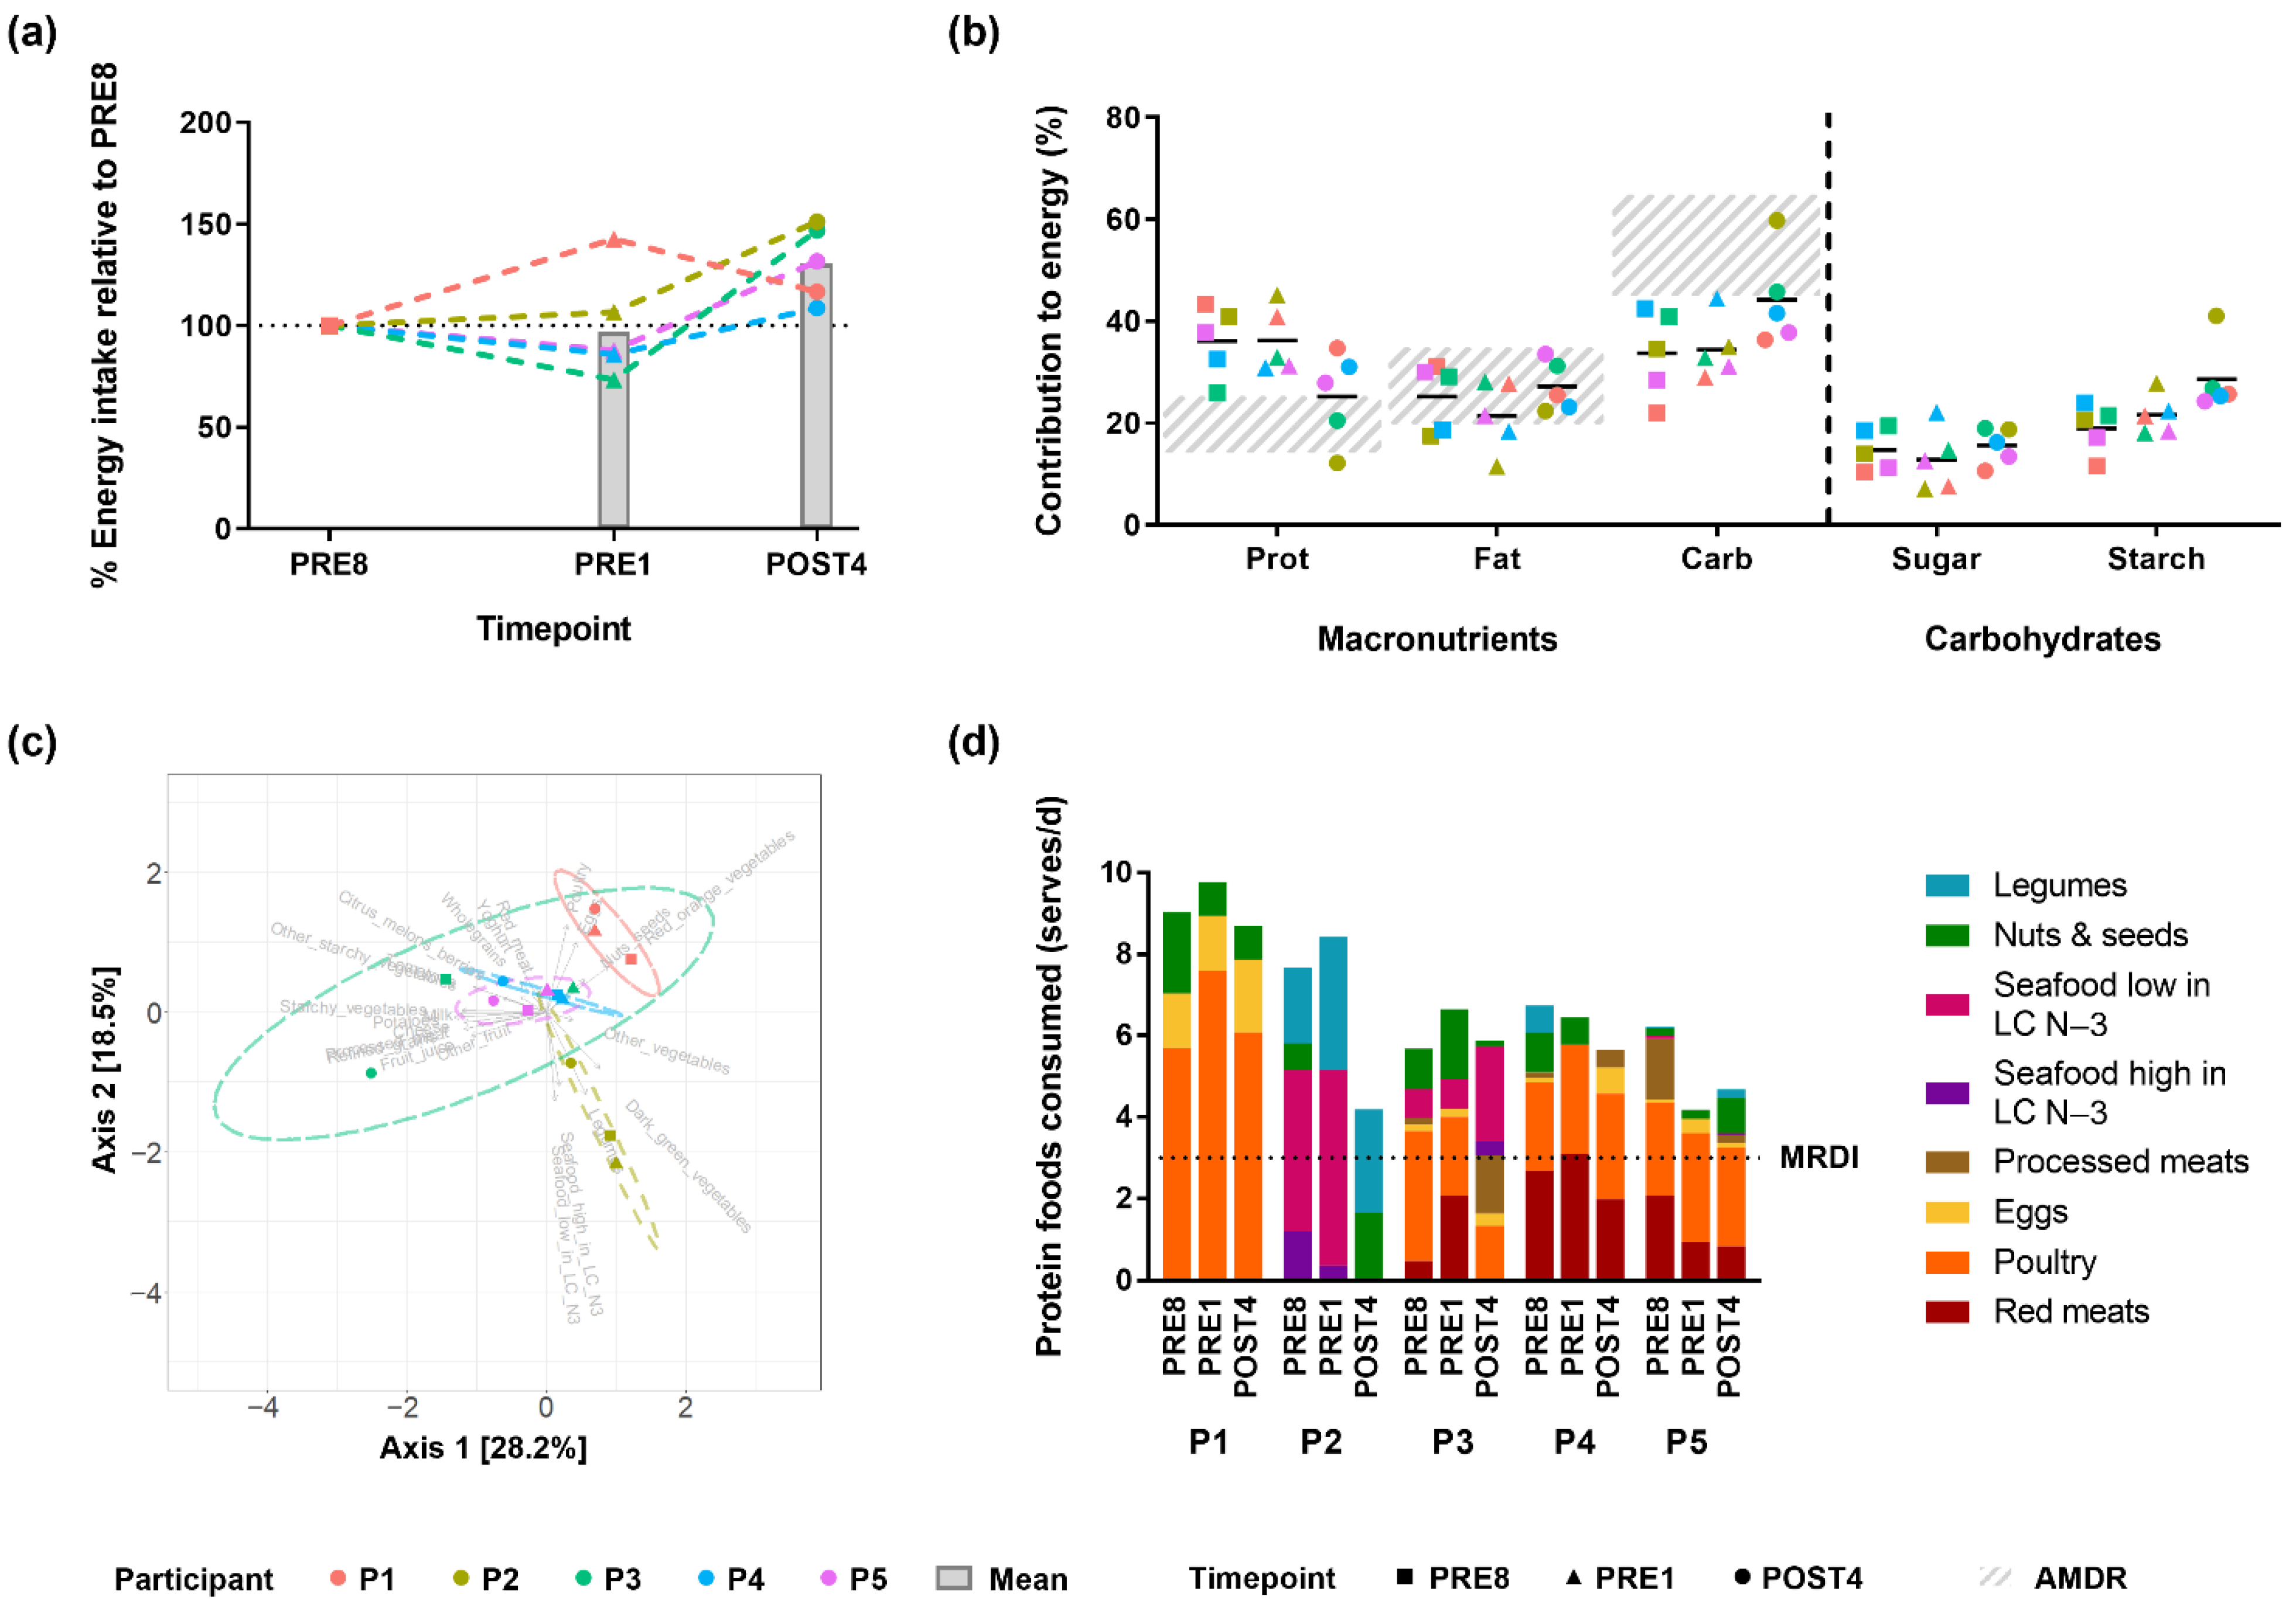
3.2. Bodybuilders Diets Were Similar at the Energy and Macronutrient Level but Variable at the Food Item Level
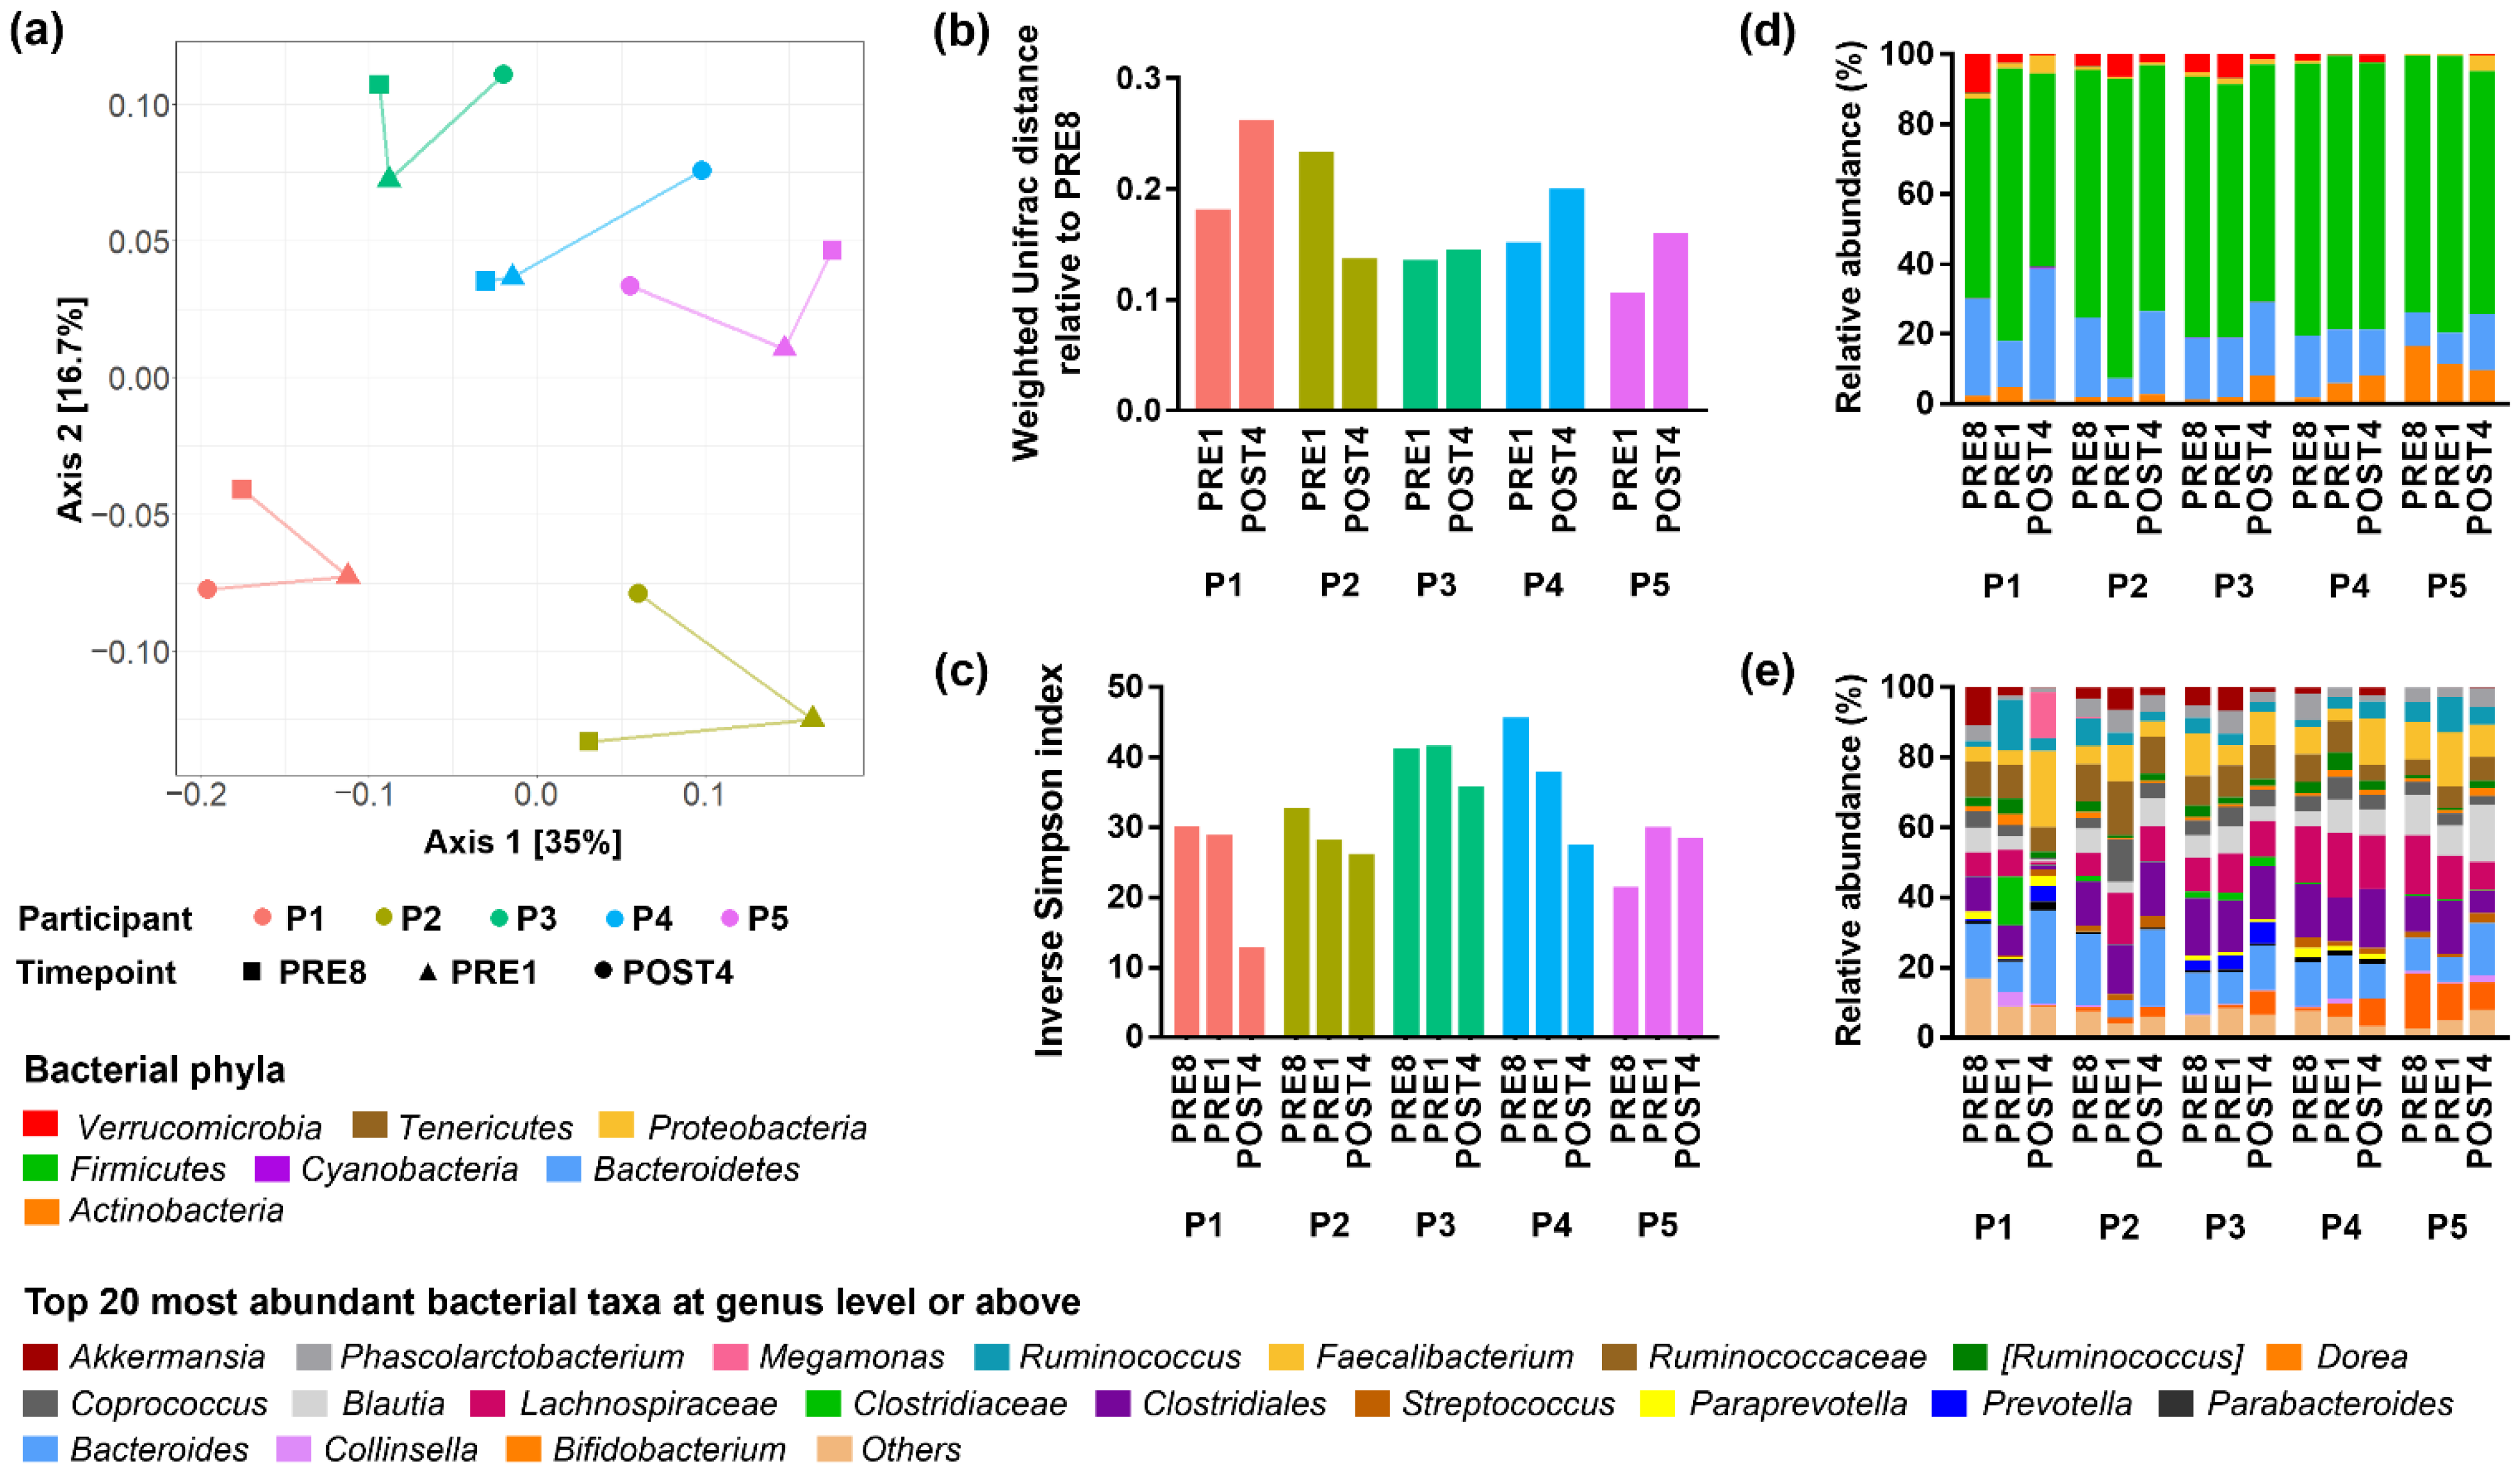
3.3. Bodybuilders Maintained Individualised Gut Microbial Communities with Altered Diversity Post-Competition
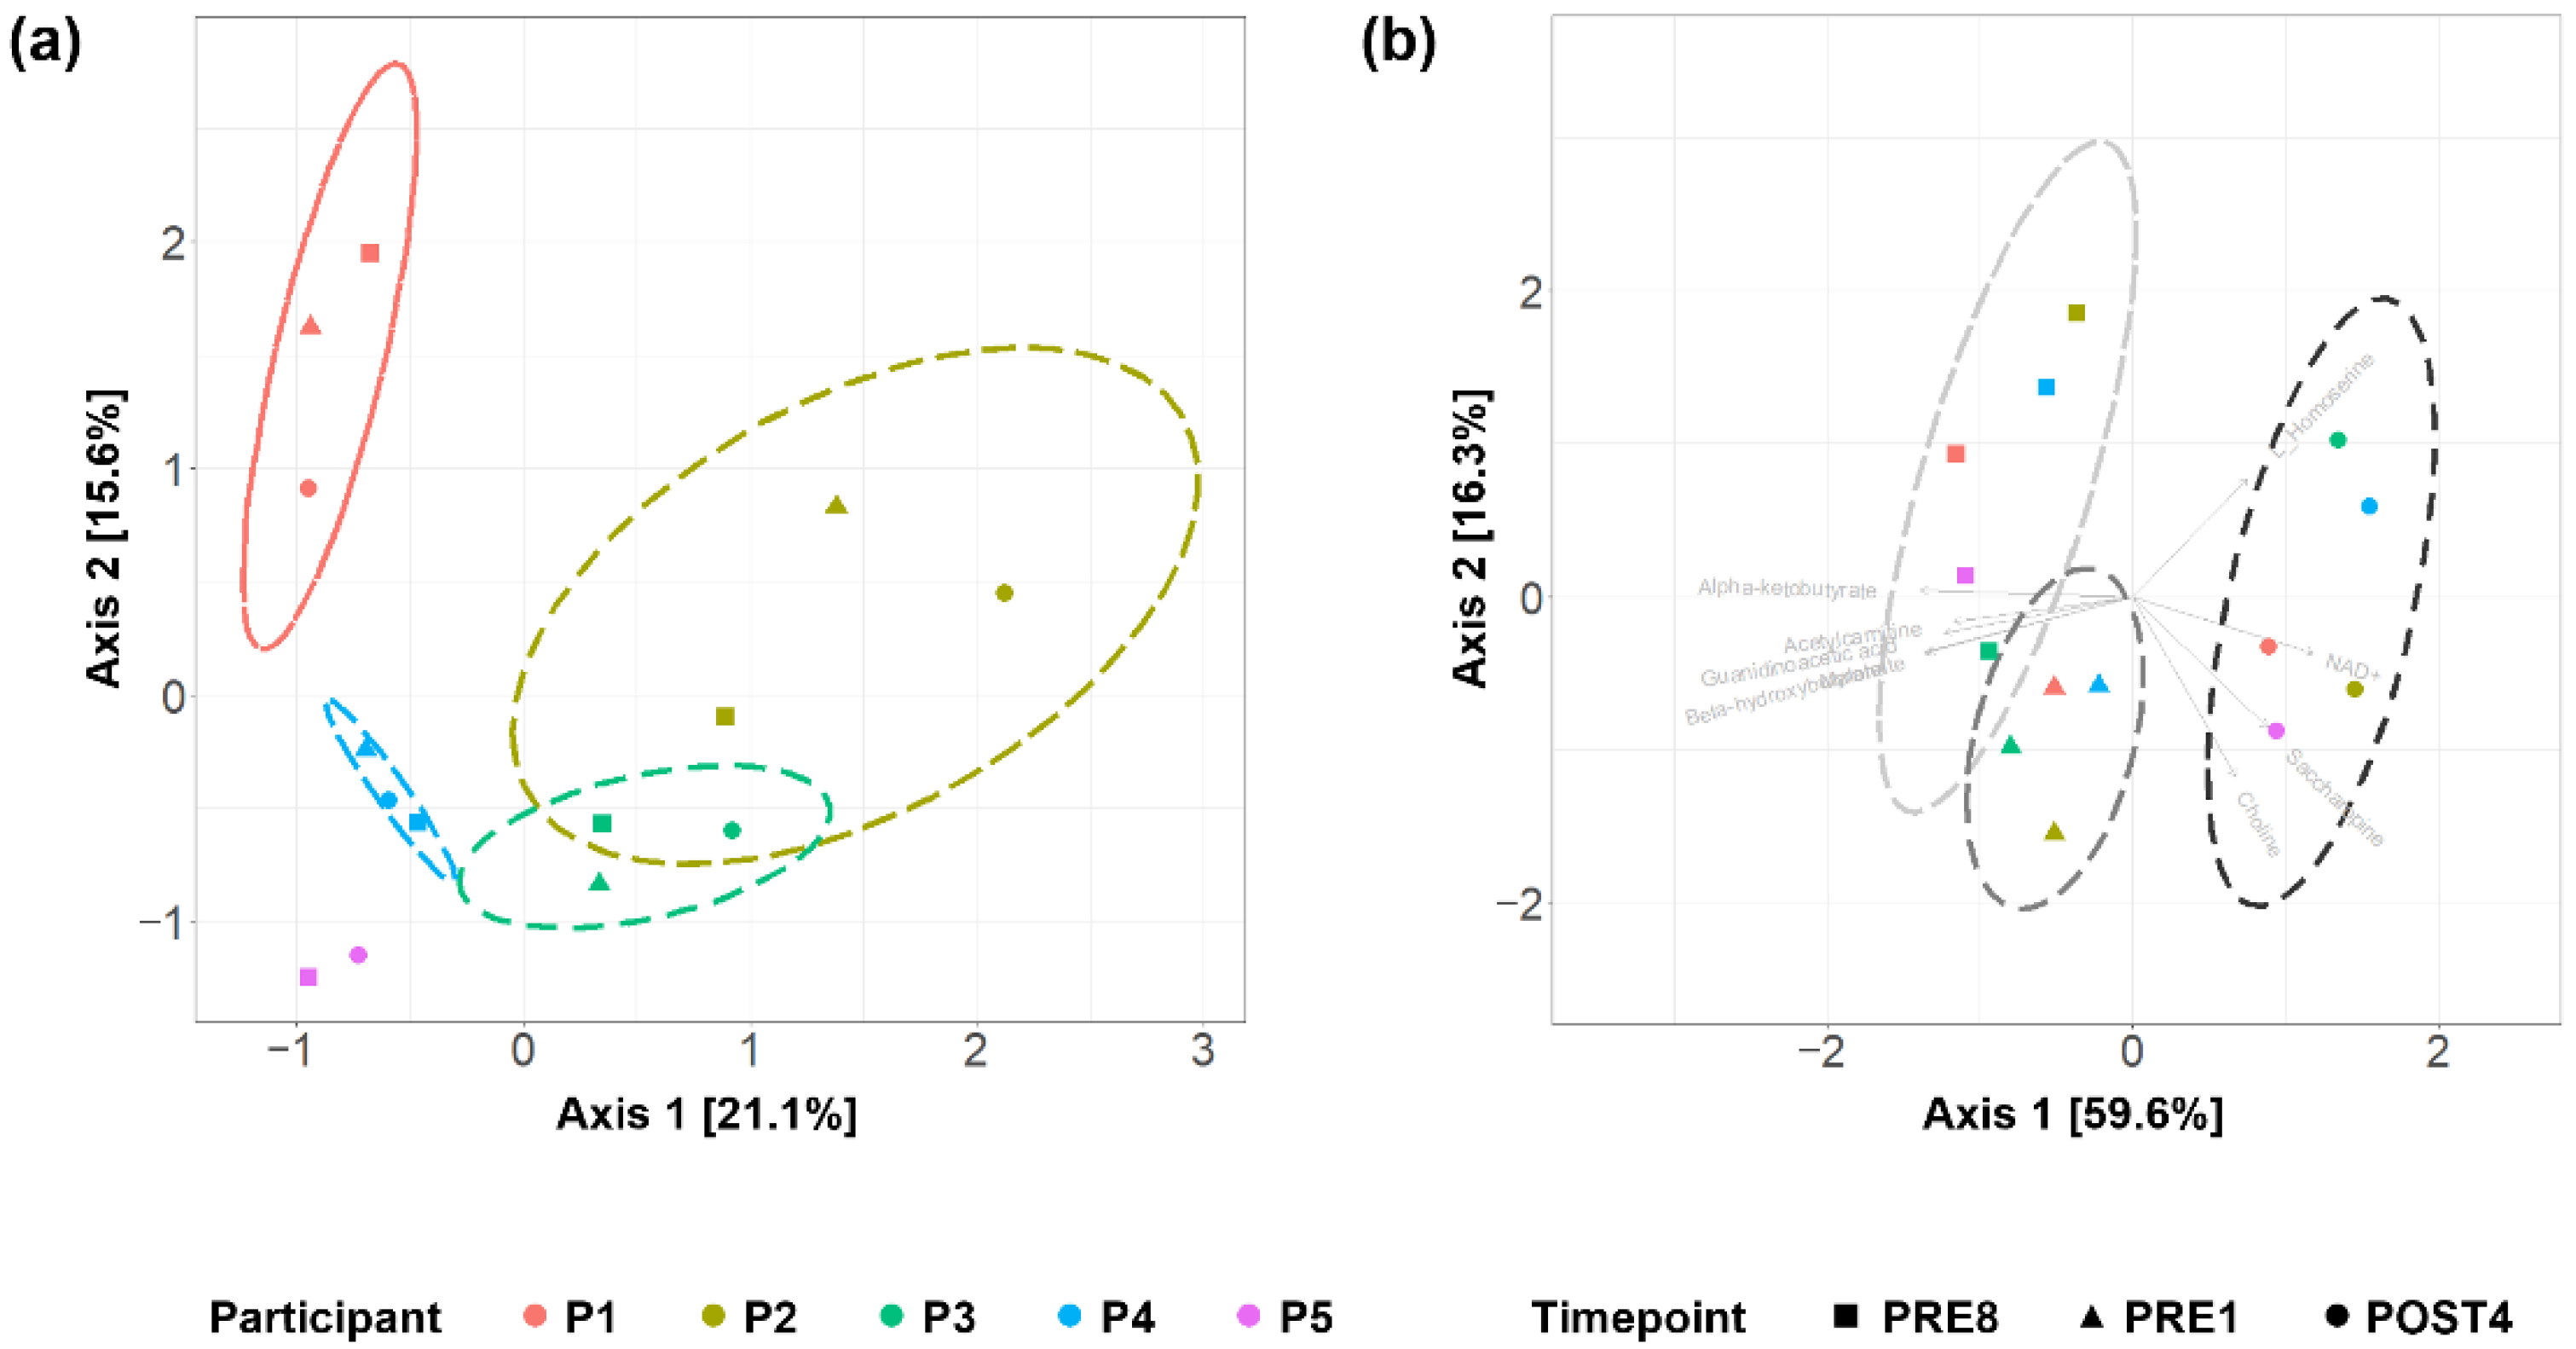
3.4. Circulating Metabolite Profiles Reflect Individuality and Distinguishes between Pre- and Post-Competition
4. Discussion
5. Conclusions
Supplementary Materials
Author Contributions
Funding
Institutional Review Board Statement
Informed Consent Statement
Data Availability Statement
Acknowledgments
Conflicts of Interest
References
- Bennett, J.E.; Stevens, G.A.; Mathers, C.D.; Bonita, R.; Rehm, J.; Kruk, M.E.; Riley, L.M.; Dain, K.; Kengne, A.P.; Chalkidou, K.; et al. NCD Countdown 2030: Worldwide trends in non-communicable disease mortality and progress towards Sustainable Development Goal target 3.4. Lancet 2018, 392, 1072–1088. [Google Scholar] [CrossRef]
- Virani, S.S.; Alonso, A.; Aparicio, H.J.; Benjamin, E.J.; Bittencourt, M.S.; Callaway, C.W.; Carson, A.P.; Chamberlain, A.M.; Cheng, S.; Delling, F.N.; et al. Heart disease and stroke statistics-2021 update: A report from the American Heart Association. Circulation 2021, 143, e254–e743. [Google Scholar] [CrossRef] [PubMed]
- Burke, L.M.; Hawley, J.A.; Jeukendrup, A.; Morton, J.P.; Stellingwerff, T.; Maughan, R.J. Towards a common understanding of diet-exercise strategies to manipulate fuel availability for training and competition preparation in endurance sport. Int. J. Sport Nutr. Exerc. Metab. 2018, 28, 451–463. [Google Scholar] [CrossRef]
- Hughes, R.L. A review of the role of the gut microbiome in personalized sports nutrition. Front. Nutr. 2020, 6, 191. [Google Scholar] [CrossRef] [PubMed]
- Mohr, A.E.; Jäger, R.; Carpenter, K.C.; Kerksick, C.M.; Purpura, M.; Townsend, J.R.; West, N.P.; Black, K.; Gleeson, M.; Pyne, D.B.; et al. The athletic gut microbiota. J. Int. Soc. Sports Nutr. 2020, 17, 24. [Google Scholar] [CrossRef] [PubMed]
- Dziewiecka, H.; Buttar, H.S.; Kasperska, A.; Ostapiuk-Karolczuk, J.; Domagalska, M.; Cichoń, J.; Skarpańska-Stejnborn, A. Physical activity induced alterations of gut microbiota in humans: A systematic review. BMC Sports Sci. Med. Rehabil. 2022, 14, 122. [Google Scholar] [CrossRef] [PubMed]
- Rowland, I.; Gibson, G.; Heinken, A.; Scott, K.; Swann, J.; Thiele, I.; Tuohy, K. Gut microbiota functions: Metabolism of nutrients and other food components. Eur. J. Nutr. 2018, 57, 1–24. [Google Scholar] [CrossRef]
- Krajmalnik-Brown, R.; Ilhan, Z.; Kang, D.; DiBaise, J.K. Effects of gut microbes on nutrient absorption and energy regulation. Nutr. Clin. Pract. 2012, 27, 201–214. [Google Scholar] [CrossRef] [PubMed]
- Aragon, A.A.; Schoenfeld, B.J.; Wildman, R.; Kleiner, S.; VanDusseldorp, T.; Taylor, L.; Earnest, C.P.; Arciero, P.J.; Wilborn, C.; Kalman, D.S.; et al. International society of sports nutrition position stand: Diets and body composition. J. Int. Soc. Sports Nutr. 2017, 14, 16. [Google Scholar] [CrossRef] [PubMed]
- Koay, Y.C.; Wali, J.A.; Luk, A.W.S.; Macia, L.; Cogger, V.C.; Pulpitel, T.J.; Wahl, D.; Solon-Biet, S.M.; Holmes, A.; Simpson, S.J.; et al. Ingestion of resistant starch by mice markedly increases microbiome-derived metabolites. FASEB J. 2019, 33, 8033–8042. [Google Scholar] [CrossRef]
- Flint, H.J.; Scott, K.P.; Duncan, S.H.; Louis, P.; Forano, E. Microbial degradation of complex carbohydrates in the gut. Gut Microbes 2012, 3, 289–306. [Google Scholar] [CrossRef] [PubMed]
- Koropatkin, N.M.; Cameron, E.A.; Martens, E.C. How glycan metabolism shapes the human gut microbiota. Nat. Rev. Microbiol. 2012, 10, 323–335. [Google Scholar] [CrossRef] [PubMed]
- Raubenheimer, D.; Simpson, S.J. Nutritional ecology and human health. Annu. Rev. Nutr. 2016, 36, 603–626. [Google Scholar] [CrossRef] [PubMed]
- Oliphant, K.; Allen-Vercoe, E. Macronutrient metabolism by the human gut microbiome: Major fermentation by-products and their impact on host health. Microbiome 2019, 7, 91. [Google Scholar] [CrossRef] [PubMed]
- Hsu, Y.J.; Chiu, C.C.; Li, Y.P.; Huang, W.C.; Huang, Y.T.; Huang, C.C.; Chuang, H.L. Effect of intestinal microbiota on exercise performance in mice. J. Strength Cond. Res. 2015, 29, 552–558. [Google Scholar] [CrossRef] [PubMed]
- Scheiman, J.; Luber, J.M.; Chavkin, T.A.; MacDonald, T.; Tung, A.; Pham, L.; Wibowo, M.C.; Wurth, R.C.; Punthambaker, S.; Tierney, B.T.; et al. Meta-omics analysis of elite athletes identifies a performance-enhancing microbe that functions via lactate metabolism. Nat. Med. 2019, 25, 1104–1109. [Google Scholar] [CrossRef]
- Bethel, K.; Luttgen, M.S.; Damani, S.; Kolatkar, A.; Lamy, R.; Sabouri-Ghomi, M.; Topol, E.J.; Kuhn, P. Fluid phase biopsy for detection and characterization of circulating endothelial cells in myocardial infarction. Phys. Biol. 2014, 11, 016002. [Google Scholar] [CrossRef]
- Petersen, L.M.; Bautista, E.J.; Nguyen, H.; Hanson, B.M.; Chen, L.; Lek, S.H.; Sodergren, E.; Weinstock, G.M. Community characteristics of the gut microbiomes of competitive cyclists. Microbiome 2017, 5, 98. [Google Scholar] [CrossRef] [PubMed]
- Clarke, S.F.; Murphy, E.F.; O’Sullivan, O.; Lucey, A.J.; Humphreys, M.; Hogan, A.; Hayes, P.; O’Reilly, M.; Jeffery, I.B.; Wood-Martin, R.; et al. Exercise and associated dietary extremes impact on gut microbial diversity. Gut 2014, 63, 1913–1920. [Google Scholar] [CrossRef]
- Barton, W.; Penney, N.C.; Cronin, O.; Garcia-Perez, I.; Molloy, M.G.; Holmes, E.; Shanahan, F.; Cotter, P.D.; O’Sullivan, O. The microbiome of professional athletes differs from that of more sedentary subjects in composition and particularly at the functional metabolic level. Gut 2018, 67, 625–633. [Google Scholar] [CrossRef] [PubMed]
- Jang, L.; Choi, G.; Kim, S.; Kim, B.; Lee, S.; Park, H. The combination of sport and sport-specific diet is associated with characteristics of gut microbiota: An observational study. J. Int. Soc. Sport Nutr. 2019, 16, 21. [Google Scholar] [CrossRef] [PubMed]
- Bycura, D.; Santos, A.C.; Shiffer, A.; Kyman, S.; Winfree, K.; Sutliffe, J.; Pearson, T.; Sonderegger, D.; Cope, E.; Caporaso, J.G. Impact of different exercise modalities on the human gut microbiome. Sports 2021, 9, 14. [Google Scholar] [CrossRef]
- O’Donovan, C.M.; Madigan, S.M.; Garcia-Perez, I.; Rankin, A.; O’ Sullivan, O.; Cotter, P.D. Distinct microbiome composition and metabolome exists across subgroups of elite Irish athletes. J. Sci. Med. Sport 2020, 23, 63–68. [Google Scholar] [CrossRef]
- Furber, M.J.W.; Young, G.R.; Holt, G.S.; Pyle, S.; Davison, G.; Roberts, M.G.; Roberts, J.D.; Howatson, G.; Smith, D.L. Gut microbial stability is associated with greater endurance performance in athletes undertaking dietary periodization. mSystems 2022, 7, e0012922. [Google Scholar] [CrossRef] [PubMed]
- Kinross, J.M.; Darzi, A.W.; Nicholson, J.K. Gut microbiome-host interactions in health and disease. Genome Med. 2011, 3, 14. [Google Scholar] [CrossRef] [PubMed]
- Nicholson, J.K.; Holmes, E.; Kinross, J.; Burcelin, R.; Gibson, G.; Jia, W.; Pettersson, S. Host-gut microbiota metabolic interactions. Science 2012, 336, 1262–1267. [Google Scholar] [CrossRef] [PubMed]
- Spendlove, J.; Mitchell, L.; Gifford, J.; Hackett, D.; Slater, G.; Cobley, S.; O’Connor, H. Dietary intake of competitive bodybuilders. Sports Med. 2015, 45, 1041–1063. [Google Scholar] [CrossRef] [PubMed]
- Lambert, C.P.; Frank, L.L.; Evans, W.J. Macronutrient considerations for the sport of bodybuilding. Sports Med. 2004, 34, 317–327. [Google Scholar] [CrossRef] [PubMed]
- Helms, E.R.; Aragon, A.A.; Fitschen, P.J. Evidence-based recommendations for natural bodybuilding contest preparation: Nutrition and supplementation. J. Int. Soc. Sports Nutr. 2014, 11, 20. [Google Scholar] [CrossRef]
- Mitchell, L.; Hackett, D.; Gifford, J.; Estermann, F.; O’Connor, H. Do bodybuilders use evidence-based nutrition strategies to manipulate physique? Sports 2017, 5, 76. [Google Scholar] [CrossRef]
- Holmes, A.J.; Chew, Y.V.; Colakoglu, F.; Cliff, J.B.; Klaassens, E.; Read, M.N.; Solon-Biet, S.M.; McMahon, A.C.; Cogger, V.C.; Ruohonen, K.; et al. Diet-microbiome interactions in health are controlled by intestinal nitrogen source constraints. Cell Metab. 2017, 25, 140–151. [Google Scholar] [CrossRef]
- Mitchell, L.; Slater, G.; Hackett, D.; Johnson, N.; O’connor, H. Physiological implications of preparing for a natural male bodybuilding competition. Eur. J. Sport Sci. 2018, 18, 619–629. [Google Scholar] [CrossRef] [PubMed]
- Patsch, C.; Challet-Meylan, L.; Thoma, E.C.; Urich, E.; Heckel, T.; O’Sullivan, J.F.; Grainger, S.J.; Kapp, F.G.; Sun, L.; Christensen, K.; et al. Generation of vascular endothelial and smooth muscle cells from human pluripotent stem cells. Nat. Cell Biol. 2015, 17, 994–1003. [Google Scholar] [CrossRef] [PubMed]
- O’Sullivan, J.; Morningstar, J.; Zheng, B.; Jeanfavre, S.; Scott, J.; Yang, Q.; Fernandez, C.; Vasan, R.; Long, M.; Melander, O.; et al. DMGV is a novel marker of liver fat and predicts future development of type 2 diabetes. Circulation 2016, 134, A13814. [Google Scholar] [CrossRef]
- Warren, C.R.; O’Sullivan, J.F.; Friesen, M.; Becker, C.E.; Zhang, X.; Liu, P.; Wakabayashi, Y.; Morningstar, J.E.; Shi, X.; Choi, J.; et al. Induced pluripotent stem cell differentiation enables functional validation of GWAS variants in metabolic disease. Cell Stem Cell 2017, 20, 547–557.e7. [Google Scholar] [CrossRef] [PubMed]
- Caporaso, J.G.; Lauber, C.L.; Walters, W.A.; Berg-Lyons, D.; Lozupone, C.A.; Turnbaugh, P.J.; Fierer, N.; Knight, R. Global patterns of 16S rRNA diversity at a depth of millions of sequences per sample. Proc. Natl Acad Sci. USA 2011, 108, 4516–4522. [Google Scholar] [CrossRef]
- Masella, A.P.; Bartram, A.K.; Truszkowski, J.M.; Brown, D.G.; Neufeld, J.D. PANDAseq: Paired-end assembler for Illumina sequences. BMC Bioinform. 2012, 13, 31. [Google Scholar] [CrossRef] [PubMed]
- Edgar, R.C. Search and clustering orders of magnitude faster than BLAST. Bioinformatics 2010, 26, 2460–2461. [Google Scholar] [CrossRef] [PubMed]
- Caporaso, J.G.; Kuczynski, J.; Stombaugh, J.; Bittinger, K.; Bushman, F.D.; Costello, E.K.; Fierer, N.; Peña, A.G.; Goodrich, J.K.; Gordon, J.I.; et al. QIIME allows analysis of high-throughput community sequencing data. Nat. Methods 2010, 7, 335–336. [Google Scholar] [CrossRef] [PubMed]
- R Core Team. R: A Language and Environment for Statistical Computing. 2018. Available online: https://www.r-project.org/ (accessed on 20 September 2022).
- Ggbiplot: A Ggplot2 Based Biplot. 2011. Available online: https://github.com/vqv/ggbiplot (accessed on 20 September 2022).
- McMurdie, P.J.; Holmes, S. phyloseq: An R package for reproducible interactive analysis and graphics of microbiome census data. PLoS ONE 2013, 8, e61217. [Google Scholar] [CrossRef]
- Wickham, H. Ggplot2: Elegant Graphics for Data Analysis; Springer: New York, NY, USA, 2016. [Google Scholar]
- Oksanen, J.; Blanchet, F.G.; Friendly, M.; Kindt, R.; Legendre, P.; McGlinn, D.; Minchin, P.R.; O’Hara, R.B.; Simpson, G.L.; Solymos, P.; et al. Vegan: Community Ecology Package. 2019. Available online: https://cran.r-project.org/web/packages/vegan/vegan.pdf (accessed on 20 September 2022).
- National Health and Medical Research Council; Australian Government Department of Health and Ageing; New Zealand Ministry of Health. Nutrient Reference Values for Australia and New Zealand; v1.2 Updated Sep 2017 ed.; National Health and Medical Research Council: Canberra, Australia, 2006.
- National Health and Medical Research Council. Australian Dietary Guidelines; National Health and Medical Research Council: Canberra, Australia, 2013.
- David, L.A.; Materna, A.C.; Friedman, J.; Campos-Baptista, M.I.; Blackburn, M.C.; Perrotta, A.; Erdman, S.E.; Alm, E.J. Host lifestyle affects human microbiota on daily timescales. Genome Biol. 2014, 15, R89. [Google Scholar] [CrossRef]
- Johnson, A.J.; Vangay, P.; Al-Ghalith, G.A.; Hillmann, B.M.; Ward, T.L.; Shields-Cutler, R.R.; Kim, A.D.; Shmagel, A.K.; Syed, A.N.; Walter, J.; et al. Daily sampling reveals personalized diet-microbiome associations in humans. Cell Host Microbe 2019, 25, 789–802.e5. [Google Scholar] [CrossRef]
- Cotillard, A.; Kennedy, S.P.; Kong, L.C.; Prifti, E.; Pons, N.; Le Chatelier, E.; Almeida, M.; Quinquis, B.; Levenez, F.; Galleron, N.; et al. Dietary intervention impact on gut microbial gene richness. Nature 2013, 500, 585–588. [Google Scholar] [CrossRef] [PubMed]
- McCleary, B.V.; Sloane, N.; Draga, A. Determination of total dietary fibre and available carbohydrates: A rapid integrated procedure that simulates in vivo digestion. Starch—Stärke 2015, 67, 860–883. [Google Scholar] [CrossRef]
- Phillips, G.O.; Cui, S.W. An introduction: Evolution and finalisation of the regulatory definition of dietary fibre. Food Hydrocoll. 2011, 25, 139–143. [Google Scholar] [CrossRef]
- Food and Agriculture Organization of the United Nations; World Health Organization. Recommended Methods of Analysis and Sampling. CXS 234-1999. Available online: http://www.fao.org/fao-who-codexalimentarius/codex-texts/list-standards/en/ (accessed on 19 August 2022).
- Cerqueira, R.M.; Photenhauer, A.L.; Pollet, R.M.; Brown, H.A.; Koropatkin, N.M. Starch digestion by gut bacteria: Crowdsourcing for carbs. Trends Microbiol. 2020, 28, 95–108. [Google Scholar] [CrossRef] [PubMed]
- Dobranowski, P.A.; Stintzi, A. Resistant starch, microbiome, and precision modulation. Gut Microbes 2021, 13, e1926842. [Google Scholar] [CrossRef]
- Evans, M.; Cogan, K.E.; Egan, B. Metabolism of ketone bodies during exercise and training: Physiological basis for exogenous supplementation. J. Physiol. 2017, 595, 2857–2871. [Google Scholar] [CrossRef]
- Sakaguchi, C.A.; Nieman, D.C.; Signini, E.F.; Abreu, R.M.; Catai, A.M. Metabolomics-based studies assessing exercise-induced alterations of the human metabolome: A systematic review. Metabolites 2019, 9, 164. [Google Scholar] [CrossRef]
- Ghannam, R.B.; Techtmann, S.M. Machine learning applications in microbial ecology, human microbiome studies, and environmental monitoring. Comput. Struct. Biotechnol. J. 2021, 19, 1092–1107. [Google Scholar] [CrossRef] [PubMed]
- Claesson, M.J.; Jeffery, I.B.; Conde, S.; Power, S.E.; O’Connor, E.M.; Cusack, S.; Harris, H.M.B.; Coakley, M.; Lakshminarayanan, B.; O’Sullivan, O.; et al. Gut microbiota composition correlates with diet and health in the elderly. Nature 2012, 488, 178–184. [Google Scholar] [CrossRef] [PubMed]
- Read, M.N.; Holmes, A.J. Towards an integrative understanding of diet-host-gut microbiome interactions. Front. Immunol. 2017, 8, 538. [Google Scholar] [CrossRef] [PubMed]
- Wu, G.; Zhao, N.; Zhang, C.; Lam, Y.Y.; Zhao, L. Guild-based analysis for understanding gut microbiome in human health and diseases. Genome Med. 2021, 13, 22. [Google Scholar] [CrossRef] [PubMed]
- Johnson, A.J.; Zheng, J.J.; Kang, J.W.; Saboe, A.; Knights, D.; Zivkovic, A.M. A guide to diet-microbiome study design. Front. Nutr. 2020, 7, 79. [Google Scholar] [CrossRef] [PubMed]


Publisher’s Note: MDPI stays neutral with regard to jurisdictional claims in published maps and institutional affiliations. |
© 2022 by the authors. Licensee MDPI, Basel, Switzerland. This article is an open access article distributed under the terms and conditions of the Creative Commons Attribution (CC BY) license (https://creativecommons.org/licenses/by/4.0/).
Share and Cite
Luk, A.W.S.; Mitchell, L.; Koay, Y.C.; O’Sullivan, J.F.; O’Connor, H.; Hackett, D.A.; Holmes, A. Intersection of Diet and Exercise with the Gut Microbiome and Circulating Metabolites in Male Bodybuilders: A Pilot Study. Metabolites 2022, 12, 911. https://doi.org/10.3390/metabo12100911
Luk AWS, Mitchell L, Koay YC, O’Sullivan JF, O’Connor H, Hackett DA, Holmes A. Intersection of Diet and Exercise with the Gut Microbiome and Circulating Metabolites in Male Bodybuilders: A Pilot Study. Metabolites. 2022; 12(10):911. https://doi.org/10.3390/metabo12100911
Chicago/Turabian StyleLuk, Alison W. S., Lachlan Mitchell, Yen Chin Koay, John F. O’Sullivan, Helen O’Connor, Daniel A. Hackett, and Andrew Holmes. 2022. "Intersection of Diet and Exercise with the Gut Microbiome and Circulating Metabolites in Male Bodybuilders: A Pilot Study" Metabolites 12, no. 10: 911. https://doi.org/10.3390/metabo12100911
APA StyleLuk, A. W. S., Mitchell, L., Koay, Y. C., O’Sullivan, J. F., O’Connor, H., Hackett, D. A., & Holmes, A. (2022). Intersection of Diet and Exercise with the Gut Microbiome and Circulating Metabolites in Male Bodybuilders: A Pilot Study. Metabolites, 12(10), 911. https://doi.org/10.3390/metabo12100911