
Liver Impairment—The Potential Application of Volatile Organic Compounds in Hepatology

 ,
, 
Abstract
:
1. Introduction
1.1. Liver Pathophysiology and Liver Function Tests
1.2. VOC Analysis
2. Materials & Methods
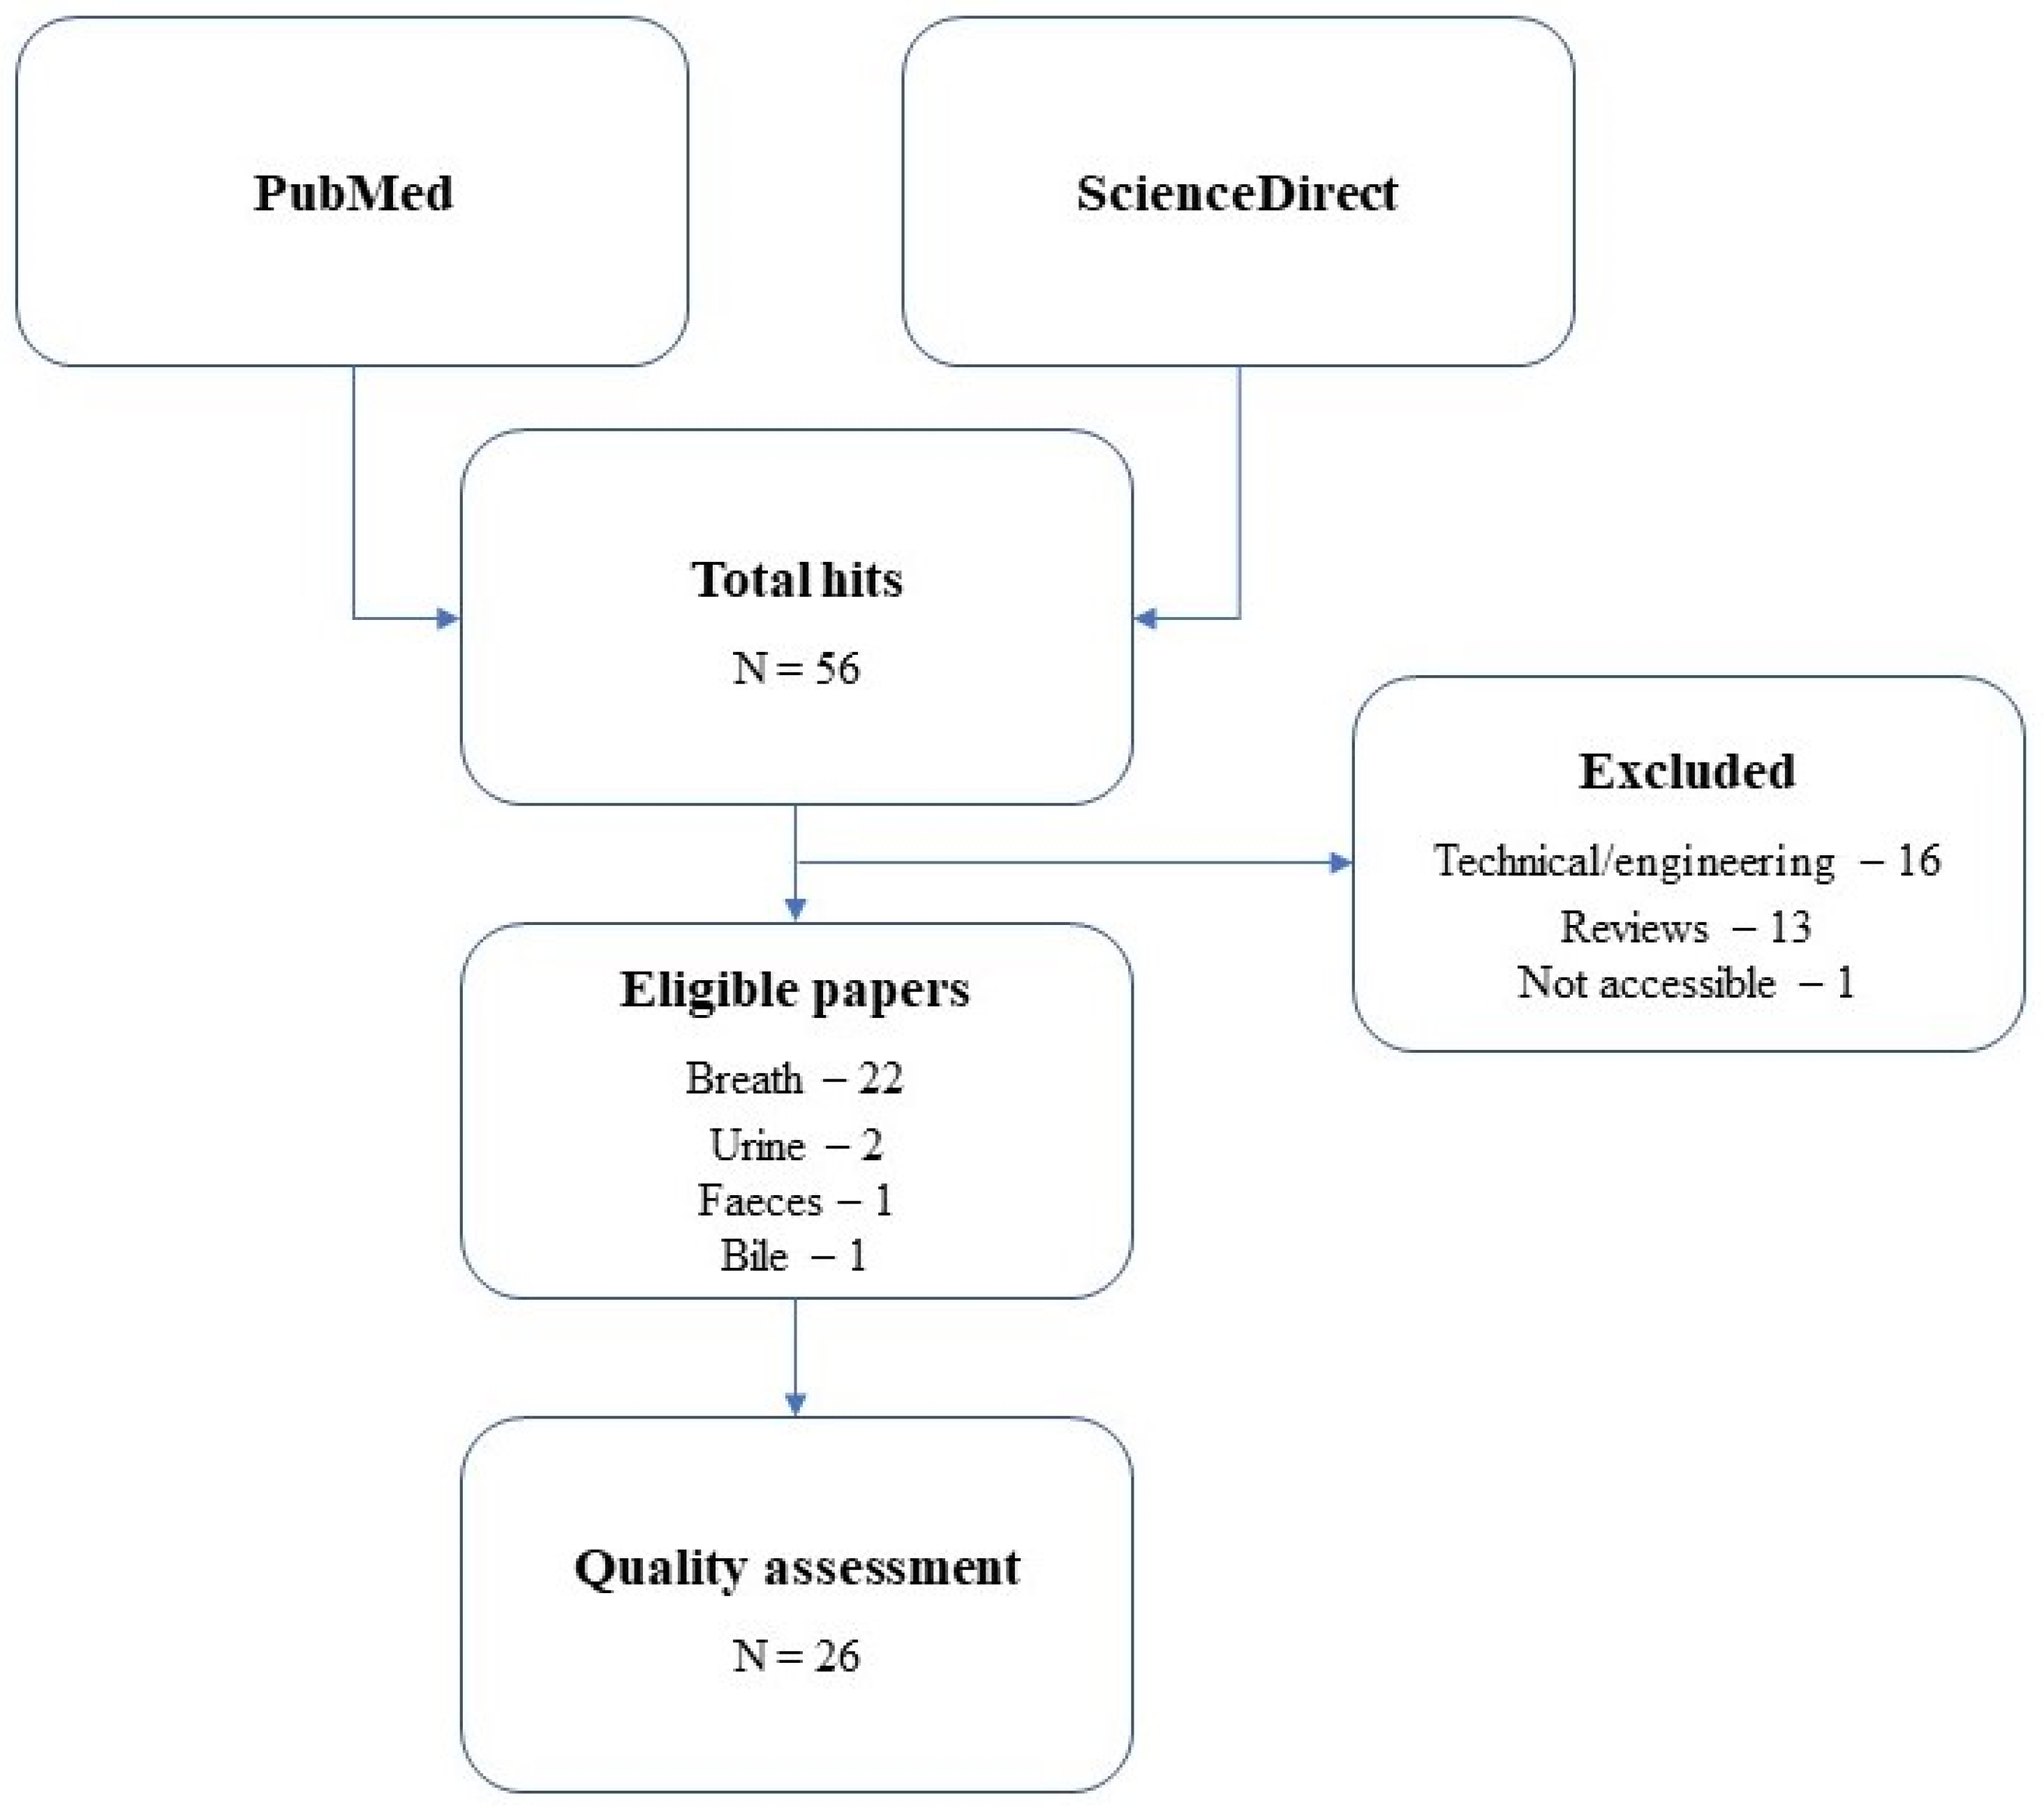
2.1. Literature Search
2.2. Quality Assessment
3. Results
4. Discussion
4.1. Differentiation among General Cirrhotic CLD, Non-Cirrhotic CLD, and Healthy Individuals
4.1.1. Origin of the VOCs Reported in General Cirrhotic CLD against Healthy Individuals
4.2. Differentiation among Specific Cirrhotic CLD, Non-Cirrhotic CLD, and Pre-Cirrhotic CLD
4.2.1. VOCs in Advanced versus Mild Fibrosis Patients
4.2.2. VOCs in Cirrhotic Patients with Hepatic Encephalopathy or Hepatocellular Cancer
4.2.3. VOCs in Non-Alcoholic Fatty Liver Disease versus Non-Alcoholic Steatohepatitis Patients
4.2.4. VOCs in Alcoholic and Non-Alcoholic Fatty Liver Disease Patients versus Cirrhotic Patients
4.2.5. VOCs in Alcoholic Hepatitis Patients versus Cirrhotic Patients
4.2.6. Origin of the VOCs Reported in Cirrhotic, Non-Cirrhotic, and Pre-Cirrhotic Stage Individuals
4.3. Liver Diseases Examined by VOC Measured in Faeces, Bile and Urine
4.3.1. VOCs in Faeces
4.3.2. VOCs in Bile
4.3.3. VOCs in Urine
5. Summary
Supplementary Materials
Author Contributions
Funding
Conflicts of Interest
References
- Chen, S.; Zieve, L.; Mahadevan, V. Mercaptans and dimethyl sulfide in the breath of patients with cirrhosis of the liver. Effect of feeding methionine. J. Lab. Clin. Med. 1970, 75, 628–635. [Google Scholar] [PubMed]
- Chen, S.; Mahadevan, V.; Zieve, L. Volatile fatty acids in the breath of patients with cirrhosis of the liver. J. Lab. Clin. Med. 1970, 75, 622–627. [Google Scholar]
- Tangerman, A.; Meuwese-Arends, M.; Jansen, J. Cause and composition of foetor hepaticus. Lancet 1994, 343, 483. [Google Scholar] [CrossRef]
- Shimamoto, C.; Hirata, I.; Katsu, K. Breath and blood ammonia in liver cirrhosis. Hepatogastroenterology 2000, 47, 443–445. [Google Scholar]
- Solga, S.F.; Alkhuraishe, A.; Cope, K.; Tabesh, A.; Clark, J.M.; Torbenson, M.; Schwartz, P.; Magnuson, T.; Diehl, A.M.; Risby, T.H. Breath biomarkers and non-alcoholic fatty liver disease: Preliminary observations. Biomarkers 2006, 11, 174–183. [Google Scholar] [CrossRef]
- Bataller, R.; Brenner, D.A. Liver fibrosis. J. Clin. Investig. 2005, 115, 209–218. [Google Scholar] [CrossRef]
- Kisseleva, T.; Brenner, D.A. Mechanisms of fibrogenesis. Exp. Biol. Med. Maywood 2008, 233, 109–122. [Google Scholar] [CrossRef]
- Tsochatzis, E.A.; Bosch, J.; Burroughs, A.K. Liver cirrhosis. Lancet 2014, 383, 1749–1761. [Google Scholar] [CrossRef]
- Simonetti, R.G.; Cammà, C.; Fiorello, F.; Politi, F.; D’Amico, G.; Pagliaro, L. Hepatocellular carcinoma. Dig. Dis. Sci. 1991, 36, 962–972. [Google Scholar] [CrossRef] [PubMed]
- De Franchis, R. Expanding consensus in portal hypertension: Report of the Baveno VI Consensus Workshop: Stratifying risk and individualizing care for portal hypertension. J. Hepatol. 2015, 63, 743–752. [Google Scholar] [CrossRef] [PubMed] [Green Version]
- Lichtinghagen, R.; Pietsch, D.; Bantel, H.; Manns, M.P.; Brand, K.; Bahr, M. The Enhanced Liver Fibrosis (ELF) score: Normal values, influence factors and proposed cut-off values. J. Hepatol. 2013, 59, 236–242. [Google Scholar] [CrossRef]
- Le Calvez, S.; Thabut, M.; Messous, D.; Munteanu, M.; Ratziu, V.; Imbert-Bismut, F.; Poynard, T. The predictive value of Fibrotest vs. APRI for the diagnosis of fibrosis in chronic hepatitis C. Hepatology 2004, 39, 862–863. [Google Scholar] [CrossRef]
- Boyle, M.; Tiniakos, D.; Schattenberg, J.M.; Ratziu, V.; Bugianessi, E.; Petta, S.; Oliveira, C.P.; Govaere, O.; Younes, R.; McPherson, S.; et al. Performance of the PRO-C3 collagen neo-epitope biomarker in non-alcoholic fatty liver disease. JHEP Rep. 2019, 1, 188–198. [Google Scholar] [CrossRef] [PubMed]
- Wai, J.W.; Fu, C.; Wong, V.W.-S. Confounding factors of non-invasive tests for nonalcoholic fatty liver disease. J. Gastroenterol. 2020, 55, 731–741. [Google Scholar] [CrossRef] [PubMed]
- Kamath, P.S.; Wiesner, R.H.; Malinchoc, M.; Kremers, W.K.; Therneau, T.M.; Kosberg, C.L.; D’Amico, G.; Dickson, E.R.; Kim, W.R. A model to predict survival in patients with end-stage liver disease. Hepatology 2001, 33, 464–470. [Google Scholar] [CrossRef] [PubMed]
- Tonon, M.; Rosi, S.; Gambino, C.G.; Piano, S.; Calvino, V.; Romano, A.; Martini, A.; Pontisso, P.; Angeli, P. Natural history of acute kidney disease in patients with cirrhosis. J. Hepatol. 2021, 74, 578–583. [Google Scholar] [CrossRef]
- Holzhütter, H.-G.; Wuensch, T.; Gajowski, R.; Berndt, N.; Bulik, S.; Meierhofer, D.; Stockmann, M. A novel variant of the 13C-methacetin liver function breath test that eliminates the confounding effect of individual differences in systemic CO2 kinetics. Arch. Toxicol. 2020, 94, 401–415. [Google Scholar] [CrossRef] [Green Version]
- Logan, R.P.H. Urea breath tests in the management of Helicobacter pylori infection. Gut 1998, 43, S47–S50. [Google Scholar] [CrossRef] [PubMed]
- Verlinden, W.; Van Mieghem, E.; Depauw, L.; Vanwolleghem, T.; Vonghia, L.; Weyler, J.; Driessen, A.; Callens, D.; Roosens, L.; Dirinck, E.; et al. Non-Alcoholic Steatohepatitis Decreases Microsomal Liver Function in the Absence of Fibrosis. Biomedicines 2020, 8, 546. [Google Scholar] [CrossRef]
- Petta, S.; Rini, F.; Calvaruso, V.; Cammà, C.; Ciminnisi, S.; Di Marco, V.; Giannini, E.G.; Grimaudo, S.; Pipitone, R.M.; Craxì, A. Aminopyrine breath test predicts liver-related events and death in HCV-related cirrhosis on SVR after DAA therapy. Liver Int. 2020, 40, 530–538. [Google Scholar] [CrossRef]
- Hanouneh, I.A.; Zein, N.N.; Cikach, F.; Dababneh, L.; Grove, D.; Alkhouri, N.; Lopez, R.; Dweik, R.A. The Breathprints in Patients With Liver Disease Identify Novel Breath Biomarkers in Alcoholic Hepatitis. Clin. Gastroenterol. Hepatol. 2014, 12, 516–523. [Google Scholar] [CrossRef] [Green Version]
- Morisco, F.; Aprea, E.; Lembo, V.; Fogliano, V.; Vitaglione, P.; Mazzone, G.; Cappellin, L.; Gasperi, F.; Masone, S.; De Palma, G.D.; et al. Rapid “Breath-Print” of Liver Cirrhosis by Proton Transfer Reaction Time-of-Flight Mass Spectrometry. A Pilot Study. PLoS ONE 2013, 8, e59658. [Google Scholar] [CrossRef] [Green Version]
- Pleil, J.D.; Stiegel, M.; Risby, T.H. Clinical breath analysis: Discriminating between human endogenous compounds and exogenous (environmental) chemical confounders. J. Breath Res. 2013, 7, 17107. [Google Scholar] [CrossRef] [Green Version]
- Amann, A.; Costello, B.D.L.; Miekisch, W.; Schubert, J.; Buszewski, B.; Pleil, J.; Ratcliffe, N.; Risby, T. The human volatilome: Volatile organic compounds (VOCs) in exhaled breath, skin emanations, urine, feces and saliva. J. Breath Res. 2014, 8, 34001. [Google Scholar] [CrossRef]
- Khalid, T.; Richardson, P.; Probert, C.S. The Liver Breath! Breath Volatile Organic Compounds for the Diagnosis of Liver Disease. Clin. Gastroenterol. Hepatol. 2014, 12, 524–526. [Google Scholar] [CrossRef] [PubMed]
- Kwak, J.; Preti, G. Volatile disease biomarkers in breath: A critique. Curr. Pharm. Biotechnol. 2011, 12, 1067–1074. [Google Scholar] [CrossRef]
- Calenic, B.; Amann, A. Detection of volatile malodorous compounds in breath: Current analytical techniques and implications in human disease. Bioanalysis 2014, 6, 357–376. [Google Scholar] [CrossRef]
- Miekisch, W.; Schubert, J.K.; Noeldge-Schomburg, G.F. Diagnostic potential of breath analysis—Focus on volatile organic compounds. Clin. Chim. Acta 2004, 347, 25–39. [Google Scholar] [CrossRef] [PubMed]
- Janfaza, S.; Khorsand, B.; Nikkhah, M.; Zahiri, J. Digging deeper into volatile organic compounds associated with cancer. Biol. Methods Protoc. 2019, 4, bpz014. [Google Scholar] [CrossRef] [PubMed]
- Sies, H. What is oxidative stress? In Oxidative Stress and Vascular Disease; Springer: Berlin/Heidelberg, Germany, 2000; pp. 1–8. [Google Scholar]
- Kwon, J.-W.; Park, H.-W.; Kim, W.J.; Kim, M.-G.; Lee, S.-J. Exposure to volatile organic compounds and airway inflammation. Environ. Health 2018, 17, 65. [Google Scholar] [CrossRef]
- Hakim, M.; Broza, Y.Y.; Barash, O.; Peled, N.; Phillips, M.; Amann, A.; Haick, H. Volatile Organic Compounds of Lung Cancer and Possible Biochemical Pathways. Chem. Rev. 2012, 112, 5949–5966. [Google Scholar] [CrossRef]
- Velde, S.V.D.; Nevens, F.; Van Hee, P.; Van Steenberghe, D.; Quirynen, M. GC–MS analysis of breath odor compounds in liver patients. J. Chromatogr. B 2008, 875, 344–348. [Google Scholar] [CrossRef]
- Lembo, V.; Aprea, E.; Fogliano, V.; Vitaglione, P.; Mazzone, G.; Loperto, I.; Cappellin, L.; Gasperi, F.; Biasioli, F.; Morisco, F.; et al. Online analysis of breath by proton transfer reaction time of flight mass spectrometry in cirrhotic patients. J. Hepatol. 2013, 58, S91. [Google Scholar] [CrossRef]
- Millonig, G.; Praun, S.; Netzer, M.; Baumgartner, C.; Dornauer, A.; Mueller, S.; Villinger, J.; Vogel, W. Non-invasive diagnosis of liver diseases by breath analysis using an optimized ion–molecule reaction-mass spectrometry approach: A pilot study. Biomarkers 2010, 15, 297–306. [Google Scholar] [CrossRef] [PubMed]
- Garner, C.E.; Smith, S.; Bardhan, P.; Ratcliffe, N.M.; Probert, C. A pilot study of faecal volatile organic compounds in faeces from cholera patients in Bangladesh to determine their utility in disease diagnosis. Trans. R. Soc. Trop. Med. Hyg. 2009, 103, 1171–1173. [Google Scholar] [CrossRef]
- Navaneethan, U.; Parsi, M.A.; Lourdusamy, V.; Bhatt, A.; Gutierrez, N.G.; Grove, D.; Sanaka, M.R.; Hammel, J.P.; Stevens, T.; Vargo, J.J.; et al. Volatile organic compounds in bile for early diagnosis of cholangiocarcinoma in patients with primary sclerosing cholangitis: A pilot study. Gastrointest. Endosc. 2015, 81, 943–949. [Google Scholar] [CrossRef] [Green Version]
- Phillips, M. Breath Tests in Medicine. Sci. Am. 1992, 267, 74–79. [Google Scholar] [CrossRef]
- Risby, T.H.; Solga, S. Current status of clinical breath analysis. Appl. Phys. B 2006, 85, 421–426. [Google Scholar] [CrossRef]
- Pereira, J.; Porto-Figueira, P.; Cavaco, C.; Taunk, K.; Rapole, S.; Dhakne, R.; Nagarajaram, H.; Câmara, J.S. Breath Analysis as a Potential and Non-Invasive Frontier in Disease Diagnosis: An Overview. Metabolites 2015, 5, 3–55. [Google Scholar] [CrossRef] [Green Version]
- Baethge, C.; Goldbeck-Wood, S.; Mertens, S. SANRA—Ascale for the quality assessment of narrative review articles. Res. Integr. Peer Rev. 2019, 4, 1–7. [Google Scholar] [CrossRef] [Green Version]
- Friedman, M.I.; Preti, G.; Deems, R.O.; Friedman, L.S.; Munoz, S.J.; Maddrey, W.C. Limonene in expired lung air of patients with liver disease. Dig. Dis. Sci. 1994, 39, 1672–1676. [Google Scholar] [CrossRef]
- Hiroshi, K.; Masaya, H.; Nariyoshi, S.; Makoto, M. Evaluation of volatile sulfur compounds in the expired alveolar gas in patients with liver cirrhosis. Clin. Chim. Acta 1978, 85, 279–284. [Google Scholar] [CrossRef]
- Letteron, P.; Duchatelle, V.; Berson, A.; Fromenty, B.; Fisch, C.; Degott, C.; Benhamou, J.P.; Pessayre, D. Increased ethane exhalation, an in vivo index of lipid peroxidation, in alcohol-abusers. Gut 1993, 34, 409–414. [Google Scholar] [CrossRef] [PubMed] [Green Version]
- Dadamio, J.; Velde, S.V.D.; Laleman, W.; Van Hee, P.; Coucke, W.; Nevens, F.; Quirynen, M. Breath biomarkers of liver cirrhosis. J. Chromatogr. B 2012, 905, 17–22. [Google Scholar] [CrossRef] [PubMed]
- Pijls, K.E.; Smolinska, A.; Jonkers, D.M.A.E.; Dallinga, J.W.; Masclee, A.A.M.; Koek, G.H.; Van Schooten, F.-J. A profile of volatile organic compounds in exhaled air as a potential non-invasive biomarker for liver cirrhosis. Sci. Rep. 2016, 6, 19903. [Google Scholar] [CrossRef] [Green Version]
- Fernández del Río, R.; O’Hara, M.; Holt, A.; Pemberton, P.; Shah, T.; Whitehouse, T.; Mayhew, C. Volatile Biomarkers in Breath Associated with Liver Cirrhosis—Comparisons of Pre- and Post-liver Transplant Breath Samples. EBioMedicine 2015, 2, 1243–1250. [Google Scholar] [CrossRef] [PubMed] [Green Version]
- Eng, K.; Alkhouri, N.; Cikach, F.; Patel, N.; Yan, C.; Grove, D.; Lopez, R.; Rome, E.; Dweik, R.A. Analysis of breath volatile organic compounds in children with chronic liver disease compared to healthy controls. J. Breath Res. 2015, 9, 26002. [Google Scholar] [CrossRef]
- Alkhouri, N.; Singh, T.; Alsabbagh, E.; Guirguis, J.; Chami, T.; Hanouneh, I.A.; Grove, D.; Lopez, A.R.; Dweik, R. Isoprene in the Exhaled Breath is a Novel Biomarker for Advanced Fibrosis in Patients with Chronic Liver Disease: A Pilot Study. Clin. Transl. Gastroenterol. 2015, 6, e112. [Google Scholar] [CrossRef]
- De Vincentis, A.; Pennazza, G.; Santonico, M.; Gentilucci, U.V.; Galati, G.; Gallo, P.; Vernile, C.; Pedone, C.; Incalzi, R.A.; Picardi, A. Breath-print analysis by e-nose for classifying and monitoring chronic liver disease: A proof-of-concept study. Sci. Rep. 2016, 6, 25337. [Google Scholar] [CrossRef] [Green Version]
- Khalid, T.; Costello, B.D.L.; Ewen, R.; White, P.; Stevens, S.; Gordon, F.; Collins, P.; McCune, A.; Shenoy, A.; Shetty, S.; et al. Breath volatile analysis from patients diagnosed with harmful drinking, cirrhosis and hepatic encephalopathy: A pilot study. Metabolomics 2013, 9, 938–948. [Google Scholar] [CrossRef]
- O’Hara, E.M.; Del Río, R.F.; Holt, A.; Pemberton, P.; Shah, T.; Whitehouse, T.; Mayhew, C.A. Limonene in exhaled breath is elevated in hepatic encephalopathy. J. Breath Res. 2016, 10, 46010. [Google Scholar] [CrossRef]
- Arasaradnam, R.P.; McFarlane, M.; Daulton, E.; Westenbrink, E.W.; O’Connell, N.; Wurie, S.; Nwokolo, C.U.; Bardhan, K.D.; Savage, R.S.; Covington, J. Non-Invasive Distinction of Non-Alcoholic Fatty Liver Disease using Urinary Volatile Organic Compound Analysis: Early Results. J. Gastrointest. Liver Dis. 2015, 24, 197–201. [Google Scholar] [CrossRef] [Green Version]
- Verdam, F.J.; Dallinga, J.W.; Driessen, A.; de Jonge, C.; Moonen, E.J.; van Berkel, J.B.; Luijk, J.; Bouvy, N.D.; Buurman, W.A.; Rensen, S.S.; et al. Non-alcoholic steatohepatitis: A non-invasive diagnosis by analysis of exhaled breath. J. Hepatol. 2013, 58, 543–548. [Google Scholar] [CrossRef]
- Alkhouri, N.; Cikach, F.; Eng, K.; Moses, J.; Patel, N.; Yan, C.; Hanouneh, I.; Grove, D.; Lopez, R.; Dweik, R. Analysis of breath volatile organic compounds as a noninvasive tool to diagnose nonalcoholic fatty liver disease in children. Eur. J. Gastroenterol. Hepatol. 2014, 26, 82–87. [Google Scholar] [CrossRef]
- Qin, T.; Liu, H.; Song, Q.; Song, G.; Wang, H.-Z.; Pan, Y.-Y.; Xiong, F.-X.; Gu, K.-S.; Sun, G.-P.; Chen, Z.-D. The Screening of Volatile Markers for Hepatocellular Carcinoma. Cancer Epidemiol. Biomark. Prev. 2010, 19, 2247–2253. [Google Scholar] [CrossRef] [PubMed] [Green Version]
- Sinha, R.; Lockman, K.A.; Homer, N.Z.; Bower, E.; Brinkman, P.; Knobel, H.H.; Fallowfield, J.A.; Jaap, A.J.; Hayes, P.C.; Plevris, J.N. Volatomic analysis identifies compounds that can stratify non-alcoholic fatty liver disease. JHEP Rep. 2020, 2, 100137. [Google Scholar] [CrossRef] [PubMed]
- Ferrandino, G.; Orf, I.; Smith, R.; Calcagno, M.; Thind, A.K.; Debiram-Beecham, I.; Williams, M.; Gandelman, O.; de Saedeleer, A.; Kibble, G.; et al. Breath Biopsy Assessment of Liver Disease Using an Exogenous Volatile Organic Compound—Toward Improved Detection of Liver Impairment. Clin. Trans. Gastroenterol. 2020, 11, e00239. [Google Scholar] [CrossRef] [PubMed]
- Miller-Atkins, G.; Acevedo-Moreno, L.-A.; Grove, D.; Dweik, R.A.; Tonelli, A.R.; Brown, J.M.; Allende, D.S.; Aucejo, F.; Rotroff, D.M. Breath Metabolomics Provides an Accurate and Noninvasive Approach for Screening Cirrhosis, Primary, and Secondary Liver Tumors. Hepatol. Commun. 2020, 4, 1041–1055. [Google Scholar] [CrossRef] [Green Version]
- Raman, M.; Ahmed, I.; Gillevet, P.M.; Probert, C.S.; Ratcliffe, N.M.; Smith, S.; Greenwood, R.; Sikaroodi, M.; Lam, V.; Crotty, P.; et al. Fecal Microbiome and Volatile Organic Compound Metabolome in Obese Humans with Nonalcoholic Fatty Liver Disease. Clin. Gastroenterol. Hepatol. 2013, 11, 868–875. [Google Scholar] [CrossRef]
- Navaneethan, U.; Parsi, M.A.; Lourdusamy, D.; Grove, D.; Sanaka, M.R.; Hammel, J.P.; Vargo, J.J.; Dweik, R.A. Volatile Organic Compounds in Urine for Noninvasive Diagnosis of Malignant Biliary Strictures: A Pilot Study. Dig. Dis. Sci. 2015, 60, 2150–2157. [Google Scholar] [CrossRef]
- Arasaradnam, R.P.; McFarlane, M.; Ling, K.; Wurie, S.; O’Connell, N.; Nwokolo, C.U.; Bardhan, K.D.; Skinner, J.; Savage, R.S.; Covington, J. Breathomics—Exhaled volatile organic compound analysis to detect hepatic encephalopathy: A pilot study. J. Breath Res. 2016, 10, 16012. [Google Scholar] [CrossRef]
- Bannaga, A.; Tyagi, H.; Daulton, E.; Covington, J.; Arasaradnam, R. Exploratory Study Using Urinary Volatile Organic Compounds for the Detection of Hepatocellular Carcinoma. Molecules 2021, 26, 2447. [Google Scholar] [CrossRef]
- Pauling, L.; Robinson, A.B.; Teranishi, R.; Cary, P. Quantitative Analysis of Urine Vapor and Breath by Gas-Liquid Partition Chromatography. Proc. Natl. Acad. Sci. USA 1971, 68, 2374–2376. [Google Scholar] [CrossRef] [Green Version]
- Schubert, J.K.; Miekisch, W.; Geiger, K.; Nöldge-Schomburg, G.F.E. Breath analysis in critically ill patients: Potential and limitations. Expert Rev. Mol. Diagn. 2004, 4, 619–629. [Google Scholar] [CrossRef]
- Tangerman, A.; Meuwese-Arends, M.T.; van Tongeren, J.H. A new sensitive assay for measuring volatile sulphur compounds in human breath by Tenax trapping and gas chromatography and its application in liver cirrhosis. Clin. Chim. Acta 1983, 130, 103–110. [Google Scholar] [CrossRef]
- De Vincentis, A.; Pennazza, G.; Santonico, M.; Gentilucci, U.V.; Galati, G.; Gallo, P.; Zompanti, A.; Pedone, C.; Incalzi, R.A.; Picardi, A. Breath-print analysis by e-nose may refine risk stratification for adverse outcomes in cirrhotic patients. Liver Int. 2017, 37, 242–250. [Google Scholar] [CrossRef] [PubMed]
- D’Amico, A.; Pennazza, G.; Santonico, M.; Martinelli, E.; Roscioni, C.; Galluccio, G.; Paolesse, R.; Di Natale, C. An investigation on electronic nose diagnosis of lung cancer. Lung Cancer 2010, 68, 170–176. [Google Scholar] [CrossRef] [PubMed]
- Dragonieri, S.; Annema, J.T.; Schot, R.; van der Schee, M.P.; Spanevello, A.; Carratù, P.; Resta, O.; Rabe, K.F.; Sterk, P.J. An electronic nose in the discrimination of patients with non-small cell lung cancer and COPD. Lung Cancer 2009, 64, 166–170. [Google Scholar] [CrossRef] [PubMed]
- Lebel, M.; Ferron, L.; Masson, M.; Pichette, J.; Carrier, C. Benzyl Alcohol Metabolism and Elimination in Neonates. Dev. Pharmacol. Ther. 1988, 11, 347–356. [Google Scholar] [CrossRef]
- Miyazawa, M.; Shindo, M.; Shimada, T. Metabolism of (+)- and (-)-limonenes to respective carveols and perillyl alcohols by CYP2C9 and CYP2C19 in human liver microsomes. Drug Metab. Dispos. 2002, 30, 602–607. [Google Scholar] [CrossRef] [Green Version]
- Burk, R.F.; Early, D.S.; Hill, K.E.; Palmer, I.S.; Boeglin, M.E. Plasma selenium in patients with cirrhosis. Hepatology 1998, 27, 794–798. [Google Scholar] [CrossRef] [PubMed]
- Sukul, P.; Richter, A.; Schubert, J.K.; Miekisch, W. Deficiency and absence of endogenous isoprene in adults, disqualified its putative origin. Heliyon 2021, 7, e05922. [Google Scholar] [CrossRef] [PubMed]
- King, J.; Kupferthaler, A.; Unterkofler, K.; Koc, H.; Teschl, S.; Teschl, G.; Miekisch, W.; Schubert, J.; Hinterhuber, H.; Amann, A. Isoprene and acetone concentration profiles during exercise on an ergometer. J. Breath Res. 2009, 3, 27006. [Google Scholar] [CrossRef] [PubMed]


| Publication | Means of Analysis | SANRA Scores (Averaged) | SANRA and Added Questions Scores (Averaged) | Quality |
|---|---|---|---|---|
| Friedman et al. 1994 [42] | Breath | 6.5 | 6.25 | Medium |
| Hiroshi et al. 1978 [43] | Breath | 7 | 5 | Low |
| Letteron et al. 1993 [44] | Breath | 9 | 6.5 | Medium |
| Van den Velde et al. 2008 [33] | Breath | 9.5 | 9.25 | High |
| Dadamio et al. 2012 [45] | Breath | 10 | 8.25 | High |
| Pijls et al. 2016 [46] | Breath | 10 | 8 | High |
| Morisco et al. 2013 [22] | Breath | 9 | 8.25 | High |
| Del Rio et al. 2015 [47] | Breath | 9 | 8 | High |
| Eng et al. 2015 [48] | Breath | 9.5 | 7.25 | High |
| Alkhouri et al. 2015 [49] | Breath | 10 | 7.25 | High |
| De Vincentis et al. 2016 [50] | Breath | 9 | 5.75 | Medium |
| Khalid et al. 2013 [51] | Breath | 9 | 6.75 | Medium |
| O’Hara et al. 2016 [52] | Breath | 10 | 8.5 | High |
| Arasaradnam et al. 2015 [53] | Breath | 9 | 5.5 | Medium |
| Solga et al. 2006 [5] | Breath | 9 | 6.75 | Medium |
| Verdam et al. 2013 [54] | Breath | 9 | 6.25 | Medium |
| Alkhouri et al. 2013 [55] | Breath | 9.5 | 6.75 | Medium |
| Millonig et al. 2010 [35] | Breath | 7.5 | 7.5 | High |
| Hanouneh et al. 2014 [21] | Breath | 9 | 7.75 | High |
| Qin et al. 2010 [56] | Breath | 7.5 | 6 | Medium |
| Sinha et al. 2019 [57] | Breath | 10 | 7 | Medium |
| Ferrandino et al. 2020 [58] | Breath | 10 | 7 | Medium |
| Miller-Atkins et al. [59] | Breath | 10 | 8.75 | High |
| Raman et al. 2013 [60] | Faeces | 9 | 6.75 | Medium |
| Navaneethan et al. 2015 [37] | Bile | 9 | 6.75 | Medium |
| Navaneethan et al. 2015 [61] | Urine | 9 | 6.75 | Medium |
| Arasaradnam et al. 2012 [62] | Urine | 8.5 | 6 | Medium |
| Bannaga et al. 2021 [63] | Urine | 9.5 | 7 | Medium |
| Compound | Number of Times | Biological Origin |
|---|---|---|
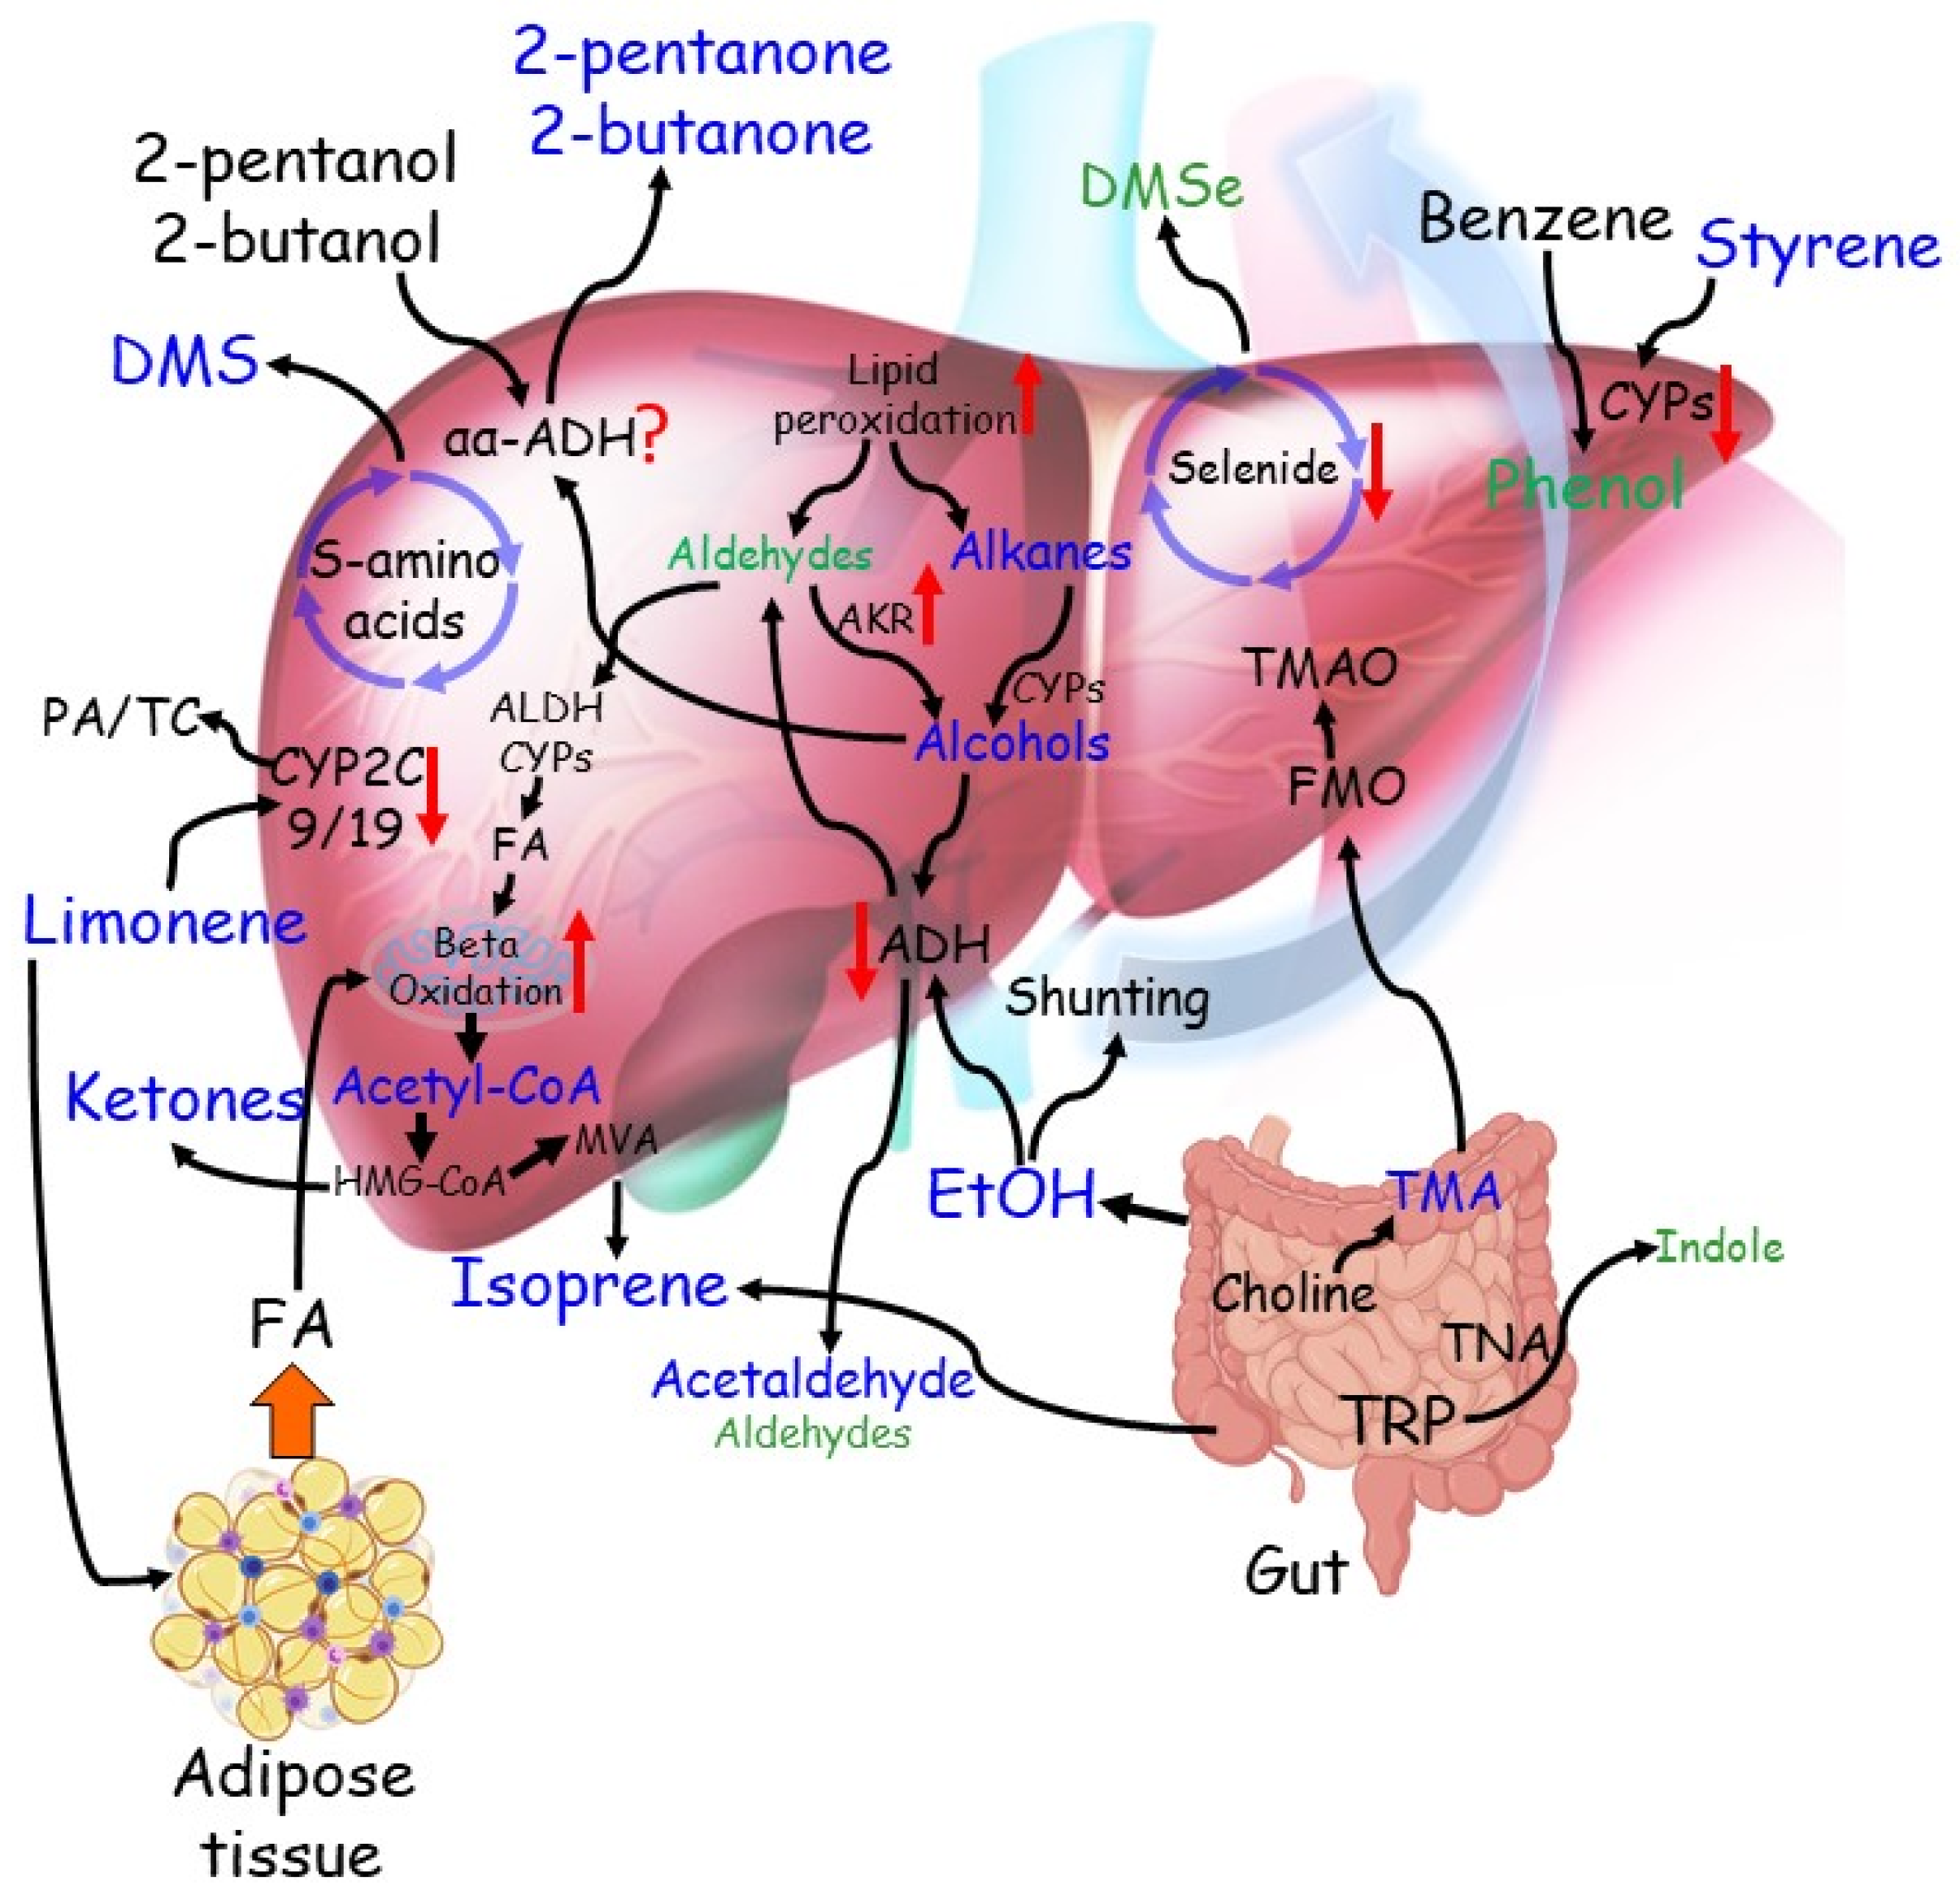
| Dimethyl-sulphide | 11 | Incomplete metabolism of sulphur-containing amino acids in the transamination pathway—cytochrome C oxidase deficiency |
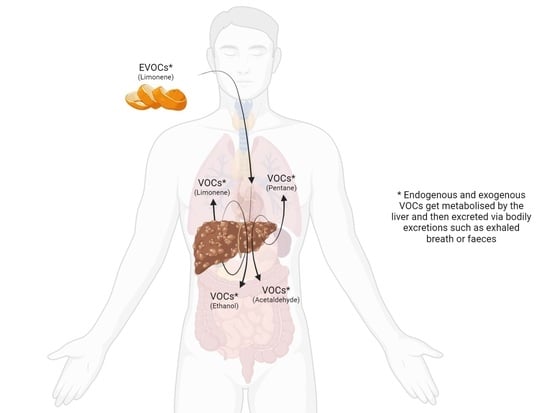
| Limonene | 7 | Limonene is not produced in the human body—metabolised by the P450 enzymes CYP2C9 and CYP2C19—accumulates in the fat of patients |
| Acetone | 7 | Due to hepatic insulin resistance that leads to an increase in triglycerides, free fatty acids and ketones |
| Ethanol | 7 | Due to increased shunting volumes through portocaval shunts |
| Isoprene | 6 | A by-product of cholesterol biosynthesis—the intestinal microbiota may generate isoprene too |
| Acetaldehyde | 6 | Oxidation product in ethanol metabolism—CYP2E1 is induced |
| 2-Pentanone | 5 | Due to hepatic insulin resistance—inhibition of CYP2E1 |
| Carbon-disulphide | 4 | The oxidative metabolism of carbon disulphide—also due to incomplete metabolism of sulphur-containing essential systems |
| 2-Butanone | 4 | Due to hepatic insulin resistance, formed during lipolysis—inhibition of CYP2E1 |
| Benzene | 4 | Environmental pollutant |
| Pentane | 3 | Lipid peroxidation—a by-product of the cytochrome P450 metabolism |
| Hydrogen-sulphide | 3 | Incomplete metabolism of sulphur-containing amino acids in the transamination pathway—cytochrome C oxidase deficiency (less stable than dimethyl-sulphide) |
| Ethane | 3 | Lipid peroxidation of polyunsaturated fatty acids—a by-product of the cytochrome P450 metabolism |
| Trimethyl-amine (TMA) | 3 | The intestinal microflora degrades dietary phosphatidylcholine to form trimethylamine—trimethylamine is metabolised by the hepatic flavin monooxygenase family of enzymes |
| 2-Nonene | 3 | It is yet to be discovered—it has been linked to oxidative stress |
| 2-Propanol | 2 | It is yet to be discovered—it is speculated to be related to inflammatory processes and/or lipid peroxidation |
| Indole | 2 | Derived from the catabolism tryptophan |
| Dimethyl-selenide | 2 | Excretion product of the essential micronutrient selenium |
| Methanol | 2 | Metabolised mainly by alcohol dehydrogenase—pectin degradation—an imbalance of microflora composition in cirrhotic patients |
| 2-Octanone | 2 | Due to hepatic insulin resistance, formed during lipolysis—inhibition of CYP2E1 |
| Octane | 2 | Metabolised by the cytochrome P450 enzymes |
| Alpha-pinene | 2 | Metabolised by the cytochrome P450 enzymes |
| Tridecane | 2 | It is yet to be discovered—it is speculated that it is related to inflammatory processes and/or lipid peroxidation |
| Styrene | 2 | Exogenous sources such as industrial materials—it is oxidised by cytochrome P450 |
| Author/Year | Study Design | Analytical Method | VOCs Identified as Significant | Discriminatory Performance |
|---|---|---|---|---|
| Friedman et al. 1994 | 24 cirrhotic CLD vs. 24 healthy | GC-MS | Hydrogen-sulphide ↑ Limonene ↑ | Not reported |
| Van den Velde et al. 2008 | 52 cirrhotic CLD vs. 50 healthy | GC-MS | Acetone ↑ Dimethyl-sulphide ↑ 2-butanone ↑ 2-pentanone ↑ Indole ↓ Dimethyl-selenide ↓ | 100% sensitivity 70% specificity |
| Dadamio et al. 2012 | 35 cirrhotic CLD vs. 49 healthy | GC-MS | Dimethyl-sulphide ↑ Acetone ↑ 2-butanone ↑ 2-pentanone ↑ Indole ↓ Phenol ↓ Dimethyl-selenide ↓ Isoprene ↑ Ethane ↑ Pentane ↑ | 83% sensitivity 100% specificity |
| Morisco et al. 2013 | 12 cirrhotic CLD vs. 14 healthy | PTR-MS | Heptadienol ↑ Methanol ↑ 2-butanone ↑ 3-pentone ↑ 2-octanone ↑ 2-nonanone ↑ Monoterpene ↑ P-cymene ↑ | 83% sensitivity 86% specificity |
| Del Rio et al. 2015 | 31 cirrhotic CLD vs. 30 healthy | PTR-MS | Methanol ↑ 2-butanone ↑ Carbon-sulphide ↑ 2-pentanone ↑ Limonene ↑ | 97% sensitivity 70% specificity |
| Pijls et al. 2016 | 34 cirrhotic CLD vs. 87 non-cirrhotic CLD | GC-MS | Dimethyl-sulphide ↑ Terpene (limonene) ↑ 2-methyl-butanal ↓ Propanoic acid ↑ Octane ↑ Terpenoid ↑ 3-carene ↑ 1-hexadecanol ↓ C16H34 ↓ | 83% sensitivity 87% specificity |
| De Vincentis et al. 2016 | 65 cirrhotic CLD vs. 39 non-cirrhotic CLD | E-nose | Not available | 86.2% sensitivity 98.2% specificity |
| Eng et al. 2015 | 49 cirrhotic CLD children vs. 55 healthy children | SIFT-MS | 1-decene ↑ 1-heptene ↑ 1-octene ↑ 3-methyl-hexane ↑ 1-nonene ↓ (E)-2-nonene ↓ Dimethyl-sulphide ↓ | 0.97 AUC |
| Author/Year | Study Design | Analytical Method | VOCs Identified as Significant | Discriminatory Performance |
|---|---|---|---|---|
| Alkhouri et al. 2015 | 20 advanced fibrosis vs. 41 mild fibrosis | SIFT-MS | Acetone ↓ Benzene ↓ Carbon disulphide ↓ Isoprene ↓ Pentane ↓ Ethane ↓ | 0.85 AUC (Isoprene model) |
| Khalid et al. 2013 | 11 alcoholic cirrhotic with HE vs. 23 alcoholic cirrhotic without HE | GC-MS | Methyl-vinyl ketone ↓ Isothiocyanato-cyclohexane ↑ | 90% sensitivity 87% specificity |
| 34 alcoholic cirrhotic vs. 13 non-alcoholic cirrhotic | Undecane ↑ Unknown ↓ | 78.3% sensitivity 69.2% specificity | ||
| 34 alcoholic cirrhotic vs. 7 harmful drinkers | 1-methyl-4-(1-methyl-ethenyl)-benzene ↑ Unknown ↓ Unknown ↓ | 88% sensitivity 85% specificity | ||
| 7 harmful drinkers vs. 15 healthy | Octanal 2,6-dimethyl-7-octen-2-ol Unknown | 71% sensitivity 93% specificity | ||
| 13 non-alcoholic cirrhotic vs. 15 healthy | Methyl-vinyl ketone 1-methyl-2-(1-methyl-ethyl)-benzene (o-cymene) Unknown | 92% sensitivity 100% specificity | ||
| 34 alcoholic cirrhotic vs. 15 healthy | Heptane 1-methyl-2-(1-methyl-ethyl)-benzene Phellandrene 2-methyl-hexane | 97% sensitivity 93% specificity | ||
| O’Hara et al. 2016 | 11 cirrhotic HE vs. 11 cirrhotic without HE vs. 7 history of HE vs. 30 healthy | PTR-MS | Limonene ↑ | Not reported |
| 10 without HCC vs. 21 HCC vs. 30 healthy | Limonene ↑ | Not reported | ||
| Qin et al. 2010 | 30 HCC vs. 36 healthy | GC-MS-SPME | 3-hydroxy-2-butanone ↑ Styrene ↑ Decane ↑ | 83.3% sensitivity 91.7% specificity |
| 30 HCC vs. 27 cirrhotic without HCC | 3-hydroxy-2-butanone ↑ Styrene ↑ | 70% sensitivity 70.4% specificity | ||
| Ferrandino et al. 2020 | 32 cirrhotic without HCC vs. 12 cirrhotic with HCC vs. 40 healthy controls | GC-MS | Limonene ↑ | 73% sensitivity 77% specificity |
| Miller-Atkins et al. 2020 † only the three most significant metabolite associations for each disease comparison are shown in the column of significant compounds | 112 non-cirrhotic HCC vs. 54 healthy | SIFT-MS | (E)-2-nonene ↑ Ethane ↑ Benzene ↑ Hydrogen sulphide ↓ | Healthy vs. all the rest 76% sensitivity 97% specificity |
| 30 cirrhotic without HCC vs. 54 healthy | Trimethyl-amine ↓ Propanol ↓ | Cirrhotic vs. all the rest 40% sensitivity 96% specificity | ||
| 49 PH vs. 54 healthy | (E)-2-nonene ↑ Acetaldehyde ↑ Ethane ↑ Hydrogen sulphide ↓ | HCC vs. all the rest 73% sensitivity 71% specificity | ||
| 51 CRLM vs. 54 healthy | (E)-2-nonene ↑ Acetaldehyde ↑ Triethyl-amine ↑ Acetone ↓ | CRLM vs. all the rest 51% sensitivity 94% specificity | ||
| 112 non-cirrhotic HCC vs. 30 cirrhotic | Acetone ↓ Acetaldehyde ↓ Dimethyl-sulphide ↓ Ethanol ↑ | PH vs. all the rest 58% sensitivity 93% specificity | ||
| Arasaradnam et al. 2016 | 22 non-cirrhotic HE vs. 20 healthy | E-nose | Not available | 88% sensitivity 68% specificity |
| 13 covert non-cirrhotic HE vs. 9 overt non-cirrhotic HE | Not available | 79% sensitivity 50% specificity | ||
| Solga et al. 2008 | 16 moderate to severe steatosis vs. 11 less steatosis | GC | Ethanol ↑ Acetone ↑ | Not reported |
| 24 NASH vs. 24 without NASH | Acetone ↑ | Not reported | ||
| Verdam et al. 2013 | 39 NASH vs. 26 without NASH | GC-MS | n-tridecane ↑ 3-methyl-butanonitrile ↑ 1-propanol ↑ | 90% sensitivity 69% specificity |
| Alkhouri et al. 2013 | 37 obese NAFLD vs. 23 obese without NAFLD | SIFT-MS | Isoprene ↑ Acetone ↑ Trimethylamine ↑ Acetaldehyde ↑ Pentane ↑ | 0.76 AUC |
| Millonig et al. 2010 | 37 cirrhotic vs. 35 healthy | IMR-MS | Ethanol ↑ | 0.88 AUC |
| 91 liver diseased vs. healthy | Acetaldehyde ↑ Ethanol ↑ Isoprene ↑ | 0.94 AUC | ||
| 34 NAFLD vs. healthy controls | Acetaldehyde ↑ | 0.96 AUC | ||
| 20 AFLD vs. 35 healthy | Acetaldehyde ↑ Isoprene ↑ | 0.97 AUC | ||
| 20 AFLD vs. 34 NAFLD | Isoprene ↑ | 0.95 AUC | ||
| Letteron et al. 1993 | 89 alcohol abusers vs. 52 liver diseased vs. 42 healthy | GC-FID | Ethane ↑ | Not reported |
| Hanouneh et al. 2014 | 80 liver diseased vs. 43 healthy | SIFT-MS | 2-propanol ↑ Acetaldehyde ↑ Acetone ↑ Ethanol ↑ Pentane ↑ Trimethylamine ↑ | Not reported |
| 40 cirrhotic AH vs. 40 cirrhotic AD | Acetaldehyde ↑ Acetone ↑ Pentane ↑ Trimethylamine ↑ | 97% sensitivity 72% specificity (Acetone-pentane-trimethylamine) |
Publisher’s Note: MDPI stays neutral with regard to jurisdictional claims in published maps and institutional affiliations. |
© 2021 by the authors. Licensee MDPI, Basel, Switzerland. This article is an open access article distributed under the terms and conditions of the Creative Commons Attribution (CC BY) license (https://creativecommons.org/licenses/by/4.0/).
Share and Cite
Stavropoulos, G.; van Munster, K.; Ferrandino, G.; Sauca, M.; Ponsioen, C.; van Schooten, F.-J.; Smolinska, A. Liver Impairment—The Potential Application of Volatile Organic Compounds in Hepatology. Metabolites 2021, 11, 618. https://doi.org/10.3390/metabo11090618
Stavropoulos G, van Munster K, Ferrandino G, Sauca M, Ponsioen C, van Schooten F-J, Smolinska A. Liver Impairment—The Potential Application of Volatile Organic Compounds in Hepatology. Metabolites. 2021; 11(9):618. https://doi.org/10.3390/metabo11090618
Chicago/Turabian StyleStavropoulos, Georgios, Kim van Munster, Giuseppe Ferrandino, Marius Sauca, Cyriel Ponsioen, Frederik-Jan van Schooten, and Agnieszka Smolinska. 2021. "Liver Impairment—The Potential Application of Volatile Organic Compounds in Hepatology" Metabolites 11, no. 9: 618. https://doi.org/10.3390/metabo11090618
APA StyleStavropoulos, G., van Munster, K., Ferrandino, G., Sauca, M., Ponsioen, C., van Schooten, F.-J., & Smolinska, A. (2021). Liver Impairment—The Potential Application of Volatile Organic Compounds in Hepatology. Metabolites, 11(9), 618. https://doi.org/10.3390/metabo11090618