
Simultaneous Quantification of Trace and Micro Phenolic Compounds by Liquid Chromatography Tandem-Mass Spectrometry


Abstract
1. Introduction
2. Results and Discussion
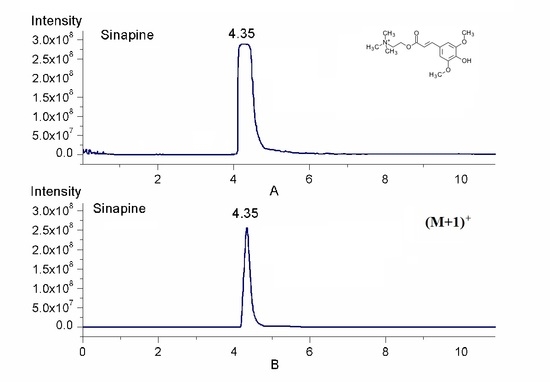
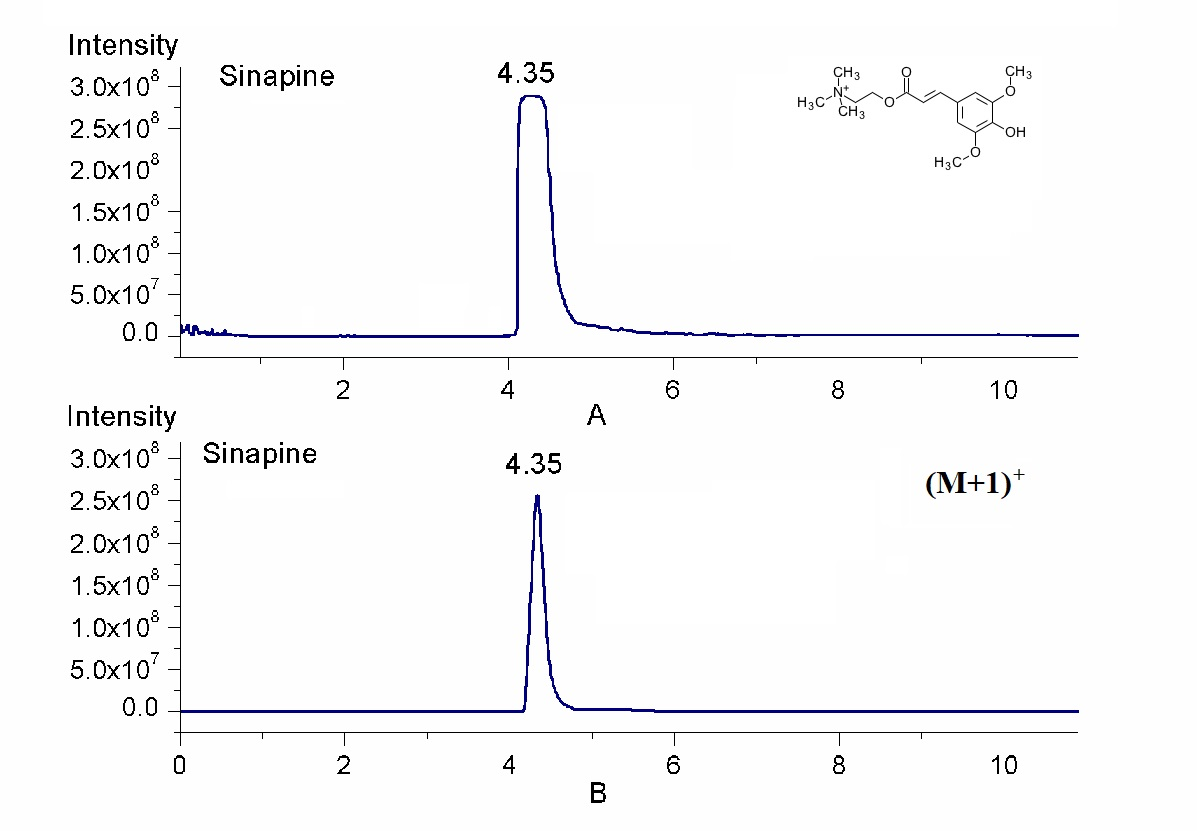
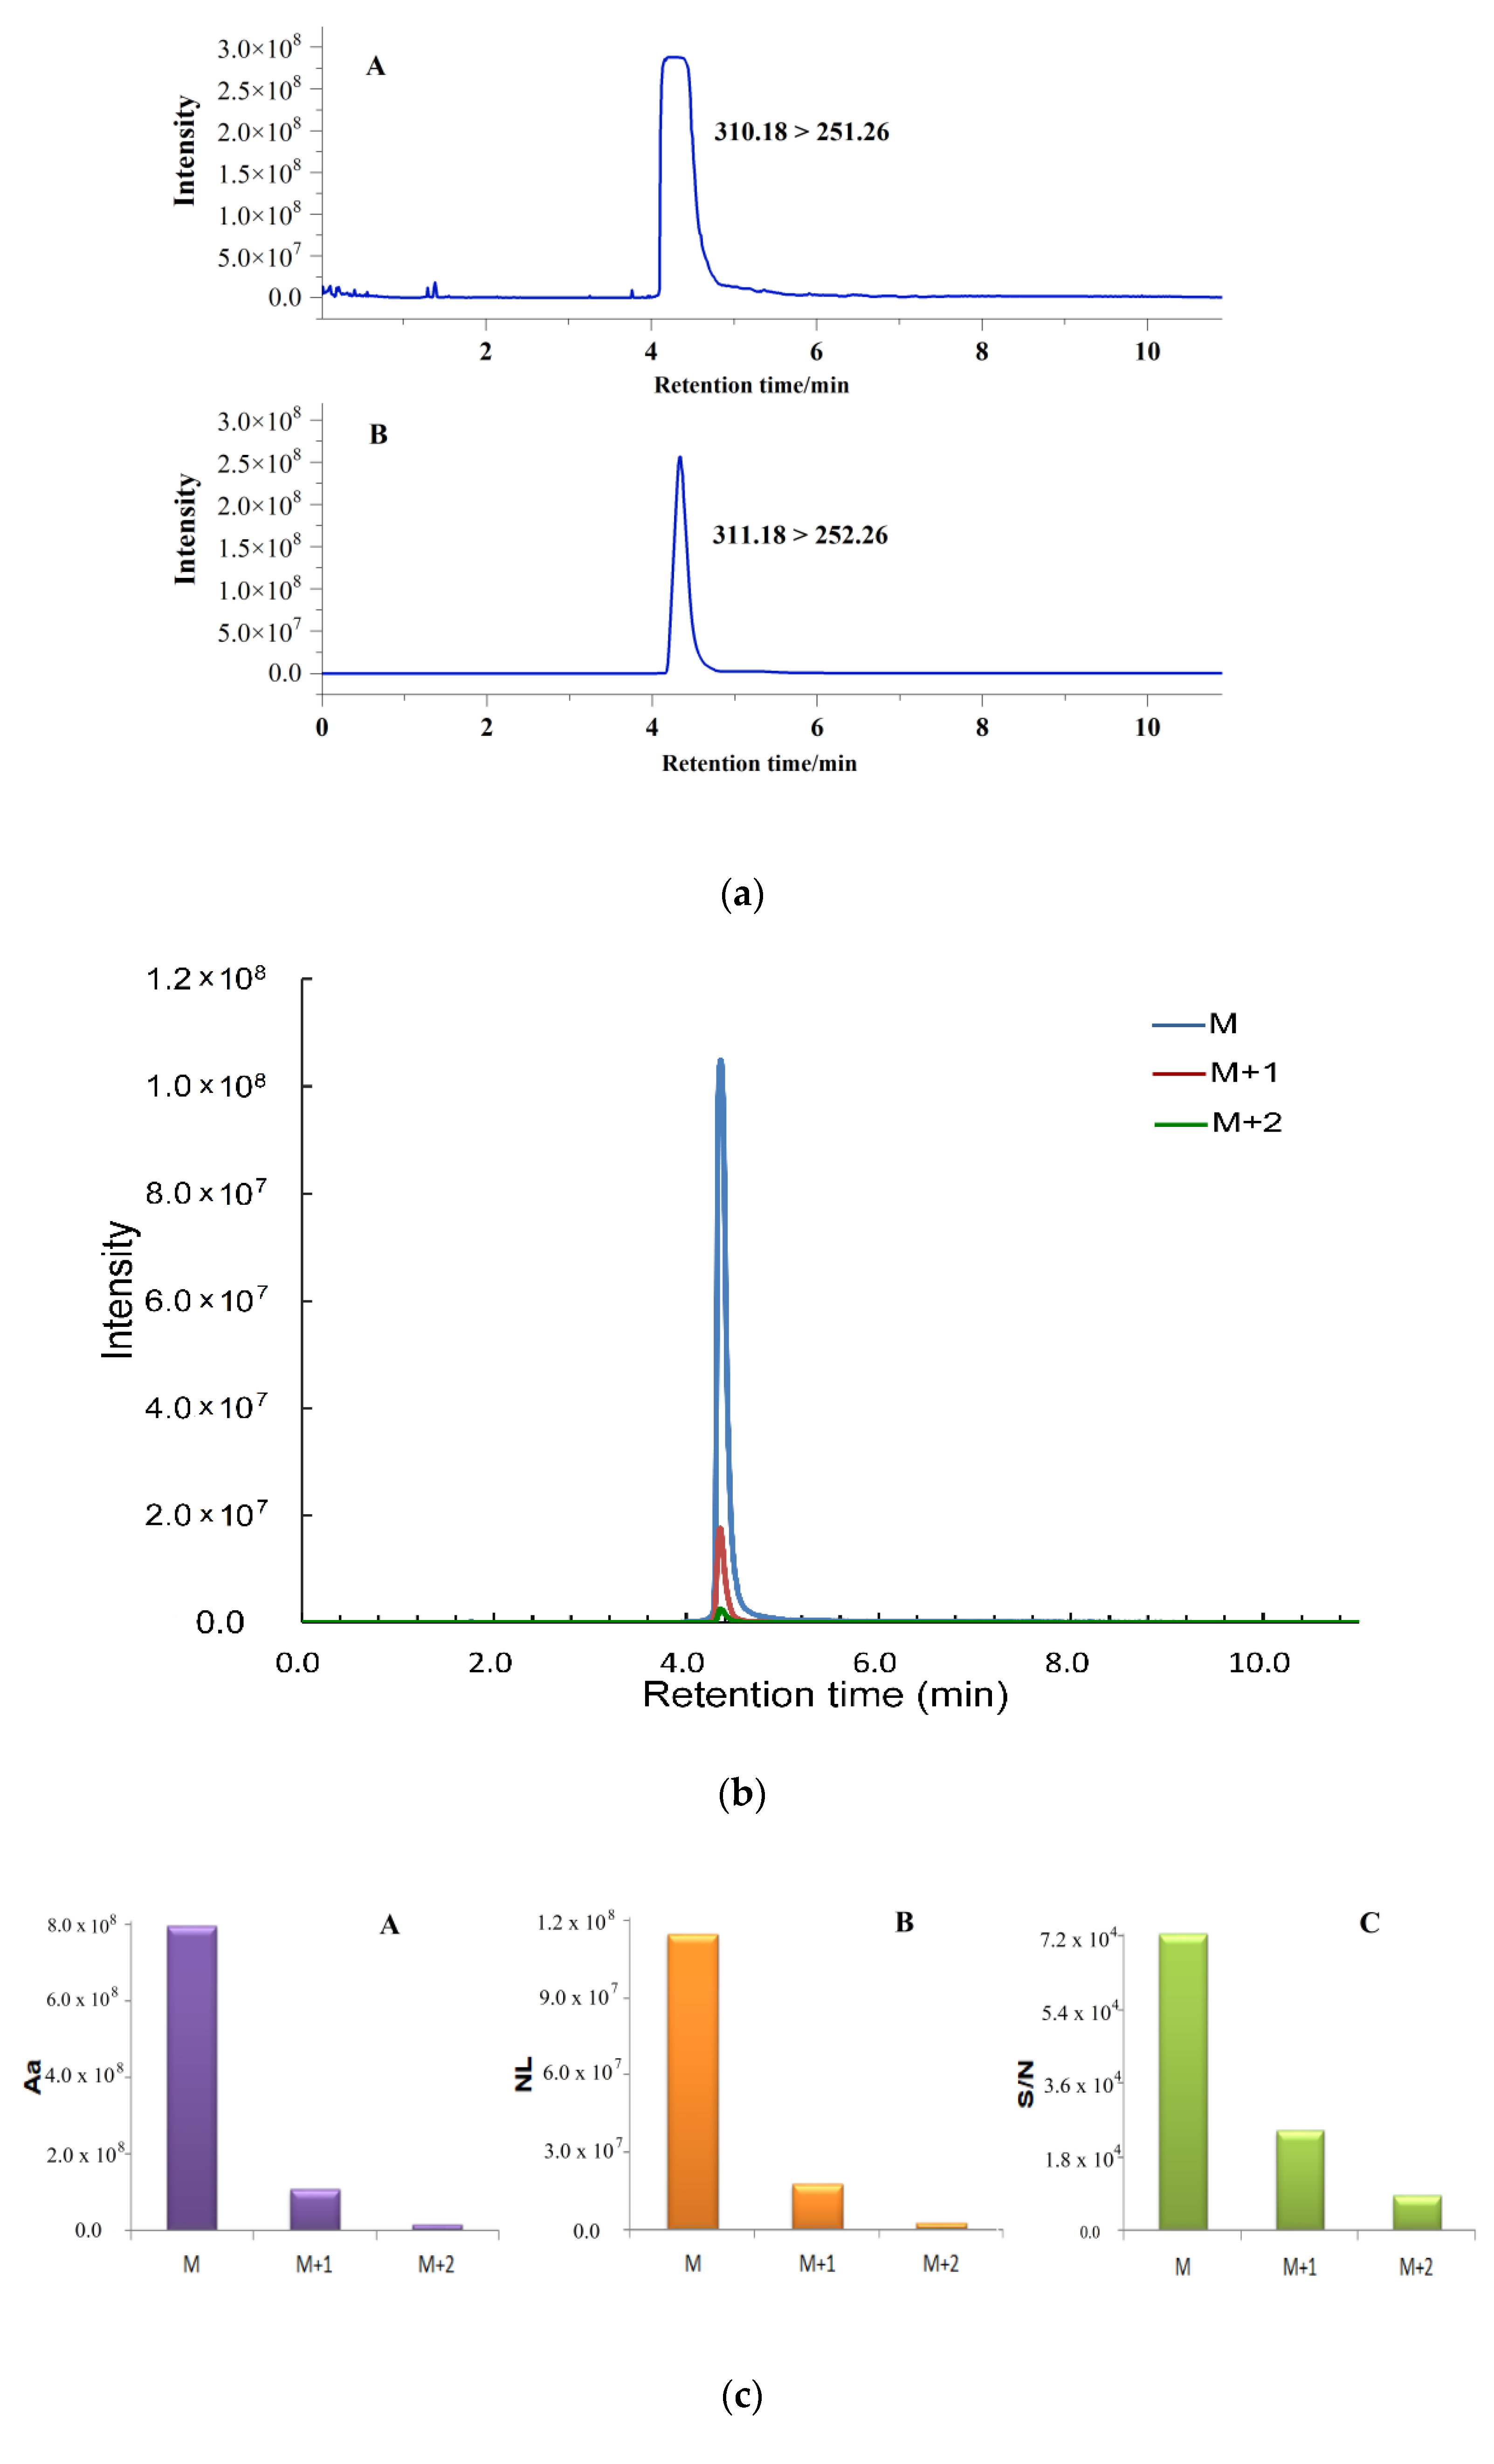
2.1. Quantification by Isotopic Ion to Overcome Signal Saturation
2.2. Simultaneous Quantification by Isotope Ion and Product Ions
2.3. Method Validation
2.3.1. Linear Range, Limit of Detection, and Limit of Quantitation
2.3.2. Precision, Recovery, and Matrix Effect
3. Method Application
4. Methods
4.1. Chemicals and Materials
4.2. Preparation of Standard Solution
4.3. Sample Preparation
4.4. LC-MS/MS Analysis
4.5. Data Processing and Analysis
5. Conclusions
Supplementary Materials
Author Contributions
Funding
Institutional Review Board Statement
Informed Consent Statement
Data Availability Statement
Conflicts of Interest
References
- Ramchoun, M.; Harnafi, H.; Alem, C.; Büchele, B. Hypolipidemic and antioxidant effect of polyphenol-rich extracts from Moroccan thyme varieties. e-SPEN J. 2012, 7, e119–e124. [Google Scholar] [CrossRef]
- Trox, J.; Vadivel, V.; Vetter, W.; Stuetz, W.; Scherbaum, V.; Gola, U.; Nohr, D.; Biesalski, H.K. Bioactive Compounds in Cashew Nut (Anacardium occidentale L.) Kernels: Effect of Different Shelling Methods. J. Agric. Food Chem. 2010, 58, 5341–5346. [Google Scholar] [CrossRef] [PubMed]
- Natale, A.; Nardiello, D.; Palermo, C.; Muscarella, M.; Quinto, M.; Centonze, D. Development of an analytical method for the determination of polyphenolic compounds in vegetable origin samples by liquid chromatography and pulsed amperometric detection at a glassy carbon electrode. J. Chromatogr. A 2015, 1420, 66–73. [Google Scholar] [CrossRef]
- Koski, A.; Psomiadou, E.; Tsimidou, M.; Hopia, A.; Kefalas, P.; Wahala, K.; Heinonen, M. Oxidative stability and minor constituents of virgin olive oil and cold-pressed rapeseed oil. Eur. Food Res. Technol. 2002, 214, 294–298. [Google Scholar] [CrossRef]
- Usenik, V.; Fajt, N.; Mikulic-Petkovsek, M.; Slatnar, A.; Stampar, F.; Veberic, R. Sweet Cherry Pomological and Biochemical Characteristics Influenced by Rootstock. J. Agric. Food Chem. 2010, 58, 4928–4933. [Google Scholar] [CrossRef]
- Temple, N.J. Antioxidants and disease: More questions than answers. Nutr. Res. 2000, 20, 449–459. [Google Scholar] [CrossRef]
- Kylli, P.; Nohynek, L.; Puupponen-Pimia, R.; Westerlund-Wikstrom, B.; McDougall, G.; Stewart, D.; Heinonen, M. Rowanberry phenolics: Compositional analysis and bioactivities. J. Agric. Food Chem. 2010, 58, 11985–11992. [Google Scholar] [CrossRef] [PubMed]
- Chagas, V.T.; Coelho, R.M.R.S.; Gaspar, R.S.; da Silva, S.A.; Mastrogiovanni, M.; Mendonça, C.D.J.; Ribeiro, M.N.D.S.; Paes, A.M.D.A.; Trostchansky, A. Protective Effects of a Polyphenol-Rich Extract from Syzygium cumini (L.) Skeels Leaf on Oxidative Stress-Induced Diabetic Rats. Oxid. Med. Cell. Longev. 2018, 2018, 1–13. [Google Scholar] [CrossRef] [PubMed]
- Lucci, P.; Saurina, J.; Núñez, O. Trends in LC-MS and LC-HRMS analysis and characterization of polyphenols in food. TrAC-Trend Anal Chem. 2017, 88, 1–24. [Google Scholar] [CrossRef]
- Jovanović, A.A.; Đorđević, V.B.; Zdunić, G.M.; Pljevljakušić, D.S.; Šavikin, K.P.; Gođevac, D.M.; Bugarski, B.M. Optimization of the extraction process of polyphenols from Thymus serpyllum L. herb using maceration, heat- and ultrasound-assisted techniques. Sep. Purif. Technol. 2017, 179, 369–380. [Google Scholar] [CrossRef]
- Samoticha, J.; Wojdylo, A.; Golis, T. Phenolic composition, physicochemical properties and antioxidant activity of interspecific hybrids of grapes growing in Poland. Food Chem. 2017, 215, 263–273. [Google Scholar] [CrossRef]
- Yasir, M.; Sultana, B.; Nigam, P.S.; Owusu-Apenten, R. Antioxidant and genoprotective activity of selected cucurbitaceae seed extracts and LC-ESIMS/MS identification of phenolic components. Food Chem. 2016, 199, 307–313. [Google Scholar] [CrossRef]
- Seiquer, I.; Rueda, A.; Olalla, M.; Cabrera-Vique, C. Assessing the bioavailability of polyphenols and antioxidant properties of extra virgin argan oil by simulated digestion and Caco-2 cell assays. Comparative study with extra virgin olive oil. Food Chem. 2015, 188, 496–503. [Google Scholar] [CrossRef] [PubMed]
- Yang, R.N.; Zhang, L.X.; Li, P.W.; Yu, L.; Mao, J.; Wang, X.P.; Zhang, Q. A review of chemical composition and nutritional properties of minor vegetable oils in China. Trend Food Sci. Technol. 2018, 74, 26–32. [Google Scholar] [CrossRef]
- Wu, Y.; Zhou, Q.; Chen, X.Y.; Li, X.; Wang, Y.; Zhang, J.L. Comparison and screening of bioactive phenolic compounds in different blueberry cultivars: Evaluation of anti-oxidation and alpha-glucosidase inhibition effect. Food Res. Int. 2017, 100, 312–324. [Google Scholar] [CrossRef]
- Costa, C.; Tsatsakis, A.; Mamoμlakis, C.; Teodoro, M.; Briguglio, G.; Caruso, E.; Tsoukalas, D.; Margina, D.; Dardiotis, E.; Kouretas, D.; et al. Current evidence on the effect of dietary polyphenols intake on chronic diseases. Food Chem. Toxicol. 2017, 110, 286–299. [Google Scholar] [CrossRef] [PubMed]
- Yang, M.; Huang, F.H.; Liu, C.S.; Zheng, C.; Zhou, Q.; Wang, H. Influence of microwave treatment of rapeseed on minor components content and oxidative stability of oil. Food Bioprocess. Tech. 2013, 6, 3206–3216. [Google Scholar] [CrossRef]
- Zacchi, P.; Rudolf, E. High-temperature preconditioning of rapeseed: A polyphenol-enriched oil and the effect of refining. Eur. J. Lipid Sci. Tech. 2008, 110, 111–119. [Google Scholar] [CrossRef]
- Laguna, O.; Barakat, A.; Alhamada, H.; Durand, E.; Baréa, B.; Fine, F.; Villeneuve, M.C.; Dauguet, S.; Lecomte, J. Production of proteins and phenolic compounds enriched fractions from rapeseed and sunflower meals by dry fractionation processes. Ind. Crop. Prod. 2018, 118, 160–172. [Google Scholar] [CrossRef]
- Yang, R.N.; Xue, L.; Zhang, L.X.; Wang, X.F.; Qi, X.; Jiang, J.; Yu, L.; Wang, X.P.; Zhang, W.; Zhang, Q.; et al. Phytosterol Contents of Edible Oils and Their Contributions to Estimated Phytosterol Intake in the Chinese Diet. Foods 2019, 8, 334. [Google Scholar] [CrossRef]
- Szydłowska-Czerniak, A.; Bartkowiak-Broda, I.; Karlovic, I.; Karlovits, G.; Szłyk, E. Antioxidant capacity, total phenolics, glucosinolates and colour parameters of rapeseed cultivars. Food Chem. 2011, 127, 556–563. [Google Scholar] [CrossRef]
- Jackson, B.; Taylor, V.; Baker, R.A.; Miller, E. Low-Level Mercury Speciation in Freshwaters by Isotope Dilution GC-ICP-MS. Environ. Sci. Technol. 2009, 43, 2463–2469. [Google Scholar] [CrossRef]
- Zhang, Y.Q.; Lai, C.J.; Su, R.; Zhang, M.; Xiong, Y.; Qing, H.; Deng, Y.L. Quantification of Cry1Ab in genetically modified maize leaves by liquid chromatography multiple reaction monitoring tandem mass spectrometry using 18O stable isotope dilution. Analyst 2012, 137, 2699–2705. [Google Scholar] [CrossRef]
- Phukphatthanachai, P.; Panne, U.; Jakubowski, N.; Vogl, J. SI-traceable quantification of sulphur in copper metal and its alloys by ICP-IDMS. J. Anal. At. Spectrom. 2018, 1, 90–101. [Google Scholar] [CrossRef]
- Heumann, K.G. Isotope dilution mass spectrometry. Int. J. Mass Spectrom. Ion Proc. 1992, 118–119, 575–592. [Google Scholar] [CrossRef]
- Humston, E.M.; Hoggard, J.C.; Synovec, R.E. Utilizing the Third Order Advantage with Isotope Dilution Mass Spectrometry. Anal. Chem. 2010, 82, 41–43. [Google Scholar] [CrossRef] [PubMed]
- Toews, C.; Kern, J.; Kingston, H.M.; Rahman, M. Sensitivity analysis for speciated isotope dilution mass spectrometry. J. Anal. Atom. Spectrom. 2010, 25, 196–200. [Google Scholar] [CrossRef]
- Huertas-Perez, J.F.; Sejeroe-Olsen, B.; Gokcen, T.; Sandor, F.; Schimmel, H.; Dabrio, M. Gas chromatography-isotope dilution mass spectrometry method validation for target pesticides in soybeans. Food Addit. Contam. A. 2019, 36, 96–108. [Google Scholar] [CrossRef]
- Yu, Y.X.; You, J.M.; Sun, Z.W.; Li, G.L.; Ji, Z.Y.; Zhang, S.J.; Zhou, X.X. Determination of residual organophosphorus thioester pesticides in agricultural products by chemical isotope-labelling liquid chromatography-tandem mass spectrometry coupled with in-syringe dispersive solid phase clean-up and in situ cleavage. Anal. Chim. Acta 2019, 1055, 44–55. [Google Scholar] [CrossRef] [PubMed]
- Torrento, C.; Bakkour, R.; Glauser, G.; Melsbach, A.; Ponsin, V.; Hofstetter, T.B.; Elsner, M.; Hunkeler, D. Solid-phase extraction method for stable isotope analysis of pesticides from large volume environmental water samples. Analyst 2019, 144, 2898–2908. [Google Scholar] [CrossRef] [PubMed]
- Zhou, P.; Lin, Q.; Huang, H.X.; Yang, W.H.; Dai, M.; Liu, F.; Wang, Y. Determination of 24 Kinds of Banned Veterinary Drugs in Feed by Ultra High Performance Liquid Chromatography-Tandem Mass Spectrometry with Stable Isotope-labelled Internal Standards. Chin. J. Anal. Chem. 2014, 42, 233–238. [Google Scholar]
- Gotthardt, M.; Asam, S.; Gunkel, K.; Moghaddam, A.F.; Baumann, E.; Kietzi, R.; Rychlik, M. Quantitation of Six Alternaria Toxins in Infant Foods Applying Stable Isotope Labeled Standards. Front. Microbiol. 2019, 10, 109. [Google Scholar] [CrossRef] [PubMed]
- Beach, D.G.; Hollingdale, C.; Quilliam, M.A. Isotope-labelling derivatisation: A broadly applicable approach to quantitation of algal toxins by isotope dilution LC-MS/MS. Anal. Methods-UK 2016, 8, 2872–2879. [Google Scholar] [CrossRef]
- Habler, K.; Gotthardt, M.; Schuler, J.; Rychlik, M. Multi-mycotoxin stable isotope dilution LC-MS/MS method for Fusarium toxins in beer. Food Chem. 2017, 218, 447–454. [Google Scholar] [CrossRef]
- Habler, K.; Rychlik, M. Multi-mycotoxin stable isotope dilution LC-MS/MS method for Fusarium toxins in cereals. Anal. Bioanal. Chem. 2016, 408, 307–317. [Google Scholar] [CrossRef]
- Wada, A.; Nonose, N.; Ohata, M.; Miura, T. Determination of ultra-trace sulfur in high-purity metals by isotope dilution inductively coupled plasma sector field mass spectrometry combined with chemical separation procedure. Talanta 2018, 189, 289–295. [Google Scholar] [CrossRef] [PubMed]
- Davidsson, L.; Haskell, M. Bioavailability of micronutrients: Stable isotope techniques to develop effective food-based strategies to combat micronutrient deficiencies. Food Nutr. Bull. 2011, 32, S24–S30. [Google Scholar] [CrossRef]
- Santamaria-Fernandez, R.; Evans, P.; Wolff-Briche, C.S.J.; Hearn, R. A high accuracy primary ratio method for the determination of iodine in complex matrices by double isotope dilution using MC-ICPMS and I-129 spike. J. Anal. Atom. Spectrom. 2006, 21, 413–421. [Google Scholar] [CrossRef]
- Diniz, M.; Dias, N.; Andrade, F.; Paulo, B.; Ferreira, A. Isotope dilution method for determination of vitamin B2 in human plasma using liquid chromatography-tandem mass spectrometry. J. Chromatogr. B 2019, 1113, 14–19. [Google Scholar] [CrossRef]
- Yu, S.L.; Yin, Y.C.; Wang, D.C.; Xie, S.W.; Cheng, Q.; Cheng, X.Q.; Qiu, L. Development and validation of a simple isotope dilution-liquid chromatography-tandem mass spectrometry method for detecting vitamins A and E in serum and amniotic fluid. Int. J. Mass Spectrom. 2019, 435, 118–123. [Google Scholar] [CrossRef]
- Hewavitharana, A.K.; Abu Kassim, N.S.; Shaw, P.N. Standard addition with internal standardisation as an alternative to using stable isotope labelled internal standards to correct for matrix effects-Comparison and validation using liquid chromatography-tandem mass spectrometric assay of vitamin D. J. Chromatogr. A 2018, 1553, 101–107. [Google Scholar] [CrossRef]
- Zhou, R.K.; Li, L. Effects of sample injection amount and time-of-flight mass spectrometric detection dynamic range on metabolome analysis by high-performance chemical isotope labeling LC-MS. J. Proteom. 2015, 118, 130–139. [Google Scholar] [CrossRef]
- Chambers, E.; Wagrowski-Diehl, D.M.; Lu, Z.L.; Mazzeo, J.R. Systematic and comprehensive strategy for reducing matrix effects in LC/MS/MS analyses. J. Chromatogr. B 2007, 852, 22–34. [Google Scholar] [CrossRef]
- Wu, R.; Ma, F.; Zhang, L.X.; Li, P.W.; Li, G.M.; Zhang, Q.; Zhang, W.; Wang, X.P. Simultaneous determination of phenolic compounds in sesame oil using LC-MS/MS combined with magnetic carboxylated multi-walled carbon nanotubes. Food Chem. 2016, 204, 334–342. [Google Scholar] [CrossRef] [PubMed]
- Naczk, M.; Wanasundara, P.K.J.P.D.; Shahidi, F. Facile spectrophotometric quantification method of sinapic acid in hexane-extracted and methanol-ammonia-water-treated mustard and rapeseed meals. J. Agric. Food Chem. 1992, 40, 444–448. [Google Scholar] [CrossRef]
- Milkowski, C.; Baumert, A.; Schmidt, D.; Nehlin, L.; Strack, D. Molecular regulation of sinapate ester metabolism in Brassica napus: Expression of genes, properties of the encoded proteins and correlation of enzyme activities with metabolite accumulation. Plant J. 2004, 38, 80–92. [Google Scholar] [CrossRef] [PubMed]
- Khattab, R.; Eskin, M.; Aliani, M.; Thiyam, U. Determination of sinapic acid derivatives in canola extracts using high-performance liquid chromatography. J. Am. Oil Chem. Soc. 2010, 87, 147–155. [Google Scholar] [CrossRef] [PubMed]
- Zhou, H.; Huang, Y.X.; Hoshi, T.; Kashiwagi, Y.; Anzai, J.; Li, G.X. Electrochemistry of sinapine and its detection in medicinal plants. Anal. Bioanal. Chem. 2005, 382, 1196–1201. [Google Scholar] [CrossRef]
- Liu, Q.; Wu, L.; Pu, H.M.; Li, C.Y.; Hu, Q.H. Profile and distribution of soluble and insoluble phenolics in Chinese rapeseed (Brassica napus). Food Chem. 2012, 135, 616–622. [Google Scholar] [CrossRef]
- Koski, A.; Pekkarinen, S.; Hopia, A.; Wahala, K.; Heinonen, M. Processing of rapeseed oil: Effects on sinapic acid derivative content and oxidative stability. Eur. Food Res. Technol. 2003, 217, 110–114. [Google Scholar] [CrossRef]
- Li, J.B.; Guo, Z. Concurrent extraction and transformation of bioactive phenolic compounds from rapeseed meal using pressurized solvent extraction system. Ind. Crop. Prod. 2016, 94, 152–159. [Google Scholar] [CrossRef]


| Analytes | Linear Range (μg/kg) | Regression Equation | R2 Value | LOD/(μg/kg) | LOQ/(μg/kg) |
|---|---|---|---|---|---|
| l-Phenylalanine | 0.5–800 | y = 91,196.0x + 147,656.0 | 0.9995 | 0.05 | 0.16 |
| trans-Cinnamic Acid | 0.1–500 | y = 1854.1x − 1514.7 | 0.9996 | 0.01 | 0.04 |
| p-Coumaric Acid | 0.1–500 | y = 8764.9x + 11,452.1 | 0.9995 | 0.03 | 0.11 |
| Caffeic Acid | 0.1–800 | y = 3485.9x − 2347.2 | 0.9997 | 0.08 | 0.25 |
| Ferulic Acid | 0.1–800 | y = 5993.3x + 21,684.8 | 0.9996 | 0.01 | 0.03 |
| Coniferyl Aldehyde | 0.1–400 | y = 24,408.9x + 95,830.1 | 0.9986 | 0.02 | 0.06 |
| Coniferyl Alcohol | 0.5–500 | y = 100.9x − 451.2 | 0.9991 | 0.09 | 0.31 |
| 5-Hydroxyferulic Acid | 0.5–600 | y = 3088.2x − 15,869.9 | 0.9986 | 0.13 | 0.42 |
| Sinapic Acid | 0.1–800 | y = 5299.4x − 3167.6 | 0.9996 | 0.01 | 0.04 |
| Sinapoyl Aldehyde | 0.1–400 | y = 33,627.5x + 33,970.9 | 0.9987 | 0.02 | 0.06 |
| Sinapoyl Alcohol | 0.5–800 | y = 64.1x − 954.8 | 0.9973 | 0.15 | 0.49 |
| Syringin | 0.1–500 | y = 16,670.9x + 40,916.1 | 0.9994 | 0.02 | 0.07 |
| Sinapine | 100–12,000 | y = 12,734.2x + 12,326.0 | 0.9970 | 9.84 | 32.80 |
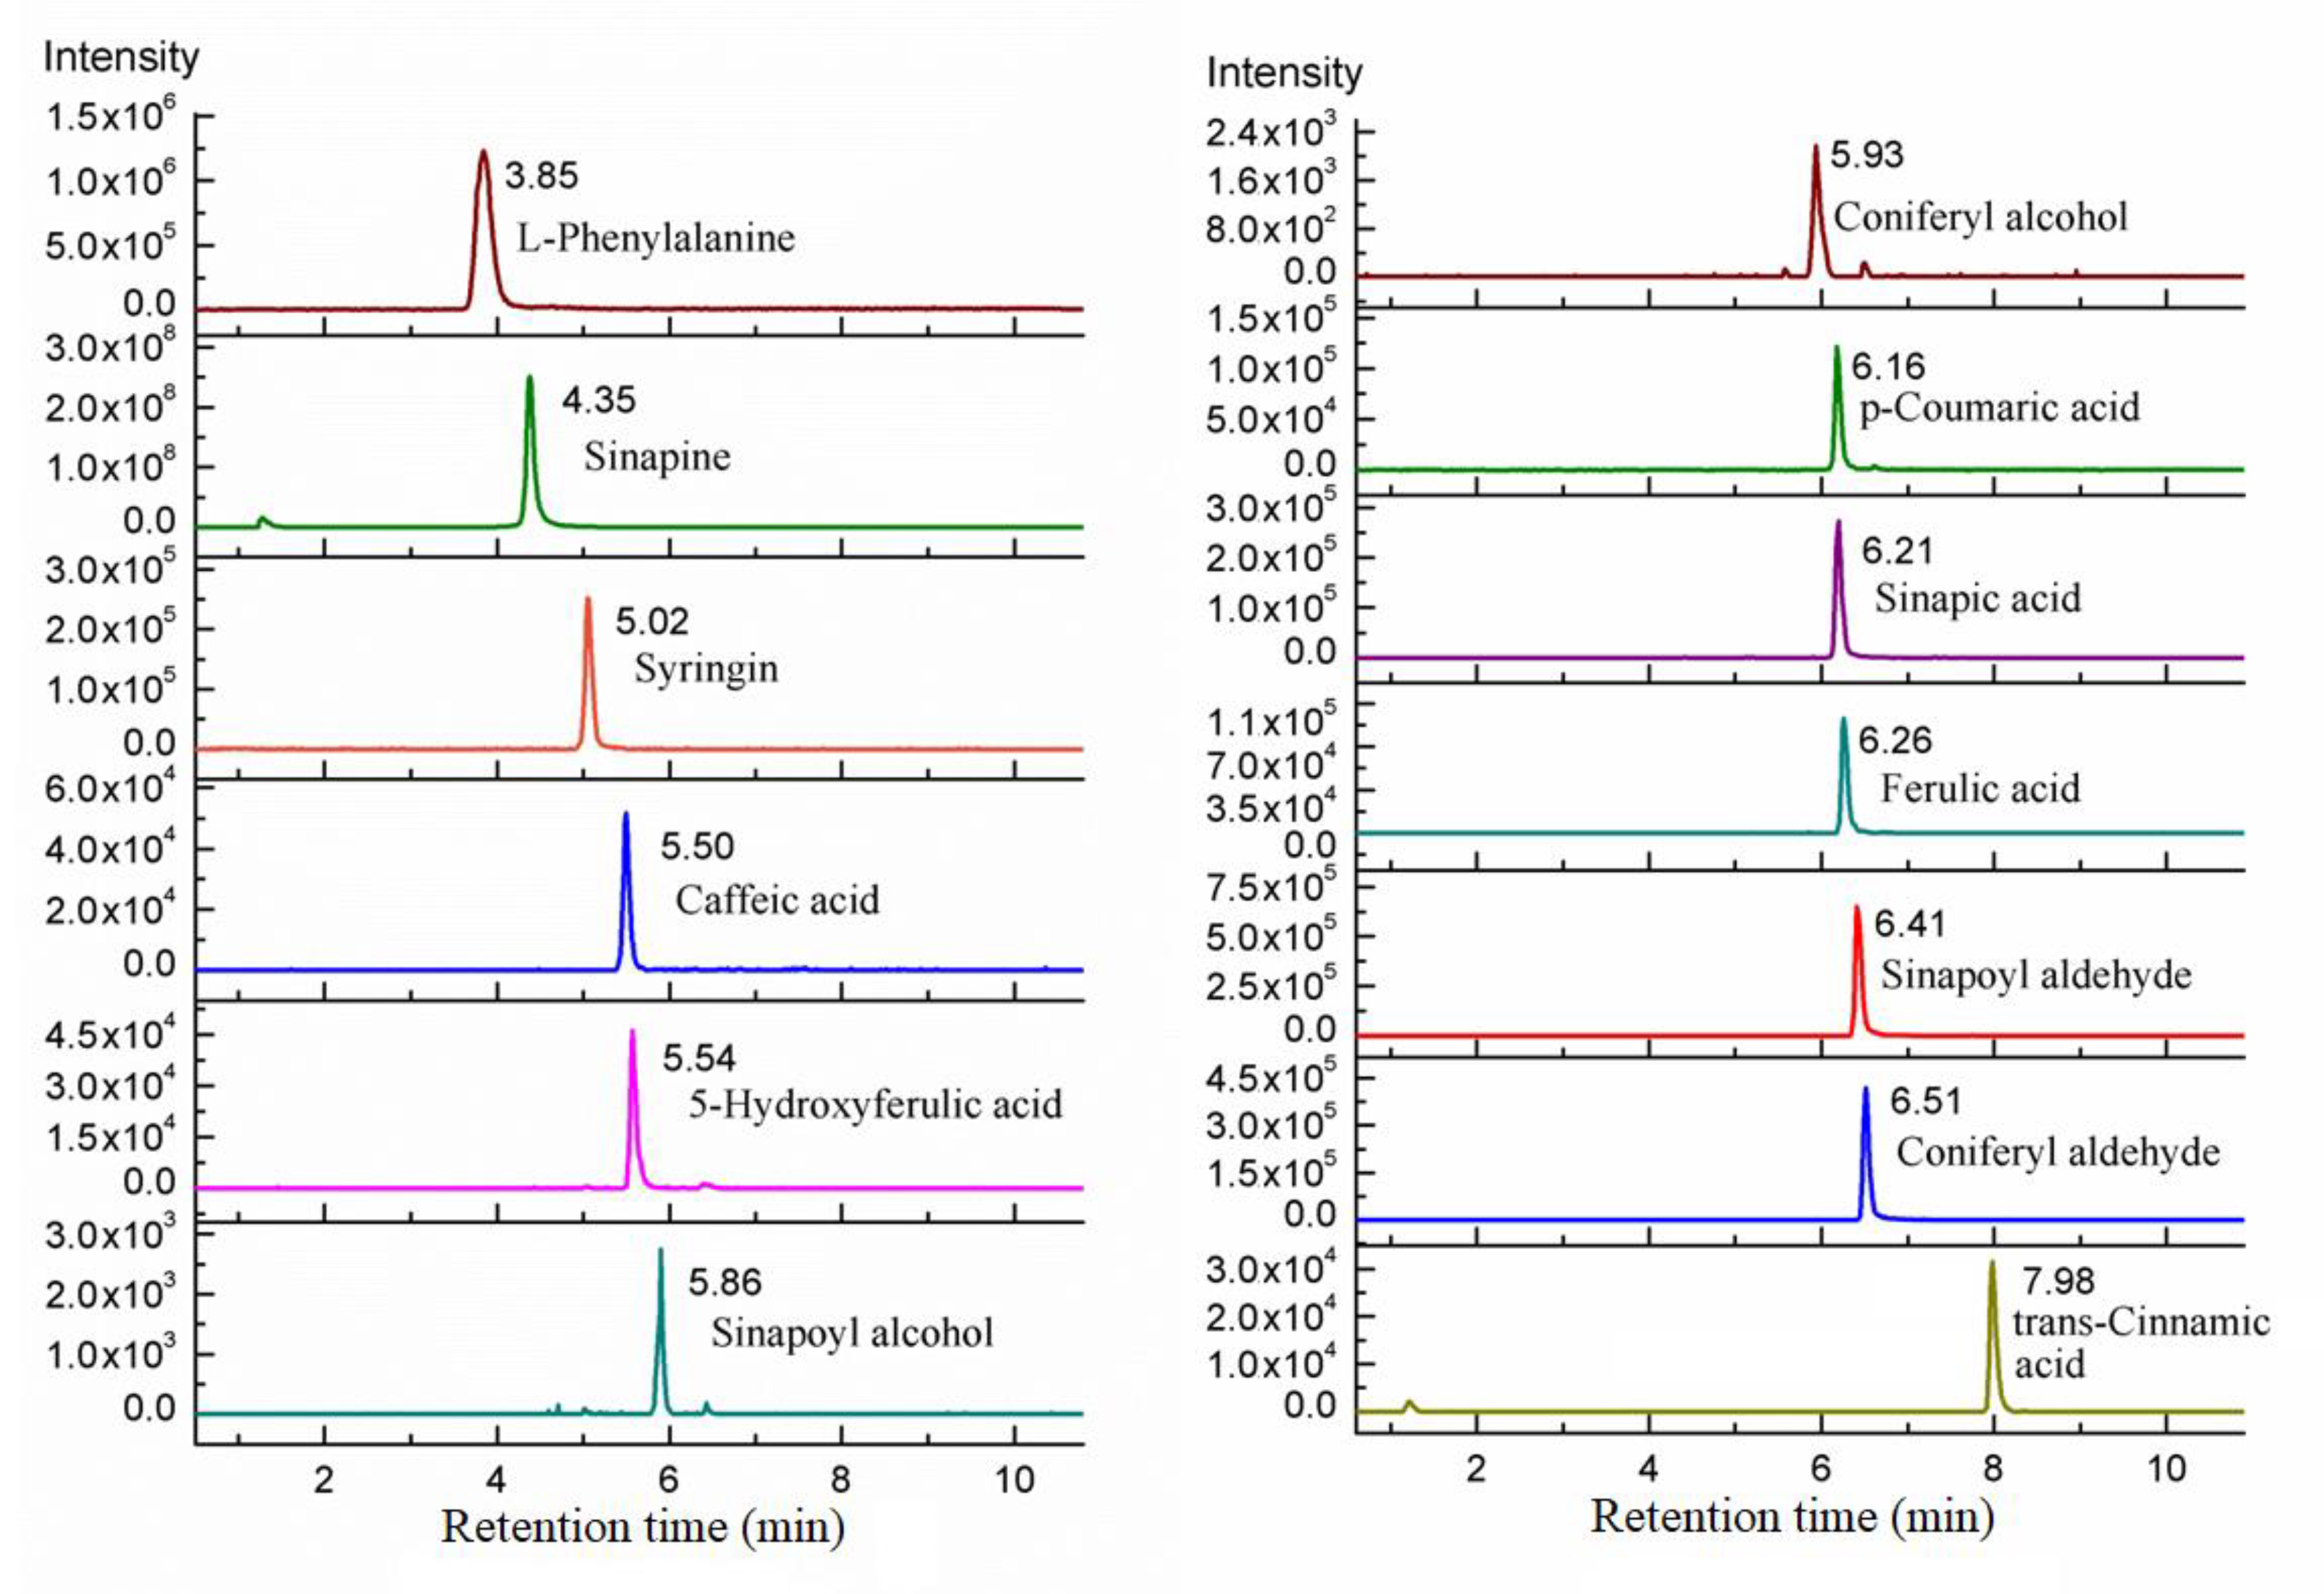
| Targets | Retention Time/(min) | Parent Ion/(m/z) | Product Ion /(m/z) | Collision Energy/(eV) | Ion Polarity | Tube Lens/(V) |
|---|---|---|---|---|---|---|
| l-Phenylalanine | 3.85 | 166.076 | 120.300 > 103.300 | 12/25 | [M + H]+ | 96 |
| trans-Cinnamic Acid | 7.98 | 147.050 | 103.350 | 14 | [M − H]− | 88 |
| p-Coumaric Acid | 6.16 | 163.047 | 119.247 | 16 | [M − H]− | 50 |
| Caffeic Acid | 5.50 | 179.042 | 135.282 | 16 | [M − H]− | 60 |
| Ferulic Acid | 6.26 | 193.020 | 134.020 > 178.021 | 18/16 | [M − H]− | 57 |
| Coniferyl Aldehyde | 6.51 | 177.060 | 162.210 | 14 | [M − H]− | 88 |
| Coniferyl Alcohol | 5.93 | 179.070 | 146.070 > 164.050 | 16/18 | [M − H]− | 72 |
| 5-Hydroxyferulic Acid | 5.54 | 209.051 | 150.170 > 194.150 | 18/13 | [M − H]− | 90 |
| Sinapic Acid | 6.21 | 223.050 | 208.160 > 193.090 | 12/22 | [M − H]− | 86 |
| Sinapoyl Aldehyde | 6.41 | 207.060 | 177.160 > 192.180 | 21/16 | [M − H]− | 95 |
| Sinapoyl Alcohol | 5.86 | 209.089 | 179.089 | 23 | [M − H]− | 64 |
| Syringin | 5.02 | 395.200 | 232.200 | 22 | [M + Na]+ | 120 |
| Sinapine | 4.35 | 311.180 | 252.260 | 15 | [M + 1]+ | 78 |
Publisher’s Note: MDPI stays neutral with regard to jurisdictional claims in published maps and institutional affiliations. |
© 2021 by the authors. Licensee MDPI, Basel, Switzerland. This article is an open access article distributed under the terms and conditions of the Creative Commons Attribution (CC BY) license (https://creativecommons.org/licenses/by/4.0/).
Share and Cite
Wang, D.; Zhang, L.; Yu, L.; Ma, F.; Li, P. Simultaneous Quantification of Trace and Micro Phenolic Compounds by Liquid Chromatography Tandem-Mass Spectrometry. Metabolites 2021, 11, 589. https://doi.org/10.3390/metabo11090589
Wang D, Zhang L, Yu L, Ma F, Li P. Simultaneous Quantification of Trace and Micro Phenolic Compounds by Liquid Chromatography Tandem-Mass Spectrometry. Metabolites. 2021; 11(9):589. https://doi.org/10.3390/metabo11090589
Chicago/Turabian StyleWang, Dandan, Liangxiao Zhang, Li Yu, Fei Ma, and Peiwu Li. 2021. "Simultaneous Quantification of Trace and Micro Phenolic Compounds by Liquid Chromatography Tandem-Mass Spectrometry" Metabolites 11, no. 9: 589. https://doi.org/10.3390/metabo11090589
APA StyleWang, D., Zhang, L., Yu, L., Ma, F., & Li, P. (2021). Simultaneous Quantification of Trace and Micro Phenolic Compounds by Liquid Chromatography Tandem-Mass Spectrometry. Metabolites, 11(9), 589. https://doi.org/10.3390/metabo11090589