Article

Dereplication, Annotation, and Characterization of 74 Potential Antimicrobial Metabolites from Penicillium Sclerotiorum Using t-SNE Molecular Networks

CNRS, Institut de Chimie des Substances Naturelles, Université Paris-Saclay, UPR 2301, 91198 Gif-sur-Yvette, France
*
Authors to whom correspondence should be addressed.
Metabolites 2021, 11(7), 444; https://doi.org/10.3390/metabo11070444
Submission received: 10 June 2021 / Revised: 2 July 2021 / Accepted: 5 July 2021 / Published: 8 July 2021
(This article belongs to the Special Issue Metabolomics Analysis of Natural Products)

Abstract

:
Microorganisms associated with termites are an original resource for identifying new chemical scaffolds or active metabolites. A molecular network was generated from a collection of strain extracts analyzed by liquid chromatography coupled to tandem high-resolution mass spectrometry, a molecular network was generated, and activities against the human pathogens methicillin-resistant Staphylococcus aureus, Candida albicans and Trichophyton rubrum were mapped, leading to the selection of a single active extract of Penicillium sclerotiorum SNB-CN111. This fungal species is known to produce azaphilones, a colorful family of polyketides with a wide range of biological activities and economic interests in the food industry. By exploring the molecular network data, it was shown that the chemical diversity related to the P. sclerotiorum metabolome largely exceeded the data already reported in the literature. According to the described fragmentation pathways of protonated azaphilones, the annotation of 74 azaphilones was proposed, including 49 never isolated or synthesized thus far. Our hypothesis was validated by the isolation and characterization of eight azaphilones, among which three new azaphilones were chlorogeumasnol (63), peniazaphilone E (74) and 7-deacetylisochromophilone VI (80).

Graphical Abstract

1. Introduction

For decades, natural products have been the most productive source of leads for new drugs, including antimicrobials [1]. Nevertheless, new chemical scaffolds are always required to extend therapeutic arsenals in order to address global public health problems, such as antibiotic resistance. To this end, new ecological niches must be explored, and their relative chemodiversity must be evaluated [2].
Among the ecological niches that have been little studied, the microorganisms associated with insects are rising in interest. One million five thousand insect species (Arthropods) have been formally described to date [3]. Arthropods colonize almost all terrestrial habitats, including forests, deserts and coasts. These organisms are also colonized by microorganisms located in different compartments, such as cuticles, digestive systems and glands [4]. Insect–microorganism interactions have been widely studied within apocrites (bees, wasps, ants), but few studies are related to termite–microorganism interactions outside the trophobiosis [5,6,7,8]. However, examples of antimicrobial compounds produced by microorganisms associated with termites from French Guiana were previously published in the literature, especially by the research group of D. Stien and V. Eparvier [9,10,11,12].
In the present work, the termite-associated microorganism strain collection at the Institute of Chemistry of Natural Substances (ICSN) was reinvestigated using newly developed metabolomic tools.
Indeed, time-consuming purifications and rediscovery of active known compounds are recurring problems in natural product research. Dereplication using mass spectrometry-based molecular networking approaches can be implemented to overcome these drawbacks, allowing for the targeting of specific metabolites through the tandem mass spectrometry dataset organization that they confer [13,14,15,16,17,18].
After mapping the bioactivity against three human pathogens, i.e., methicillin-resistant Staphylococcus aureus, Candida albicans and Trichophyton rubrum, on the molecular network, the strain extract of Penicillium sclerotiorum SNB-CN111, with minimal inhibitory concentrations (MICs) of 16 and 32 µg.mL−1 against Candida albicans and Trichophyton rubrum, respectively, and without significant cytotoxicity (cell survival greater than 80% at a concentration of 10 µg.mL−1), was selected. Penicillium sclerotiorum is a fungus known to produce antimicrobial fungal polyketides called azaphilones, among which chlorinated compounds have been described [19,20,21]. Moreover, azaphilones attract high interest in industry, particularly for natural food coloring [22]. The purpose of this study was to annotate and characterize azaphilones in the SNB-111 extract strain by determining their fragmentation patterns by tandem mass spectrometry, exploring the related molecular network, proposing putative in silico structures and finally confirming this approach by isolating new bioactive compounds.

2. Results

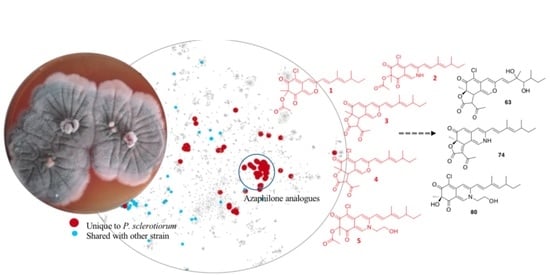
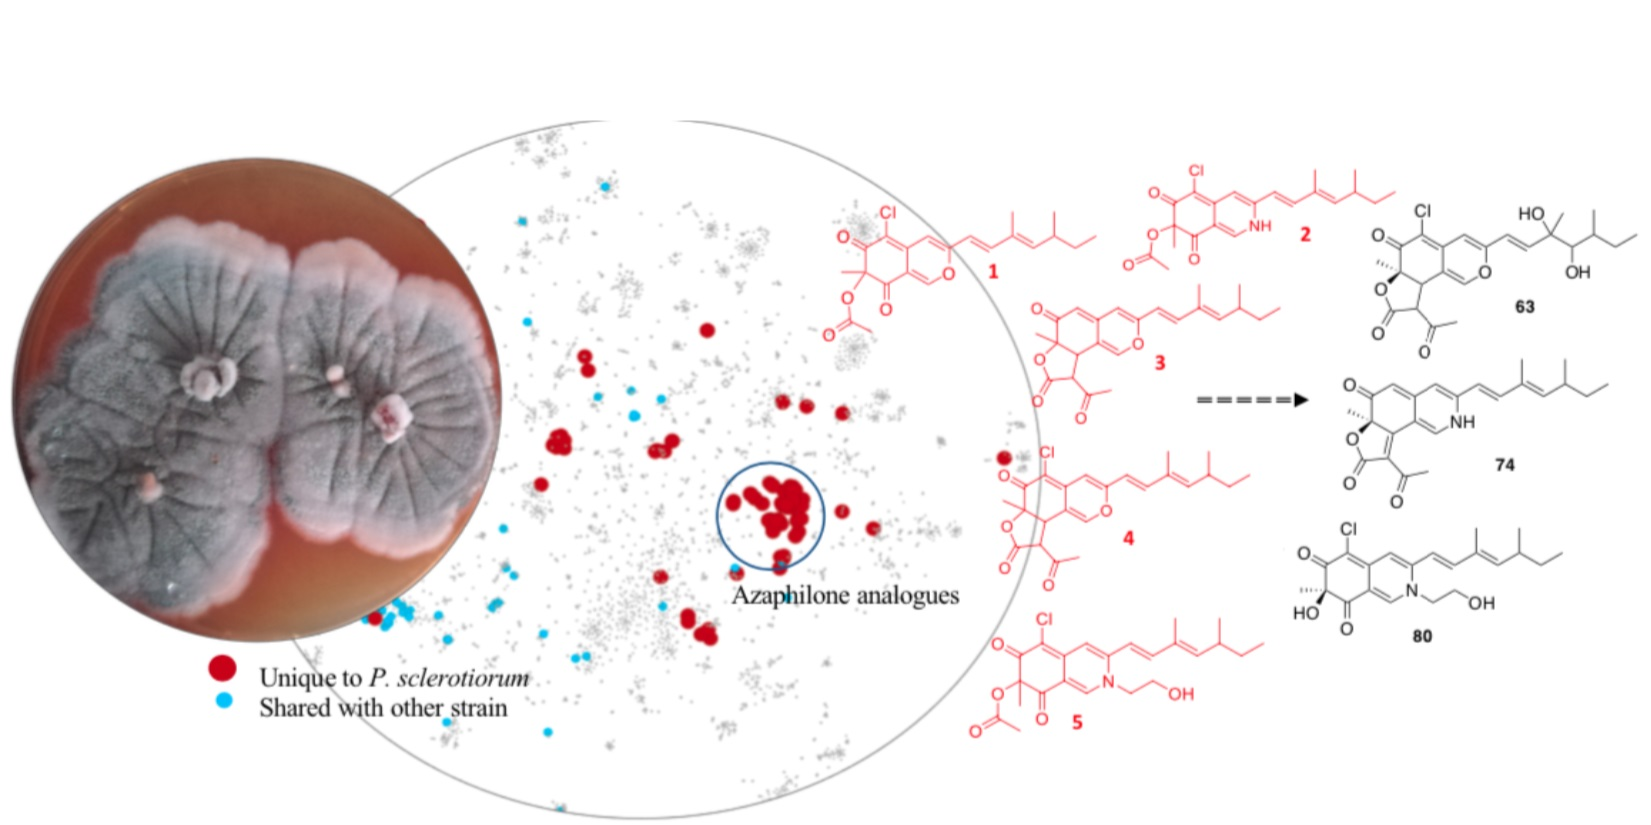
2.1. Penicillium Sclerotiorum Selection

The 109 crude extracts of microorganisms associated with termites were first analyzed by liquid chromatography coupled to tandem high-resolution mass spectrometry (LC-HRMS/MS) in data-dependent analysis (DDA) mode and in positive ion mode. Extracts were also biologically tested against two human pathogens, i.e., Candida albicans and Trichophyton rubrum (Figure S1). The MS/MS data generated were processed to create a molecular network (MN) by MS/MS similarity related to chemical similarity using MetGem software (Figure S2) [13,14]. Briefly, MS/MS data were converted to vectors, and cosine scores between each vector were calculated to evaluate the distance of structural homology. The t-SNE algorithm implemented in MetGem software was employed to generate the final distance map, called the molecular network. The t-SNE allowed exploration of the dataset as a whole and preserved chemical proximity between clusters compared to the GNPS-like network. Metadata, such as the proposed chemical formula, retention times, relative areas of extracted ion peaks or activity of each extract, can be mapped on the MN using color mode. Once the molecular network was generated, the MS² libraries of standard molecules were queried, and known metabolites were annotated. Specific clusters related to P. sclerotiorum SNB-CN111 were enlightened by mapping strain identity on the network (Figure S2). Using MS/MS database search engines, five MS/MS spectra were annotated as azaphilone analogs: sclerotiorin (1), sclerotioramine (2), ochrephilone (3), isochromophilone I (4) and isochromophilone VI (5) (Figures S3–S7).

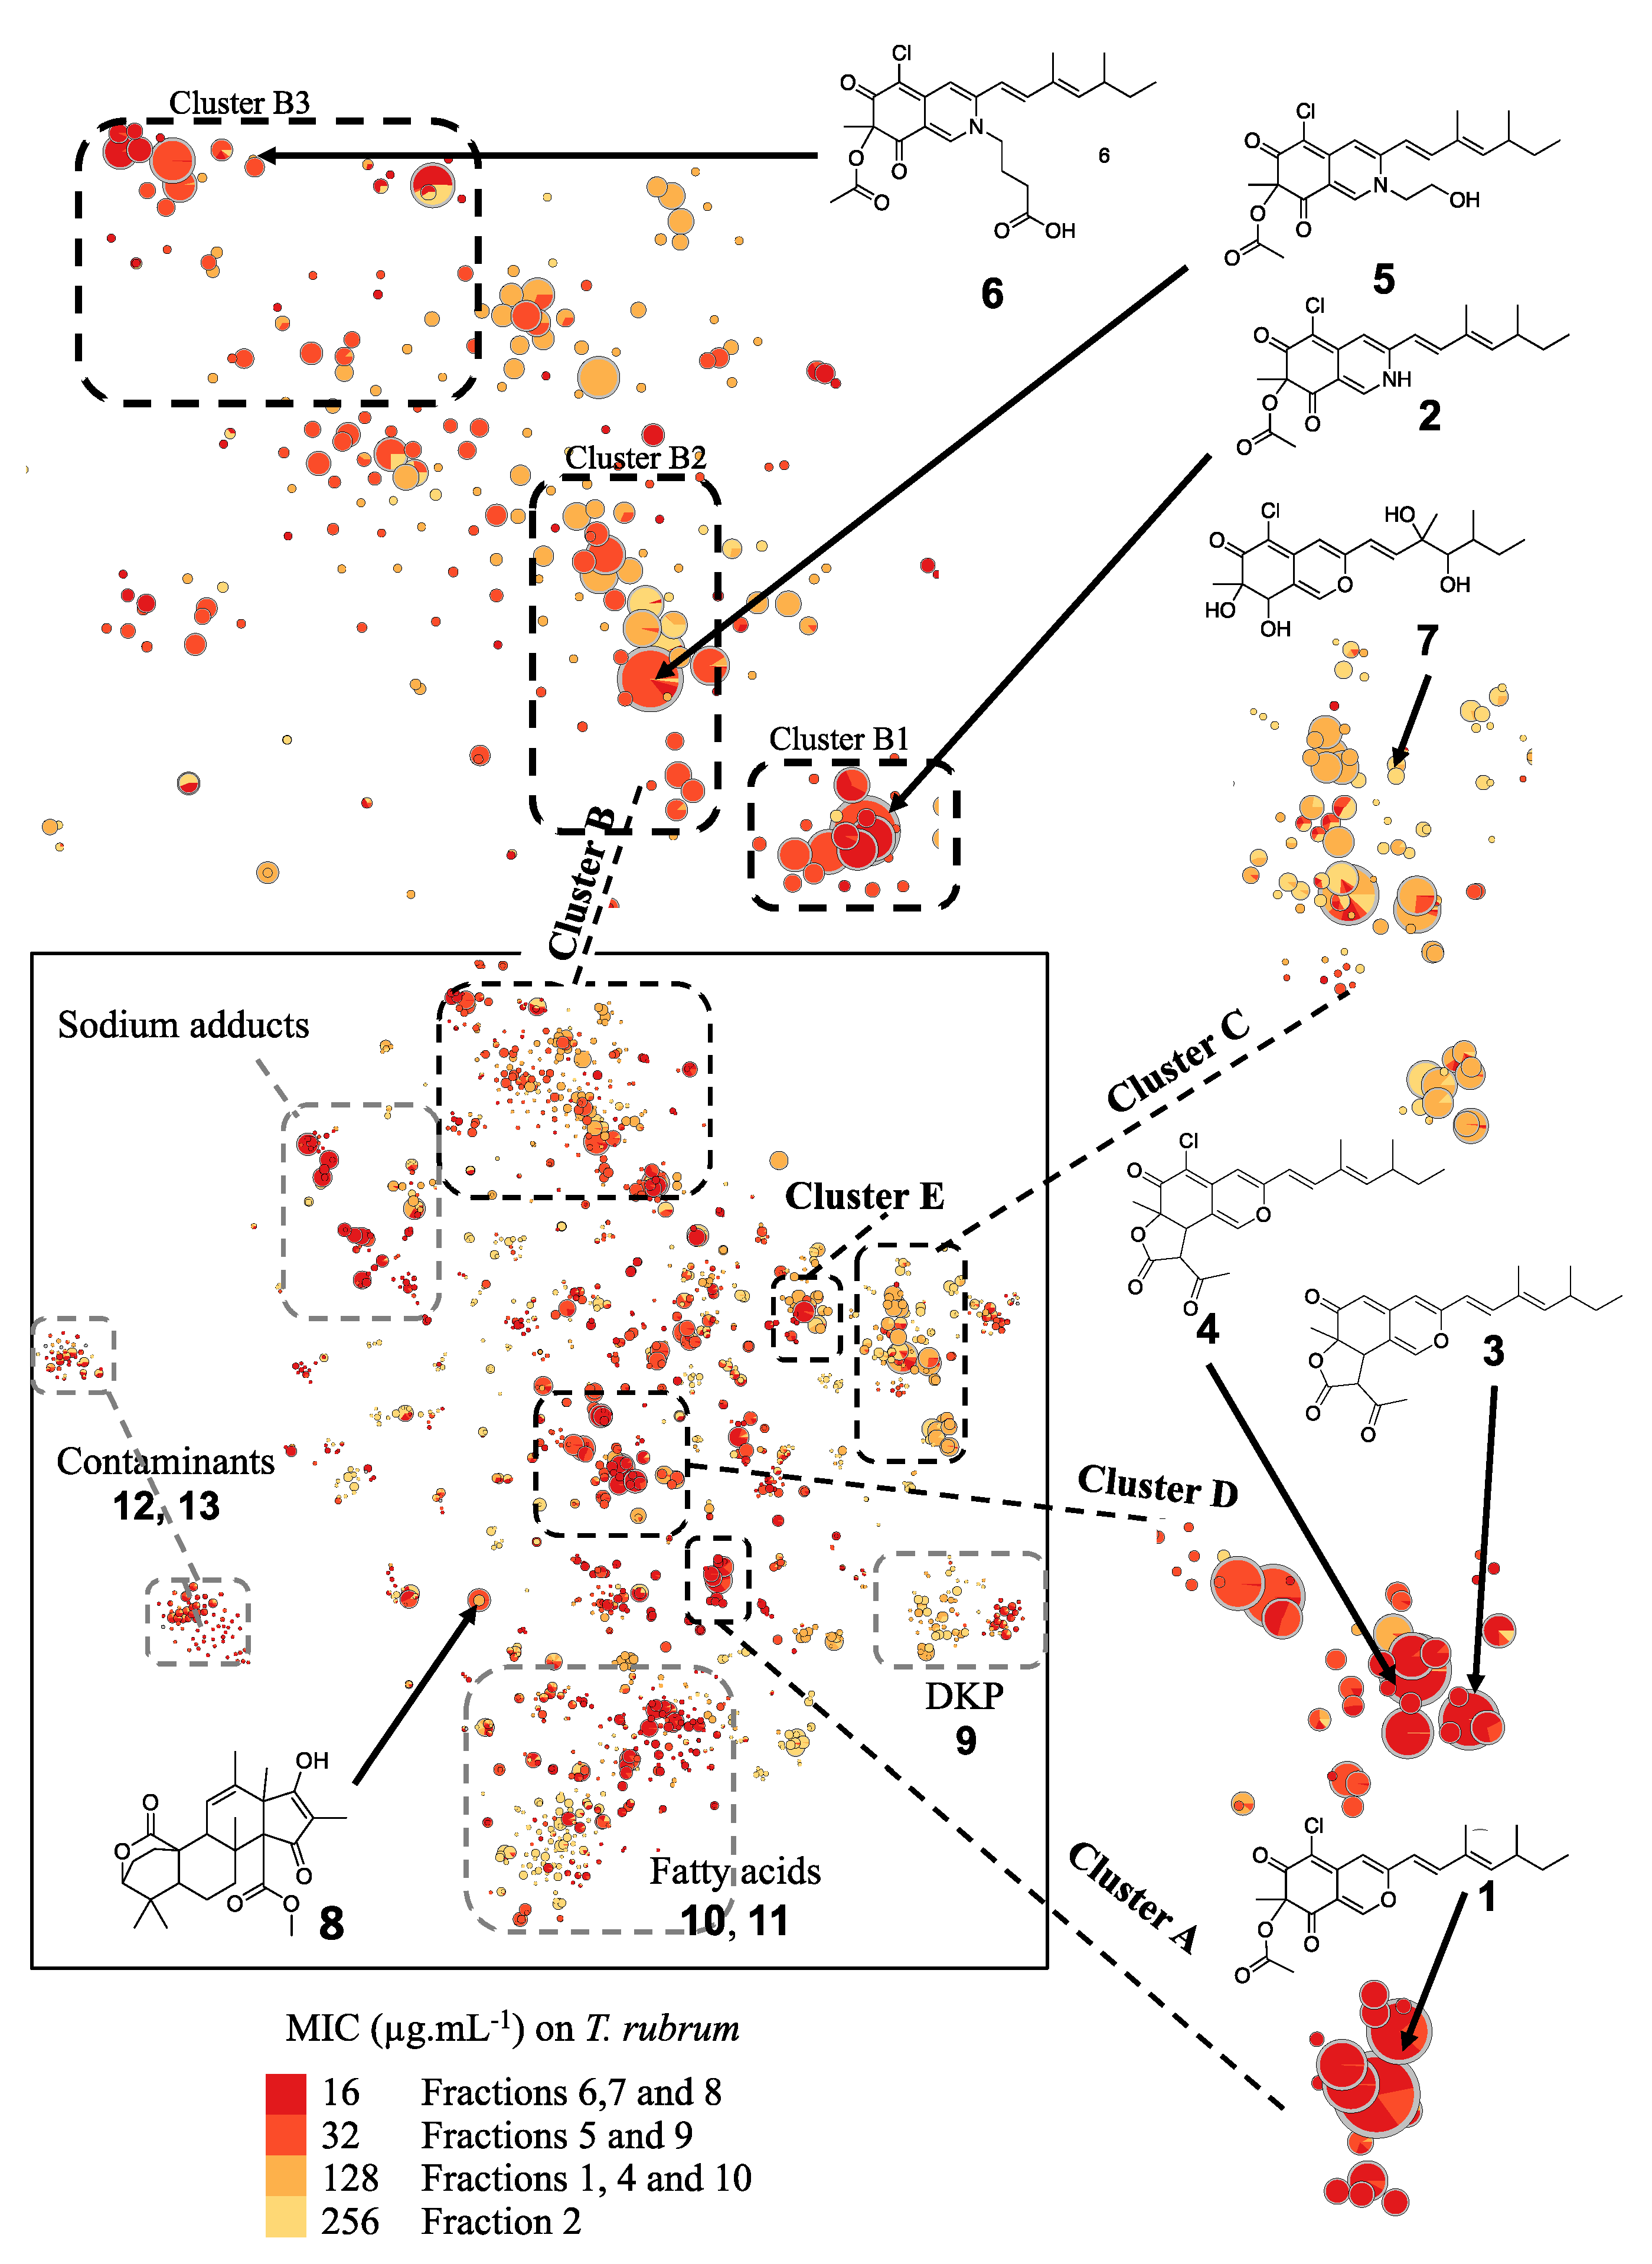
2.2. Penicillium Sclerotiorum Metabolism Dereplication

To optimize the identification of minority compounds produced by P. sclerotiorum, a scale-up culture was performed. Bioguided fractionation was undertaken, leading to ten fractions whose antimicrobial activities were determined (Figure S8), leading to 5 active fractions against Trichophyton rubrum with MICs below 32 µg.mL−1. In parallel, a t-SNE molecular network including bioactivity levels against Trichophyton rubrum was generated from LC–MS/MS data of the ten P. sclerotiorum fractions (Figure 1). Before isolation, a first annotation by querying MS/MS spectral databases was achieved. To clarify our molecular network feature annotation and to respect standards for reproducible science, annotation levels proposed by the Metabolomics Standards Initiative (MSI) were used [23]. Level 0 corresponds to an unambiguous 3D structure obtained from isolated pure compounds; level 1 corresponds to identified compound by comparison with a standard; level 2 corresponds to putative annotation (e.g., MS/MS library comparison or tentative structure); level 3 includes a chemical class assignment; and level 4 means unknown molecules. Sclerotiorin (1), sclerotioramine (2), ochrephilone (3), isochromophilone I (4) and isochromophilone VI (5), as well as isochromophilone IX (6), hypocrellone A (7), atlantinone A (8), diketopiperazine (DKP: cyclo-PhePro (9)), fatty acids (pinolenic acid (10) and linolenic acid (11)) and contaminants (dioctyl phthalate (12), cyclopentasiloxane (13)), were finally annotated in silico (Figures S3–S16). Several clusters of molecules in active fractions were thus annotated using MS/MS similarities (Figure 1).
Subsequently, a second step in the dereplication process was carried out. First, molecules described in the Atlas of Natural Products as compounds 1 to 7 analogs were searched. Then, a second search was carried out on the Reaxys database on compounds structurally similar to molecules isolated from natural resources [24]. Structures proposed through the literature review were annotated with level 3 using only exact mass and taxonomic information. Five molecules, i.e., geumsanol A-C and G (14–17) and eupeniazaphilone C (18), were therefore annotated in cluster C, where hypocrellone (7) was first dereplicated [25,26,27]. Two molecules, i.e., isochromophilone IX (6) or penazaphilone F (19) and penazaphilone D (20), were also annotated in cluster B, including compounds 2 and 5 [28,29]. Isochromophilone IV (21) and sclerketide B isomer (22) completed the annotation of cluster A, including sclerotiorin (1) [30,31]. Finally, 5-chloroisorotiorin (23) completed cluster D, featuring molecules 3 and 4 [32]. Using the literature review, it was thus possible to annotate 10 more azaphilones produced by P. sclerotiorum SNB-CN111 (Figures S10, S14–S26). Despite these two first in silico steps, more than approximately one hundred molecules related to azaphilones remain unannotated.

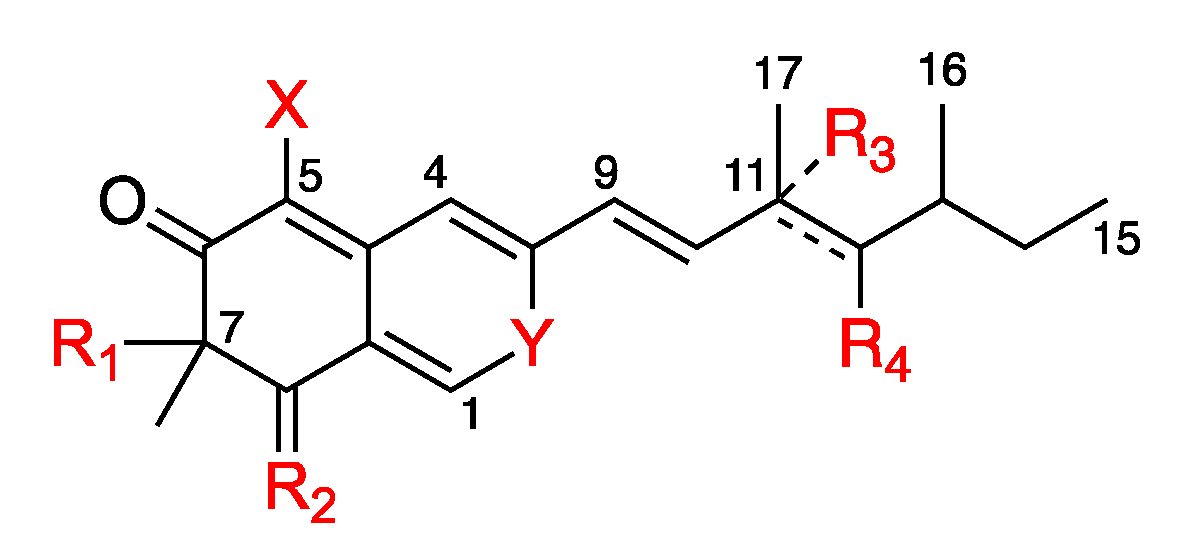
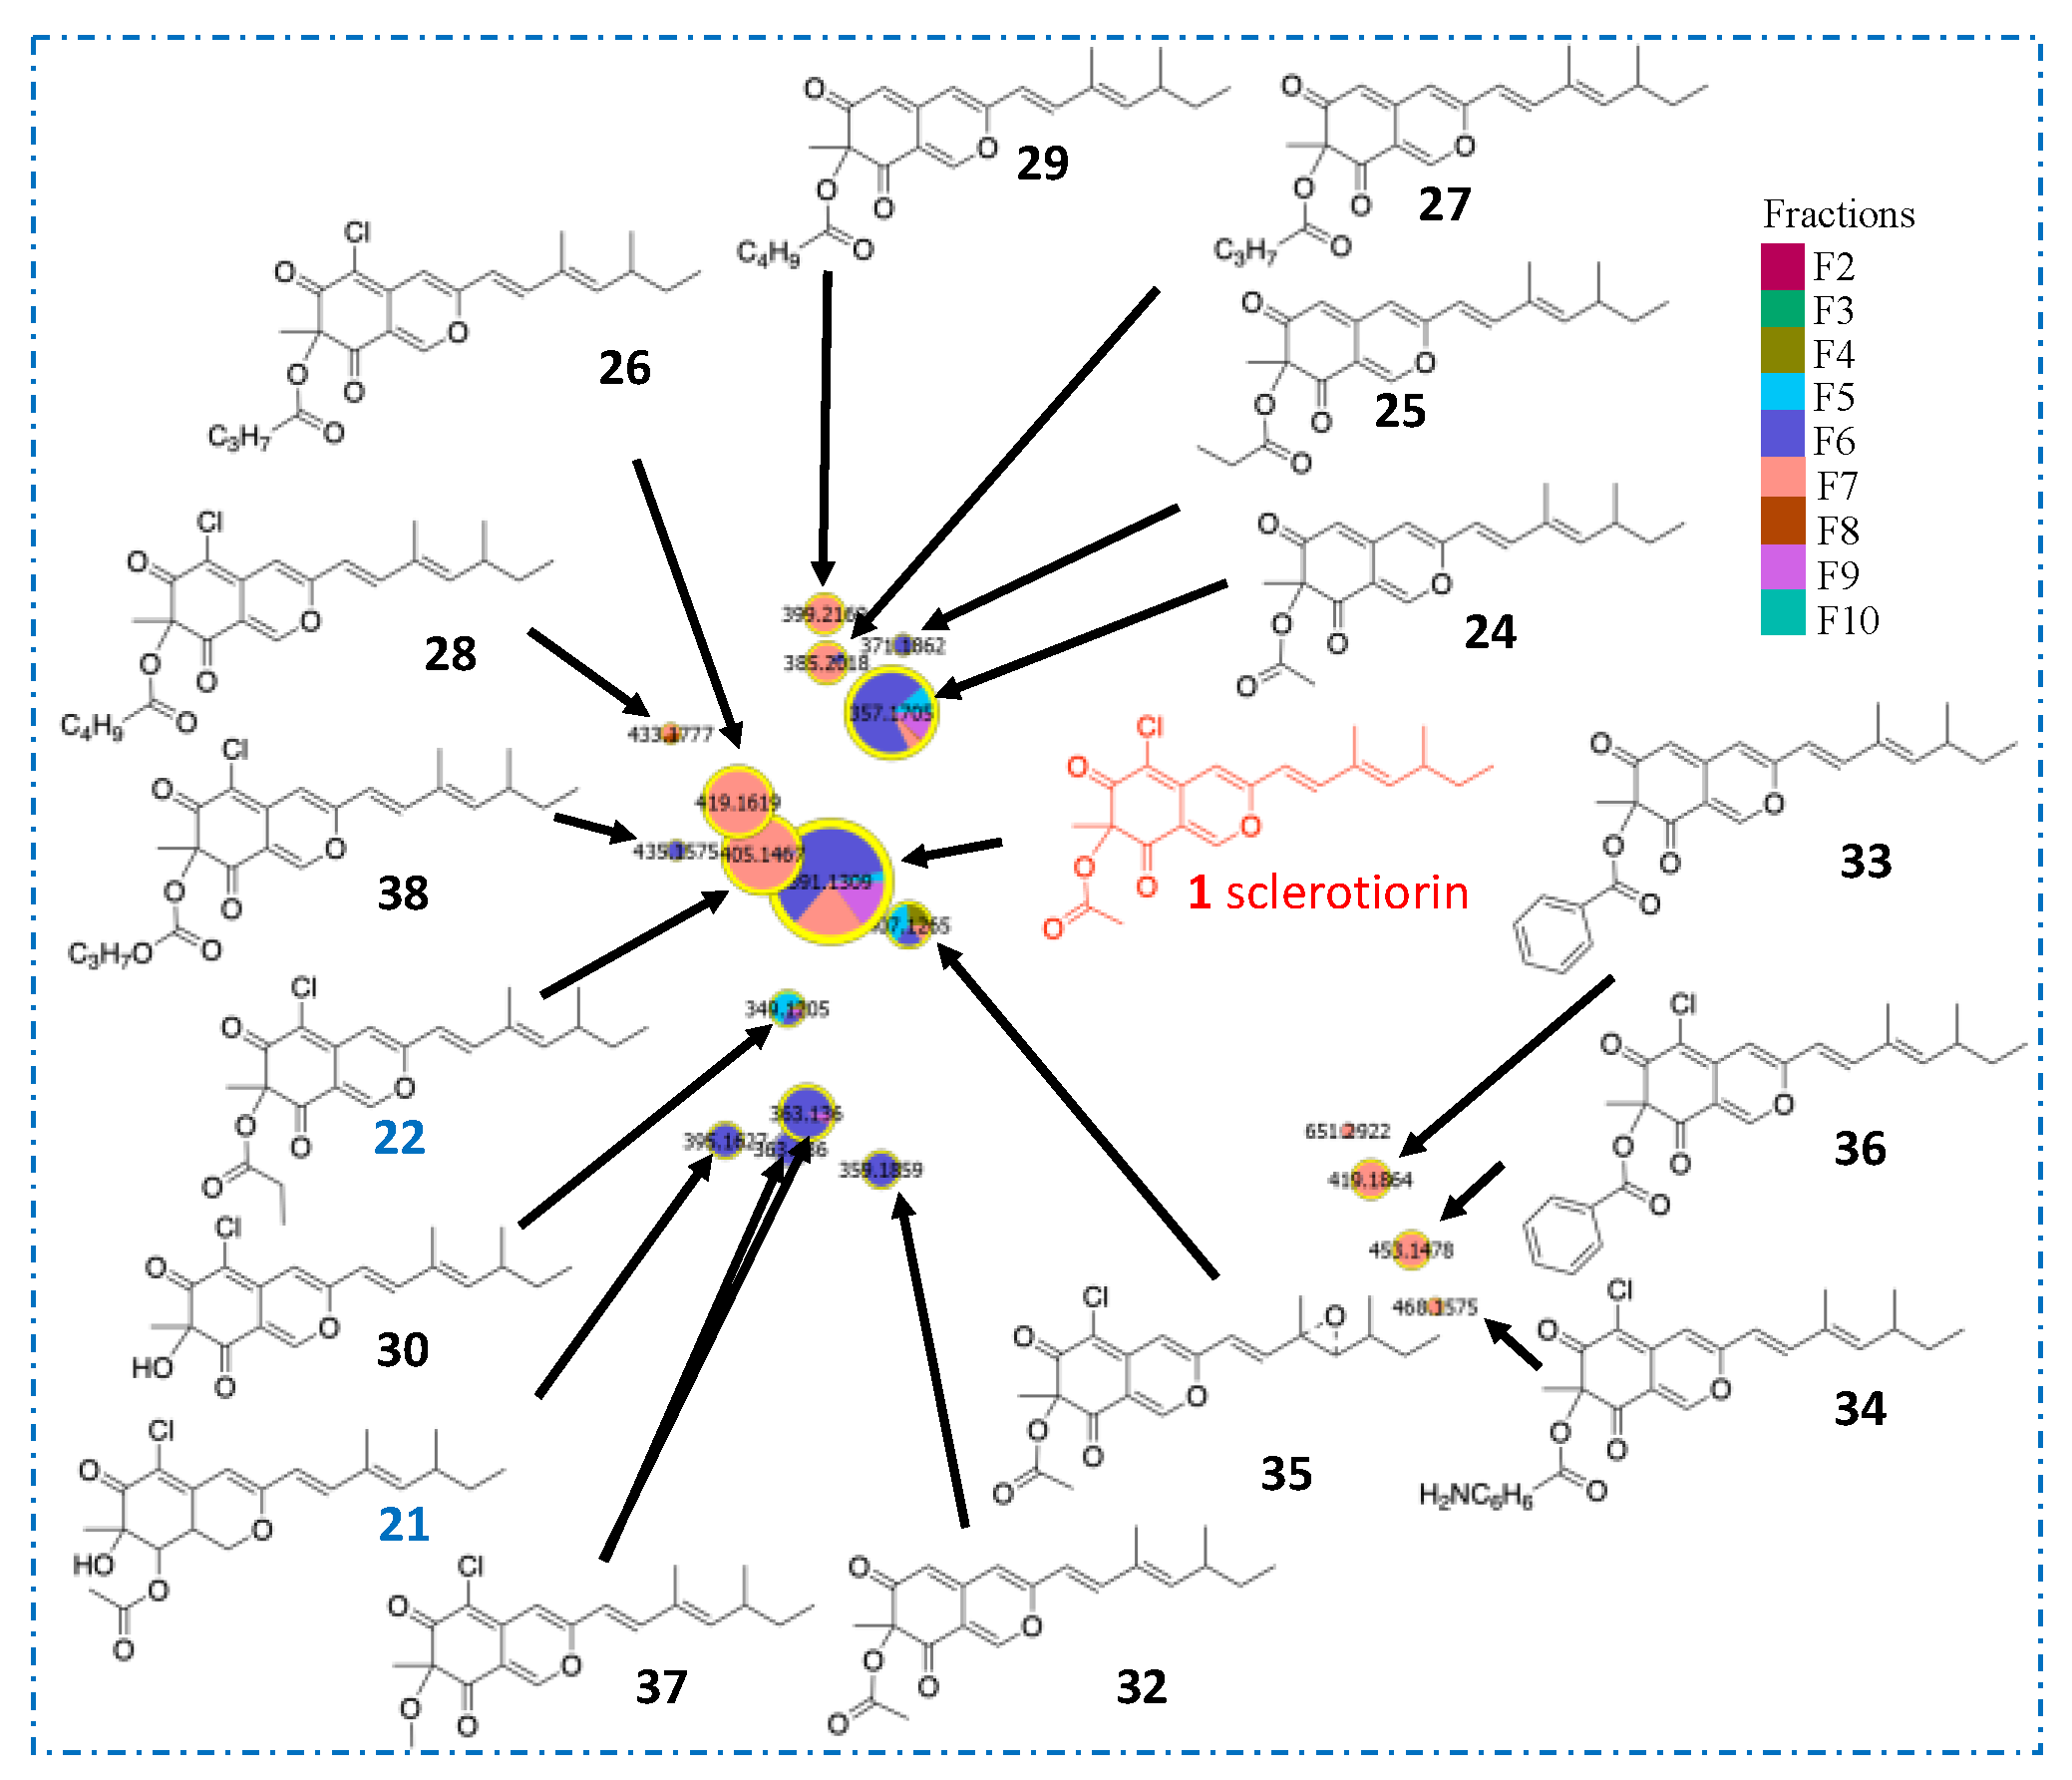
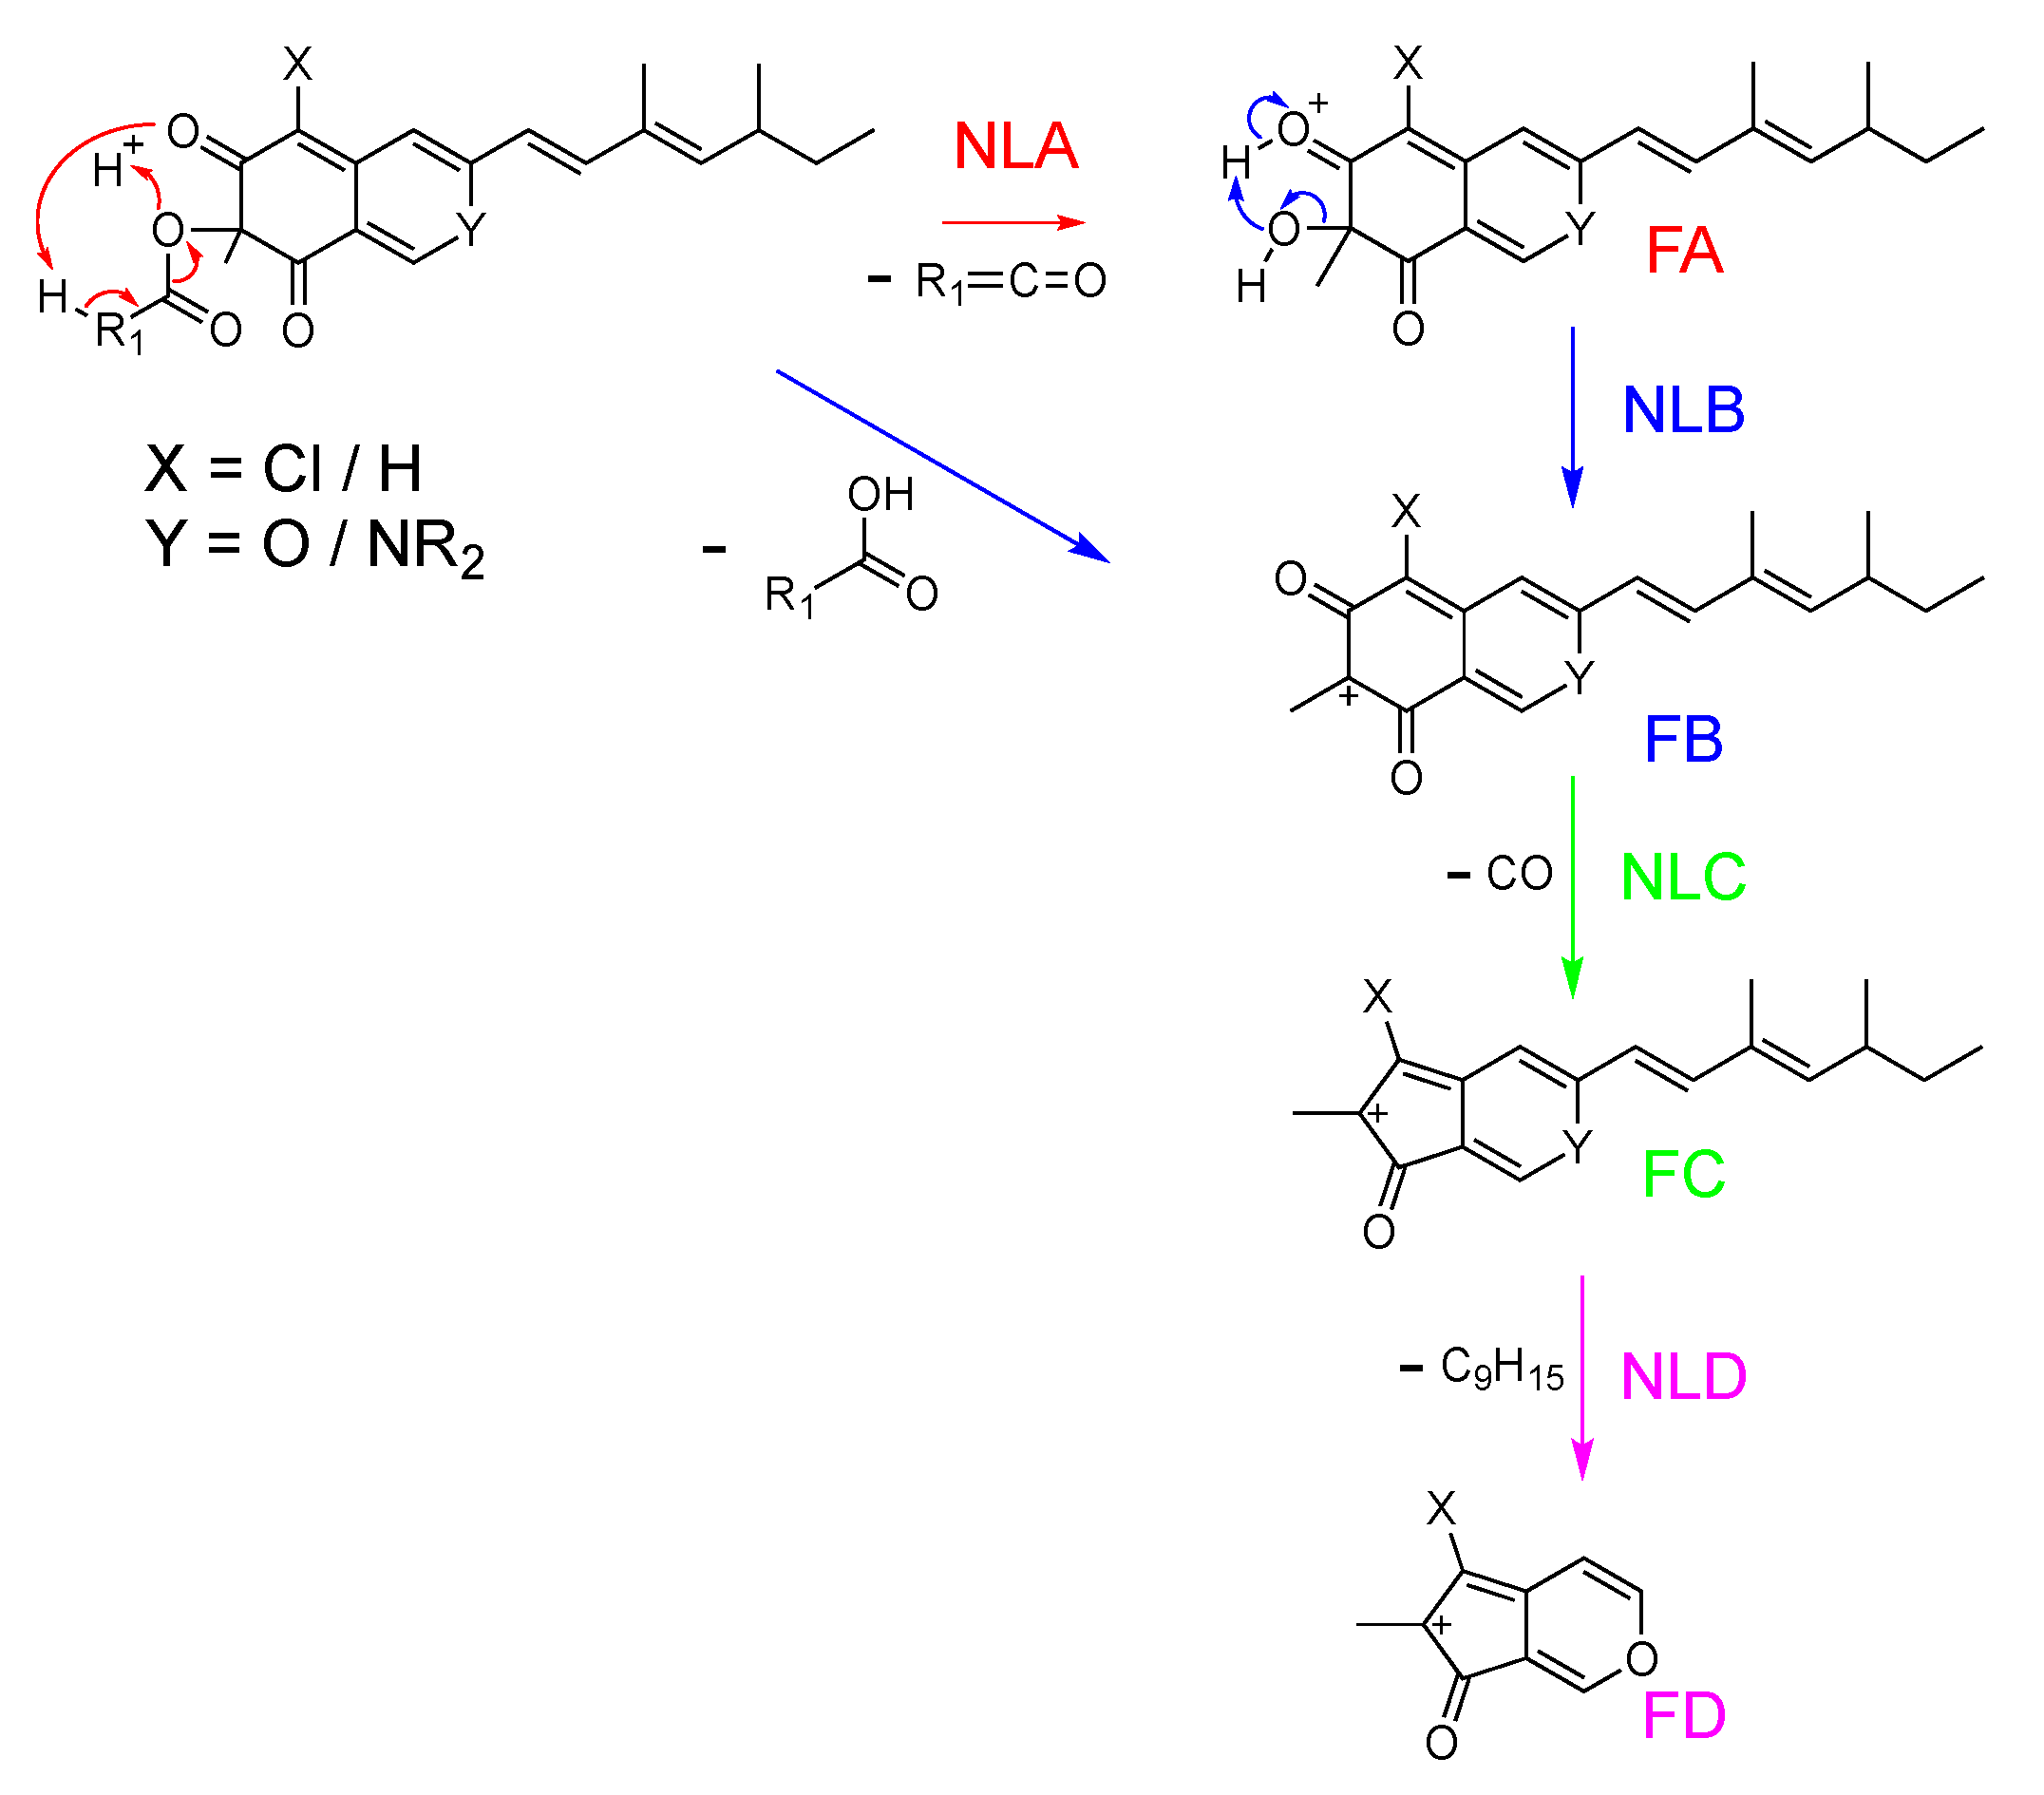
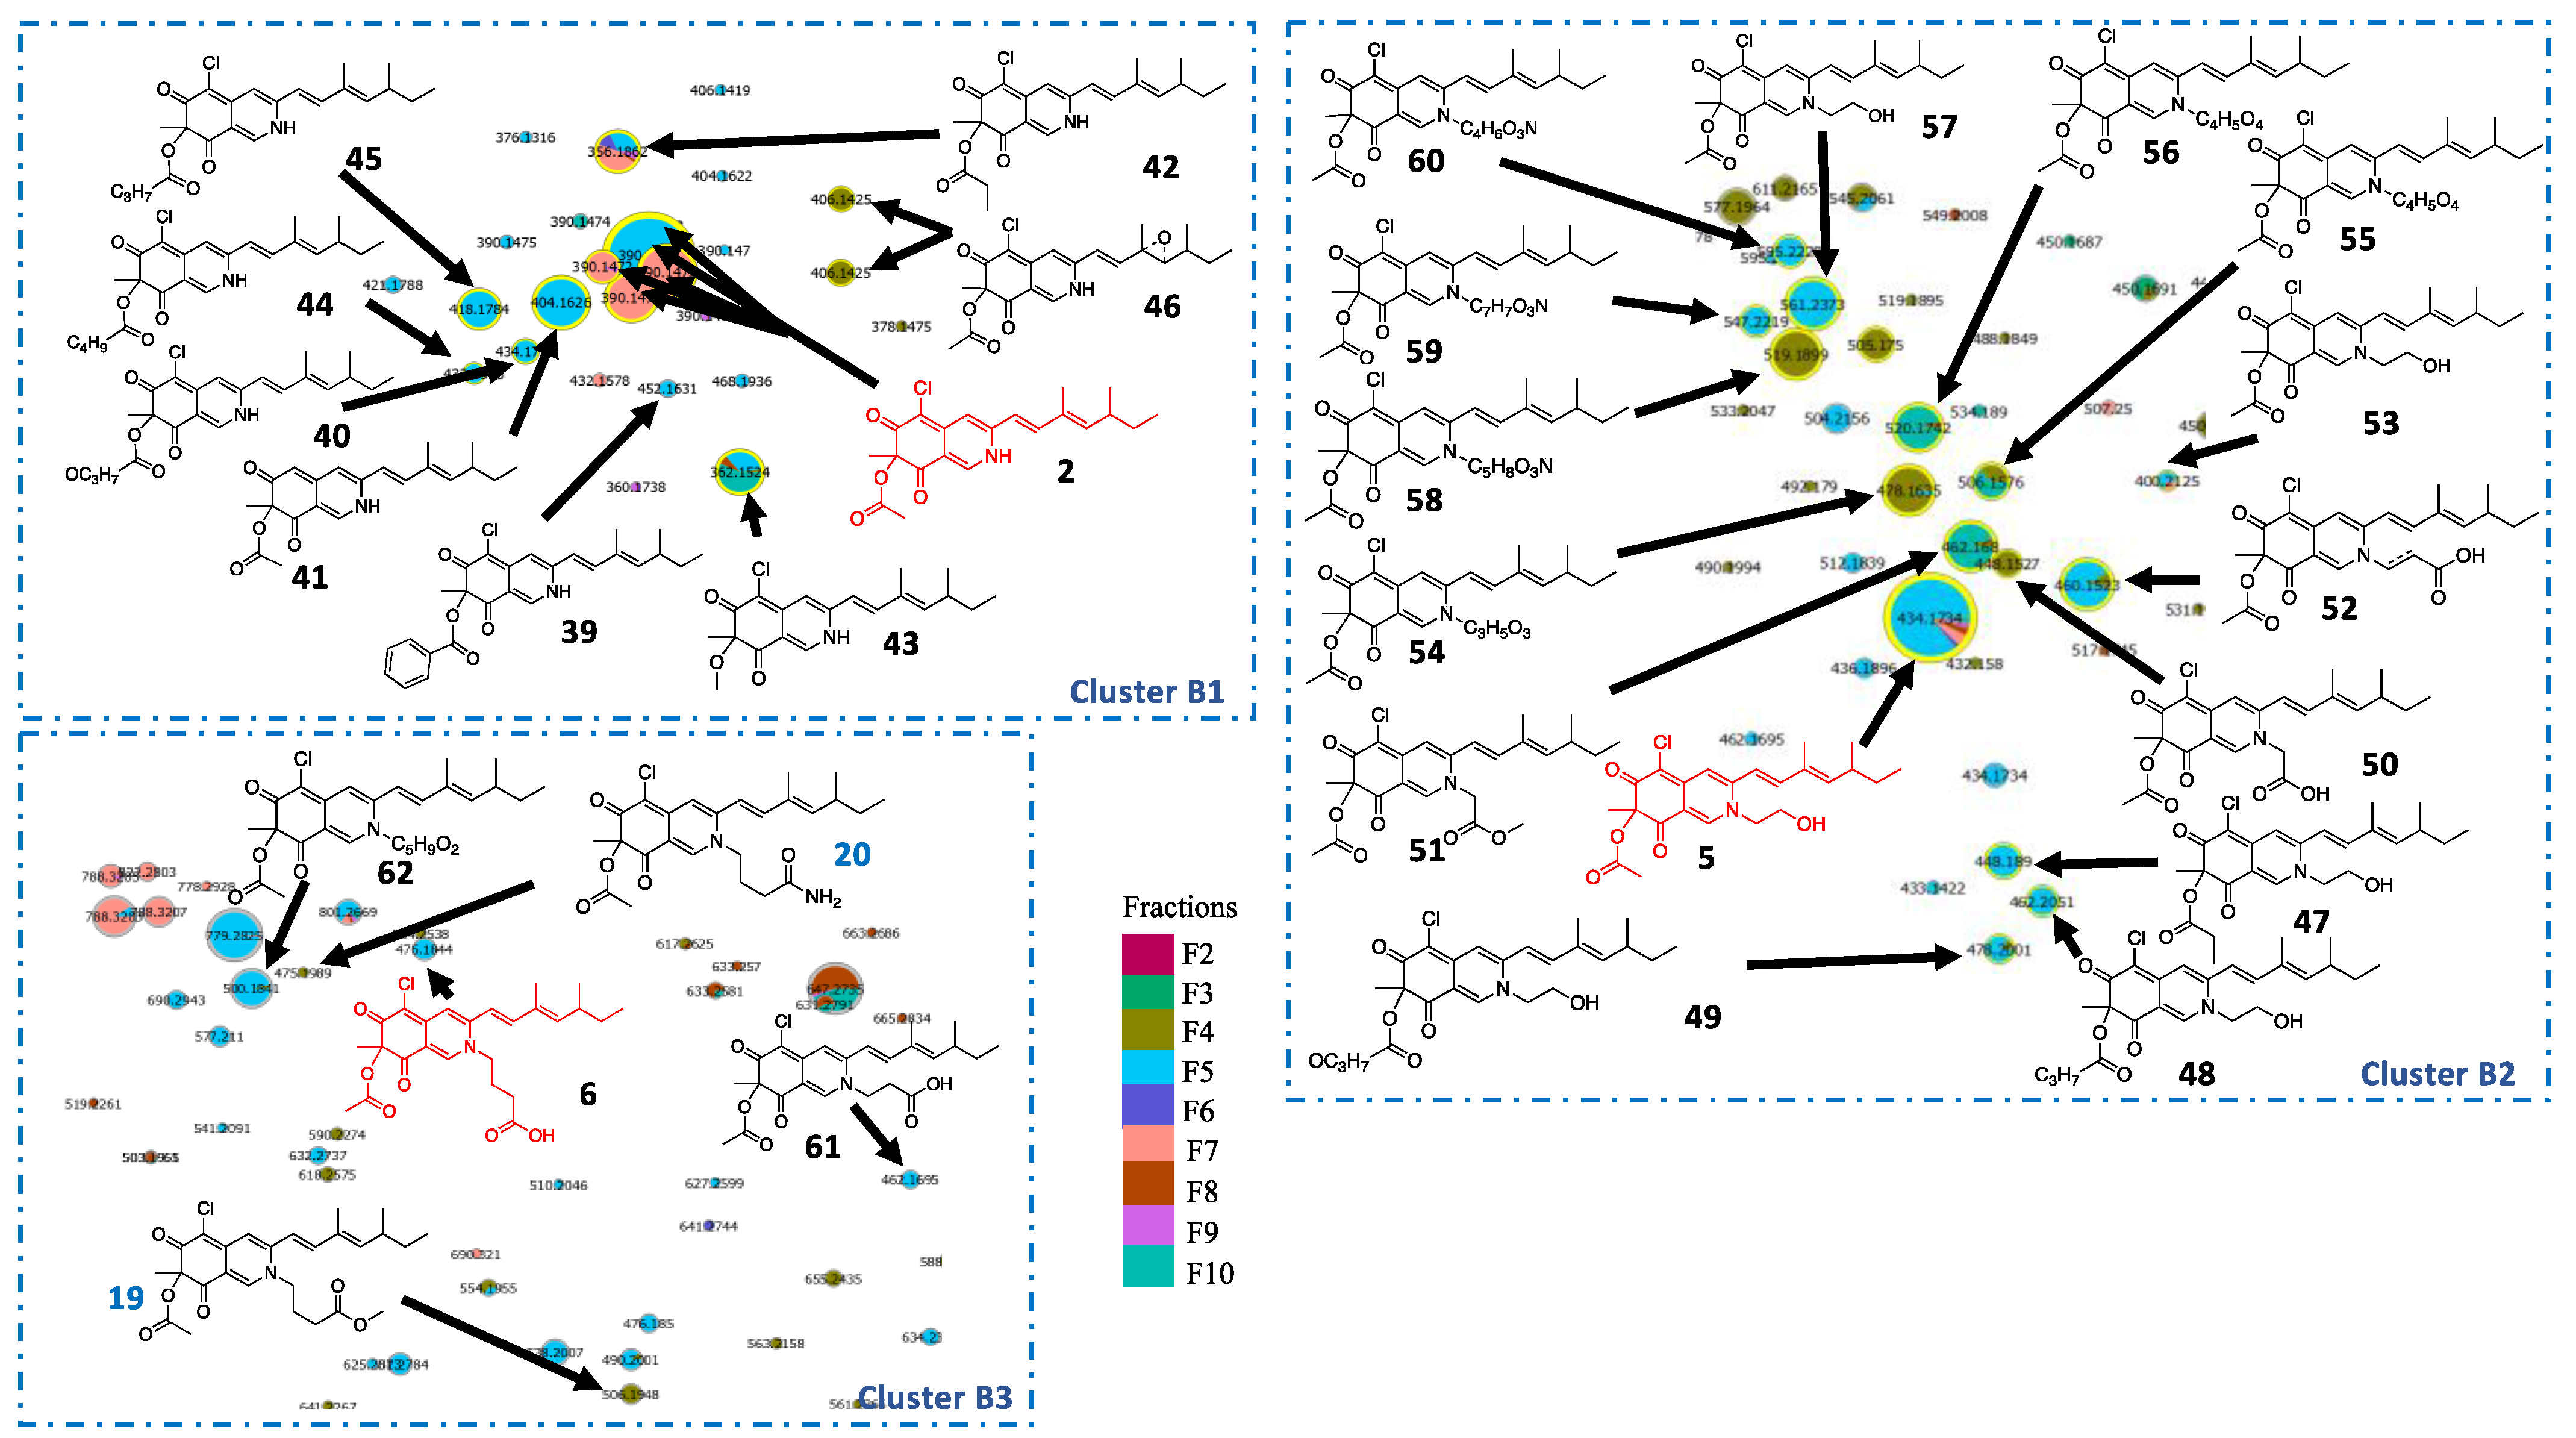
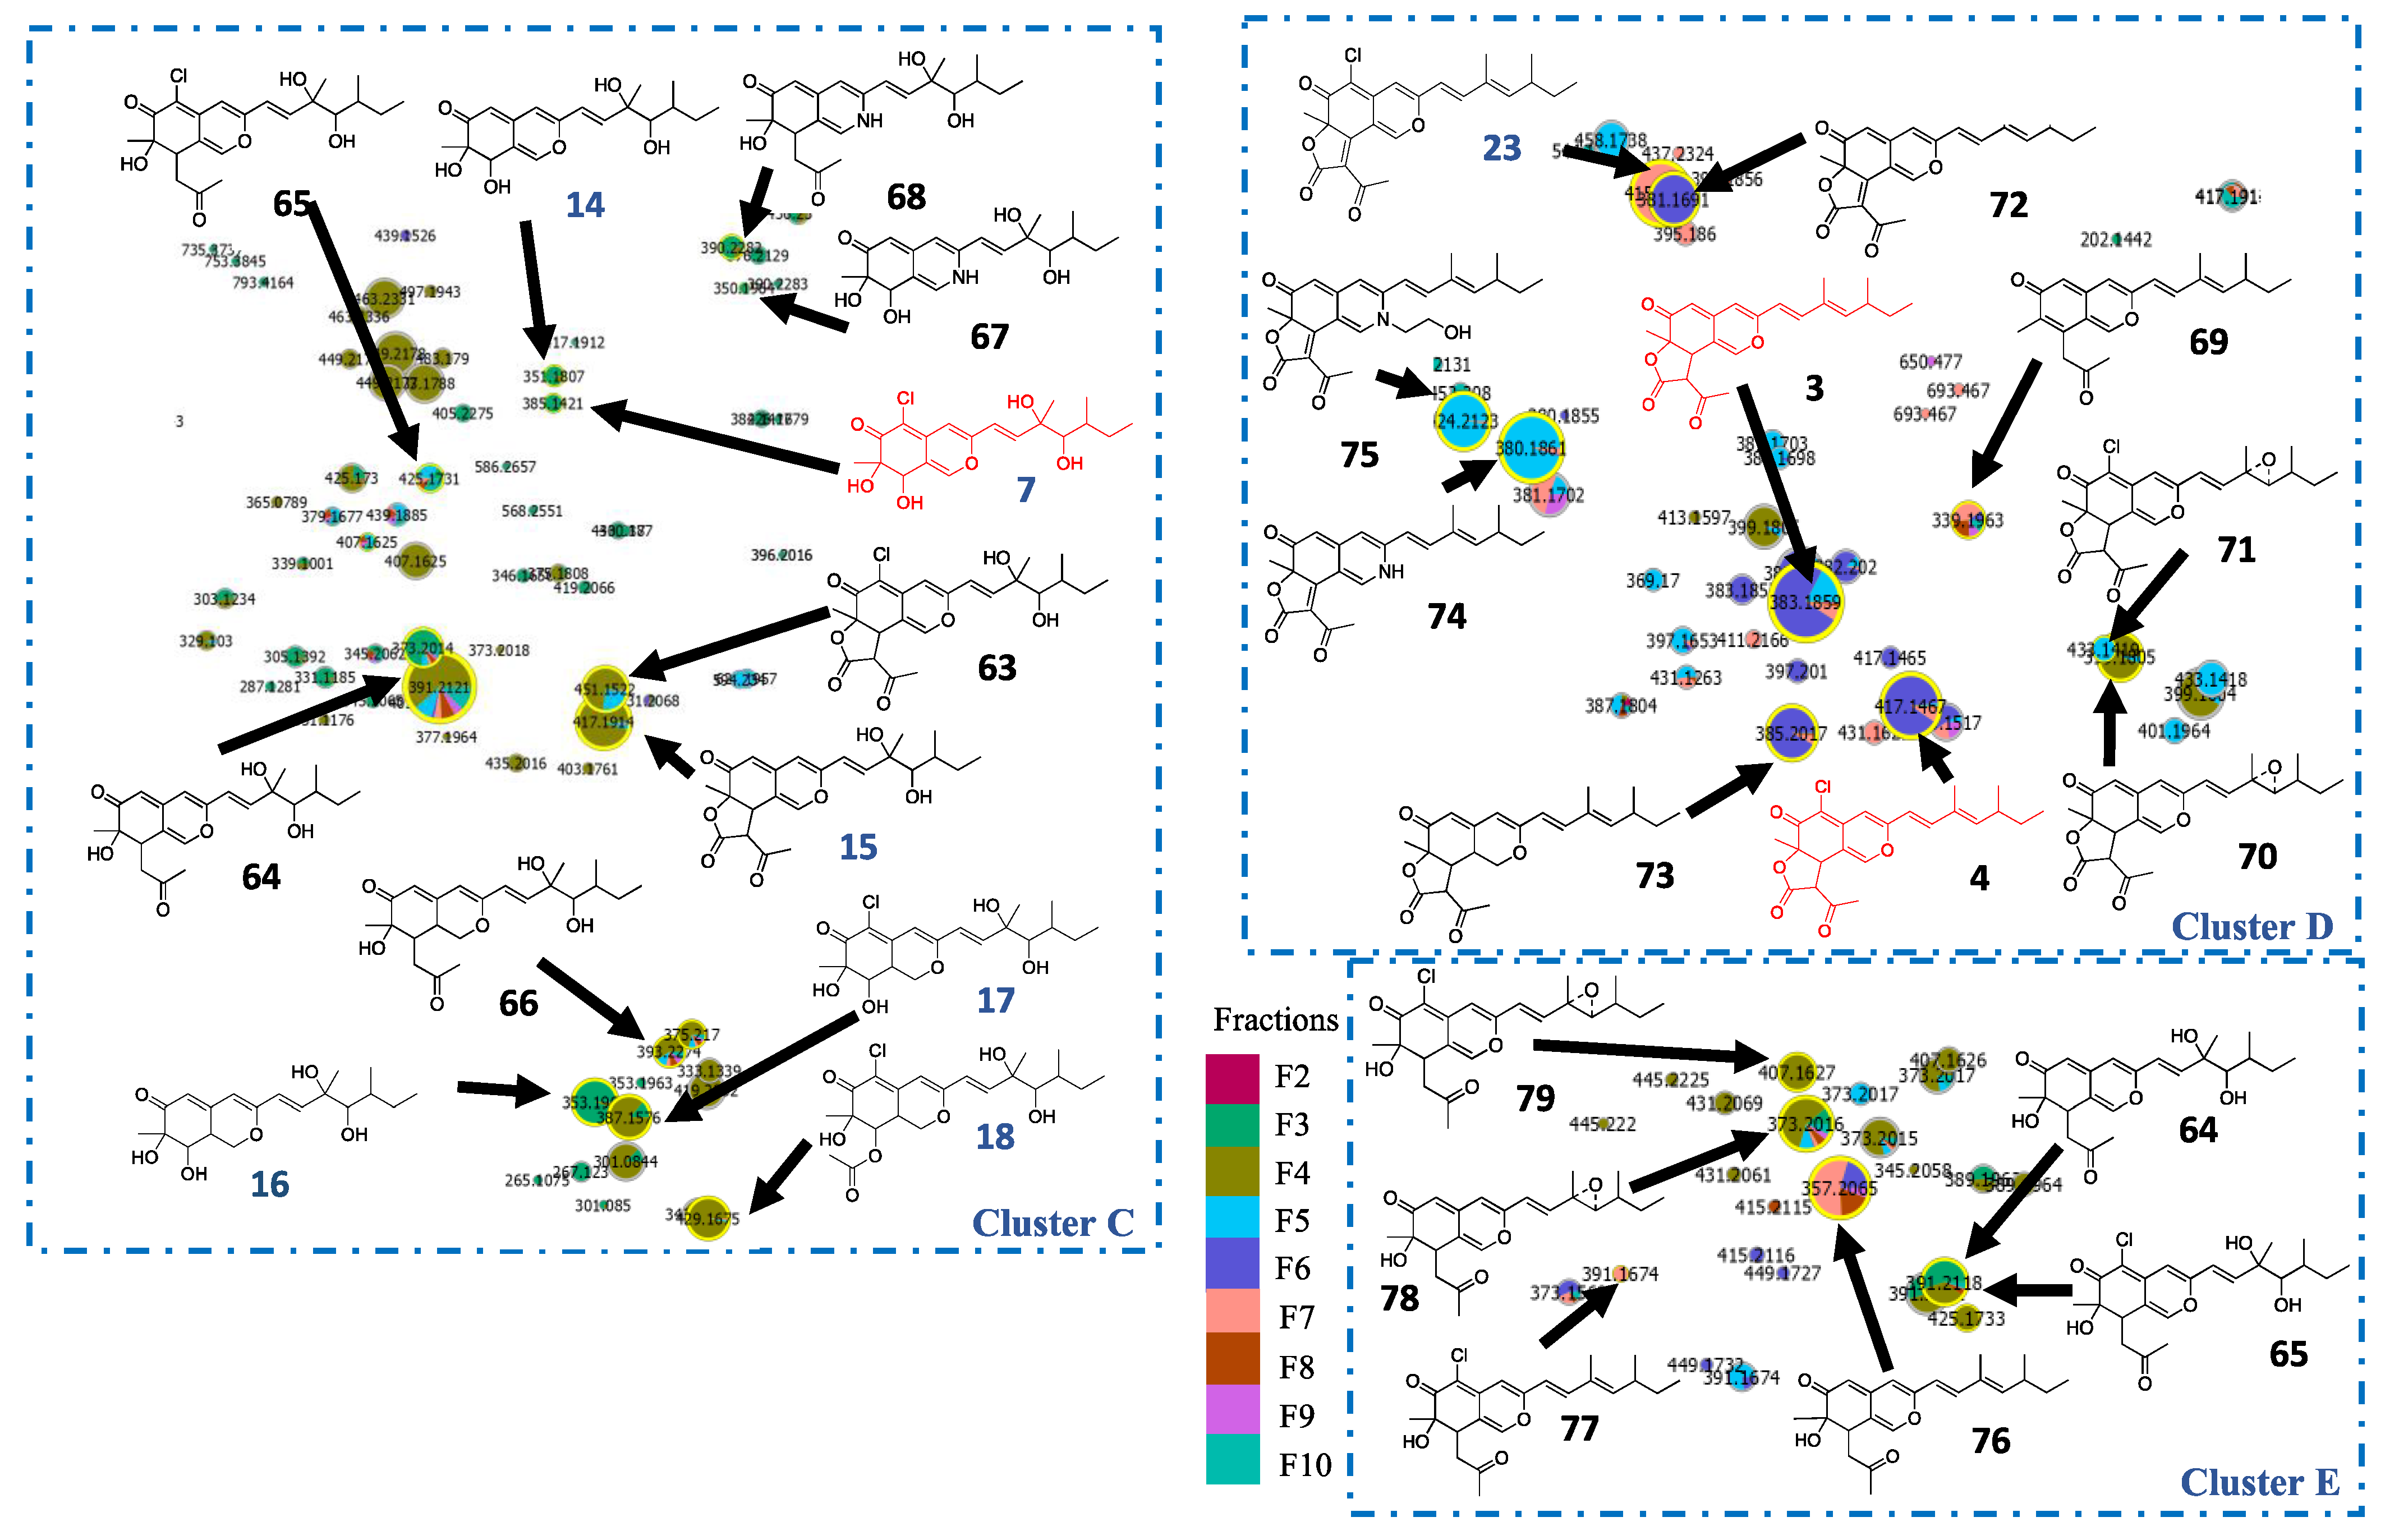
2.3. In Silico Azaphilone Structure Prediction Using MS/MS Data and a t-SNE Molecular Network

According to the first in silico dereplication steps, 4 distinct subclasses of azaphilone produced by the P. sclerotiorum SNB-CN111 strain were uncovered. In fact, these azaphilone subclasses presented one or several modifications of the same scaffold, including acylations on R1, a lactone ring at R1–R2, the presence of an oxygen or a functionalized nitrogen on Y, a diol or a methylethylene at R3–R4 and finally chlorine or hydrogen at position X. (Figure 2). Isolated or synthetic azaphilones do not display all this combinatorial diversity in the literature [21]. To further annotate the azaphilone-related metabolome from the P. sclerotiorum SNB-CN111 strain, all available chemical information, including MS/MS data, chemical formulas, biosynthetic pathways and literature surveys, was gathered and combined. Five distinct clusters were analyzed in more detail (Figure 3, Figure 4 and Figure 5).
First, cluster A, containing annotated sclerotiorin (1), isochromophilone IV (21) and sclerketide B isomer (22), was clearly separated from others on the t-SNE molecular network. Two nonchlorinated analogs, 24 and 25, of these three compounds were first annotated according to exact mass measurements below 5 ppm, isotopic patterns, MS/MS data and high cosine score values of 0.93 and 0.81 for pairs 1/24 and 22/25, respectively. In particular, three common neutral losses of 42.0106, 60.0211 and 88.0160 Da, related to the losses of C2H2O, C2H4O2, and C3H4O3, were observed in the spectra of acetylated azaphilones 1 and 24. Similarly, propionated compounds 22 and 25 led to losses of 56.0262, 74.0368 and 102.0317 Da, corresponding to the neutral losses of C3H4O, C3H6O2 and C4H6O3, respectively. This observation, supported by the literature evidence for the fragmentation of protonated esters [33,34,35,36], suggests that the nature of the acyl group can be identified from this typical fragmentation pattern, as described in Figure 4.
According to this first rule of azaphilone fragmentation, compounds 26 and 27 were annotated as sclerotiorin analogs with butanoyl groups at R1 (Figures S29 and S30), whereas compounds 28 and 29 were annotated as sclerotiorin analogs with pentanoyl groups (Figures S31 and S32). Protonated nonacetylated compounds 30 and 31 were also detected (Figures S33 and S34). For these two particular compounds, fragments at m/z 181.0051 were observed for chlorinated molecule 30 and at m/z 147.0441 for hydrogenated molecule 31 (Figures S33 and S34). Dechlorosclerotiorin (32), dechlorobenzoylsclerotiorin (33), aminobenzoylsclerotiorin (34), 5-epoxysclerotiorin (35), benzoylsclerotiorin (36) and methoxysclerotiorin (37) were similarly annotated in cluster A. Finally, compound 38 was annotated as an analog of molecule 26 with hydroxylation on the butanoyl moiety (Figures S35–S41).
Using the same methodology, subclusters B1 and B2, initially containing molecules 2 and 5, respectively, were further annotated with (Figure 4) compounds 39–46 in cluster B1 (Figure 5) and compounds 47–49 in cluster B2 (Figures S42–S52). These two subclusters were close in t-SNE MN, allowing us to deduce that they exhibit strong structural similarities. Because nitrogenated azaphilones spontaneously transform from their oxygenated analogs, molecule 42 can be annotated by comparison with compound 22 [21]. The two molecules had a cosine score of 0.61 and shared eight neutral losses. It was also observed in cluster B2 that compound 5 is an analog of compound 2 with an ethanol function on its nitrogen. Moreover, nitrogen-substituted azaphilones 5, 6, 19 and 20 were annotated on the northern part of t-SNE MN. Thus, cluster B2 only contained azaphilones 50 to 60 with substituted nitrogen (Figures S53–S63). Molecules 61 and 62 in cluster B3, initially containing molecule 6, were finally annotated, taking into account the same hypothesis (Figures S64–S65).
Cluster C, containing hypocrellone A (7), was then annotated. As previously described in the other clusters, a chlorinated analog of 7 was observed (63) (Figure 6 and Figure S66). Two common neutral losses of 86.0732 (C5H10O) and 132.0786 (C6H12O3) were detected for compounds 7, 14–17 and 63. Compound 64 and its chlorinated analog 65 also exhibited the neutral loss of 132.0786 Da (Figures S67 and S68), leading to the formation of intense fragments at m/z 259.1329 and 293.0939, respectively. The same fragments were found for compounds 15 and 63 formed from the C6H12O3 moiety and the loss of CO2 from their lactone rings. Analogs with one less unsaturated 66 and nitrogen analogs 67 and 68 were also observed (Figures S70 and S71).
In cluster D, containing compound 3 analogs, molecules 70 and 71 bear epoxyde groups on alkyl chains, indicating that they are key intermediates between molecules 3/4 and 15/24 (Figures S73 and S74) [37,38]. Compounds 72–75 were annotated as unchlorinated azaphilone analogs exhibiting a lactone ring (Figures S75–S78).
Finally, 76 and 77, already isolated in a previous study, were identified in cluster E, as well as 78 and 79, epoxide intermediates between 7677 and 6465 (Figures S79–S82) [39].

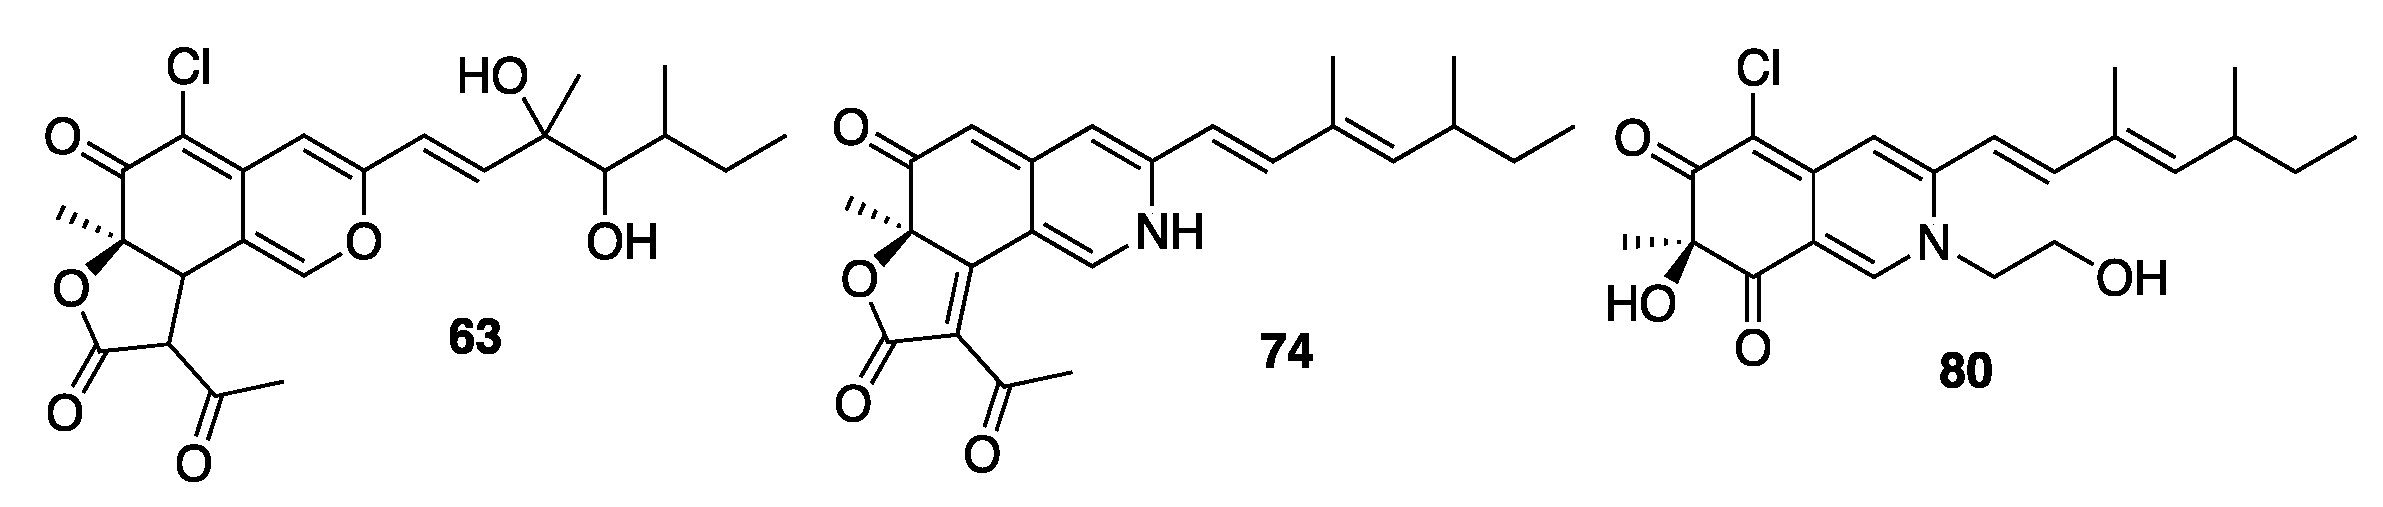
2.4. Isolation and Characterization of Compounds

To confirm the in silico annotation, azaphilones from the most active fractions on T. rubrum (Figure S8) were isolated for complete structural elucidation. Annotated and known compounds 1, 2, 5, 23 and 75 or newly annotated compounds 63, 74 and 80 were thus purified and structurally characterized (Figure 7). The four known compounds were identified by 1H and 13C NMR and data comparison with the literature (Tables S1 and S2, Figures S83–S96) [40]. Additional HSQC, COSY and HMBC experiments completed the characterization of 63, 74 and 80 (Figure S117).
Compound 63 was obtained as a yellow oil, and its molecular formula was determined to be C23H27ClO7 based on the ESI–HRMS experiment ([M + H]+ peak at m/z 451.1523 calcd for C23H27ClO7H+, 451.1518, err. −1.1 ppm). The similarity of NMR data with compound 3 (Tables S1 and S2) indicated the presence of a lactone ring and a chlorine atom on carbon 5. Thus, 1H NMR and 13C spectroscopic data of 63 were analyzed and compared with the literature [25,41]. The azaphilone scaffold was identified by HMBC correlations of H1/C-3, C-4a, C-5 and C-8, H4/C-3, C-5, C-8, C-8a and H18/C-6, C-7, C-8, downfield chemical shifts of C-1 (δC 146.5) and C-3 (δC 157.3) and chemical shifts from ketocarbonyl carbon C-6 (δC 184.5). The side chain was connected to C-3 by the HMBC correlation of H-9 and H-10. The lactone moiety was confirmed by the presence of four additional carbon resonances comprising two carbonyls (δC 199.7 and 168.1), one methine (δC 57.3), one methyl group (δC 30.3), a COSY correlation between H-8 and H-3″ and HMBC from H-3″/C-2″. Ketocarbonyl carbon C-4″ and C-5″ were connected to C-3″ by HMBC correlation of H3″/C4″ and H5″/C3″, C4″. The chlorine atom was positioned on C-5 because it had no HSQC correlation. Finally, a typical correlation of transcoupled olefinic protons was observed in COSY with correlations between H-9/H-10, H-17/H-12/H-13/H-16 and H-13/H-14/H-15 (43). Observation of two carbons, C-11 (δC 75.9 ppm) and C-12 (δC 78.4 ppm), displayed hydroxylated carbon chemical shifts and permitted the establishment of the side chain as 3,5-dimethylhept-1-ene-3,4-diol (Figures S97–S102, S117, Tables S1 and S2). This attribution is in accordance with the reported NMR characterization of 15, an analog of 63 without chlorine at position X [25]; this compound was named chlorogeumasnol.
Molecule 74 was isolated as a purple amorphous oil, and its molecular formula was determined to be C23H26NO4 based on ESI–HRMS data ([M + H]+ at m/z 380.1863, calcd for C23H25NO4H+, 380.1856, err. −1.8 ppm). The 3,5-dimethyl-1,3-heptadienyl unit, the azaphilone scaffold and their connection were identified as described for 63. The lactone ring was established with the HMBC correlation of H-5″ with C-4″, C-3″ and C-2″ and by comparison with its analog described in the literature [28,32] (Figures S103–S108, S117, Tables S1 and S2). Compound 74 was named peniazaphilone E.
Compound 80 exhibited a high peak intensity in LC–MS and was close to cluster D in t-SNE MN (Figure S109). By studying MS/MS fragmentation, compound 80 was expected to be an analog of 5 with a hydroxyl group at R1 (Figure S110). Compound 80 was obtained as a red oil, and its molecular formula was determined to be C21H27ClNO4 based on the ESI–HRMS experiment ([M + H]+ peak at m/z 392.1604 calcd for C21H26ClNO4H+, 392.1623, err. 4.9 ppm). The 3,5-dimethyl-1,3-heptadienyl unit, the azaphilone scaffold and their connection were identified as described for 63. The ethanol chain was established by the COSY correlation between H1′ and H2′, as well as the C1′ (δC 56.6) and C2′ (δC 60.5) chemical shifts and HMBC correlation of H-1/C-1′ (Figures S111–S117, Tables S2 and S3). Molecule 80 was named 7-deacetylisochromophilone VI.
Crystal structures for molecules 1 and 5 were obtained, allowing us to determine the absolute configuration of each chiral carbon atom (Figures S118–S121, Tables S3–S15). Thus, the absolute configuration of C-7 of all other isolated compounds was determined by comparison of the circular dichroism of each isolated molecule with compounds 1 and 5.
All isolated compounds were tested on two fungal human pathogens and showed moderate MICs (Table 1). Molecules 1, 2 and 23 displayed the best activities against T. rubrum, with MICs of 32, 64 and 32 µg.mL−1, respectively. Only compound 23 showed anticandidal activity, with an MIC of 64 µg.mL−1. In the literature, an enantiomer on position 7 of rubrotiorin (23) is reported with an IC50 of 0.6 µg.mL−1 on Candida albicans [42].

3. Discussion

P. sclerotiorum SNB-CN111 specialized metabolism was deeply examined among 109 extracts of microorganisms associated with termites from French Guiana. This strain showed both antimicrobial biological activity and a wide variety of molecules from the azaphilone class.
The LC–MS/MS and in silico dereplication process provided an example of how an extended analysis of MS/MS data can lead to large-scale azaphilone annotation. First, it could be demonstrated that the fractionation of the crude extract allowed a better dereplication of the azaphilones. The number of features increased from 382 to 2953, leading to a more complete MN using t-SNE visualization. However, only a few azaphilones were dereplicated by querying the MS/MS. To enlarge our annotation, a literature survey was performed. Height azaphilones were annotated after this second dereplication step coming from the isolation process (14–21). Eight additionally reported compounds not detected by the first dereplication round were then identified thanks to our in silico strategy: 24, 34, 35, 40, 72 and 75–77 [32,39].
In silico strategies were tested, but the results were not satisfactory enough for azaphilone analogs [43,44,45,46]. Indeed, in silico strategies display 17–25% to 87–93% annotation accuracy for “known–unknown” metabolites, depending on the database boost [46]. However, these strategies do not perform correctly for “unknown–unknown” metabolites derived from enzymatic and chemical transformation or for original structures, as was the case for azaphilones extracted from P. sclerotiorum SNB-CN111. At present, there is a need to increase our ability to accurately annotate “unknown–unknown” characteristics to identify compounds that cannot be isolated for various reasons.
The primary annotation based on HRMS data permitted us to differentiate analogs with and without chlorine atoms on the carbon at position 5 due to a typical difference of 33.9610 combined with a change in isotopic pattern related to the characteristic abundance of 37Cl [47,48]. Interestingly, only two unchlorinated N-azaphilones (41 and 53) were observed. It was supposed that chlorine atoms contribute to azaphilone scaffold affinity for primary amines by electroattractive effects. The nature of the acylation on the hydroxyl at position 7 was simply identified according to typical neural losses, as described in Figure 4. In this way, four different acylations of azaphilone, i.e., acetylation, propionylation, butanoylation and pentanoylation, were systemically associated with three different azaphilone scaffolds (1/22/26/28, 2/42/45/44, 24/25/27/29). As expected when performing reverse-phase LC, the CH2 increment linearly increased the retention time of each molecule (Figure S121). More unique modifications, such as benzoyl and hydroxylation of the acyl moiety, were also identified. Moreover, for azaphilones bearing a benzoylation (33, 34, 36), the benzoyl moiety leads to the formation of the main ion fragment, whereas the azaphilone scaffold constitutes the neutral loss (Figures S36 and S37, S39). In contrast, for azaphilone with linear acylation, the acyl moiety is the main neutral loss, and azaphilone is the main ion fragment. This particular fragmentation pathway due to the presence or absence of a labile proton at position α of the carbonyl was previously described for mitorubrin azaphilone [35].
One of the specificities of azaphilone chemistry is its capacity for spontaneous conversion of oxygen atoms into nitrogen groups at position 2. Thus, a mass shift of 0.9843 between the compounds is directly related to the spontaneous exchange of O by NH. Neutral losses of 71.9844 corresponding to the loss of a CO2 group from the lactone ring and CO from the azaphilone scaffold were then observed (3, 4, 15, 63, 75, 76). Furthermore, four pairs of azaphilones and their diol analogs were found (3/15, 4/63, 64/76 and 66/77), indicating a monooxygenase-epoxide hydrolase pathway. Due to a mass shift of 15.9956, the presence of an epoxide on two particular azaphilones was hypothesized (70, 71). Four trios of azaphilone, including epoxy-azaphilone and diol-azaphilone, were finally annotated (3/70/15, 4/71/63, 76/78/64 and 77/79/65). The azaphilones with a lactone in R1 and R2 were positioned in cluster D, and those with diols in R3 and R4 were positioned in cluster C. Overall, five combinatorial modifications of azaphilone were identified. Thanks to the study of their specific fragmentation patterns by MS/MS, the biosynthesis pathway of azaphilones was proposed in line with the literature (Figure 8) [21,37,38,47,48]. All annotations were confirmed and validated by the isolation of compounds 1, 2, 5, 23, 63, 74 and 75 identified in the molecular network.
The highest activities related to fractions F6, F7 and F8 were linked to features depicted in clusters A, B1, B3 and D. Many of the azaphilones grouped in these clusters were minor compounds, and only 1, 2, 5, 23, 63, 74, 75 and 80 were isolated and structurally characterized. Experimental MIC measurements using these pure compounds confirmed moderate activities against human pathogens. It can be assumed either that the most active molecule(s) have not been isolated thus far due to low abundance in the fractions or that azaphilones have synergistic activities.
Another property of azaphilones is their strong absorbance, which results in yellow, orange, red or violet molecules. For example, compound 1 shows a maximum absorbance at 361 nm, 5 at 370 nm and 23 at 356 nm [7,30,49]. When using acetonitrile as the solvent, molecules 74 and 75 also exhibit two maximal absorbances at 424/548 nm and 428/541 nm, respectively.

4. Materials and Methods

4.1. General Experimental Procedures

Optical rotations were measured at 20 °C in acetonitrile using an Anton Paar MCP 300 polarimeter in a 100-mm-long 350 μL cell. UV spectra were recorded at 20 °C in acetonitrile or methanol using a PerkinElmer Lambda 5 spectrophotometer. Electronic circular dichroism spectra were acquired at 20 °C in acetonitrile on a JASCO J-810 spectropolarimeter. NMR spectra were recorded on Bruker 300, 500, 600 and 700 MHz spectrometers (Bruker, Rheinstetten, Germany). The chemical shifts (δ) are reported as ppm based on the solvent signal, and coupling constants (J) are in hertz. Preparative HPLC was conducted with a Gilson system equipped with a 322 pumping device, a GX-271 fraction collector, a 171 diode array detector and a prep ELSII. All solvents were HPLC grade, purchased from Sigma-Aldrich (Saint-Quentin-Fallavier, France).

4.2. Isolation and Identification of Termite Mutualistic Microorganisms

4.2.1. General Identification Procedure

The taxonomic marker analyses were externally performed by BACTUP, France. The identification of the fungi was conducted by amplification of the ITS4 or ITS1 region of ribosomal DNA and the bacterial isolates were identified on the basis of 16S rDNA sequence analysis. The sequences were aligned with DNA sequences from GenBank, NCBI (http://www.ncbi.nlm.nih.gov, accessed on 7 June 2021), using BLASTN 2.2.28. The sequences were deposited in the GenBank for accession numbers.

4.2.2. Isolation and Identification of Penicillium Sclerotiorum SNB-CN111

The strain was isolated from a Nasutitermes similis termite aerial nest sampled in Piste de Saint-Elie (N 05° 01,838′ W 052° 44,606′) in French Guiana. The strain SNB-CN111 from the strain library collection at ICSN was identified as Penicillium sclerotiorum. A sample submitted for amplification and nuclear ribosomal internal transcribed spacer region ITS4 sequencing allowed for strain identification by NCBI sequence comparison. The sequence has been registered in the NCBI GenBank database (http://www.ncbi.nlm.nih.gov, accessed on 4 September 2013) under registry number KJ023726.

4.3. Culture and Extraction of Microorganisms

4.3.1. General Cultivation and Extraction Procedure

All strains, including bacteria, were cultivated on solid PDA medium at 26 °C for 15 days, on 3 Petri dishes of 14 cm diameter (150 cm2). On a large scale, the microorganisms were cultivated under the identical conditions with 130 Petri dishes of 14 cm diameter (2 m2). The contents of the Petri dishes were transferred into a large container and macerated with EtOAc for 24 h. The organic solvent was collected by filtration under vacuum, washed with water in a separating funnel and evaporated to dryness under reduced pressure.

4.3.2. Extraction of SNB-CN111

P. sclerotiorum was cultivated on 330 Petri dishes (14 cm diameter) at 28 °C for 15 days on potato dextrose agar (PDA) medium (Dominique Dutscher SAS, Brumath, France). The culture medium containing the mycelium was cut into small pieces and macerated three times at room temperature with ethyl acetate (EtOAc) on a rotary shaker (70 rpm) for 24 h. The contents were extracted with 10 L of EtOAc using a separatory funnel. Insoluble residues were removed via filtration and the organic phase was washed three times with an equivalent volume of water (H2O), dried with anhydrous solid Na2SO4 and then evaporated using a rotary evaporator under reduced pressure and temperature of 30 °C to yield a crude extract (6.5 g).

4.4. Isolation of Compounds

The whole crude extract was fractionated by reversed-phase flash chromatography (Grace Reveleris, Grace, MD, USA) using a 120 g C18 column and ultraviolet (UV) and evaporative light scattering detectors (ELSDs). A linear gradient of H2O/formic acid (99.9/0.1) (A)–acetonitrile/formic acid (99.9/0.1) (B) (from 5% B to 100% B in 40 min, flow rate at 80 mL · min−1) followed by a second gradient of acetonitrile/formic acid (99.9/0.1) (B)–methylene chloride (C) (from 50% C to 100% C in 15 min, flow rate at 80 mL · min−1) was performed to generate 11 fractions labeled F1 to F11. F5 (810 mg) was refractionated by reversed-phase flash chromatography using a 40 g C18 column and ultraviolet (UV) and evaporative light scattering detector (ELSD). A linear gradient of H2O/formic acid (99.9/0.1) (A)–acetonitrile/formic acid (99.9/0.1) (B) (60% B for 10 min, 60% B to 65% B for 6 min, 65% B to 75% B for 4 min then 100% B for 10 min, flow rate at 80 mL · min−1) followed by a second gradient of acetonitrile/formic acid (99.9/0.1) (B)–methylene chloride (C) (50% C to 100% C in 15 min, flow rate at 80 mL · min−1) was performed to generate 9 fractions labeled F5F1 to F5F9.
Fractions of interest (F5F2, F5F3, F5F4, F5F5, F6 and F7) were submitted to preparative HPLC. Further fractionation of F5F2 (H2O/formic acid (99.9/0.1) (A)–acetonitrile/formic acid (99.9/0.1) (B) gradient, 48% B for 5 min, 48% B to 55% B in 15 min and 100% B for 5 min) led to the isolation of the new compound 63 (1.2 mg, tR = 11.1 min), peniazaphilone A (75, 1.8 mg, tR = 13.6 min) and isochromophilone VI (5, 30 mg, tR = 16.0 min). Further fractionation of F5F3 (H2O/formic acid (99.9/0.1) (A)–acetonitrile/formic acid (99.9/0.1) (B) gradient, 48% B for 5 min, 48% B to 55% B in 15 min and 100% B for 5 min) led to the isolation of the new compound 74 (2.2 mg, tR = 17.0 min). Further fractionation of F5F4 (H2O/formic acid (99.9/0.1) (A)–acetonitrile/formic acid (99.9/0.1) (B) gradient, 50% B for 30 min and 100% B for 5 min) led to the isolation of sclerotioramine (2, 8 mg, tR = 15.0). Further fractionation of F5F5 (H2O/formic acid (99.9/0.1) (A)–acetonitrile/formic acid (99.9/0.1) (B) gradient 60% B to 75% B in 30 min and 100% B for 5 min) led to the isolation of new compound 80 (0.56 mg, tR = 5.3 min). Further fractionation of F6 (H2O/formic acid (99.9/0.1) (A)–acetonitrile/formic acid (99.9/0.1) (B) gradient, 65% B in 30 min) led to the isolation of sclerotiorin (1, 6 mg, tR = 15.2 min). Further fractionation of F7 (H2O/formic acid (99.9/0.1) (A)–acetonitrile/formic acid (99.9/0.1) (B) gradient, 70% B to 80% B in 20 min, 80% B to 85% B in 5 min and 100% B for 5 min) led to the isolation of 5-chloroisorotiorin (23, 13.8 mg, tR = 21.0 gradient, 70% B to 80% B in 20 min).
Sclerotiorin (1): Yellow amorphous oil or yellow needles; [α]20D 200 (c 0.1 g.L−1, ACN), UV (ACN) λmax (ε), 286 nm (4 100 Lmol−1.cm−1), 361 nm (9 800 Lmol−1.cm−1) UV (meOH) λmax (ε), 271 nm (16 000 Lmol−1.cm−1), 385 nm (21 300 Lmol−1.cm−1), 1H NMR (600 MHz, CDCl3) δH 7.90 (1H, s, H-1), 6.61 (1H, s, H-4), 6.51 (1H, d, J = 15.9 Hz, H-9), 7.03 (1H, d, J = 15.9 Hz, H-10), 5.67 (1H, d, J = 10.0 Hz, H-12), 2.445(1H, sept, J = 7.0 Hz, H-13), 1.39 (1H, sept, J = 7.0 Hz, H-14a), 1.29 (1H, sept, J = 7.0 Hz, H-14b), 0.83 (3H, t, J = 7.5 Hz, H-15), 0.98 (3H, d, J = 6.8 Hz, H-16), 1.81 (3H, s, H-17), 1.53 (3H, s, H-18), 2.13 (3H, s, H-20), 13C NMR (600 MHz, CDCl3) δC 152.8 (CH, C-1), 158.4 (C, C-3), 110.8 (CH, C-4), 138.8 (C, C-4a), 106.6 (C, -5), 186.0 (C, C-6), 84.7 (C, C-7), 192.0 (C, C-8), 114.8 (C, C-8a), 115.9 (CH, C-9), 143.0 (CH, C-10), 132.2 (C, C-11), 149.0 (CH, C-12), 35.3 (CH, C-13), 30.2 (CH2, C-14), 12.1 (CH3, C-15), 20.2 (CH3, C-16), 12.5 (CH3, C-17), 22.7 (CH3, C-18), 170.3(C, C-19), 20.3 (CH3, C-20), ESI–HRMS m/z [M + H]+ 391.1324 (calcd for C21H23ClO5H+, 391.1307, err. −4.4 ppm).
Sclerotioramine (2): Red amorphous oil; [α]20D 300 (c 0.1 g.L−1, ACN), UV (ACN) λmax (ε), 343 nm (16 400 Lmol−1.cm−1), UV (MeOH) λmax (ε), 331 nm (20,000 Lmol−1.cm−1), 488 nm (1900 Lmol−1.cm−1), 1H NMR (500 MHz, CDCl3) δH 7.93 (1H, s, H-1), 6.86 (1H, s, H-4), 6.13 (1H, d, J = 16.1 Hz, H-9), 7.04 (1H, d, J = 16.7 Hz, H-10), 5.69 (1H, d, J = 9.9 Hz, H-12), 2.47 (1H, sept, J = 7.0 Hz, H-13), 1.40 (1H, sept, J = 7.0 Hz, H-14a), 1.30 (1H, sept, J = 7.0 Hz, H-14b), 0.84 (3H, t, J = 7.5 Hz, H-15), 0.99 (3H, d, J = 6.8 Hz, H-16), 1.83 (3H, s, H-17), 1.57 (3H, s, H-18), 2.16 (3H, s, H-20), 13C NMR (500 MHz, CDCl3) δC 138.4 (CH, C-1), 146.3 (C, C-3), 110.3 (CH, C-4), 147.1 (C, C-4a), 101.5 (C, -5), 183.7 (C, C-6), 85.4 (C, C-7), 193.3 (C, C-8), 114.2 (C, C-8a), 116.4 (CH, C-9), 142.9 (CH, C-10), 132.0 (C, C-11), 148.7 (CH, C-12), 35.1 (CH, C-13), 30.6 (CH2, C-14), 12.0 (CH3, C-15), 20.1 (CH3, C-16), 12.4 (CH3, C-17), 23.6 (CH3, C-18), 170.9 (C, C-19), 20.6 (CH3, C-20), ESI–HRMS m/z [M + H]+ 390.1460 (calcd for C21H24ClNO4H+, 390.1467, err. 1.7 ppm).
Isochromophilone VI (5): Red amorphous oil or red needles; [α]20D 440 (c 0.1 g.L−1, ACN), UV (ACN) λmax (ε), 371 nm (9 700 Lmol−1.cm−1), UV (MeOH) λmax (ε), 369 nm (13 200 Lmol−1.cm−1), 480 nm (2 200 Lmol−1.cm−1), 1H NMR (500 MHz, CDCl3) δH 7.83 (1H, s, H-1), 7.00 (1H, s, H-4), 6.23 (1H, d, J = 15.0 Hz, H-9), 6.91 (1H, d, J = 15.8 Hz, H-10), 5.68 (1H, d, J = 9.2 Hz, H-12), 2.46 (1H, m, H-13), 1.44 (1H, sept, J = 7.2 Hz, H-14a), 1.32 (1H, sept, J = 7.2 Hz, H-14b), 0.86 (3H, t, J = 7.5 Hz, H-15), 1.00 (3H, d, J = 6.8 Hz, H-16), 1.83 (3H, s, H-17), 1.53 (3H, s, H-18), 2.14 (3H, s, H-20), 3.99 (2H, m, H-1′), 3.91 (2H, m, H-2′), 13C NMR (500 MHz, CDCl3) δC 142.0 (CH, C-1), 144.8 (C, C-3), 111.8 (CH, C-4), 148.5 (C, C-4a), 102.2 (C, -5), 184.4 (C, C-6), 84.9 (C, C-7), 194.0 (C, C-8), 114.6 (C, C-8a), 115.1 (CH, C-9), 145.1 (CH, C-10), 131.7 (C, C-11), 148.0 (CH, C-12), 35.0 (CH, C-13), 30.0 (CH2, C-14), 12.0 (CH3, C-15), 20.2 (CH3, C-16), 12.6 (CH3, C-17), 23.3 (CH3, C-18), 170.2 (C, C-19), 20.3 (CH3, C-20), 55.4 (CH2, C-1′), 60.9 (CH2, C-2′), ESI–HRMS m/z [M + H]+ 434.1731 (calcd for C23H28ClNO5H+, 434.1729, err. −0.5 ppm).
5-chloroisorotiorin (23), orange amorphous oil; [α]20D 200 (c 0.1 g.L−1, ACN), UV (ACN) λmax (ε), 361 nm (8 800 Lmol−1.cm−1), UV (MeOH) λmax (ε), 373 nm (14 700Lmol−1.cm−1), 558 nm (1 700 Lmol−1.cm−1), 1H NMR (500 MHz, MeOD) δH 8.88 (1H, s, H-1), 6.81 (1H, s, H-4), 6.35 (1H, d, J = 17.1 Hz, H-9), 7.20 (1H, d, J = 17.2 Hz, H-10), 5.77 (1H, d, J = 9.7 Hz, H-12), 2.52 (1H, m, H-13), 1.46 (1H, m, H-14a), 1.35 (1H, m, H-14b), 0.89 (3H, t, J = 7.5 Hz, H-15), 1.03 (3H, d, J = 6.5 Hz, H-16), 1.89 (3H, s, H-17), 1.68 (3H, s, H-18), 2.57 (3H, s, H-5″), ESI–HRMS m/z [M + H]+ 415.1300 (calcd for C23H23ClO5H+, 415.1307, err. 1.6 ppm).
Chlorogeumsanol B (63), yellow amorphous oil; [α]20D -160 (c 0.1 g.L−1, ACN), UV (ACN) λmax (ε), 367 nm (8 200 Lmol−1.cm−1), UV (MeOH) λmax (ε), 292 nm (5 000 Lmol−1.cm−1), 386 nm (14 400 Lmol−1.cm−1), 1H NMR (500 MHz, CDCl3) δH 7.42 (1H, s, H-1), 6.56 (1H, s, H-4), 3.84 (1H, d, J = 12.5 Hz, 1H), 6.40 (1H, d, J = 15.5 Hz, H-9), 6.65 (1H, d, J = 15.7 Hz, H-10), 3.49 (1H, d, J = 1.2 Hz, H-12), 1.7 (1H, m, H-13), 1.39 (1H, sept, J = 7.4 Hz, H-14a), 1.31 (1H, m, H-14b), 0.90 (3H, t, J = 7.4 Hz, H-15), 0.95 (3H, d, J = 6.7 Hz, H-16), 1.33 (3H, s, H-17), 1.59 (3H, s, H-18), 3.76 (1H, d, J = 12.5 Hz, H-3″), 2.45 (3H, s, H-5″) δC 146.5 (CH, C-1), 157.3 (C, C-3), 106.1 (CH, C-4), 140.4 (C, C-4a), 113.6 (C, -5), 184.5 (C, C-6), 83.1 (C, C-7), 42.6 (CH, C-8), 110.2 (C, C-8a), 120.2 (CH, C-9), 145.5 (CH, C-10), 75.9 (C, C-11), 78.4 (CH, C-12), 35.5 (CH, C-13), 28.7(CH2, C-14), 12.0 (CH3, C-15), 24.0 (CH3, C-16), 13.5 (CH3, C-17), 23.4 (CH3, C-18), 168.1 (C, C-2″), 57.3 (CH, C-3″), 199.7 (C, C-4″), 30.3 (CH3, C-5″), ESI–HRMS m/z [M + H]+ 451.1523 (calcd for C23H27ClO7H+, 451.1518, err. -1.1 ppm).
Peniazaphilone E (74) purple amorphous oil; [α]20D 330 (c 0.1 g.L−1, ACN), UV (ACN) λmax (ε), 335 nm (12 700 Lmol−1.cm−1), 548 nm (9 100 Lmol−1.cm−1), 424 nm (8 500 Lmol−1.cm−1), UV (MeOH) λmax (ε), 331 nm (2 400 Lmol−1.cm−1), 1H NMR (500 MHz, CDCl3) δH 9.32 (1H, s, H-1), 6.80 (1H, s, H-4), 6.78 (1H, s, H-5), 6.28 (1H, d, J = 16.4 Hz, H-9), 7.57 (1H, d, J = 16.8 Hz, H-10), 5.82 (1H, d, J = 10.4 Hz, H-12), 2.49 (1H, m, H-13), 1.43 (1H, m, H-14a), 1.34 (1H, m, H-14b), 0.86 (3H, t, J = 7.4 Hz, H-15), 0.99 (3H, d, J = 6.7 Hz, H-16), 1.88 (3H, s, H-17), 1.80 (3H, s, H-18), 2.49 (3H, s, H-5″); 13C NMR (300 MHz, CDCl3) δC 141.3 (CH, C-1), 148.8 (C, C-3), 117.1 (CH, C-4), 154.0 (C, C-4a), 99.1 (CH, C,-5), 195.5 (C, C-6), 86.9 (C, C-7), 172.5 (C, C-8), 117.5 (C, C-8a), 116.5 (CH, C-9), 144.6 (CH, C-10), 132.5 (C, C-11), 149.7 (CH, C-12), 35.4 (CH, C-13), 30.3 (CH2, C-14), 12.2 (CH3, C-15), 20.5 (CH3, C-16), 12.4 (CH3, C-17), 29.9 (CH3, C-18), 175.0 (C, C-2″), 101.2 (CH, C-3″), 193.5 (C, C-4″), 28.6 (CH3, C-5″), ESI–HRMS m/z [M + H]+ 380.1863 (calcd for C23H25NO4H+, 380.1856, err. −1.8 ppm).
Peniazaphilone A (75), purple amorphous oil; [α]20D 600 (c 0.1 g.L−1, ACN), UV (ACN) λmax (ε), 338 nm (14 200 Lmol−1.cm−1), 428 nm (12 400 Lmol−1.cm−1), 541 nm (10 900 Lmol−1.cm−1), UV (MeOH) λmax (ε), 342 nm (6 400 Lmol−1.cm−1), 1H NMR (500 MHz, CDCl3) δH 7.92 (1H, s, H-1), 6.77 (1H, s, H-4), 6.29 (1H, d, J = 16.2 Hz, H-9), 6.95 (1H, d, J = 15.8 Hz, H-10), 5.70 (1H, d, J = 9.8 Hz, H-12), 2.46 (1H, m, H-13), 1.43 (1H, sept, H-14a), 1.33 (1H, sept, H-14b), 0.86 (3H, t, J = 7.5 Hz, H-15), 1.00 (3H, d, J = 6.6 Hz, H-16), 1.86 (3H, s, H-17), 1.57 (3H, s, H-18), 4.13 (2H, m, H-1′), 4.06 (2H, m, H-2′), 2.36 (3H, s, H-5″), 13C NMR (500 MHz, CDCl3) δC 142.6 (CH, C-1), 149.8 (C, C-3), 117.0 (CH, C-4), 150.3 (C, C-4a), 98.0 (CH, -5), 194.4 (C, C-6), 85.3 (C, C-7), 171.5 (C, C-8), 117.2 (C, C-8a), 114.8 (CH, C-9), 146.2 (CH, C-10), 132.0 (C, C-11), 149.0 (CH, C-12), 35.1 (CH, C-13), 28.6 (CH2, C-14), 12.0 (CH3, C-15), 20.2 (CH3, C-16), 12.6 (CH3, C-17), 30.2 (CH3, C-18), 55.4 (CH2, C-1′), 60.9 (CH2, C-2′), 172.3 (C, C-2″), 103.6 (C, C-3″), 193.9 (C, C-4″), 30.3 (CH3, C-5″), ESI–HRMS m/z [M + H]+ 424.2134 (calcd for C25H29NO5H+, 424.2118, err. −3.7 ppm).
7-deacetylisochromophilone VI (80), amorphous red oil; [α]20D 60 (c 0.1 g.L−1, ACN), UV (ACN) λmax (ε), 365 nm (3 200 Lmol−1.cm−1), UV (MeOH) λmax (ε), 361 nm (3 300 Lmol−1.cm−1), 1H NMR (500 MHz, DMF-d7) δH 8.10 (1H, s, H-1), 7.01 (1H, s, H-4), 6.7 (1H, d, J = 15.8 Hz, H-9), 7.23 (1H, d, J = 15.7 Hz, H-10), 5.87 (1H, d, J = 9.5 Hz, H-12), 2.53 (1H, m, H-13), 1.43 (1H, m, H-14a), 1.32 (1H, m, H-14b), 0.87 (3H, t, J = 7.4 Hz, H-15), 1.01 (3H, d, J = 6.6 Hz, H-16), 1.92 (3H, s, H-17), 1.41 (3H, s, H-18), 4.38 (2H, m, H-1′), 3.88 (2H, m, H-2′); 13C NMR (700 MHz, DMF-d7) δC 142.6 (CH, C-1), 149.8 (C, C-3), 109.7 (CH, C-4), 145.9 (C, C-4a), 98.8 (C, -5), 187.1 (C, C-6), 83.1 (C, C-7), 197.5 (C, C-8), 115.1 (C, C-8a), 117.2 (CH, C-9), 144.3 (CH, C-10), 133.2 (C, C-11), 146.8 (CH, C-12), 34.8 (CH, C-13), 29.8 (CH2, C-14), 11.8 (CH3, C-15), 20.1 (CH3, C-16), 12.3 (CH3, C-17), 28.2 (CH3, C-18), 56.6 (CH2, C-1′), 60.5 (CH2, C-2′), ESI–HRMS m/z [M + H]+ 392.1604 (calcd for C21H26ClNO4H+, 392.1623, err. 4.9 ppm).

4.5. LC–MS/MS Analysis

Crude extracts of all SNB-CN strains, cultivated on PDA and extracted as previously described for Penicillium sclerotiorum SNB-CN111 together with fractions from Penicillium sclerotiorum SNB-CN111, were prepared at 1 mg.mL−1 in methanol and filtered on a 0.45 µm PTFE membrane. LC–MS/MS experiments were performed with a 1260 Prime HPLC (Agilent Technologies, Waldbronn, Germany) coupled with an Agilent 6540 Q-ToF (Agilent Technologies, Waldbronn, Germany) tandem mass spectrometer. LC separation was achieved with an Accucore RP-MS column (100 × 2.1 mm, 2.6 μm, Thermo Scientific, Les Ulis, France) with a mobile phase consisting of H2O/formic acid (99.9/0.1) (A)–acetonitrile/formic acid (99.9/0.1) (B). The column oven was set at 45 °C. Compounds were eluted at a flow rate of 0.4 mL · min−1 with a gradient from 5% B to 100% B in 20 min and then 100% B for 3 min. The injection volume was fixed at 5 μL for all analyses. For electrospray ionization source, mass spectra were recorded in positive ion mode with the following parameters: gas temperature 325 °C, drying gas flow rate 10 L.min−1, nebulizer pressure 30 psi, sheath gas temperature 350 °C, sheath gas flow rate 10 L.min−1, capillary voltage 3500 V, nozzle voltage 500 V, fragmentor voltage 130 V, skimmer voltage 45 V, Octopole 1 RF Voltage 750 V. For ESI, internal calibration was achieved with two calibrants, purine and hexakis (1 h,1 h,3 h-tetrafluoropropoxy) phosphazene (m/z 121.0509 and m/z 922.0098), providing a high mass accuracy better than 3 ppm. The data-dependent MS/MS events were acquired for the five most intense ions detected by full-scan MS, from the 200–1000 m/z range, above an absolute threshold of 1000 counts. Selected precursor ions were fragmented at a fixed collision energy of 30 eV and with an isolation window of 1.3 amu. The mass range of the precursor and fragment ions was set as m/z 200–1000.
Isolated compounds from Penicillium sclerotiorum SNB-CN111 fractions were prepared at 0.1 mg.mL−1 in methanol and filtered on a 0.45 µm PTFE membrane. The isolated compounds were analyzed according to the same procedure.

4.6. Data Processing and Analysis

The data files were converted from the d standard data format (Agilent Technologies) to mzXML format using MSConvert software, part of the ProteoWizard package 3.0 (21). All mzxml values were processed using MZmine2v51 as previously described [16]. Mass detection was realized with an MS1 noise level of 1000 and an MS/MS noise level of 0. The ADAP chromatogram builder was employed with a minimum group size of scans of 3, a group intensity threshold of 1000, a minimum highest intensity of 1000 and m/z tolerance of 0.008 (or 20 ppm). Deconvolution was performed with the ADAP wavelet algorithm according to the following settings: S/N threshold = 10, minimum feature height = 1000, coefficient/area threshold = 10, peak duration range 0.01–1.5 min and tR wavelet range 0.00–0.04 min. MS/MS scans were paired using a m/z tolerance range of 0.05 Da and tR tolerance range of 0.5 min. Isotopologs were grouped using the isotopic peak grouper algorithm with a m/z tolerance of 0.008 (or 20 ppm) and a tR tolerance of 0.2 min. Peaks were filtered using a feature list row filter, keeping only peaks with MS/MS scans (GNPS). Adduct identification, i.e., sodium- or potassium-cationized species, was performed on the peak list with a retention time tolerance of 0.1 min, a m/z tolerance of 0.008 or 20 ppm and a maximum relative peak height of 150%. A complex search, such as dimers, was performed with a retention time tolerance of 0.1 min, a m/z tolerance of 0.008 or 20 ppm and a maximum relative peak height of 150%. Peak alignment was performed using the join aligner with a m/z tolerance of 0.008 (or 20 ppm), a weight for m/z at 20, a retention time tolerance of 0.2 min and weight for tR at 50. The MGF file and the metadata were generated using the export/submit to GNPS option.
Molecular networks were calculated and visualized using MetGem 1.3 software [14], and MS/MS spectra were window-filtered by choosing only the top 6 peaks in the ±50 Da window throughout the spectrum. The data were filtered by removing all peaks in the ± 17 Da range around the precursor m/z. The m/z tolerance windows used to find the matching peaks were set to 0.02 Da, and cosine scores were kept in consideration for spectra sharing at least 2 matching peaks. The number of iterations, perplexity, learning rate and early exaggeration parameters were set to 5000, 25, 200 and 12 for the t-SNE view.
Figures were generated using R and related packages (ggplot2, Rcolorbrewer and gridextra), MetGem export function and ChemDraw Professional 16.0 (PerkinElmer). NMR spectra were processed and analyzed using TopSpin 3.6.2 (Bruker, Rheinstetten, Germany).

4.7. X-ray Structure Determination of Compounds 1 and 5

Crystals of compounds 1 and 5 were obtained by slow evaporation at 4 °C. A suitable crystal was selected for each of them, mounted on a nylon loop and fixed with oil. Then, X-ray diffraction and crystallographic data were collected at room temperature using redundant ω scans on a Rigaku XtaLabPro single-crystal diffractometer using microfocus Mo Kα radiation and an HPAD PILATUS3 R 200K detector.
Using Olex2 [50], the structures were readily solved by intrinsic phasing methods (SHELXT [51]) and by full-matrix least-squares methods on F2 using SHELXL [52]. The nonhydrogen atoms were refined anisotropically, and most of the hydrogen atoms were identified in difference maps and were treated as riding on their parent atoms.
For each structure, the Flack parameter [53] was refined. The determination of the absolute structure was confirmed by using Bayesian statistics on Bijvoet differences [54] based on the Olex2 results.
All the molecular graphics presented here were computed with Mercury 2020.3.0 [55].
Crystallographic data for the two structures (1 and 5) have been deposited in the Cambridge Crystallographic Data Centre database (the deposition numbers are CCDC 2085749 and CCDC 2085750, respectively). Copies of the data can be obtained free of charge from the CCDC at www.ccdc.cam.ac.uk (accessed on 7 July 2021).

4.8. Biological Assays

The crude extracts and pure isolated compounds were tested on the human pathogenic microorganisms Candida albicans (ATCC 10213), methicillin-resistant Staphylococcus aureus (ATCC 33591) and Trichophyton rubrum (SNB-TR1). The test was performed in conformance with reference protocols from the European Committee on Antimicrobial Susceptibility Testing [56]. The minimal inhibitory concentration value was obtained after 48 h for C. albicans, 24 h for MRSA and 72 h for T. rubrum. Vancomycin (for bacteria) and itraconazole (for fungi) were used as positive controls.
For cytotoxic assays, the crude extracts and isolated compounds were tested in triplicate at concentrations of 10 µg.mL−1 and 1 µg.mL−1 in the MRC5 cell line (ATCC CCL-171, Human Lung Fibroblast Cells), following the procedure described by Tempête et al. [57].

5. Conclusions

We annotated 74 azaphilone analogs, including 49 new molecules. Among them, eight azaphilones were isolated, including three new azaphilones. The structural data are in agreement with the structure predictions from MS/MS data organized in molecular networks. According to the newly established fragmentation pathways, azaphilones can now be efficiently dereplicated in silico in complex mixtures, even if a low amount of samples is available. Large collections of Penicilium can now be screened for the production of undescribed azaphilones, allowing us to better understand their biosynthetic pathways.
This article represents the first study showing the correct and robust annotation, by Moleculare Network methodology, of more than 70 structurally similar azaphilones in plant extracts. This result is due, in part, to the similar structure of the azaphilone-like compounds, but also to the highly specific fragmentation pathways during MS2 experiments. It should also be noted that the annotation was facilitated by the fact that many analogs had already been described in the literature.

Supplementary Materials

The following are available online at https://www.mdpi.com/article/10.3390/metabo11070444/s1, Figures S1–S122 and Tables S1–S17.

Author Contributions

Conceptualization, T.H., D.T., V.E.; methodology, T.H., D.T., V.E.; software, N.E.; validation, T.H., D.T., V.E.; formal analysis, T.H., E.V.E., S.P.; investigation, T.H., D.T., V.E.; resources, V.E.; data curation, T.H., D.T., V.E.; writing—original draft preparation, T.H., V.E.; writing—review and editing, D.T., V.E.; visualization, T.H., V.E.; supervision, D.T., V.E.; project administration, D.T., V.E.; funding acquisition, D.T., V.E. All authors have read and agreed to the published version of the manuscript.

Funding

Téo Hebra thanks the ministère de l’Enseignement supérieur, de la Recherche et de l’Innovation (MESRI) for his PhD fellowship. This work was supported by an “Investissement d’Avenir” grant (CEBA, ref ANR-10-LABX-0025) managed by the French National Research Agency (ANR).

Institutional Review Board Statement

Not applicable.

Informed Consent Statement

Not applicable.

Data Availability Statement

The data presented in this study are available in supplementary materials.

Conflicts of Interest

The authors declare no conflict of interest.

References

  1. Knight, V.; Sanglier, J.-J.; DiTullio, D.; Braccili, S.; Bonner, P.; Waters, J.; Hughes, D.; Zhang, L. Diversifying Microbial Natural Products for Drug Discovery. Appl. Microbiol. Biotechnol. 2003, 62, 446–458. [Google Scholar] [CrossRef]
  2. Harvey, A.L. Natural Products as a Screening Resource. Curr. Opin. Chem. Biol. 2007, 11, 480–484. [Google Scholar] [CrossRef] [PubMed]
  3. Stork, N.E.; McBroom, J.; Gely, C.; Hamilton, A.J. New Approaches Narrow Global Species Estimates for Beetles, Insects, and Terrestrial Arthropods. Proc. Natl. Acad. Sci. USA 2015, 112, 7519–7523. [Google Scholar] [CrossRef] [PubMed] [Green Version]
  4. Brune, A. Symbiotic Digestion of Lignocellulose in Termite Guts. Nat. Rev. Microbiol. 2014, 12, 168–180. [Google Scholar] [CrossRef]
  5. Beemelmanns, C.; Guo, H.; Rischer, M.; Poulsen, M. Natural Products from Microbes Associated with Insects. J. Org. Chem. 2016, 12, 314–327. [Google Scholar] [CrossRef] [Green Version]
  6. Dillon, R.J.; Dillon, V.M. The Gut Bacteria of Insects: Nonpathogenic Interactions. Annu. Rev. Entomol. 2004, 49, 71–92. [Google Scholar] [CrossRef] [PubMed]
  7. Matsui, T.; Tanaka, J.; Namihira, T.; Shinzato, N. Antibiotics Production by an Actinomycete Isolated from the Termite Gut. J. Basic Microbiol. 2012, 52, 731–735. [Google Scholar] [CrossRef] [PubMed]
  8. Zhang, Y.; Li, S.; Jiang, D.; Kong, L.; Zhang, P.; Xu, J. Antifungal Activities of Metabolites Produced by a Termite-Associated Streptomyces canus BYB02. J. Agric. Food Chem. 2013, 61, 1521–1524. [Google Scholar] [CrossRef] [PubMed]
  9. Nirma, C.; Eparvier, V.; Stien, D. Antifungal Agents from Pseudallescheria boydii SNB-CN73 Isolated from a Nasutitermes sp. Termite. J. Nat. Prod. 2013, 76, 988–991. [Google Scholar] [CrossRef]
  10. Nirma, C.; Eparvier, V.; Stien, D. Antibacterial Ilicicolinic Acids C and D and Ilicicolinal from Neonectria discophora SNB-CN63 Isolated from a Termite Nest. J. Nat. Prod. 2015, 78, 159–162. [Google Scholar] [CrossRef]
  11. Nirma, C.; Eparvier, V.; Stien, D. Reactivation of Antibiosis in the Entomogenous Fungus Chrysoporthe sp. SNB-CN74. J. Antibiot. 2015, 68, 586–590. [Google Scholar] [CrossRef] [PubMed]
  12. Sorres, J.; Nirma, C.; Barthélemy, M.; Eparvier, V.; Stien, D. Tyroscherin and Tyroscherin Analogs from Pseudallescheria boydii SNB-CN85 Isolated from Termite Termes Cf. hispaniolae. Phytochem. Lett. 2017, 22, 142–144. [Google Scholar] [CrossRef]
  13. Wang, M. Sharing and Community Curation of Mass Spectrometry Data with Global Natural Products Social Molecular Networking. Nat. Biotechnol. 2016, 34, 828–837. [Google Scholar] [CrossRef] [Green Version]
  14. Olivon, F.; Elie, N.; Grelier, G.; Roussi, F.; Litaudon, M.; Touboul, D. MetGem Software for the Generation of Molecular Networks Based on the T-SNE Algorithm. Anal. Chem. 2018, 90, 13900–13908. [Google Scholar] [CrossRef]
  15. Brel, O.; Touré, S.; Levasseur, M.; Lechat, C.; Pellissier, L.; Wolfender, J.-L.; Van-Elslande, E.; Litaudon, M.; Dusfour, I.; Stien, D.; et al. Paecilosetin Derivatives as Potent Antimicrobial Agents from Isaria farinosa. J. Nat. Prod. 2020, 83, 2915–2922. [Google Scholar] [CrossRef] [PubMed]
  16. Olivon, F.; Grelier, G.; Roussi, F.; Litaudon, M.; Touboul, D. MZmine 2 Data-Preprocessing to Enhance Molecular Networking Reliability. Anal. Chem. 2017, 89, 7836–7840. [Google Scholar] [CrossRef]
  17. Touré, S.; Desrat, S.; Pellissier, L.; Allard, P.-M.; Wolfender, J.-L.; Dusfour, I.; Stien, D.; Eparvier, V. Characterization, Diversity, and Structure-Activity Relationship Study of Lipoamino Acids from Pantoea sp. and Synthetic Analogues. Int. J. Mol. Sci. 2019, 20, 1083. [Google Scholar] [CrossRef] [PubMed] [Green Version]
  18. Wolfender, J.-L.; Nuzillard, J.-M. Accelerating Metabolite Identification in Natural Product Research: Toward an Ideal Combination of Liquid Chromatography–High-Resolution Tandem Mass Spectrometry and NMR Profiling, in Silico Databases, and Chemometrics. Anal. Chem. 2019, 91, 704–742. [Google Scholar] [CrossRef]
  19. MacCurtin, T.; Reilly, J. Sclerotiorine, a Chlorinated Metabolic Product of Penicillium sclerotiorum, Van Beyma. Nature 1940, 146, 335. [Google Scholar] [CrossRef]
  20. Osmanova, N.; Schultze, W.; Ayoub, N. Azaphilones: A Class of Fungal Metabolites with Diverse Biological Activities. Phytochem. Rev. 2010, 9, 315–34228. [Google Scholar] [CrossRef]
  21. Gao, J.-M.; Yang, S.-X.; Qin, J.-C. Azaphilones: Chemistry and Biology. Chem. Rev. 2013, 113, 4755–4811. [Google Scholar] [CrossRef] [PubMed]
  22. Mapari, S.A.S.; Thrane, U.; Meyer, A.S. Fungal Polyketide Azaphilone Pigments as Future Natural Food Colorants? Trends Biotechnol. 2010, 28, 300–307. [Google Scholar] [CrossRef] [PubMed]
  23. Godzien, J.; Gil de la Fuente, A.; Otero, A.; Barbas, C. Metabolite Annotation and Identification. In Comprehensive Analytical Chemistry; Elsevier: Amsterdam, The Netherlands, 2018; Volume 82, pp. 415–445. [Google Scholar] [CrossRef]
  24. van Santen, J.A.; Jacob, G.; Singh, A.L.; Aniebok, V.; Balunas, M.J.; Bunsko, D.; Neto, F.C.; Castaño-Espriu, L.; Chang, C.; Clark, T.N.; et al. The Natural Products Atlas: An Open Access Knowledge Base for Microbial Natural Products Discovery. ACS Cent. Sci. 2019, 5, 1824–1833. [Google Scholar] [CrossRef] [Green Version]
  25. Son, S.; Ko, S.-K.; Kim, J.W.; Lee, J.K.; Jang, M.; Ryoo, I.-J.; Hwang, G.J.; Kwon, M.C.; Shin, K.-S.; Futamura, Y.; et al. Structures and Biological Activities of Azaphilones Produced by Penicillium sp. KCB11A109 from a Ginseng Field. Phytochemistry 2016, 122, 154–164. [Google Scholar] [CrossRef] [PubMed]
  26. Gu, B.-B. Azaphilone and Isocoumarin Derivatives from the Sponge-Derived Fungus Eupenicillium sp. 6A-9. Tetrahedron Lett. 2018, 59, 3345–3348. [Google Scholar] [CrossRef]
  27. Tang, J.-L.; Zhou, Z.-Y.; Yang, T.; Yao, C.; Wu, L.-W.; Li, G.-Y. Azaphilone Alkaloids with Anti-Inflammatory Activity from Fungus Penicillium sclerotiorum Cib-411. J. Agric. Food Chem. 2019, 67, 2175–2182. [Google Scholar] [CrossRef] [PubMed]
  28. Zhang, L.; Long, Y.; Lei, X.; Xu, J.; Huang, Z.; She, Z.; Lin, Y.; Li, J.; Liu, L. Azaphilones Isolated from an Alga-Derived Fungus Penicillium sp. ZJ-27. Phytochem. Lett. 2016, 18, 180–186. [Google Scholar] [CrossRef]
  29. Michael, A.P.; Grace, E.J.; Kotiw, M.; Barrow, R.A. Isochromophilone IX, a Novel GABA-Containing Metabolite Isolated from a Cultured Fungus, Penicillium sp. Aust. J. Chem. 2003, 56, 13. [Google Scholar] [CrossRef]
  30. Arai, N.; Shiomi, K.; Tomoda, H.; Tabata, N.; Yang, D.J.; Masuma, R.; Kawakubo, T.; Omura, S. Isochromophilones III-VI, Inhibitors of Acyl-CoA: Cholesterol Acyltransferase Produced by Penicillium multicolor FO-3216. J. Antibiot. 1995, 48, 696–702. [Google Scholar] [CrossRef] [PubMed] [Green Version]
  31. Liu, Z.; Qiu, P.; Liu, H.; Li, J.; Shao, C.; Yan, T.; Cao, W.; She, Z. Identification of Anti-Inflammatory Polyketides from the Coral-Derived Fungus Penicillium sclerotiorin: In Vitro Approaches and Molecular-Modeling. Bioorg. Chem. 2019, 88, 102973. [Google Scholar] [CrossRef] [PubMed]
  32. Pairet, L.; Wrigley, S.K.; Reynolds, I.E.; Hayes, M.A. Taxonomy, Fermentation, Isolation, Structure Elucidation and Biological Activity. J. Antibiot. 1995, 48, 913–923. [Google Scholar] [CrossRef] [PubMed] [Green Version]
  33. Niessen, W.M.A.; Ceballos, R.A.C. Fragmentation of Drugs and Pesticides. In Interpretation of MS-MS Mass Spectra of Drugs and Pesticides; John Wiley & Sons, Inc.: Hoboken, NY, USA, 2017; pp. 129–349. [Google Scholar] [CrossRef]
  34. Niessen, W.M.A.; Ceballos, R.A.C. Fragmentation of Even-Electron Ions. In Interpretation of MS-MS Mass Spectra of Drugs and Pesticides; John Wiley & Sons, Inc.: Hoboken, NY, USA, 2017; pp. 71–128. [Google Scholar] [CrossRef]
  35. Svilar, L.; Stankov-Jovanovic, V.; Lesage, D.; Dossmann, H.; Tabet, J.C. High-resolution mass spectrometry and hydrogen/deuterium exchange study of mitorubrin azaphilones and nitrogenized analogues. J. Mass Spectrom. 2012, 47, 969–977. [Google Scholar] [CrossRef]
  36. Williams, J.P.; Nibbering, N.M.M.; Green, B.N.; Patel, V.J.; Scrivens, J.H. Collision-Induced Fragmentation Pathways Including Odd-Electron Ion Formation from Desorption Electrospray Ionisation Generated Protonated and Deprotonated Drugs Derived from Tandem Accurate Mass Spectrometry. J. Mass Spectrom. 2006, 41, 1277–1286. [Google Scholar] [CrossRef] [PubMed]
  37. Meunier, B.; de Visser, S.P.; Shaik, S. Mechanism of Oxidation Reactions Catalyzed by Cytochrome P450 Enzymes. Chem. Rev. 2004, 104, 3947–3980. [Google Scholar] [CrossRef] [PubMed]
  38. Arand, M.; Cronin, A.; Oesch, F.; Mowbray, S.L.; Alwyn Jones, T. The Telltale Structures of Epoxide Hydrolases. Drug Metab. Rev. 2003, 35, 365–383. [Google Scholar] [CrossRef]
  39. Hemtasin, C.; Kanokmedhakul, S.; Moosophon, P.; Soytong, K.; Kanokmedhakul, K. Bioactive Azaphilones from the Fungus Penicillium multicolor CM01. Phytochem. Lett. 2016, 16, 56–60. [Google Scholar] [CrossRef]
  40. Wang, X.; Sena Filho, J.G.; Hoover, A.R.; King, J.B.; Ellis, T.K.; Powell, D.R.; Cichewicz, R.H. Chemical Epigenetics Alters the Secondary Metabolite Composition of Guttate Excreted by an Atlantic-Forest-Soil-Derived Penicillium citreonigrum. J. Nat. Prod. 2010, 73, 942–948. [Google Scholar] [CrossRef] [Green Version]
  41. Seto, H.; Tanabe, M. Utilization of 13C-13C Coupling in Structural and Biosynthetic Studies. III. Ochrephilone—A New Fungal Metabolite. Tetrahedron Lett. 1974, 15, 651–654. [Google Scholar] [CrossRef]
  42. Kanokmedhakul, S.; Kanokmedhakul, K.; Nasomjai, P.; Louangsysouphanh, S.; Soytong, K.; Isobe, M.; Kongsaeree, P.; Prabpai, S.; Suksamrarn, A. Antifungal Azaphilones from the Fungus Chaetomium cupreum CC3003. J. Nat. Prod. 2006, 69, 891–895. [Google Scholar] [CrossRef]
  43. Beauxis, Y.; Genta-Jouve, G. MetWork: A Web Server for Natural Products Anticipation. Bioinformatics 2019, 35, 1795–1796. [Google Scholar] [CrossRef]
  44. da Silva, R.R.; Wang, M.; Nothias, L.-F.; van der Hooft, J.J.J.; Caraballo-Rodríguez, A.M.; Fox, E.; Balunas, M.J.; Klassen, J.L.; Lopes, N.P.; Dorrestein, P.C. Propagating Annotations of Molecular Networks Using in Silico Fragmentation. PLoS Comput. Biol. 2018, 14, e1006089. [Google Scholar] [CrossRef] [PubMed]
  45. Lai, Z.; Tsugawa, H.; Wohlgemuth, G.; Mehta, S.; Mueller, M.; Zheng, Y.; Ogiwara, A.; Meissen, J.; Showalter, M.; Takeuchi, K.; et al. Identifying Metabolites by Integrating Metabolome Databases with Mass Spectrometry Cheminformatics. Nat. Methods 2018, 15, 53–56. [Google Scholar] [CrossRef] [PubMed]
  46. Blaženović, I.; Kind, T.; Torbašinović, H.; Obrenović, S.; Mehta, S.S.; Tsugawa, H.; Wermuth, T.; Schauer, N.; Jahn, M.; Biedendieck, R.; et al. Comprehensive Comparison of in Silico MS/MS Fragmentation Tools of the CASMI Contest: Database Boosting Is Needed to Achieve 93% Accuracy. J. Cheminform. 2017, 9, 32. [Google Scholar] [CrossRef] [PubMed] [Green Version]
  47. Winter, J.M.; Sato, M.; Sugimoto, S.; Chiou, G.; Garg, N.K.; Tang, Y.; Watanabe, K. Identification and Characterization of the Chaetoviridin and Chaetomugilin Gene Cluster in Chaetomium globosum Reveal Dual Functions of an Iterative Highly-Reducing Polyketide Synthase. J. Am. Chem. Soc. 2012, 134, 17900–17903. [Google Scholar] [CrossRef] [PubMed] [Green Version]
  48. Winter, J.M.; Cascio, D.; Dietrich, D.; Sato, M.; Watanabe, K.; Sawaya, M.R.; Vederas, J.C.; Tang, Y. Biochemical and Structural Basis for Controlling Chemical Modularity in Fungal Polyketide Biosynthesis. J. Am. Chem. Soc. 2015, 137, 9885–9893. [Google Scholar] [CrossRef] [PubMed] [Green Version]
  49. Chidananda, C.; Sattur, A.P. Sclerotiorin, a Novel Inhibitor of Lipoxygenase from Penicillium frequentans. J. Agric. Food Chem. 2007, 55, 2879–2883. [Google Scholar] [CrossRef]
  50. Dolomanov, O.V.; Bourhis, L.J.; Gildea, R.J.; Howard, J.A.K.; Puschmann, H. OLEX2: A Complete Structure Solution, Refinement and Analysis Program. J. Appl. Crystallogr. 2009, 42, 339–341. [Google Scholar] [CrossRef]
  51. Sheldrick, G.M. SHELXT—Integrated Space-Group and Crystal-Structure Determination. Acta Crystallogr. A 2015, 71, 3–8. [Google Scholar] [CrossRef] [Green Version]
  52. Sheldrick, G.M. Crystal Structure Refinement with SHELXL. Acta Crystallogr. C 2015, 71, 3–8. [Google Scholar] [CrossRef]
  53. Flack, H.D. On Enantiomorph-Polarity Estimation. Acta Crystallogr. A 1983, 39, 876–881. [Google Scholar] [CrossRef]
  54. Hooft, R.W.W.; Straver, L.H.; Spek, A.L. Determination of Absolute Structure Using Bayesian Statistics on Bijvoet Differences. J. Appl. Crystallogr. 2008, 41, 96–103. [Google Scholar] [CrossRef] [PubMed] [Green Version]
  55. Macrae, C.F.; Edgington, P.R.; McCabe, P.; Pidcock, E.; Shields, G.P.; Taylor, R.; Towler, M.; van de Streek, J. Mercury: Visualization and Analysis of Crystal Structures. J. Appl. Crystallogr. 2006, 39, 453–457. [Google Scholar] [CrossRef] [Green Version]
  56. European Committee on Antimicrobial Susceptibility Testing: EUCAST. Available online: https://eucast.org/ (accessed on 11 April 2016).
  57. Tempête, C.; Werner, G.; Favre, F.; Rojas, A.; Langlois, N. In Vitro Cytostatic Activity of 9-Demethoxyporothramycin B. Eur. J. Med. Chem. 1995, 30, 647–650. [Google Scholar] [CrossRef]
Figure 1. t-SNE molecular network representation constructed on MS² homology, with the size of the nodes related to their intensity and color to minimal inhibitory concentration (MIC) of fractions against T. rubrum with dereplicated features from MS² standard database query. Azaphilone derivative clusters are boxed in black.
Metabolites 11 00444 g001
Figure 2. R1 can possess acylation of different sizes or form a lactone ring with R2. Y can be O, NH or N-alkylation, R3 and R4 can form an alcene until C-11 and C-12 or an epoxyde or are hydroxyles, and X can form either a hydrogen or a chlorine atom. These modifications can be combined.
Metabolites 11 00444 g002
Figure 3. Annotation cluster A included sclerotiorin (1) with hypothetical structures proposed from molecular network data. In red and blue are molecules identified directly in MN (isochromophilone IV (21) and sclerketide B isomer (22)), in black are molecules annotated with MS/MS.
Metabolites 11 00444 g003
Figure 4. Proposed fragmentation pathway of molecules in clusters A and B. Depending on R1, X and Y elements. NL = neutral loss, F = fragmentation (below).
Metabolites 11 00444 g004
Figure 5. Annotation of cluster B with hypothetical structures proposed from molecular network data. In red and blue are molecules identified directly in MN (sclerotioramine (2), isochromophilone VI (5), isochromophilone IX (6), penazaphilone F (19) and penazaphilone D (20)), in black are molecules annotated with MS/MS.
Metabolites 11 00444 g005
Figure 6. Annotation of clusters C, D and E with hypothetical structures proposed from molecular network data. In red and blue are molecules (ochrephilone (3), isochromophilone I (4) hypocrellone A (7), geumsanol A-C and G (14–17) and eupeniazaphilone C (18), 5-chloroisorotiorin (23)) identified directly in MN, in black are molecules annotated with MS/MS.
Metabolites 11 00444 g006
Figure 7. New azaphilone compounds isolated from CN111 extract.
Metabolites 11 00444 g007
Figure 8. Summary of azaphilone modifications proposed as a metabolic pathway.
Metabolites 11 00444 g008
Table 1. Minimal inhibitory concentrations in µg.mL−1 of isolated compounds against C. albicans and T. rubrum. Fluconazol was used as positive control.
Compounds/FractionsC. AlbicansT. Rubrum
1>6432
2>6464
5>64>64
236432
63>64>64
74>64>64
75>64>64
80>64>64
F525632
F612816
F712816
Control14
Publisher’s Note: MDPI stays neutral with regard to jurisdictional claims in published maps and institutional affiliations.

