
Separation of Chromatographic Co-Eluted Compounds by Clustering and by Functional Data Analysis


Abstract

1. Introduction
2. Results
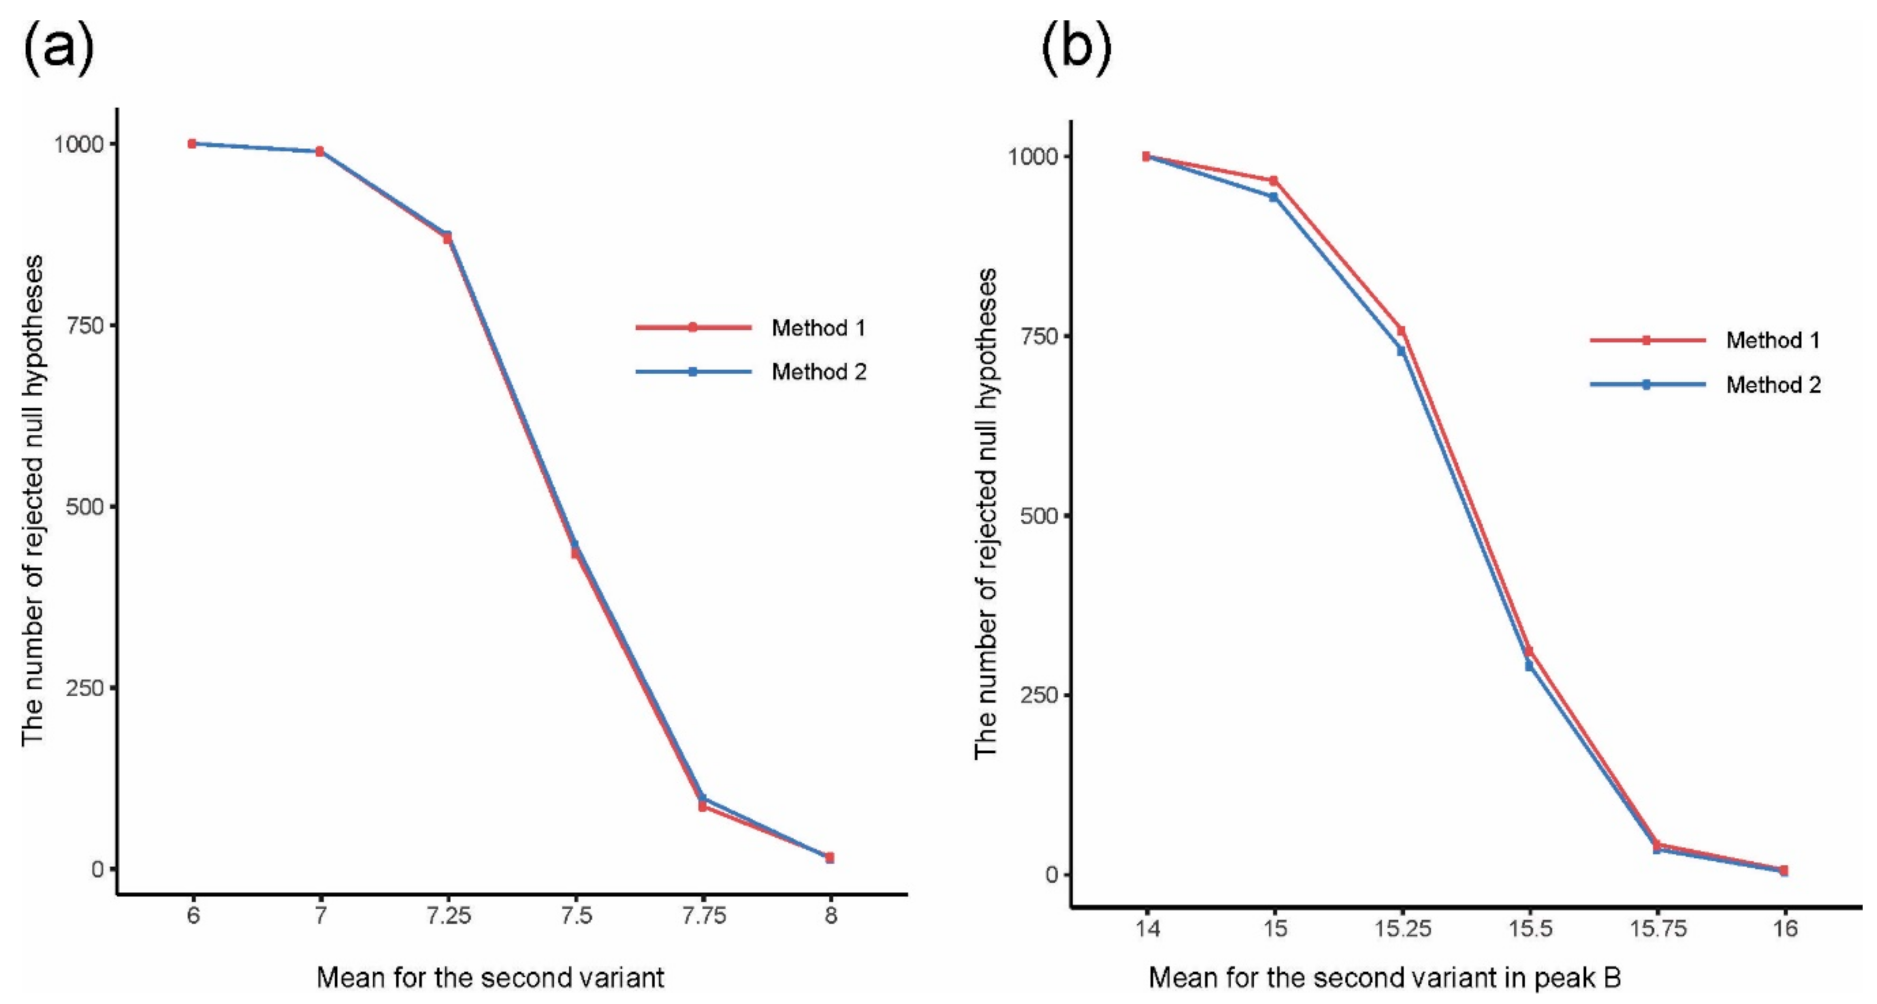
2.1. Simulations
2.2. Real Data Analysis
2.2.1. Example 1
Method 1
Method 2
Experimental Validation
2.2.2. Example 2
Method 1
Method 2
Experimental Validation
3. Discussion
4. Materials and Methods
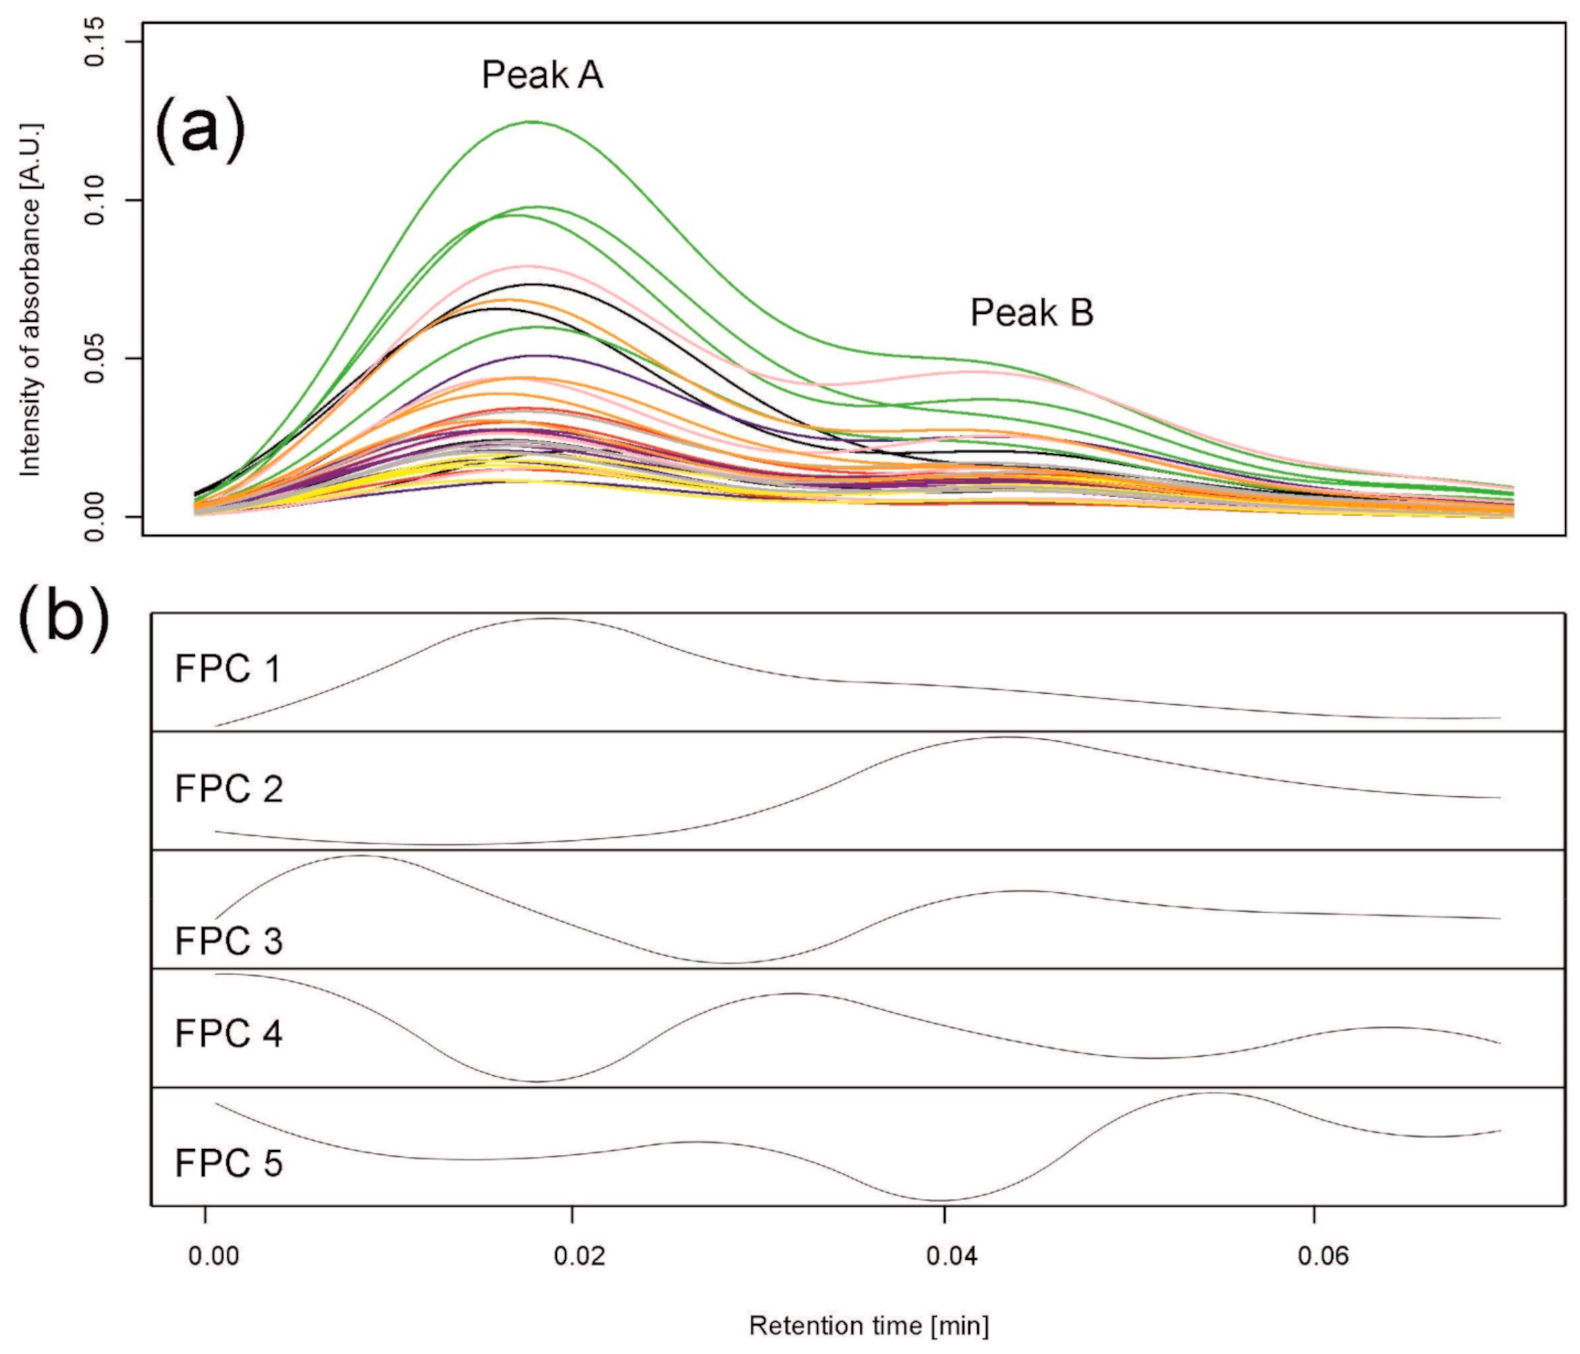
4.1. Motivating Data
4.2. Data Pre-Processing
- (a)
- Normalization: the raw data were divided by the mass of the appropriate extracted leaf sample.
- (b)
- Baseline removal: chromatographic baselines were removed using the Rolling Ball algorithm based on [46] using package baseline in R.
- (c)
- Retention time alignment: the algorithm of COW [36] was applied with the choice of reference chromatograms based on the maximum value of the similarity index.
- (d)
- Peak detection: peaks, interpreted as the retention time intervals in which some types of metabolites or a group of metabolites with similar chromatographic properties occur, were detected in each single chromatogram using the second derivative smoothed by a cubic smoothing spline with the function smooth.spline in R [31]. The inflection points were located to find boundaries for the individual peaks, and peaks common for several (or all) chromatograms were built to compare peak areas between samples. At this stage, peaks that result from mixtures of compounds eluting at similar retention times appear, and these peaks should be subjected to separation.
4.3. Method 1: Peak Separation by Clustering
- peak 1 to 2, 3, 4 with percentage of overlap accordingly (90%, 85%, 81%);
- peak 2 to 1, 9 with percentage of overlap accordingly (90%, 82%);
- peak 3 to 1 with percentage of overlap of 85%;
- peak 4 to 1, 5, 8, 9 with percentage of overlap accordingly (81%, 82%, 84%, 90%);
- peak 5 to 4, 8 with percentage of overlap accordingly (82%, 85%);
- peak 6 to 8 with percentage of overlap of 90%;
- peak 7 to 8 with percentage of overlap of 91%;
- peak 8 to 4, 5, 6, 7, 10 with percentage of overlap accordingly (81%, 85%, 90%, 91%, 87%);
- peak 9 to 2, 4 with percentage of overlap accordingly (82%, 90%);
- peak 10 to 8 with percentage of overlap of 87%.
4.4. Method 2: Peak Separation by Functional Principal Component Analysis
4.5. Peak Quantification
5. Conclusions
Supplementary Materials
Author Contributions
Funding
Institutional Review Board Statement
Informed Consent Statement
Data Availability Statement
Acknowledgments
Conflicts of Interest
References
- Brown, M.; Dunn, W.B.; Ellis, D.I.; Goodacre, R.; Handl, J.; Knowles, J.D.; O’Hagan, S.; Spasić, I.; Kell, D.B. A metabolome pipeline: From concept to data to knowledge. Metabolomics 2005, 1, 39–51. [Google Scholar] [CrossRef]
- Weckwerth, W.; Morgenthal, K. Metabolomics: From pattern recognition to biological interpretation. Drug Discov. Today 2005, 10, 1551–1558. [Google Scholar] [CrossRef]
- Liland, K.H. Multivariate methods in metabolomics—From pre-processing to dimension reduction and statistical analysis. TrAC Trends Anal. Chem. 2011, 30, 827–841. [Google Scholar] [CrossRef]
- Boccard, J.; Rudaz, S. Harnessing the complexity of metabolomic data with chemometrics. J. Chemom. 2014, 28, 1–9. [Google Scholar] [CrossRef]
- Dworkin, J.P. Chromatographic Coelution. In Encyclopedia of Astrobiology; Amils, R., Ed.; Springer: Berlin/Heidelberg, Germany, 2014. [Google Scholar]
- Tao, Y.; Nadege, S.W.; Huang, C.; Zhang, P.; Song, S.; Sun, L.; Wu, Y. Brachypodium distachyon is a suitable host plant for study of Barley yellow dwarf virus. Virus Genes 2016, 52, 299–302. [Google Scholar] [CrossRef] [PubMed]
- Li, J. Comparison of the capability of peak functions in describing real chromatographic peaks. J. Chromatogr. A 2002, 952, 63–70. [Google Scholar] [CrossRef]
- Dasgupta, P.K. Chromatographic peak resolution using Microsoft Excel Solver. J. Chromatogr. A 2008, 1213, 50–55. [Google Scholar] [CrossRef]
- Gergely, A.; Horváth, P.; Noszál, B. Deconvolution of composite chromatographic peaks by simultaneous dual detections. J. Chromatogr. Sci. 2000, 38, 425–429. [Google Scholar] [CrossRef] [PubMed][Green Version]
- Caballero, R.; García-Alvarez-Coque, M.; Baeza-Baeza, J.J. Parabolic-Lorentzian modified Gaussian model for describing and deconvolving chromatographic peaks. J. Chromatogr. A 2002, 954, 59–76. [Google Scholar] [CrossRef]
- Barboni, T.; Chiaramonti, N. Use of deconvolution methods for the analysis of sugars in kiwi juice by HPLC. Chromatographia 2006, 63, 445–448. [Google Scholar] [CrossRef]
- Kalambet, Y.; Kozmin, Y.; Mikhailova, K.; Nagaev, I.; Tikhonov, P. Reconstruction of chromatographic peaks using the exponentially modified Gaussian function. J. Chemom. 2011, 25, 352–356. [Google Scholar] [CrossRef]
- Cui, L.; Ling, Z.; Poon, J.; Poon, S.K.; Chen, H.; Gao, J.; Kwan, P.; Fan, K. Generalized gaussian reference curve measurement model for high-performance liquid chromatography with diode array detector separation and its solution by multi-target intermittent particle swarm optimization. J. Chemom. 2014, 29, 146–153. [Google Scholar] [CrossRef]
- Arase, S.; Horie, K.; Kato, T.; Noda, A.; Mito, Y.; Takahashi, M.; Yanagisawa, T. Intelligent peak deconvolution through in-depth study of the data matrix from liquid chromatography coupled with a photo-diode array detector applied to pharmaceutical analysis. J. Chromatogr. A 2016, 1469, 35–47. [Google Scholar] [CrossRef] [PubMed]
- Vivó-Truyols, G.; Torres-Lapasió, J.; van Nederkassel, A.; Heyden, Y.V.; Massart, D. Automatic program for peak detection and deconvolution of multi-overlapped chromatographic signals. J. Chromatogr. A 2005, 1096, 146–155. [Google Scholar] [CrossRef] [PubMed]
- Stevenson, P.G.; Gritti, F.; Guiochon, G. Automated methods for the location of the boundaries of chromatographic peaks. J. Chromatogr. A 2011, 1218, 8255–8263. [Google Scholar] [CrossRef]
- Baeza-Baeza, J.; García-Alvarez-Coque, M. Characterization of chromatographic peaks using the linearly modified Gaussian model. Comparison with the bi-Gaussian and the Foley and Dorsey approaches. J. Chromatogr. A 2017, 1515, 129–137. [Google Scholar] [CrossRef]
- Olazábal, V.; Prasad, L.; Stark, P.; Olivares, J.A. Application of wavelet transforms and an approximate deconvolution method for the resolution of noisy overlapped peaks in DNA capillary electrophoresis. Analyst 2003, 129, 73–81. [Google Scholar] [CrossRef]
- Tong, X.; Zhang, Z.; Zeng, F.; Fu, C.; Ma, P.; Peng, Y.; Lu, H.; Liang, Y. Recursive wavelet peak detection of analytical signals. Chromatographia 2016, 79, 1247–1255. [Google Scholar] [CrossRef]
- Daood, H.G.; Bencze, G.; Palotás, G.; Pék, Z.; Sidikov, A.; Helyes, L. HPLC analysis of carotenoids from tomatoes using cross-linked C18 column and MS detection. J. Chromatogr. Sci. 2014, 52, 985–991. [Google Scholar] [CrossRef]
- Wang, M.; Zheng, K.; Yang, G.; Ma, W.; Wang, J.; Wang, T.; Du, Y. A robust near-infrared calibration model for the determination of chlorophyll concentration in tree leaves with a calibration transfer method. Anal. Lett. 2015, 48, 1707–1719. [Google Scholar] [CrossRef]
- Yuan, B.; Lu, M.; Eskridge, K.M.; Isom, L.D.; Hanna, M.A. Extraction, identification, and quantification of antioxidant phenolics from hazelnut (Corylus avellana L.) shells. Food Chem. 2018, 244, 7–15. [Google Scholar] [CrossRef] [PubMed]
- Zou, H.; Ma, Y.; Xu, Z.; Liao, X.; Chen, A.; Yang, S. Isolation of strawberry anthocyanins using high-speed counter-current chromatography and the copigmentation with catechin or epicatechin by high pressure processing. Food Chem. 2018, 247, 81–88. [Google Scholar] [CrossRef] [PubMed]
- Cai, Y.; Sun, M.; Corke, H. HPLC characterization of betalains from plants in the amaranthaceae. J. Chromatogr. Sci. 2005, 43, 454–460. [Google Scholar] [CrossRef] [PubMed]
- Wu, J.; Zhao, R.; Chen, B.; Yang, M. Determination of zearalenone in barley by high-performance liquid chromatography coupled with evaporative light scattering detection and natural occurrence of zearalenone in functional food. Food Chem. 2011, 126, 1508–1511. [Google Scholar] [CrossRef]
- Huertas-Pérez, J.F.; Arroyo-Manzanares, N.; Hitzler, D.; Castro-Guerrero, F.G.; Gámiz-Gracia, L.; García-Campaña, A.M. Simple determination of aflatoxins in rice by ultra-high performance liquid chromatography coupled to chemical post-column derivatization and fluorescence detection. Food Chem. 2018, 245, 189–195. [Google Scholar] [CrossRef]
- Pajewska, M.; Łojko, M.; Cendrowski, K.; Sawicki, W.; Kowalkowski, T.; Buszewski, B.; Gadzała-Kopciuch, R. The determination of zearalenone and its major metabolites in endometrial cancer tissues. Anal. Bioanal. Chem. 2018, 410, 1571–1582. [Google Scholar] [CrossRef]
- Piślewska-Bednarek, M.; Nakano, R.T.; Hiruma, K.; Pastorczyk, M.; Sanchez-Vallet, A.; Singkaravanit-Ogawa, S.; Ciesiołka, D.; Takano, Y.; Molina, A.; Schulze-Lefert, P.; et al. Glutathione transferase U13 functions in pathogen-triggered glucosinolate metabolism. Plant Physiol. 2018, 176, 538–551. [Google Scholar] [CrossRef]
- Muraki, E.; Ramsay, J.O.; Silverman, B.W. Functional data analysis. J. Educ. Behav. Stat. 1999, 24, 101–403. [Google Scholar] [CrossRef]
- Ramsay, J.O.; Silverman, B.W. Applied Functional Data Analysis: Methods and Case Studies; Springer: New York, NY, USA, 2002. [Google Scholar]
- Piasecka, A.; Sawikowska, A.; Kuczyńska, A.; Ogrodowicz, P.; Mikołajczak, K.; Krystkowiak, K.; Gudyś, K.; Guzy-Wróbelska, J.; Krajewski, P.; Kachlicki, P. Drought-related secondary metabolites of barley (Hordeum vulgare L.) leaves and their metabolomic quantitative trait loci. Plant J. 2017, 89, 898–913. [Google Scholar] [CrossRef] [PubMed]
- Skov, T.; Berg, F.V.D.; Tomasi, G.; Bro, R. Automated alignment of chromatographic data. J. Chemom. 2006, 20, 484–497. [Google Scholar] [CrossRef]
- Piasecka, A.; Sawikowska, A.; Kuczyńska, A.; Ogrodowicz, P.; Mikołajczak, K.; Krajewski, P.; Kachlicki, P. Phenolic metabolites from barley in contribution to phenome in soil moisture deficit. Int. J. Mol. Sci. 2020, 21, 6032. [Google Scholar] [CrossRef] [PubMed]
- Piasecka, A.; Sawikowska, A.; Krajewski, P.; Kachlicki, P. Combined mass spectrometric and chromatographic methods for in-depth analysis of phenolic secondary metabolites in barley leaves. J. Mass Spectrom. 2015, 50, 513–532. [Google Scholar] [CrossRef] [PubMed]
- Piasecka, A.; Kachlicki, P.; Stobiecki, M. Analytical methods for detection of plant metabolomes changes in response to biotic and abiotic stresses. Int. J. Mol. Sci. 2019, 20, 379. [Google Scholar] [CrossRef]
- Nielsen, N.-P.V.; Carstensen, J.M.; Smedsgaard, J. Aligning of single and multiple wavelength chromatographic profiles for chemometric data analysis using correlation optimised warping. J. Chromatogr. A 1998, 805, 17–35. [Google Scholar] [CrossRef]
- Tomasi, G.; Berg, F.V.D.; Andersson, C. Correlation optimized warping and dynamic time warping as preprocessing methods for chromatographic data. J. Chemom. 2004, 18, 231–241. [Google Scholar] [CrossRef]
- Wong, J.W.H.; Durante, C.; Cartwright, H.M. Application of fast fourier transform cross-correlation for the alignment of large chromatographic and spectral datasets. Anal. Chem. 2005, 77, 5655–5661. [Google Scholar] [CrossRef]
- Pravdova, V.; Walczak, B.; Massart, D. A comparison of two algorithms for warping of analytical signals. Anal. Chim. Acta 2002, 456, 77–92. [Google Scholar] [CrossRef]
- Jiang, W.; Zhang, Z.-M.; Yun, Y.; Zhan, D.-J.; Zheng, Y.-B.; Liang, Y.-Z.; Yang, Z.Y.; Yu, L. Comparisons of five algorithms for chromatogram alignment. Chromatographia 2013, 76, 1067–1078. [Google Scholar] [CrossRef]
- Daszykowski, M.; Heyden, Y.V.; Boucon, C.; Walczak, B. Automated alignment of one-dimensional chromatographic fingerprints. J. Chromatogr. A 2010, 1217, 6127–6133. [Google Scholar] [CrossRef]
- Wang, S.-Y.; Ho, T.-J.; Kuo, C.-H.; Tseng, Y.J. Chromaligner: A web server for chromatogram alignment. Bioinformatics 2010, 26, 2338–2339. [Google Scholar] [CrossRef] [PubMed][Green Version]
- Tomasi, G.; Savorani, F.; Engelsen, S.B. Icoshift: An effective tool for the alignment of chromatographic data. J. Chromatogr. A 2011, 1218, 7832–7840. [Google Scholar] [CrossRef]
- Zhang, Z.-M.; Liang, Y.-Z.; Lu, H.-M.; Tan, B.-B.; Xu, X.-N.; Ferro, M. Multiscale peak alignment for chromatographic datasets. J. Chromatogr. A 2012, 1223, 93–106. [Google Scholar] [CrossRef] [PubMed]
- Romanenko, S.; Stromberg, A.; Pushkareva, T. Modeling of analytical peaks: Peaks properties and basic peak functions. Anal. Chim. Acta 2006, 580, 99–106. [Google Scholar] [CrossRef] [PubMed]
- Kneen, M.; Annegarn, H. Algorithm for fitting XRF, SEM and PIXE X-ray spectra backgrounds. Nucl. Instruments Methods Phys. Res. Sect. B Beam Interactions Mater. Atoms 1996, 109–110, 209–213. [Google Scholar] [CrossRef]
- Mikołajczak, K.; Kuczyńska, A.; Krajewski, P.; Sawikowska, A.; Surma, M.; Ogrodowicz, P.; Adamski, T.; Krystkowiak, K.; Górny, A.G.; Kempa, M.; et al. Quantitative trait loci for plant height in Maresi × CamB barley population and their associations with yield-related traits under different water regimes. J. Appl. Genet. 2017, 58, 23–35. [Google Scholar] [CrossRef] [PubMed]
- Ogrodowicz, P.; Adamski, T.; Mikołajczak, K.; Kuczyńska, A.; Surma, M.; Krajewski, P.; Sawikowska, A.; Górny, A.G.; Gudyś, K.; Szarejko, I.; et al. QTLs for earliness and yield-forming traits in the Lubuski × CamB barley RIL population under various water regimes. J. Appl. Genet. 2017, 58, 49–65. [Google Scholar] [CrossRef]
- Wojakowska, A.; Piasecka, A.; García-López, P.M.; Zamora-Natera, F.; Krajewski, P.; Marczak, Ł.; Kachlicki, P.; Stobiecki, M. Structural analysis and profiling of phenolic secondary metabolites of Mexican lupine species using LC–MS techniques. Phytochemistry 2013, 92, 71–86. [Google Scholar] [CrossRef] [PubMed]
- Jasiński, M.; Kachlicki, P.; Rodziewicz, P.; Figlerowicz, M.; Stobiecki, M. Changes in the profile of flavonoid accumulation in Medicago truncatula leaves during infection with fungal pathogen Phoma medicaginis. Plant Physiol. Biochem. 2009, 47, 847–853. [Google Scholar] [CrossRef]
- Muth, D.; Kachlicki, P.; Krajewski, P.; Przystalski, M.; Stobiecki, M. Differential metabolic response of narrow leafed lupine (Lupinus angustifolius) leaves to infection with Colletotrichum lupini. Metabolomics 2009, 5, 354–362. [Google Scholar] [CrossRef]
- von Röpenack, E.; Parr, A.; Schulze-Lefert, P. Structural analyses and dynamics of soluble and cell wall-bound phenolics in a broad spectrum resistance to the powdery mildew fungus in barley. J. Biol. Chem. 1998, 273, 9013–9022. [Google Scholar] [CrossRef] [PubMed]
- Nørbæk, R.; Brandt, A.K.; Kondo, T. Identification of FlavoneC-Glycosides including a new flavonoid chromophore from barley leaves (Hordeum vulgareL.) by improved NMR techniques. J. Agric. Food Chem. 2000, 48, 1703–1707. [Google Scholar] [CrossRef] [PubMed]
- Ferreres, F.; Andrade, P.; Valentão, P.; Gil-Izquierdo, A. Further knowledge on barley (Hordeum vulgare L.) leaves O-glycosyl-C-glycosyl flavones by liquid chromatography-UV diode-array detection-electrospray ionisation mass spectrometry. J. Chromatogr. A 2008, 1182, 56–64. [Google Scholar] [CrossRef] [PubMed]


Publisher’s Note: MDPI stays neutral with regard to jurisdictional claims in published maps and institutional affiliations. |
© 2021 by the authors. Licensee MDPI, Basel, Switzerland. This article is an open access article distributed under the terms and conditions of the Creative Commons Attribution (CC BY) license (https://creativecommons.org/licenses/by/4.0/).
Share and Cite
Sawikowska, A.; Piasecka, A.; Kachlicki, P.; Krajewski, P. Separation of Chromatographic Co-Eluted Compounds by Clustering and by Functional Data Analysis. Metabolites 2021, 11, 214. https://doi.org/10.3390/metabo11040214
Sawikowska A, Piasecka A, Kachlicki P, Krajewski P. Separation of Chromatographic Co-Eluted Compounds by Clustering and by Functional Data Analysis. Metabolites. 2021; 11(4):214. https://doi.org/10.3390/metabo11040214
Chicago/Turabian StyleSawikowska, Aneta, Anna Piasecka, Piotr Kachlicki, and Paweł Krajewski. 2021. "Separation of Chromatographic Co-Eluted Compounds by Clustering and by Functional Data Analysis" Metabolites 11, no. 4: 214. https://doi.org/10.3390/metabo11040214
APA StyleSawikowska, A., Piasecka, A., Kachlicki, P., & Krajewski, P. (2021). Separation of Chromatographic Co-Eluted Compounds by Clustering and by Functional Data Analysis. Metabolites, 11(4), 214. https://doi.org/10.3390/metabo11040214