
A Metabolomics Analysis of Postmenopausal Breast Cancer Risk in the Cancer Prevention Study II

 ,
,  and
and
Abstract
1. Introduction
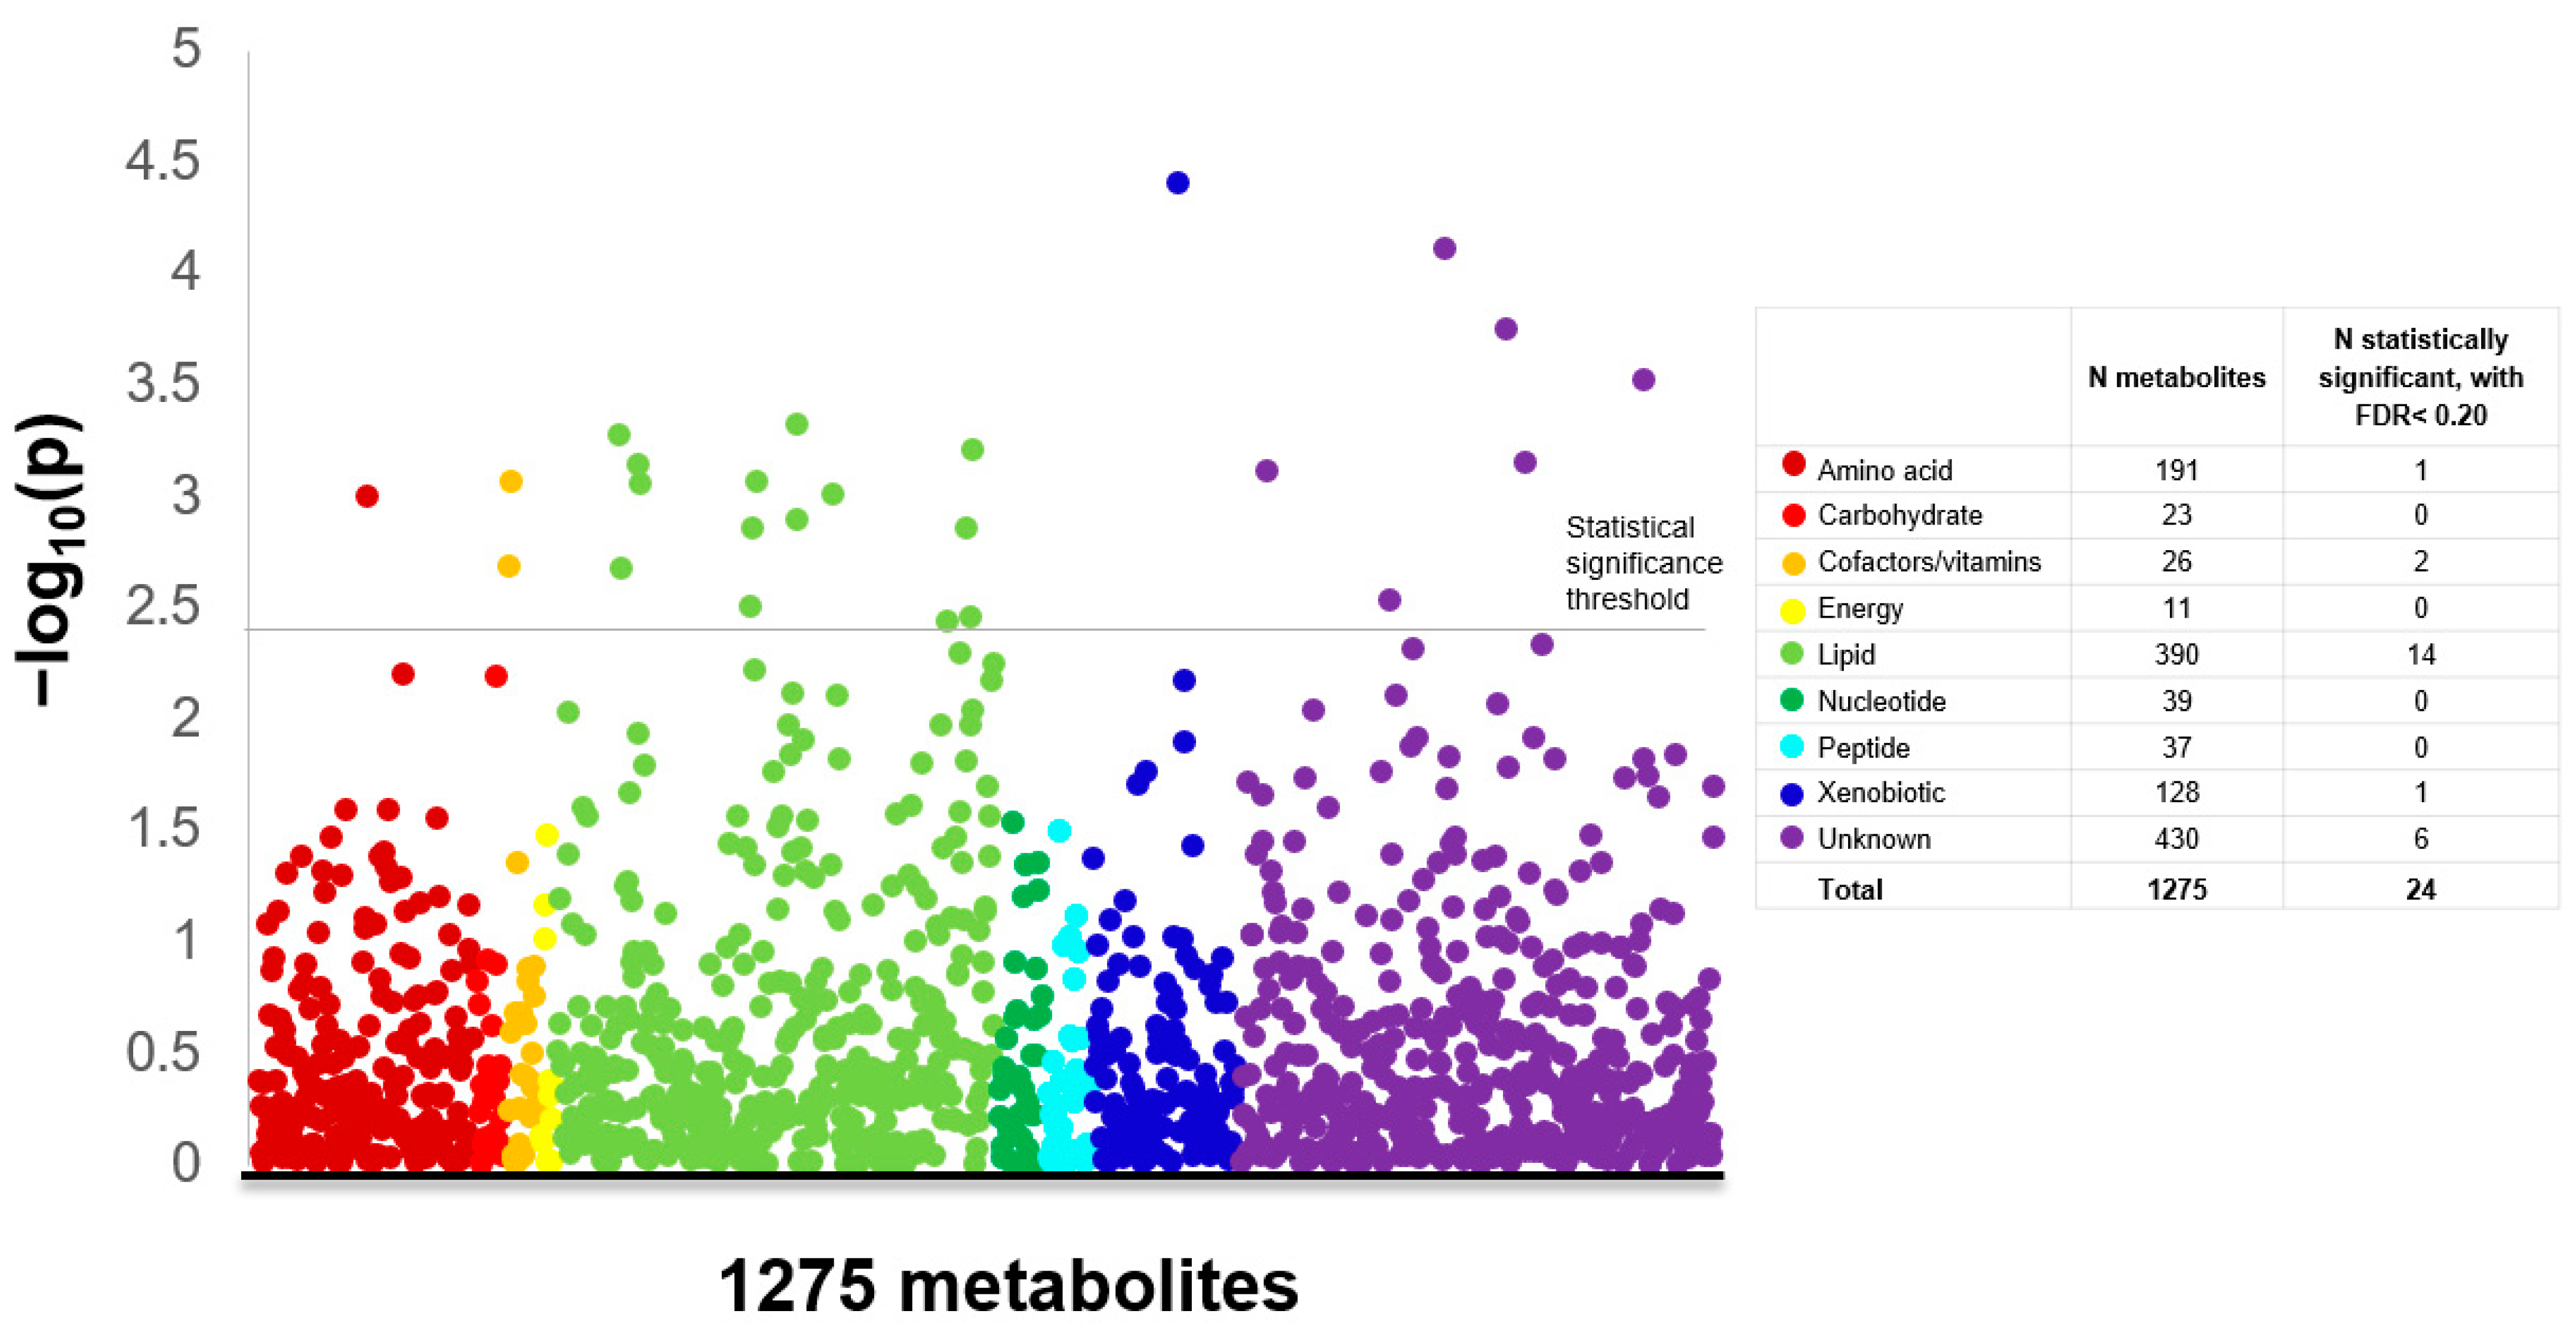
2. Results
3. Discussion
4. Materials and Methods
4.1. Study Population and Design
4.2. Metabolomics Assessment
4.3. Statistical Analysis
Supplementary Materials
Author Contributions
Funding
Institutional Review Board Statement
Informed Consent Statement
Data Availability Statement
Conflicts of Interest
References
- Ferlay, J.; Soerjomataram, I.; Dikshit, R.; Eser, S.; Mathers, C.; Rebelo, M.; Parkin, D.M.; Forman, D.; Bray, F. Cancer incidence and mortality worldwide: Sources, methods and major patterns in GLOBOCAN 2012. Int. J. Cancer 2015, 136, E359–E386. [Google Scholar] [CrossRef] [PubMed]
- Ziegler, R.G.; Anderson, W.F.; Gail, M.H. Increasing breast cancer incidence in China: The numbers add up. J. Natl. Cancer Inst. 2008, 100, 1339–1341. [Google Scholar] [CrossRef] [PubMed]
- Gomez, S.L.; Noone, A.-M.; Lichtensztajn, D.Y.; Scoppa, S.; Gibson, J.T.; Liu, L.; Morris, C.; Kwong, S.; Fish, K.; Wilkens, L.R.; et al. Cancer incidence trends among Asian American populations in the United States, 1990–2008. J. Natl. Cancer Inst. 2013, 105, 1096–1110. [Google Scholar] [CrossRef] [PubMed]
- Collaborative Group on Hormonal Factors in Breast C. Breast cancer and breastfeeding: Collaborative reanalysis of individual data from 47 epidemiological studies in 30 countries, including 50,302 women with breast cancer and 96,973 women without the disease. Lancet 2002, 360, 187–195. [Google Scholar]
- Islami, F.; Sauer, A.G.; Miller, K.D.; Siegel, R.L.; Fedewa, S.A.; Jacobs, E.J.; McCullough, M.L.; Patel, A.V.; Ma, J.; Soerjomataram, I.; et al. Proportion and number of cancer cases and deaths attributable to potentially modifiable risk factors in the United States. CA Cancer J. Clin. 2018, 68, 31–54. [Google Scholar] [CrossRef]
- Patel, A.V.; Friedenreich, C.M.; Moore, S.C.; Hayes, S.C.; Silver, J.K.; Campbell, K.L.; Winters-Stone, K.; Gerber, L.H.; George, S.M.; Fulton, J.E.; et al. American College of Sports Medicine Roundtable Report on Physical Activity, Sedentary Behavior, and Cancer Prevention and Control. Med. Sci. Sports Exerc. 2019, 51, 2391–2402. [Google Scholar] [CrossRef] [PubMed]
- Lauby-Secretan, B.; Scoccianti, C.; Loomis, D.; Grosse, Y.; Bianchini, F.; Straif, K.; International Agency for Research on Cancer Handbook Working Group. Body Fatness and Cancer—Viewpoint of the IARC Working Group. New Engl. J. Med. 2016, 375, 794–798. [Google Scholar] [CrossRef] [PubMed]
- Hanahan, D.; Weinberg, R.A. Hallmarks of cancer: The next generation. Cell 2011, 144, 646–674. [Google Scholar] [CrossRef]
- Vander Heiden, M.G.; Cantley, L.C. Thompson CB. Understanding the Warburg effect: The metabolic requirements of cell proliferation. Science 2009, 324, 1029–1033. [Google Scholar] [CrossRef]
- Lécuyer, L.; Bala, A.V.; Deschasaux, M.; Bouchemal, N.; Triba, M.N.; Vasson, M.-P.; Rossary, A.; Demidem, A.; Galan, P.; Hercberg, S.; et al. NMR metabolomic signatures reveal predictive plasma metabolites associated with long-term risk of developing breast cancer. Int. J. Epidemiol. 2018, 47, 484–494. [Google Scholar] [CrossRef]
- Kühn, T.; Floegel, A.; Sookthai, D.; Johnson, T.; Rolle-Kampczyk, U.; Otto, W.; Von Bergen, M.; Boeing, H.; Kaaks, R. Higher plasma levels of lysophosphatidylcholine 18:0 are related to a lower risk of common cancers in a prospective metabolomics study. BMC Med. 2016, 14, 13. [Google Scholar] [CrossRef] [PubMed]
- Tobias, D.K.; Hazra, A.; Lawler, P.R.; Chandler, P.D.; Chasman, D.I.; Buring, J.E.; Lee, I.-M.; Cheng, S.; Manson, J.E.; Mora, S. Circulating branched-chain amino acids and long-term risk of obesity-related cancers in women. Sci. Rep. 2020, 10, 16534. [Google Scholar] [CrossRef]
- Playdon, M.C.; Ziegler, R.G.; Sampson, J.N.; Stolzenberg-Solomon, R.; Thompson, H.J.; Irwin, M.L.; Mayne, S.T.; Hoover, R.N.; Moore, S.C. Nutritional metabolomics and breast cancer risk in a prospective study. Am. J. Clin. Nutr. 2017, 106, 637–649. [Google Scholar] [CrossRef] [PubMed]
- Moore, S.C.; Playdon, M.C.; Sampson, J.N.; Hoover, R.N.; Trabert, B.; E Matthews, C.; Ziegler, R.G. A Metabolomics Analysis of Body Mass Index and Postmenopausal Breast Cancer Risk. J. Natl. Cancer Inst. 2018, 110, 588–597. [Google Scholar] [CrossRef] [PubMed]
- His, M.; Viallon, V.; Dossus, L.; Gicquiau, A.; Achaintre, D.; Scalbert, A.; Ferrari, P.; Romieu, I.; Onland-Moret, N.C.; Weiderpass, E.; et al. Prospective analysis of circulating metabolites and breast cancer in EPIC. BMC Med. 2019, 17, 178. [Google Scholar] [CrossRef] [PubMed]
- Key, T.; Appleby, P.; Barnes, I.; Reeves, G.; Endogenous, H. Breast Cancer Collaborative G. Endogenous sex hormones and breast cancer in postmenopausal women: Reanalysis of nine prospective studies. J. Natl. Cancer Inst. 2002, 94, 606–616. [Google Scholar] [PubMed]
- Kaaks, R.; Rinaldi, S.; Key, T.J.; Berrino, F.; Peeters, P.H.M.; Biessy, C.; Dossus, L.; Lukanova, A.; Bingham, S.; Khaw, K.-T.; et al. Postmenopausal serum androgens, oestrogens and breast cancer risk: The European prospective investigation into cancer and nutrition. Endocr. Relat. Cancer 2005, 12, 1071–1082. [Google Scholar] [CrossRef]
- Zhang, X.; Tworoger, S.S.; Eliassen, A.H.; Hankinson, S.E. Postmenopausal plasma sex hormone levels and breast cancer risk over 20 years of follow-up. Breast Cancer Res. Treat. 2013, 137, 883–892. [Google Scholar] [CrossRef]
- Hampl, R.; Starka, L. Minireview: 16alpha-hydroxylated metabolites of dehydroepiandrosterone and their biological significance. Endocr. Regul. 2000, 34, 161–163. [Google Scholar]
- Ziegler, R.G.; Fuhrman, B.J.; Moore, S.C.; Matthews, C.E. Epidemiologic studies of estrogen metabolism and breast cancer. Steroids 2015, 99, 67–75. [Google Scholar] [CrossRef][Green Version]
- Sampson, J.N.; Falk, R.T.; Schairer, C.; Moore, S.C.; Fuhrman, B.J.; Dallal, C.M.; Bauer, D.C.; Dorgan, J.F.; Shu, X.-O.; Zheng, W.; et al. Association of Estrogen Metabolism with Breast Cancer Risk in Different Cohorts of Postmenopausal Women. Cancer Res. 2017, 77, 918–925. [Google Scholar] [CrossRef]
- Chen, F.; Knecht, K.; Leu, C.; Rutledge, S.; Scafonas, A.; Gambone, C.; Vogel, R.; Zhang, H.; Kasparcova, V.; Bai, C.; et al. Partial agonist/antagonist properties of androstenedione and 4-androsten-3β,17β-diol. J. Steroid Biochem. Mol. Biol. 2004, 91, 247–257. [Google Scholar] [CrossRef]
- Domizio, S.; Romanelli, A.; Brindisino, P.; Puglielli, C.; Conte, E.; Sgarrella, M.C.; Sabatino, G. Glutaric aciduria type II: A case report. Int. J. Immunopathol. Pharmacol. 2005, 18, 805–808. [Google Scholar] [CrossRef] [PubMed]
- Violante, S.; Ijlst, L.; Brinke, H.T.; De Almeida, I.T.; Wanders, R.J.A.; Ventura, F.V.; Houten, S.M. Carnitine palmitoyltransferase 2 and carnitine/acylcarnitine translocase are involved in the mitochondrial synthesis and export of acylcarnitines. FASEB J. 2013, 27, 2039–2044. [Google Scholar] [CrossRef] [PubMed]
- Karanjia, R.N.; E Crossey, M.M.; Cox, I.J.; Fye, H.K.S.; Njie, R.; Goldin, R.D.; Taylor-Robinson, S.D. Hepatic steatosis and fibrosis: Non-invasive assessment. World J. Gastroenterol. 2016, 22, 9880–9897. [Google Scholar] [CrossRef]
- Glunde, K.; Bhujwalla, Z.M.; Ronen, S.M. Choline metabolism in malignant transformation. Nat. Rev. Cancer 2011, 11, 835–848. [Google Scholar] [CrossRef]
- Moore, S.C. Metabolomics and breast cancer: Scaling up for robust results. BMC Med. 2020, 18, 18. [Google Scholar] [CrossRef] [PubMed]
- Sampson, J.N.; Boca, S.M.; Shu, X.O.; Stolzenberg-Solomon, R.Z.; Matthews, C.E.; Hsing, A.W.; Tan, Y.T.; Ji, B.-T.; Chow, W.-H.; Cai, Q.; et al. Metabolomics in epidemiology: Sources of variability in metabolite measurements and implications. Cancer Epidemiol. Biomark. Prev. 2013, 22, 631–640. [Google Scholar] [CrossRef]
- Yu, B.; Zanetti, A.K.; Temprosa, M.; Albanes, D.; Appel, N.; Barrera, C.B.; Ben-Shlomo, Y.; Boerwinkle, E.; Casas, J.P.; Clish, C.; et al. The Consortium of Metabolomics Studies (COMETS): Metabolomics in 47 Prospective Cohort Studies. Am. J. Epidemiol. 2019, 188, 991–1012. [Google Scholar] [CrossRef]
- Calle, E.E.; Rodriguez, C.; Jacobs, E.J.; Almon, M.L.; Chao, A.; McCullough, M.L.; Feigelson, H.S.; Thun, M.J. The American Cancer Society Cancer Prevention Study II Nutrition Cohort: Rationale, study design, and baseline characteristics. Cancer 2002, 94, 500–511. [Google Scholar] [CrossRef]
- Evans, A.M.; DeHaven, C.D.; Barrett, T.; Mitchell, M.; Milgram, E. Integrated, nontargeted ultrahigh performance liquid chromatography/electrospray ionization tandem mass spectrometry platform for the identification and relative quantification of the small-molecule complement of biological systems. Anal. Chem. 2009, 81, 6656–6667. [Google Scholar] [CrossRef] [PubMed]
- Evans, A.M.B.B.; Liu, Q.; Mitchell, M.W.; Robinson, R.J.; Dai, H.; Stewart, S.J.; DeHaven, C.D.; Miller, L.A.D. High Resolution Mass Spectrometry Improves Data Quantity and Quality as Compared to Unit Mass Resolution Mass Spectrometry in High-Throughput Profiling Metabolomics. Metabolomics 2014, 4, 132. [Google Scholar]
- Benjamini, Y.; Hochberg, Y. Controlling the False Discovery Rate: A Practical and Powerful Approach to Multiple Testing. J. R. Stat. Soc. 1995, 57, 289–300. [Google Scholar] [CrossRef]
- Ganna, A.; Lee, D.; Ingelsson, E.; Pawitan, Y. Rediscovery rate estimation for assessing the validation of significant findings in high-throughput studies. Brief Bioinform. 2014, 16, 563–575. [Google Scholar] [CrossRef] [PubMed]


| Cases (n = 782) | Controls (n = 782) | p‡ | |
|---|---|---|---|
| Age (mean yrs ± SD) | 68 ± 6 | 68 ± 6 | Matched |
| Body Mass Index (kg/m2) | 0.21 | ||
| <25 | 399 (51%) | 426 (55%) | |
| 25–29.9 | 246 (32%) | 244 (31%) | |
| 30+ | 132 (17%) | 109 (14%) | |
| Race/ethnicity | Matched | ||
| Non-Hispanic white | 764 (98%) | 768 (98%) | |
| Other | 18 (2%) | 14 (2%) | |
| Smoking status | <0.0001 | ||
| Never | 384 (49%) | 462 (59%) | |
| Former | 363 (46%) | 281 (36%) | |
| Current | 25 (3%) | 33 (4%) | |
| Alcohol intake | 0.005 | ||
| Non-drinker | 254 (33%) | 299 (38%) | |
| Current drinker | 513 (66%) | 449 (57%) | |
| History of diabetes | 0.41 | ||
| No | 715 (91%) | 722 (92%) | |
| Yes | 42 (5%) | 35 (5%) | |
| Menopausal hormone therapy use | 0.06 | ||
| Never | 164 (21%) | 192 (25%) | |
| Former | 155 (20%) | 170 (22%) | |
| Current | 454 (58%) | 406 (52%) | |
| Age at menarche (years) | 0.61 | ||
| ≤11 | 29 (4%) | 23 (3%) | |
| 12–13 | 545 (70%) | 542 (69%) | |
| 14+ | 196 (25%) | 207 (27%) | |
| Type of menopause, age at menopause (years) | 0.04 | ||
| Natural and <45 | 28 (4%) | 40 (5%) | |
| Natural and 45–49 | 91 (12%) | 111 (14%) | |
| Natural and 50–54 | 311 (40%) | 268 (34%) | |
| Natural 55+ | 85 (11%) | 73 (9%) | |
| Oophorectomy or surgery | 226 (29%) | 255 (33%) | |
| Drugs/treatment induced | 0 (0%) | 0 (0%) | |
| Age at first live birth (years), number of live births | 0.03 | ||
| Nulliparous | 80 (10%) | 63 (8%) | |
| <20 and 1+ children | 37 (5%) | 58 (7%) | |
| 20–29 and 1–2 children | 193 (25%) | 183 (23%) | |
| 20–29 and 3+ children | 382 (49%) | 409 (52%) | |
| 30+ and 1+ children | 86 (11%) | 66 (8%) | |
| History of benign breast disease | 0.30 | ||
| No | 528 (68%) | 545 (70%) | |
| Yes | 250 (32%) | 230 (30%) | |
| Family history of breast cancer | 0.11 | ||
| No | 554 (71%) | 573 (73%) | |
| Yes | 175 (22%) | 148 (19%) | |
| Moderate-vigorous intensity physical activity (hours/week) | 0.55 | ||
| None/week | 398 (51%) | 386 (49%) | |
| <1 h/week | 104 (13%) | 111 (14%) | |
| 1 h/week | 78 (10%) | 66 (8%) | |
| 2–3 h/week | 129 (17%) | 150 (19%) | |
| 4+ h/week | 68 (9%) | 66 (8%) | |
| Metabolite | Age-Adjusted OR (95% CI) | Multivariate 2 OR (95% CI) | Difference in OR, % |
|---|---|---|---|
| X-24293 | 1.75 (1.29–2.36) | 1.58 (1.13–2.22) | −9.7% |
| Cysteine | 1.74 (1.25–2.42) | 1.74 (1.21–2.52) | 0.0% |
| 1-palmitoyl-2-palmitoleoyl-GPC 1 | 1.62 (1.24–2.13) | 1.58 (1.16–2.16) | −2.5% |
| 2-palmitoleoyl-GPC (16:1) | 1.60 (1.17–2.20) | 1.52 (1.08–2.12) | −5.0% |
| 1-palmitoyl-2-oleoyl-GPC (16:0) 1 | 1.56 (1.19–2.03) | 1.52 (1.13–2.05) | −2.6% |
| Androstenediol (3beta,17beta) mon 1 | 1.55 (1.21–1.99) | 1.45 (1.10–1.93) | −6.5% |
| Androsteroid monosulfate (1) | 1.54 (1.18–2.02) | 1.50 (1.11–2.03) | −2.6% |
| Androstenediol (3beta,17beta) dis 1 | 1.46 (1.13–1.88) | 1.36 (1.02–1.81) | −6.9% |
| 16alpha-hydroxy DHEA 3-sulfate | 1.45 (1.13–1.85) | 1.46 (1.11–1.93) | 0.7% |
| Oxalate (ethanedioate) | 0.69 (0.55–0.87) | 0.66 (0.51–0.86) | −4.4% |
| 3-hydroxybutyrylcarnitine (2) | 0.69 (0.54–0.87) | 0.73 (0.56–0.95) | 5.8% |
| X-13729 | 0.69 (0.53–0.88) | 0.72 (0.55–0.95) | 4.4% |
| 1-(1-enyl-oleoyl)-GPE (P-18:1) | 0.67 (0.52–0.86) | 0.69 (0.51–0.92) | 3.0% |
| Threonate | 0.65 (0.50–0.84) | 0.61 (0.46–0.81) | −6.2% |
| 1-(1-enyl-palmitoyl)-2-linoleoy 1 | 0.65 (0.50–0.84) | 0.60 (0.45–0.81) | −7.7% |
| X-21319 | 0.64 (0.49–0.83) | 0.64 (0.48–0.86) | 0.0% |
| Linolenoylcarnitine (C18:3) | 0.64 (0.49–0.83) | 0.68 (0.51–0.91) | 6.3% |
| 1-(1-enyl-stearoyl)-GPE (P-18:0) | 0.64 (0.50–0.83) | 0.69 (0.51–0.92) | 7.8% |
| Linoleoylcarnitine (C18:2) | 0.64 (0.50–0.83) | 0.67 (0.50–0.90) | 4.7% |
| X-11478 | 0.63 (0.49–0.83) | 0.61 (0.46–0.82) | −3.2% |
| X-16944 | 0.60 (0.46–0.77) | 0.58 (0.44–0.76) | −3.3% |
| X-18921 | 0.60 (0.46–0.79) | 0.58 (0.43–0.77) | −3.3% |
| 4-allylphenol sulfate | 0.58 (0.45–0.75) | 0.60 (0.45–0.80) | 3.5% |
| 3,4-methyleneheptanoylcarnitine | 0.58 (0.43–0.79) | 0.58 (0.42–0.81) | 0.0% |
Publisher’s Note: MDPI stays neutral with regard to jurisdictional claims in published maps and institutional affiliations. |
© 2021 by the authors. Licensee MDPI, Basel, Switzerland. This article is an open access article distributed under the terms and conditions of the Creative Commons Attribution (CC BY) license (http://creativecommons.org/licenses/by/4.0/).
Share and Cite
Moore, S.C.; Mazzilli, K.M.; Sampson, J.N.; Matthews, C.E.; Carter, B.D.; Playdon, M.C.; Wang, Y.; Stevens, V.L. A Metabolomics Analysis of Postmenopausal Breast Cancer Risk in the Cancer Prevention Study II. Metabolites 2021, 11, 95. https://doi.org/10.3390/metabo11020095
Moore SC, Mazzilli KM, Sampson JN, Matthews CE, Carter BD, Playdon MC, Wang Y, Stevens VL. A Metabolomics Analysis of Postmenopausal Breast Cancer Risk in the Cancer Prevention Study II. Metabolites. 2021; 11(2):95. https://doi.org/10.3390/metabo11020095
Chicago/Turabian StyleMoore, Steven C., Kaitlyn M. Mazzilli, Joshua N. Sampson, Charles E. Matthews, Brian D. Carter, Mary C. Playdon, Ying Wang, and Victoria L. Stevens. 2021. "A Metabolomics Analysis of Postmenopausal Breast Cancer Risk in the Cancer Prevention Study II" Metabolites 11, no. 2: 95. https://doi.org/10.3390/metabo11020095
APA StyleMoore, S. C., Mazzilli, K. M., Sampson, J. N., Matthews, C. E., Carter, B. D., Playdon, M. C., Wang, Y., & Stevens, V. L. (2021). A Metabolomics Analysis of Postmenopausal Breast Cancer Risk in the Cancer Prevention Study II. Metabolites, 11(2), 95. https://doi.org/10.3390/metabo11020095